Monitoring the reduction of UO3 thin film by hydrogen atoms using valence-level spectroscopy: correlating the U5f1 signal to surface hydroxyls
 G. El Jamal
 T. Gouder
 R. Eloirdi2
  H. Idriss
- 1Department of Chemistry, Applied Physical Chemistry, School of Engineering Sciences in Chemistry, Biotechnology and Health (CBH), KTH Royal Institute of Technology, Stockholm, Sweden
- 2European Commission, Joint Research Centre, Karlsruhe, Germany
- 3Institute of Functional Interfaces (IFG), Karlsruhe Institute of Technology (KIT), Karlsruhe, Germany
The reaction of a UO3 thin film with atomic hydrogen was studied by He(II) ultraviolet photoelectron spectroscopy (UPS) in the temperature range 190–300 K. UO3 reduction was instantaneously observed once it contacted H atoms at 10–7 torr. The reduction was manifested by the presence of U5f1 electrons in He(II) UPS at approximately 1.5 eV below the Fermi level. Based on the peak characteristics, the valence band shape (composed largely of O2p orbitals in addition to some contribution from U6d and U5f orbitals), and X-ray photoelectron spectroscopy (XPS) U4f lines, the reduction of U6+ in UO3 only results in the formation of U5+ cations and was largely limited to those on the surface. Associated with the reduction was the formation of surface hydroxyls (-OH species) due to the transfer of a proton of the H atom (H.) to surface oxygen ions, while the electron of H. is transferred to a U5f orbital. The pseudo-first-order rate constant of the initial rate of reduction at 10–7 torr and 190 K was found to be approximately 0.01 s–1. Qualitative analysis of the valence band before and after reduction indicates that O2p hybridization with U6d and U5f orbitals leads to well-distinguished features that are characteristic of UO3, U2O5, and UO2. These features, which were quantitatively reversed during the redox process, furthers the assessment of the stoichiometry of a given binary uranium oxide.
Introduction
The study of the oxidation and reduction of uranium oxide surfaces is of fundamental and technological importance. Our knowledge of the redox properties of the surface of actinide oxides considerably lags behind that of early transition metal oxides (Cossard et al., 2021). This is in part due to the lack of model surface—of the uranium oxides series, only bulk UO2 single crystals are available (Idriss, 2010), although epitaxy of UO2, α-U3O8, and α-UO3 on oxides can be made (Mudiyanselage et al., 2019; Enriquez et al., 2020)—and due in part to the complexity of the system of one of the richest known oxides (Cotton and Wilkinson, 1988). For example, UO3 has seven known polymorphs and a pure U5+ cation oxide system, while U2O5, has only recently been identified (Gouder et al., 2018).
On the technological aspect, the oxidation of the surface of UO2 to UO3 or other mixed oxides containing U6+ is particularly important because the latter is soluble in water and is therefore of environmental concern for geological repositories of spent nuclear fuel (Valsami-Jones and Ragnarsdöttir, 1997). Moreover, because of continued radioactivity, molecular and atomic hydrogens are produced by the radiolysis of groundwater and may interact with the surface, potentially leading to the reduction of the oxidized species back to U4+ or U5+ cations. This would counteract the radiation-driven oxidative dissolution of the UO2 fuel matrix.
The ease of oxidation and reduction of uranium oxides—partly due to its relativistic effect and the fact that the 5f orbitals partly contribute into the valence band (Su et al., 2016)—makes it a reactive oxide for redox catalytic (or surface) reactions. Indeed, it was found that U3O8 has high activity for water–gas shift reaction (Dong et al., 2015), that uranium antimonate catalysts also have high activity for the ammoxidation of propylene to acrylonitrile (Foster et al., 2020), that uranium oxide solid solution with cerium oxide shows potential for thermochemical water splitting (Al-Shankiti et al., 2013; Scaranto and Idriss, 2015), and that β-UO3 drives the oxidative coupling of acetylene (Madhavaram and Idriss, 2002) to furan and aldol condensation of acetaldehyde (Madhavaram and Idriss, 2004).
There is another reason to study the reduction of UO3 by UPS. Recently, we have observed its reduction under the UV photons of He(II) light (40.8 eV) when ice is formed on top (El Jamal et al., 2023). The reduction was manifested by the presence of electrons in the U5f band at ≈ 1.5 eV below the Fermi level (EF). Associated with this reduction was the presence of surface hydroxyls (3σ) at ≈ 10.8 eV below EF and a change in the O2p band shape due to a change in hybridization with U5f orbitals. While this can be studied computationally, the shape and binding energy position of the O2p/U5f/U6d band changes significantly with the Ueff value (mostly the Hubbart parameter) used in density functional theory (DFT) + U studies (Singh et al., 2018) and by the degree of Hartree Fock (HF) mixing with DFT for the hybrid methods (Prodan et al., 2007; Roy et al., 2008). Both methods may therefore benefit from the detailed valence study of uranium oxides.
Methodology
UO2+x (x < ca. 0.1) thin film was synthesized by reactive direct-current (DC) sputtering from a uranium target; the sputter gases used were Ar and O2. The UO2 film was deposited on a gold foil (99.99% purity) that had been cleaned by Ar ion sputtering, then annealed to 200°C for 10 min. The plasma in the diode source was maintained by injecting 25–50 eV energy electrons; the O2 pressure was 2 × 10⁻⁶, and the Ar pressure was 10–3 torr. After film formation and to produce stoichiometric UO2.0, the initial film was exposed to atomic hydrogen produced by an electron cyclotron resonance (ECR) plasma source at 400°C for 10 min. This eliminated surplus oxygen, leaving UO2.0. The UO3 film was prepared by exposing the UO2 films to atomic O under the same conditions (ECR exposure at 400°C for 10 min). More details on the characterization of the films can be found in El Jamal et al. (2021); the procedure is described in detail in Gouder et al. (2018) and shown in Scheme 1. The content and purity of the films were determined by XPS. The positions of the U4f main lines, their FWHM, and the characteristic satellite peaks are a direct probe of the oxidation states of the films (Al-Salik et al., 2014).
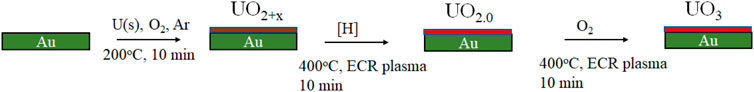
SCHEME 1. Description of the preparation method of UO2 and UO3 thin films.
Thin film deposition, plasma treatment, gas exposures, and data acquisition were carried out in situ, and all chambers (growth and spectroscopy) were interconnected. The background pressure was lower than 3 × 10⁻⁷ Pa. Low temperatures were reached by cooling the copper sample holder with liquid nitrogen.
The ion-free H2 gas beam was produced by a H atom beam source (HABS), which is a thermal gas cracker. It was heated by an e-beam, which has the advantage of avoiding ion-induced damage to the substrate. The operational parameters are the flow rate of H2 and the heating power which controls the intensity of the source. The narrow beam of the HABS allows high atomic H flux rates at the sample position while keeping the H2 background pressure of the chamber lower than the plasma sources. The adsorption was made at low temperature (typically lower or approximately 200 K).
UPS spectra were taken with He(II) (40.81 eV) UV light which was produced by a high-intensity windowless discharge lamp. XPS spectra were recorded using monochromatized Al Kα (1,486.6 eV) radiation produced by a SPECS μ-focus source.
Results and discussion
Figures 1A, B present the XPS and UPS of relevant uranium oxides thin films prepared as references. These were presented in El Jamal et al. (2023) and given here to highlight the main differences in the oxidation states of uranium cations. The known oxidation states of U cations are +4, +5, and +6, and these can be distinguished by their binding energy, their shapes (such as their full-width half maximum—FWHM), and by the presence of their satellites. Here, U4+ cations have a U4f7/2 line at 380.3 eV and U4f5/2 line at 391.1 eV; associated with both are their shake-up satellites at a binding energy of approximately 6.9 eV above each line (denoted S1 and S1*). The binding energy values are with a margin of ±0.2 eV, depending on the purity of the samples (the unavoidable presence of surface hydroxyls) that may slightly shift the Fermi level energy. No attempt was made to further calibrate it; the film thickness is in the order of 20 nm and is conductive. U6+ cations have a U4f7/2 line at approximately 381 eV and a U4f5/2 line at 392 eV binding energies. They are sharper than those of U4+ cations (narrower FWHM). These lines have two pairs of satellites (at approximately 4.0 and 9.6 eV above each line, denoted S3, S4, S3*, and S4*). More details about the binding energy positions can be found in Ilton et al. (2007) and about the satellites in Van den Berghe et al. (2000), Ilton and Bagus (2008), and Tobin and Yu (2011). For simplicity, XPS of U5+ cations of U2O5 are not presented in the figure and are discussed below. UPS He(II) spectra of UO2, U2O5, and UO3 are presented in Figure 1B. The lines provide information related to the oxidation states and degree of hybridization between the U5f and the 6d orbitals with O2p orbitals (Magnuson et al., 2006; Tobin and Yu, 2011; Kvashnina et al., 2018). The difference in hybridization is seen in the binding energy region between 4 and 8 eV and in the filling of the U5f orbitals at approximately 1.5 eV below the Fermi level. The weak signal with a binding energy of approximately 10 eV is that of surface hydroxyls. U4+ cations in UO2 are distinguished by their pronounced U5f line with a large FWHM (approximately 1.5 eV) due to the presence of two electrons in the 5f orbitals. U5+ cations have their U5f signal at the same binding energy position as that of U4+ cations but are much less pronounced with a narrower FWHM (approximately 1.0 eV). U6+ cations, having no electrons left in the 5f orbitals, do not give a signal in this region. It should be noted that the oxidation states are nominal because of changes in the degree of ionicity/covalency when the U-to-O ratios change and because of the different polymorphs. The region largely composed of O2p orbitals has distinguished differences for the three oxides and is addressed here. In UO2, the region has two observed peaks at approximately 5 and 7.5 eV, with the first more pronounced than the second. UO3 is also largely composed of two components but with an inverted relative contribution at approximately 4 and 6.5 eV. U2O5 is composed of one wide peak at approximately 5.5 eV in binding energy due to the convolution of the two structures. The degree of hybridization of O2p with U5f and 6d orbitals has been the subject of other research, and some information may be obtained upon comparison with these previous computation studies of the projected density of states (p-DOS) on the orbitals of the U and O ions (Tian et al., 2014; Ao et al., 2016). U5f and U6d orbitals were found to hybridize with O2p in this region. The degree of hybridization would therefore respond to the electron density around uranium cations. In this research, it is inversely proportional to the degree of orbitals filling. It is highest for U6+ cations in UO3, lowest in U4+ in UO2, and somewhere in the middle for the U5+ cations of U2O5. Therefore, UO2 would have a higher contribution of O2p orbitals and UO3 would have a smaller contribution. This picture, while qualitative, is important as it helps track the degree of oxidation and would be revealed as important while studying the reduction of UO3 with atomic H, as presented next.
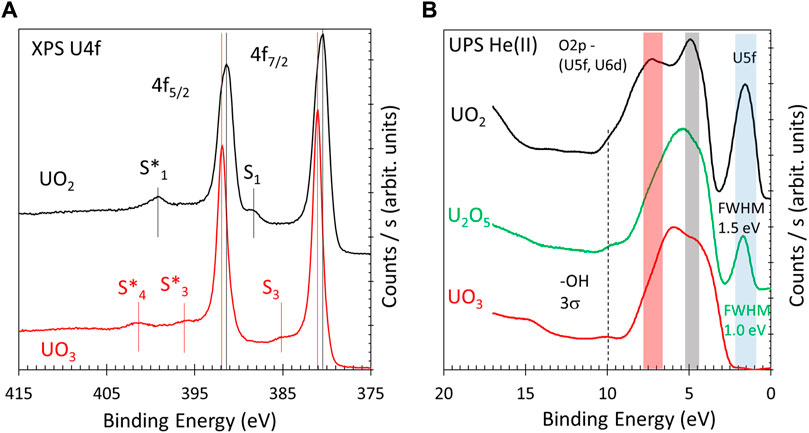
FIGURE 1. XPS U4f of as-prepared UO2 thin film and after being oxidized to UO3 (A). UO2 has a pair of satellites at 6.9 eV above the parent line denoted S1 and S1*. UO3 has two pairs of satellites at ca. 4.0 and 9.6 eV above the parent lines, denoted S3, S3*, S4, and S4* (S4 line is obscured by U4f5/2 in the figure and is therefore not labeled). UPS He(II) of UO2, U2O5, and UO3 (B). The main characteristics of the lines are highlighted and explained in the text.
Figures 2A–C present the results of the exposure of fresh UO3 to atomic H at 190 K and at the indicated exposures in Langmuir. Exposures were conducted at 10–7 torr for different durations. The fresh UO3 had some traces of reduced states as it was a different preparation from that in Figure 1. This trace signal was subtracted for the quantitative analyses presented next.
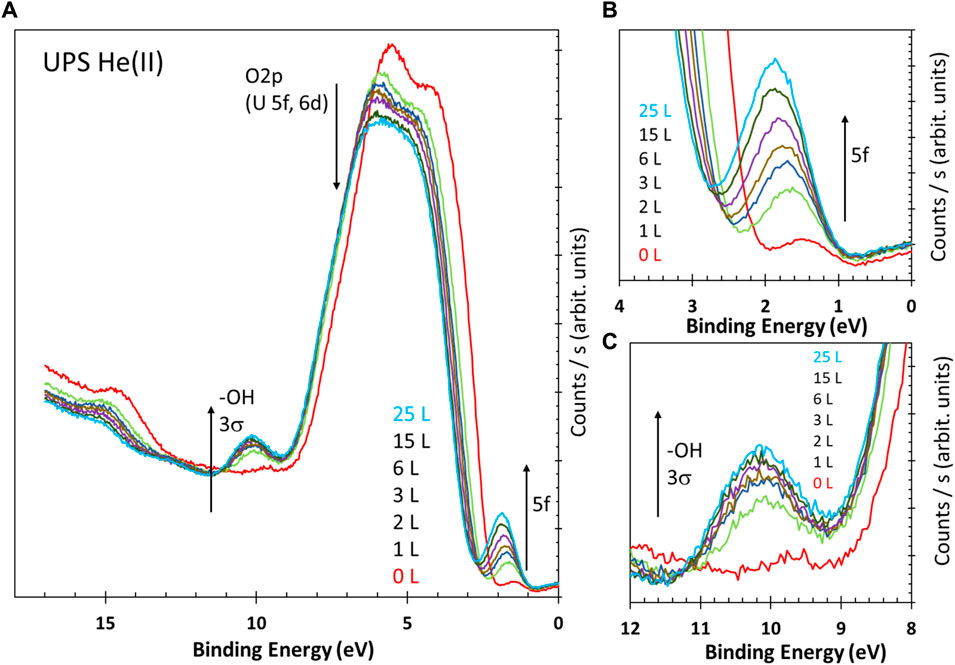
FIGURE 2. (A) He(II) UPS of UO3 before and after being dosed with atomic H at the indicated exposures in Langmuir (L) at 190 K. (B,C) Zoomed-in images of the two sections in (A) to highlight the U5f and surface hydroxyls presence upon exposure to H atoms.
Three clear changes in the spectra are seen with increased exposure to H atoms.
First, the O2p region is gradually changed and becomes similar to that of the U2O5 presented in Figure 1. Second, the reduction of UO3 is clear, as seen by the increased signal of the U5f line at approximately 1.5 eV below the Fermi level. Third, there is also an increase, associated with the increased U5f lines, in the surface hydroxyls at approximately 10 eV.
The spectra are presented as obtained with no binding energy calibration, highlighting the shift to higher binding energies with increased exposure to H atoms. This shift is attributed to bend banding at the surface due to exposure. The shift to higher binding energy indicates a change in semiconducting properties to a more pronounced n-type (electron-doping) due to the increased electron density (reduction of U6+ cations), although the presence of surface hydroxyls would certainly affect the binding energy shift, as seen on other oxides (Pacchioni and Freund, 2013; Zhang et al., 2015).
Additionally, there is a decrease in the overall O2p–U5f–U6d signal with increased reduction. This is expected because part of the O2p contribution is transformed to surface hydroxyls and part of the contribution of the 5f and 6d orbitals in the hybridization has decreased due to reduction (filling of the U5f). Denning (2007) and Neidig et al. (2013) have studied this using polarized oxygen Kα X-ray emission and absorption spectra assigned to transitions from O 1s core electrons to different molecular orbitals of Cs2UO2Cl4 Os. The participation of the 6pσ orbitals in covalent bonding is seen by the presence of a charge transfer transition in the emission. The data indicate that the 5fπ component in the U–O bond is weaker than the 5fσ component; the latter is stronger due to hybridization with the 6pσ. The data also indicate that the 6dπ interaction is stronger than the 6dσ. It is therefore inferred that changing the degree of oxidation will affect the degrees of hybridization manifested in the valence band region.
To further probe these changes, Figure 3 presents the reverse changes that occurred upon mild heating of the reduced surface. Figure 3A shows that, upon heating, all features in Figure 2A have reversed. The overall O2p (U5f and U6d) increased in intensity, the -OH and U5f contribution decreased, and the binding energy shifted back to lower values. In addition, the structure of the O2p slightly changed from that of the most reduced state to start the reverse process of oxidation. Therefore, the surface is composed of largely reduced cations and some U6+ cations. This last point is better seen in the inset of Figure 3B, where the same spectra shown in Figure 1A are given to ease the comparison. The principal point is the presence of two satellites S2 and S2* at 388.0 and 398.8 eV, not seen in UO3 nor in UO2; these are those of U5+ of U2O5 and are therefore evidence of partial reduction. The main lines are composed of two structures separated by approximately 1 eV. In the U4f7/2, these are at 380.5 and 381.5 eV and fitted in consideration of the FWHM of the U6+ (in the inset). The fitting parameters are presented in Supplementary Material Table 1.
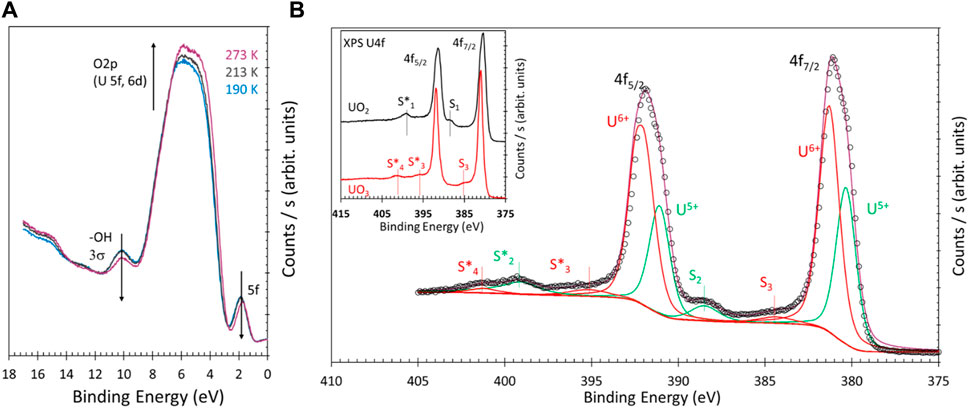
FIGURE 3. (A) He(II) UPS of the valence band of UO3 thin film that was reduced upon exposure to 25 L of atomic hydrogen at 190 K, then heated to 213 and 273 K. (B) XPS U4f of the sample in (A). The fitted two oxidation states are given in Table 1 of the Supplementary Material. S2 and S2* satellites are those of U5+, while S3, S4, and S4* are those of U6+ cations.
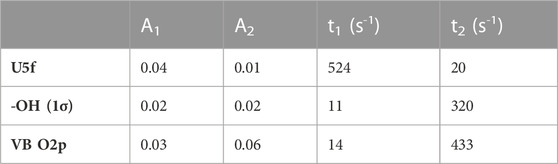
TABLE 1. Fitting parameters for the exponential functions used to simulate the data presented in Figure 4.
Quantitative analyses of the signals are presented in Figure 4, which presents the computed peak areas of the U5f, OH (3 σ), and O2p-(U6d and 5f) regions. The peak areas are presented as fractions. The trace presence of U6+ at zero exposure is subtracted. Both the U5f and OH (3 σ) signals increase with exposure and then reach saturation at high exposure (at approximately 200 L, 2000 s at 10–7 torr). Both could be fitted reasonably well with a bi-exponential function (R2 > 0.98). There is, however, a difference between the U5f and -OH profiles: the OH signal saturates faster than that of the U5f. This may be due to errors in computing the peak areas, particularly because the OH (3 σ) signal is at the edge of the large valence band peak. There might, however, be a distinction between the reduction of U6+ cations and surface hydroxyls. The former may occur in deeper layers while the latter would be restricted to the surface and therefore saturate first. The kinetic parameters extracted are given in Table 1 (the peak areas were computed without further correction). As indicated above, the inverted time constants between the appearance of the U5f and OH signals are intriguing and might be linked to surface (in the case of -OH groups) versus surface and near-surface (in the case of the U5f). This is because electrons can migrate to deeper layers while protons cannot.
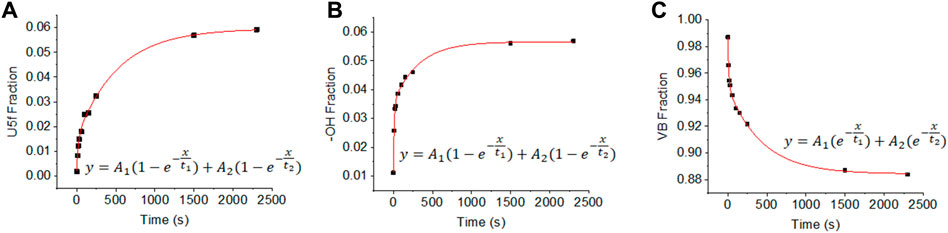
FIGURE 4. Fractions of U5f (A), OH(1s) (B), and largely O2p (C) as a function of time during the exposure to H atoms at 10–7 torr. Computed errors of the data point presented are of the order 5% of (C) and 10% for (A) and (B); this is largely due to base line subtraction (see examples in SupplementaryFigures S1, S2).
The reduction of U6+ cations by H atoms of UO3 is presented by Equation 1:
where l stands for lattice, g for gas, and s for surface.
The interaction of a H atom with the surface of UO3 occurs via a redox-type mechanism. The surface is composed of two centers: the U6+ cations and the O2- anions. An incoming H atom is repelled by an O2- center due to Pauli electrostatic repulsion and the fact that an O2, with eight electrons (2s2 and 2p6) in the outer shell, cannot accommodate an additional electron; it therefore interacts with a low electron density center (U6+). This results in the transfer of an electron to one of the 5f-orbitals of U6+, while the remaining proton interacts with a lone pair of the O2p orbital of surface oxygen. The reaction will be concerted where both events occur simultaneously because the formation of a U-H bond is not possible from U6+ and one H atom (one electron is missing). The end-product is a pair U5+–OH(s), as tracked by He(II) UPS (Figures 2, 3).
The exponential dependence of the rise of the U5+ cations may be explained by a simple kinetic reaction:
where t is time at a pressure of 10–7 torr and a and b are the reaction orders. Considering that [H.] is largely excess compared to the UO3 thin film, b equates to 0. We did not monitor the concentration of [U6+] due to the absence of the U5f UPS signal, but we monitored the formation of [U5+] cations. We assume that the total amount of reactive U6+ cations on the surface (and near-surface) has been reduced with H atoms, since these reached saturation with an increasing exposure time above ca. 250 s (at 10–7 torr); other measurements were conducted up to 1,230 s, with a negligible increase seen. Therefore, the concentration of [U6+]t at time t approximates to
of [U6+]0 at time zero approximates to [U5+]final.
For a = 1, and upon integration, a plot of Ln ([U6+]t/[U6+]0) as a function of t should give a straight line with the rate-constant k as the slope.
Figure 5 shows the expected initial linearity, indicating that the reaction is indeed directly proportional to available U6+ cations while, after prolonged reaction time, deviations are seen due to considerable consumption of the reactive sites. The extracted initial pseudo-first-order rate constant is found to be ca. 10–2 s-1. It is worth noting that the rate constant has in it the amount of matter (so it is actually k = k’*Wc/Ac), where Wc is the catalyst weight and Ac is the investigated surface area by He(II) UPS. It also indicates that, at the conditions under investigation, the reaction of H atoms with U5+ does not lead to further reduction.
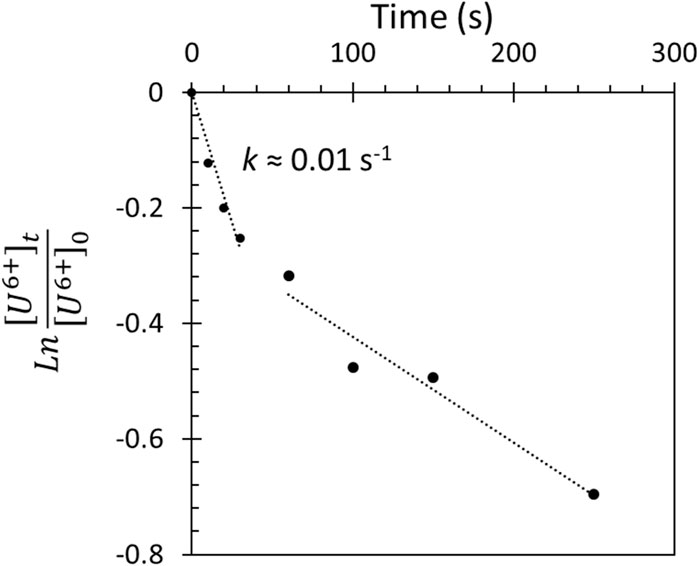
FIGURE 5. Plot of the change in the concentration of U6+ cations with reaction time upon exposure of UO3 to H atoms at 10–7 torr and 190 K; see Eqs 2–4 for more details regarding quantification of U cations.
These results might be relevant for understanding the redox properties of uranium oxides. For example, one may consider that, while the surface of UO2 would eventually be oxidized to UO3 (as seen by Donald et al. (2017)) in an oxidizing environment or to U3O8 when water vapor is present (Senanayake et al., 2005), the formation of H atoms due to radiolitic reactions would further react and partly revert the process. Our present work is, however, qualitative. To extract more meaningful rate constants that may help provide a kinetic model, other parameters should be considered, particularly the amount of matter, the effect of pressure, and the surface area.
Conclusion
The reaction of hydrogen atoms with UO3 thin film resulted in the reduction of U6+ to U5+ cations based on the 5f1 of He(II) UPS line shape and on the U4f XPS binding energy position and satellites. Associated with the appearance of the U5+ are surface hydroxyls (O3σ at approximately 10 eV (He(II) UPS)). Both saturate by approximately 150 L exposure at 190 K (10–7 torr). The shape of the valence band shows distinct changes between pure UO3 and that which is partially reduced, which was similar to that of U2O5. The changes in the valence band shape are due to changes in the degree of hybridization between the O2p and U6d and U5f orbitals. The initial pseudo-first-order rate constant at 190 K was found to be approximately 0.01 s-1. The results show a fast reduction of U6+ to U5+ with no evidence of further reduction to U4+ cations.
Data availability statement
The raw data supporting the conclusion of this article will be made available by the authors, without undue reservation.
Author contributions
GE: formal analysis, writing–review and editing, investigation, and methodology. TG: formal analysis, investigation, methodology, project administration, supervision, and writing–review and editing. RE: project administration, supervision, and writing–review and editing. MJ: conceptualization, project administration, supervision, and writing–review and editing. HI: formal analysis, writing–original draft, writing–review and editing, and methodology.
Funding
The author(s) declare that no financial support was received for the research, authorship, and/or publication of this article.
Acknowledgments
The authors thank Frank Huber for his technical assistance throughout the study.
Conflict of interest
The authors declare that the research was conducted in the absence of any commercial or financial relationships that could be construed as a potential conflict of interest.
Publisher’s note
All claims expressed in this article are solely those of the authors and do not necessarily represent those of their affiliated organizations, or those of the publisher, the editors, and the reviewers. Any product that may be evaluated in this article or claim that may be made by its manufacturer is not guaranteed or endorsed by the publisher.
Supplementary material
The Supplementary Material for this article can be found online at: https://www.frontiersin.org/articles/10.3389/ffuel.2023.1303890/full#supplementary-material
References
Al-Salik, Y., Al-Shankiti, I., and Idriss, H. (2014). Core level spectroscopy of oxidized and reduced CexU1−xO2 materials. J. Electron Spectrosc. Relat. Phenom. 194, 66–73. doi:10.1016/j.elspec.2013.11.013
Al-Shankiti, I., Al-Otaibi, F. M., Al-Salik, Y., and Idriss, H. (2013). Solar thermal hydrogen production over CeO2 based materials. Top. Catal. 56, 1129–1138. doi:10.1007/s11244-013-0079-1
Ao, B., Qiu, R., Lu, H., and Chen, P. (2016). Differences in the existence states of hydrogen in UO2 and PuO2 from DFT + U calculations. J. Phys. Chem. C 120, 18445–18451. doi:10.1021/acs.jpcc.6b05621
Cossard, A., Desmarais, J. K., Casassa, S., Gatti, C., and Erba, A. (2021). Charge density analysis of actinide compounds from the quantum theory of atoms in molecules and crystals. J. Phys. Chem. Lett. 12, 1862–1868. doi:10.1021/acs.jpclett.1c00100
Cotton, F. A., and Wilkinson, G. (1988). Advanced inorganic Chemistry. New Delhi, India: John Wiley and Sons.
Denning, R. G. (2007). Electronic structure and bonding in actinyl ions and their analogs. J. Phys. Chem. A 111, 4125–4143. doi:10.1021/jp071061n
Donald, S. B., Davisson, L., Dai, Z., Roberts, S. K., and Nelson, A. J. (2017). Relative impact of H2O and O2 in the oxidation of UO2 powders from 50 to 300 oC. J. Nucl. Mater. 496, 353–361. doi:10.1016/j.jnucmat.2017.10.014
Dong, Y.-Y., Liao, W.-P., and Suo, Z.-H. (2015). Uranium oxide-supported gold catalyst for water–gas shift reaction. Fuel Process. Technol. 137, 164–169. doi:10.1016/j.fuproc.2015.04.018
El Jamal, G., Gouder, T., Eloirdi, R., Idriss, H., and Jonsson, M. (2023). UV photoelectron spectroscopic study of UO2, U2O5 and UO3 exposed to H2O under ultra high vacuum conditions. Estimating the radical character of surface bound hydroxyl groups. J. Phys. Chem. C 127 (29), 14222–14231. doi:10.1021/acs.jpcc.3c02795
El Jamal, G., Gouder, T., Eloirdi, R., Tereshina-Chitrova, E., Horákd, L., and Jonsson, M. (2021). Mixed H2O/H2 plasma-induced redox reactions of thin uranium oxide films under UHV conditions. Dalton Trans. 50, 12583–12591. doi:10.1039/d1dt01020d
Enriquez, E., Wang, G., Sharma, Y., Sarpkaya, I., Wang, Q., Chen, D., et al. (2020). Structural and optical properties of phase-pure UO2, α-U3O8, and α-UO3 epitaxial thin films grown by pulsed laser deposition. ACS Appl. Mater. Interfaces 12, 35232–35241. doi:10.1021/acsami.0c08635
Foster, R. I., Oh, M., Lee, K., and Kim, K. W. (2020). Pilot-scale treatment of a spent uranium catalyst formally used in the SOHIO process: pilot plant verification of the SENSEI process. ACS Omega 5, 10939–10947. doi:10.1021/acsomega.0c00723
Gouder, T., Eloirdi, R., and Caciuffo, R. (2018). Direct observation of pure pentavalent uranium in U2O5 thin films by high resolution photoemission spectroscopy. Sci. Rep. 8 (1-7), 8306. doi:10.1038/s41598-018-26594-z
Idriss, H. (2010). Surface reactions of uranium oxide powder, thin films and single crystals. Surf. Sci. Rep. 65, 67–109. doi:10.1016/j.surfrep.2010.01.001
Ilton, E. S., and Bagus, P. S. (2008). Ligand field effects on the multiplet structure of the U4f XPS of UO2. Surf. Sci. 602, 1114–1121. doi:10.1016/j.susc.2008.01.010
Ilton, E. S., Boily, J.-F., and Bagus, P. S. (2007). Beam induced reduction of U(VI) during X-ray photoelectron spectroscopy: the utility of the U4f satellite structure for identifying uranium oxidation states in mixed valence uranium oxides. Surf. Sci. 601, 908–916. doi:10.1016/j.susc.2006.11.067
Kvashnina, K. O., Kowalski, P. M., Butorin, S. M., Leinders, G., Pakarinen, J., Bès, R., et al. (2018). Trends in the valence band electronic structures of mixed uranium oxides. Chem. Commun. 54, 9757–9760. doi:10.1039/c8cc05464a
Madhavaram, H., and Idriss, H. (2002). Carbon efficiency and the surface Chemistry of the actinides. Direct formation of furan from acetylene over β-UO3. J. Catal. 206, 155–158. doi:10.1006/jcat.2001.3483
Madhavaram, H., and Idriss, H. (2004). Acetaldehyde reactions over the uranium oxide system. J. Catal. 224, 358–369. doi:10.1016/j.jcat.2004.03.018
Magnuson, M., Butorin, S. M., Werme, L., Nordgren, J., Ivanov, K. E., Guo, J.-H., et al. (2006). Uranium oxides investigated by X-ray absorption and emission spectroscopies. Appl. Surf. Sci. 252, 5615–5618. doi:10.1016/j.apsusc.2005.12.131
Mudiyanselage, K., Burrell, A., Senanayake, S., and Idriss, H. (2019). XPS and NEXAFS study of the reactions of acetic acid and acetaldehyde over UO2(100) thin film. Surf. Sci. 680, 107–112. doi:10.1016/j.susc.2018.10.017
Neidig, M. L., Clark, D. L., and Martin, R. L. (2013). Covalency in f-element complexes. Coord. Chem. Rev. 257, 394–406. doi:10.1016/j.ccr.2012.04.029
Pacchioni, G., and Freund, H. (2013). Electron transfer at oxide surfaces. The MgO paradigm: from defects to ultrathin films. Chem. Rev. 113, 4035–4072. doi:10.1021/cr3002017
Prodan, I. D., Scuseria, G. E., and Martin, R. L. (2007). Covalency in the actinide dioxides: systematic study of the electronic properties using screened hybrid density functional theory. Phys. Rev. B 76, 033101. doi:10.1103/physrevb.76.033101
Roy, L. E., Durakiewicz, T., Martin, R. L., Peralta, J. E., Scuseria, G. E., Olson, C. G., et al. (2008). Dispersion in the mott insulator UO2: a comparison of photoemission spectroscopy and screened hybrid density functional theory. J. Comput. Chem. 29, 2288–2294. doi:10.1002/jcc.21036
Scaranto, J., and Idriss, H. (2015). The effect of uranium cations on the redox properties of CeO2 within the context of hydrogen production from water. Top. Catal. 58, 143–148. doi:10.1007/s11244-014-0353-x
Senanayake, S. D., Rousseau, R., Colegrave, D., and Idriss, H. (2005). The Reaction of water on polycrystallineUO2: pathways to surface and bulk oxidation. J. Nucl. Mater. 342, 179–187. doi:10.1016/j.jnucmat.2005.04.060
Singh, S., Gupta, S. K., Sonvane, Y., Nekrasov, K. A., Kupryazhkin, A. Y., and Gajjar, P. N. (2018). Ab-initio calculation on electronic and optical properties of ThO2, UO2 and PuO2. J. Nucl. Mater. 511, 128–133. doi:10.1016/j.jnucmat.2018.08.055
Su, J., Li, W. L., Lopez, G. V., Jian, T., Cao, G.-J., Li, W.-L., et al. (2016). Probing the electronic structure and chemical bonding of mono-uranium oxides with different oxidation states: UOx− and UOx (x = 3−5). J. Phys. Chem. A 120, 1084–1096. doi:10.1021/acs.jpca.5b11354
Tian, X.-F., Wang, H., Xiao, H.-X., and Gao, T. (2014). Adsorption of water on UO2 (111) surface: density functional theory calculations. Comput. Mater. Sci. 91, 364–371. doi:10.1016/j.commatsci.2014.05.009
Tobin, J. G., and Yu, S.-W. (2011). Orbital specificity in the unoccupied states of UO2 from resonant inverse photoelectron spectroscopy. Phys. Rev. Lett. 107 (1-3), 167406. doi:10.1103/physrevlett.107.167406
Valsami-Jones, E., and Ragnarsdöttir, K. Y. (1997). Solubility of uranium oxide and calcium uranate in water, and Ca(OH)2-bearing solutions. Radiochim. Acta 79, 249–258. doi:10.1524/ract.1997.79.4.249
Van den Berghe, S., Laval, J.-P., Gaudreau, B., Terryn, H., and Verwerft, M. (2000). XPS investigations on cesium uranates: mixed valency behaviour of uranium. J. Nucl. Mater. 277, 28–36. doi:10.1016/s0022-3115(99)00146-4
Keywords: U6+ reduction, ultraviolet photoelectron spectroscopy He(II), uranium 5f, U2O5, UO3
Citation: El Jamal G, Gouder T, Eloirdi R, Jonsson M and Idriss H (2023) Monitoring the reduction of UO3 thin film by hydrogen atoms using valence-level spectroscopy: correlating the U5f1 signal to surface hydroxyls. Front. Fuels. 1:1303890. doi: 10.3389/ffuel.2023.1303890
Received: 28 September 2023; Accepted: 21 November 2023;
Published: 08 December 2023.
Edited by:
Onder Altuntas, Eskisehir Technical University, TürkiyeReviewed by:
Paul S. Bagus, University of North Texas, United StatesTiffany Kaspar, Pacific Northwest National Laboratory (DOE), United States
Copyright © 2023 El Jamal, Gouder, Eloirdi, Jonsson and Idriss. This is an open-access article distributed under the terms of the Creative Commons Attribution License (CC BY). The use, distribution or reproduction in other forums is permitted, provided the original author(s) and the copyright owner(s) are credited and that the original publication in this journal is cited, in accordance with accepted academic practice. No use, distribution or reproduction is permitted which does not comply with these terms.
*Correspondence: T. Gouder, Thomas.GOUDER@ec.europa.eu; H. Idriss, hicham.idriss@kit.edu