Performance Evaluation of Different ToS Using Heterogeneous Communication Interfaces in FANETs
 Laura Michaella B. Ribeiro1,2*
  Ivan Müller
 Leandro Buss Becker
- 1Federal Institute of Amazonas, Campus Manaus-Distrito Industrial, Manaus, Brazil
- 2Department of Automation and Systems (DAS), Federal University of Santa Catarina (UFSC), Florianópolis, Brazil
- 3Department of Electrical Engineering (DELET), Federal University of Rio Grande Do Sul (UFRGS), Porto Alegre, Brazil
The use of different types-of-services (ToS), such as voice, data, and video, has become increasingly present in the execution of applications involving networks composed of multiple UAVs. These applications usually require the UAVs to share different ToS in a dynamic and ad-hoc manner, such that they can support the execution of cooperative/collaborative tasks. The use of heterogeneous communication has showed gains in maintaining the connection among highly mobile nodes, while increasing the reliable transmission of data, as is necessary in MANETS, VANETs and, more recently, FANETs. The aim of this paper is to present a performance evaluation of a heterogeneous interface manager (IM), which applies a heuristic to choose the best among several single- and multi-band wireless communication interfaces, including IEEE 802.11n, IEEE 802.11p, IEEE 802.11ac, and IEEE 802.11ax. Simulated scenarios with three, five, and eight UAV nodes are developed by integrating NS-3 and Gazebo simulation tools. The IM performance is analyzed by applying different numbers of interfaces and comparing with interfaces applied homogeneously by defining two set of results, in terms of application and MAC and PHY metrics, respectively. Finally, we also evaluate the associated performance, considering voice, data, and video streaming ToS. The results indicate that the combination of different interfaces has a very powerful effect on maintaining or increasing the communication intensity.
Introduction
Multi-UAV (or mUAV) systems consist of applications that involve several UAVs operating in a collaborative manner, sharing tasks in order to achieve pre-defined goals during a mission. Wireless communication can use UAVs as source, relay, and sink nodes to expand the limits of the mobile networks, allowing for a much higher speed than a person carrying a mobile device (Park et al., 2012), and with more control over the trajectory than wireless sensor networks composed of devices spread in an array; for example, for the monitoring of volcanic eruptions (Werner-Allen et al., 2005). As an example of related applications, we mention the use of UAV networks to extend the range of communications and for facilitating collaboration or interoperability with other networks, such as VANETs (Vehicular Ad-Hoc Networks), MANETs (Mobile Ad-Hoc Networks), and IoT (Internet of Things) networks (Bekmezci et al., 2013; Park et al., 2018; Yanmaz et al., 2018).
The communications between mUAVs present features that could benefit from the employment of different wireless communication standards. According to the assigned tasks in a mission, the UAV network may need to send different kind of packets, such as video, voice, sensor data, actuator data, and coordination commands (Jawhar et al., 2017; Lee, 2021). For instance, a UAV in an SAR (Search and Rescue) mission could be used in different ways, such as for transmitting video of a drowning person to the Ground Control Station and other UAVs, while still sharing goals with others, such as delivering supplies to or carrying life buoys to the victims (Batista da Silva et al., 2017; Kim and Choi, 2017). These goals generate different network traffics, which vary in packet size, transmission rate, and bandwidth consumption.
In some cases, transmission and reception problems occur, such as the loss of many packets, prolonged delays, and throughput variance, which can cause missions to decrease in quality and, in the worst case, lead to complete mission failure (Park et al., 2018). Furthermore, communication between UAVs requires different types of packets to be sent. These packets can be short or long, depending on the payload and the kind of MAC protocol adopted. The packet size is defined by the amount of data it needs to carry, including the preamble and the header. Long packets are usually composed of data files, video, and images (e.g., when users access the Internet over a Wi-Fi network), while short packets are typically composed by traffic generated from measurement and control signals (e.g., machine-type communication) (Durisi et al., 2016).
Therefore, depending on the mUAVs application, different requirements, in terms of connectivity level, latency, and throughput, may appear. Thus, the task of applying a single wireless communication standard to support different network traffic becomes difficult/inefficient. Depending on the type of messages, if they are not properly transmitted, a bottleneck to the proper functioning of the entire system may arise (Bekmezci et al., 2015; Hussen et al., 2018).
Using different communication standards in UAV networks can be helpful in increasing the reliability of communications, while offering additional advantages, when compared to using a single standard. For instance, the selection of the best communication interface/standard should take into account the types of packets to be sent and the current state of the medium. Furthermore, the network survivability increases as each UAV defines the best interface to maintain connectivity at the highest levels. In this context, one suitable solution is the deployment of Heterogeneous Networks, which integrate and enable access to different communication standards, such as WAVE/DSRC communications and Wi-Fi/ISM networks, to support the communication requirements of UAV applications (Yokoyama et al., 2014; Park et al., 2018; Ribeiro et al., 2020).
However, the high mobility present in UAV networks bring other challenges that do not only involve having an active, high-quality connection to the network, but also the intensity of the connection of this node to the network. In other words, whether or not a node is able to receive and transmit quality data in communication, even if its positioning is not fixed. An important task for maintaining wireless communication in a distributed way without relay nodes is ensuring that the nodes remain within the range of at least one neighboring node that belongs to the network. This communication must occur through a reliable connection, in order to maintain effective communication between nodes (Hui et al., 2017a,b).
According to the application characteristics, different communication requirements need to be observed, such as the link performance while sending different access classes AC_VO (voice), AC_VI (video), AC_BK (background), and AC_BE (best-effort), as several wireless technologies that can be exploited for UAV networks exist, taking into account the high mobility, link instability, and high medium dynamics (Ribeiro and Buss Becker, 2019).
In this context, several works have proposed solutions to cover issues involving UAV wireless ad-hoc networks, such as maintaining a strong connection between network nodes (Jawhar et al., 2017), reliable transmission and reception with QoS (Quality of Service) (Nasrallah et al., 2014), minimal latency (Yanmaz et al., 2014), low delay (Jawhar et al., 2017), and high packet delivery rate (Murillo et al., 2018). In the studies that have adopted heterogeneous communications, many have assumed pre-existing mission conditions, defining offline which interface will be used for a given purpose, and reducing the network’s adaptability to unexpected events.
In order to allow for better usage of heterogeneous communication interfaces, (Ribeiro et al., 2021), have presented a solution named heterogeneous interface manager (IM), which allows for automatic selection of the best interface along the flight. It makes decisions about which communication interface should be used, based on dynamically sensed network metrics.
The present paper aims to extend the analysis previously conducted, with the understanding that the kind of data that UAVs need to exchange during the mission (e.g., voice, video, and data) might influence the IM performance. More specifically, the following goals are stated as contributions of this work:
• We aim to validate the performance of different combinations of interfaces by sending different ToS traffic applied in multi-UAV networks. It is demonstrated that the interface manager is a modular solution, which is capable of adding and removing interfaces dynamically, without hard changes in the architecture of the solution. This is an aspect vastly founded in MANETs or fixed-topology networks, but still ongoing in FANET scenarios.
• We perform experiments consisting of combinations of the following interfaces: IM-2Int (using IEEE 802.11n 2.4 GHz and IEEE 802.11p 5 GHz), IM-3Int (both before plus IEEE 802.11ac 5 GHz), IM-4Int (all interfaces cited before plus IEEE 802.11ax 2.4 GHz), and IM-5Int (including all communication interfaces of others experiments plus IEEE 802.11ax 5 GHZ). In this way, the UAV is able to transmit signals through different frequency bands, modulations, and MAC protocols. The use of several wireless interfaces applied in UAV networks differentiates this work from the existing literature, as most heterogeneous communication works applied to multi-UAV networks have employed only up to two interfaces.
• We investigate the viability of IEEE 802.11 ax interfaces (commonly known as Wi-Fi 6) in UAV communications. This is still an emerging technology, which is quite novel in multi-UAV communication scenarios (Vegni et al., 2021).
• We conduct a performance evaluation considering four different access classes of service: Voice (AC_VO), video (AC_VI), data (AC_BE), and control signals, network signs, and beacon frames (AC_BK). The IM performance is evaluated in terms of 14 network metrics, divided into two experimental setups: (i) Application results and (ii) MAC and PHY results. The exhaustive number of network evaluation metrics, divided according to the layer level, also represents a differential aspect of this paper.
The application results describe the experimental performance, in terms of throughput, packet delivery rate (PDR), end-to-end delay, average latency, amount of packets from different ToS delivered, and amount of valid frames and their size. These results describe the network reliability and effectiveness. The MAC and PHY results are composed of dynamically sensed propagation conditions collected during the experiments, such as reception power, aggregated delay, loss, RSSI (Received Strength Signal Indicator), noise, IM validation propagation effects, and SNR (signal-to-noise ratio). The MAC and PHY result set is used to describe the quality of connections between the UAVs during the mission.
In general terms, we observe that a prior definition of the mission application and the communication metric requirements is very important in the definition of which set of interfaces should be applied in the system. This holds as the performance obtained from traffic of different access class packets, even considering the use of more than one communication interface, could appear worse under some evaluation metrics. The use of more interfaces in the network does not implies the best performance, but how they are applied and for what kind of ToS. For example, some combinations of IM were more favorable to be applied in missions with time constraints than others, and in more sparse scenario, when the throughput is the most important feature, an interface applied homogeneously performed better performance than IM.
Therefore, to establish a network with reliable connections and reliable message delivery in UAV networks, it is necessary to verify which metric will be more critical to obtain the required message transmission and link connection quality between nodes.
The remaining parts of this paper are organized as follows: A brief description of the IEEE standards used in the IM interface combinations is presented in Section 2. Section 3 presents a classification considering four macro-aspects considering in UAV networks composition. Section 4 describes the sensed and calculated metric algorithm procedures and the adopted heuristic algorithm. Section 5 describes the experimental scenarios used to perform the evaluations. In Section 6, the developed experiments are presented, highlighting the obtained application and MAC/PHY results. An analysis of important related works is presented in section 7. Finally, Section 8 presents our conclusions and future work directions.
Adopted Communication Standards Overview
This section summarizes the IEEE standards used in the different combinations of interfaces used in the heterogeneous interface manager. These communication interfaces were chosen because they have wide commercial use and are present in several previous works involving networks composed of UAV nodes (Bekmezci et al., 2015; Sanchez-iborra, 2016; Zeng et al., 2016; Yanmaz et al., 2018; Shi et al., 2019).
IEEE 802.11n 2.4 GHz: This standard was developed with the main aim of obtaining more throughput, thus allowing for more parallel traffic with higher frequency channel bonding (40 MHz) than the previous versions of 802.11. Another innovation of this standard is that can operate in two frequency bands—2.4 GHz and 5 GHz—which improves the Wi-Fi communication possibilities, brings higher throughput with closest nodes (5 GHz), and allows for a longer communication range (2.4 GHz). This standard increases the number of streams to 4 (four) using MIMO (multiple input multiple output) smart antenna technology. More streams means higher spectral efficiency, with more bits per second per Hertz of bandwidth, thus reducing the fading effects while increasing link reliability (IEEE, 2008; Masiukiewicz, 2014). A critical point of this standard is that 802.11 can transfer a single frame at a time to all its ports, which means more contention in the window-time.
IEEE 802.11p 5 GHz: This standard has MAC and PHY layers based on the IEEE 802.11a standard, presenting a 10 MHz bandwidth and 1.6 μs guard period in transmissions. IEEE 802.11p employs a dedicated 5.85–5.925 GHz band of the Unlicensed National Information Infrastructure (U-NII) band. The spectrum is divided into seven sub-channels: One control channel (CCH, channel 178) and six service channels (SCHs). In the MAC layer, Enhanced Distributed Channel Access (EDCA) is used, which is a medium access mechanism that coordinates the medium priority access, according to type of messages (classified into eight levels of priority, based on voice, video, best effort, and background) (IEEE, 2010; Park et al., 2018). The channel interval time alternates between CCH and SCH during 50 ms, including the guard interval. In this paper, this protocol uses a CCH channel, as it permits the lowest delay when sending data without association. The CCH includes a secure scheme for safe transmission of messages in a very short time (Park et al., 2018); a concept suitable for application in a VANETS radio system (Institute of Electrical and Electronics Engineers. and IEEE-SA Standards Board., 2011). Such low latency—and very low end-to-end delay—makes this protocol useful in several different networks, including FANETs.
IEEE 802.11ac 5 GHz: This standard helps to add more scalability, reaching a higher throughput than 802.11n (on the order of Gigabits) (Networks, 2012). Also known as Wi-Fi 5 (Wi-Fi, 2000), this standard includes more bandwidth usage, allowing up to 80 or even 160 MHz and, thus, increasing the speed by 117 or 333%, compared to 802.11n ((IEEE, 2008)), respectively. Thus, this standard has been classified as a High-Throughput standard, presenting a denser modulation using 256 Quadrature Amplitude Modulation (QAM), which means more bits per second in the spectrum when using MIMO. Another important evolution is in the number of spatial streams, making it possible to set up to eight spatial streams, which implies higher throughput. This standard is single-band (only 5 GHz band), with MU-MIMO allowing for multiple frames to be sent to multiple clients at the same time over the same frequency spectrum (Networks, 2012). An important observation is that this standard reduces the aggregation modes found in the 802.11n standard (this standard present only A-MPDU aggregation MAC data unit protocol), in contrast to A-MPDU, A-MSDU, and both.
IEEE 802.11ax 2.4 GHz and IEEE 802.11ax 5 GHz: This standard is the new Wi-Fi technology available in the market. It enables high-speed gigabit wireless, together with the predictability of LTE licensed radio. IEEE 802.11ax is a protocol which is still in development, with the aim to provide greater network capacity, higher productivity, and better throughput performance with reduced latency (Networks, 2020). IEEE 802.11ax supports new and emerging applications on the same wireless local area network (WLAN) infrastructure, while delivering a higher grade of service to older applications. These radio standards are different applications, such as 4K video, Ultra HD, wireless office, and Internet of Things (IoT). It applies OFDMA (Orthogonal Frequency Division Multiple Access) and robust high-efficiency signaling for better operations with a significantly lower RSSI received, having a theoretical throughput of 4,800 Mbps at the physical layer with effective throughput, which is more than necessary for several applications. Unlike 802.11ac, the IEEE 802.11ax is a dual-band 2.4 and 5 GHz technology. One important feature is that 802.11ax 2.4-GHz support significantly increases the Wi-Fi range, adds standards-based sounding and beam-forming, and enables new use-cases and business models for indoor and outdoor coverage. To address the operational needs of IoT, 802.11ax and its IoT capabilities, such as low power and determinism, are expected to accelerate its adoption. Denser modulation is enabled through the use of 1024-QAM. This protocol was designed with the aim to allow for the use of Augmented Reality (AR), Virtual Reality (VR), or Mixed Reality (MR) technologies in real-time. These applications usually require throughput higher than 1 Gbps and low latency ( < 10 ms), which is possible due to the advanced Multiple Input–Multiple Output (MIMO; 8 × 8) and scheduling capabilities of the protocol.
Proposed Classification for Multi-UAV Communications Solutions
Figure 1 presents the proposed classification to organize the work into four categories: 1) According to the amount of technologies applied in the communication systems based on multi-UAV; 2) according to the architecture and systems used to develop solutions; 3) according to the type of network management; and 4) according to wireless communication range.
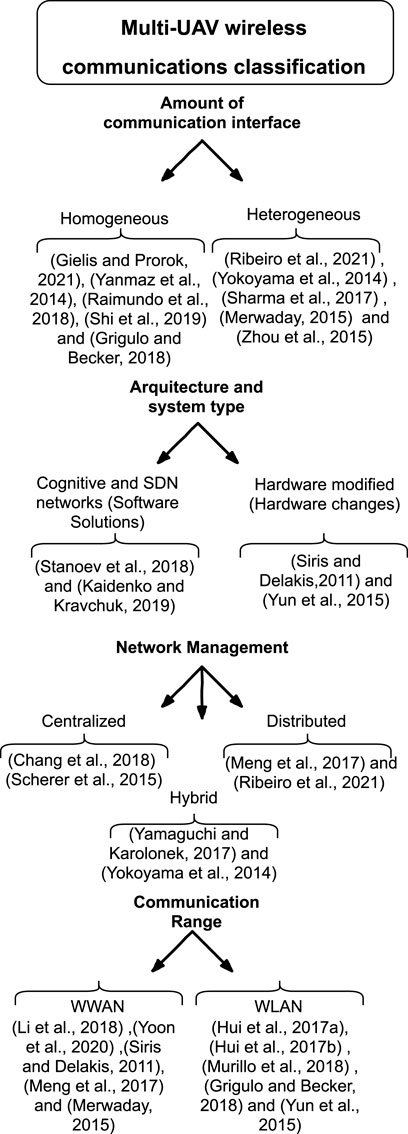
FIGURE 1. Proposed classification and related works.
Each category presents sub-groups which describe a mUAV system in more restricted ways.
Regarding the amount of communication interfaces, a solution can be heterogeneous or homogeneous, which describes the use of a single interface (homogeneous), in contrast to the use of several interfaces for communication (heterogeneous).
In terms of the architecture and system type used to proposed a solution, a multi-UAV system can apply cognitive and SDN networks; provide software solutions, including middlewares and protocol changes; or propose hardware modifications (hardware changed), when some default or fabric hardware features are changed, in order to provide communication.
For network management, a multi-UAV system can have centralized, distributed, or hybrid coordination, in terms of the management and control of how the nodes can communicate in a network. Finally, a multi-UAV system can be described in terms of the size of coverage area: WLAN or WWAN (Wireless Wide Area Network). WLAN usually allows for communication between nodes up to 1 km (maximum) and WWANs up to 50 km, without intermediary devices.
These sub-classifications and sub-groups present the feature of aggregating classifications, such as the mUAV system developed in this paper, which can be classified as:
• Amount of communication interface (heterogeneous)
• Architecture and system type (software solution)
• Network management (distributed)
• Communication range (WLAN)
The definition of a communication interface for an mUAV communication system should take into account the specificity of these networks, which includes low delay tolerance, need for high-throughput maintenance, and link quality instability caused by the higher mobility of communication nodes constituted by UAVs (Shi et al., 2019; Skorobogatov et al., 2020). For that, some authors have concentrated their efforts on the use of a single communication standard, applying cognitive radio techniques in order to serve these networks; for example, by reusing white space slots during communication for management or increasing the number of hops between nodes (Yanmaz et al., 2014; Raimundo et al., 2018; Gielis and Prorok, 2021).
Other approaches include the use of more than one standard (heterogeneous systems), expanding the possibilities of network communication managing the communication interfaces according to context, such as the appearance of new interferences in the medium (Merwaday, 2015; Sharma et al., 2017; Ribeiro et al., 2021).
Zhou et al. (2015) have proposed an aerial–ground cooperative vehicular networking architecture where each UAV is assigned to a ground vehicle. Therefore, UAVs can be employed to assist the vehicular network in an environment where the communication infrastructure is not available and network connectivity is poor. The UAVs fly in a given formation to the affected area, where they perform sensing and act as intermediate communication relays to forward data packets among vehicles when direct multihop V2V links are not available, due to their flexible mobility. For A2A (aerial-to-aerial) communications, heterogeneous communication has been considered, such as XBee-PRO (based on IEEE 802.15.4) for command transmissions and Wi-Fi (IEEE 802.11) for sensing data.
Besides common flight control, wireless communication technologies have been increasingly applied to UAVs or drone equipment; in some cases, many of them leave the factory with more than one communication interface embedded or, in other cases, they have the feature of allowing for the addition of more than one. In general, these communication interfaces follow WLAN standards, which is ubiquitous at present.
The WLAN group of protocols includes IEEE 802.11a, 802.11p, and 802.11n, which present low cost and easy interoperability with other pre-existing devices, providing sufficient features for common applications as video, voice, and data transmission (Yanmaz et al., 2018; Shi et al., 2019). IEEE 802.15.4 is included here, but it is a PAN protocol instead. Other solutions include the development of attached devices, connecting BeagleBone or Raspberry PI platforms to UAV on-board control units, which allow for the expansion of communication device possibilities (Sayyed et al., 2015; Grigulo and Becker, 2018; Menegol et al., 2018).
Considering the architecture and system classification, some papers have used SDN solutions. Silva et al. (2019) proposed a network architecture defined by software, which decouples the control plane and the data plane, through the sharing of a physical link. The goal of the proposed system is to monitor a rocket airstrip in order to avoid collisions, and a prioritization scheme for image data traffic is applied to avoid excessive latency over this kind of message traffic or system instabilities. Kaidenko and Kravchuk (2019) used additional reception channels for the analysis of interference conditions, increasing the network survivability with two or more data transmission channels through the use of optimal algorithms for selection of the operating range.
Hardware modifications also can be applied to obtain higher quality transmissions between nodes. Yun et al. (2015) and Siris and Delakis (2011) have proposed modifications by applying combinations with tripolarization and interference-aware channel assignments using directional antennas.
Network management can be verified or managed in a centralized, distributed, or hybrid (both) manner. In centralized management, the network connectivity is managed by cluster heads, sink nodes, or a ground control station (fixed or mobile) (Sanchez-iborra, 2016; Shi et al., 2019). For a centralized coordination network, in general, it is necessary that the manager node has line of sight with others network nodes or, at least, can communicate with cluster head nodes, sink nodes, or controllers (Chang et al., 2018). In distributed management, the nodes themselves are responsible for establishing and managing their connections (Meng et al., 2017), while maintaining connectivity between them. A common case of hybrid coordination for UAV networks occurs when a swarm head communicates with a ground control base in a centralized way, but forwards the base control messages to other swarm members using decentralized mesh communications (Yokoyama et al., 2014).
The establishment of communications in missions which involve UAVs as communication nodes towards a global goal involves not only imperative tasks regarding the dissemination of observations, data sensing and capture, and control information, but also how to maintain communication between them during flight (Yanmaz et al., 2018). Maintaining connectivity is the basis of a communication infrastructure. In this case, the communication range is an important factor of observation in the conception of such networks. WLANs are commonly used to provide and maintain communication between mobile nodes, with theoretical limits of up to 1 km.
This group of interface devices includes IEEE 802.15 (known as the WPAN group), IEEE 802.11x, IEEE 802.11a/b/g/n, IEEE 802.11p, and RF (900 MHz) (Zhou et al., 2015; Yan et al., 2018). Multi-UAV networks can be classified as WWLAN if the communication interface used is 3 G/LTE, WiMAX, or Satellite communications (SBAS); for example, ultra-reliable 5 G band. In general, for a network to be classified as WWAN, it has to reach distances higher than
Li et al. (2018) provides an exhaustive description of several papers employing 5G communication techniques to extend the primary mechanisms and protocols for the design of airborne communication networks, considering LAP (Low Altitude Platform)- and HAP (High Altitude Platform)-based communication networks with cellular networks. More recently, the use of SBAS (Satellite-Based Augmentation System) messages to support inter-metropolitan UAV communication has gained prominence. Yoon et al. (2020) proposed the use of an onboard module that includes correction conversion, integrity information calculation, and fast initialization requests to enable the application of an online SBAS for drone operation. The authors expect that their system can provide a useful and practical solution to integrate drones into the airspace in the near future.
Other alternatives to extend the communication range of mUAVs systems involve the use of relay nodes, which have been shown to be promising for the rescue of communication with disconnected nodes (i.e., nodes that overcame the communication range) (Bekmezci et al., 2013; Jawhar et al., 2017). These nodes act as ICDs (Intermediary Communication Devices) by amplifying or re-transmitting the signal to nodes beyond the reach of the network node (Hui et al., 2017a,b).
UAV networks employed to allow collaborative and cooperative missions are very useful in several areas, and it is easy to find new applications; however, implementing, testing, finding constraints, and operating this kind of ad-hoc network are not trivial, as a number of technical challenges must be faced when designing such applications (Jawhar et al., 2017). Finally, knowing how a work is classified in academic niches is very important, in order to find related studies to propose comparisons and improvements, while highlighting the differences among approaches.
Algorithm Description
Figure 2 summarizes the IM execution, divided into blocks. Themain steps consist of sensing, interface manager routines (calculate and extract network evaluate conditions, buffer, and decision-making procedures), and output validation.
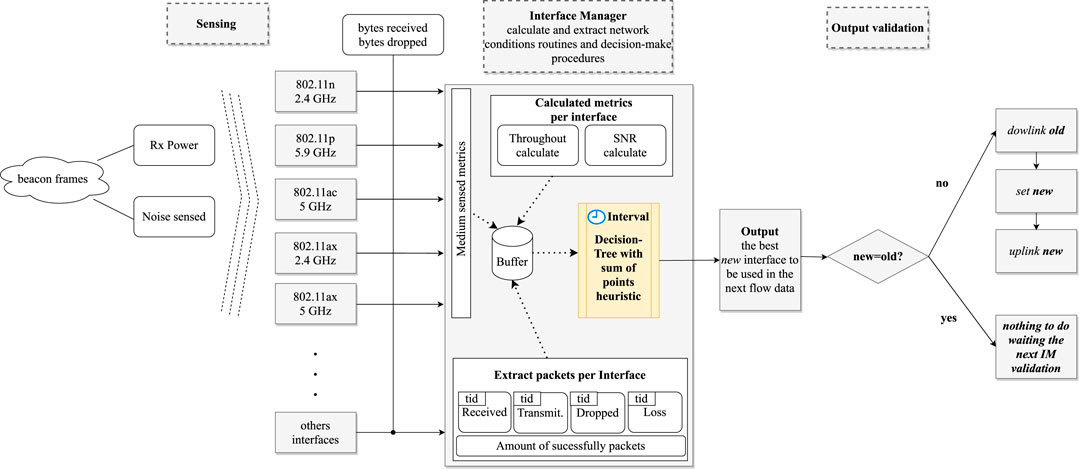
FIGURE 2. Block diagram showing overall idea of the interface manager system.
In the sensing steps, all of the interfaces attached to the system sense the medium, thus capturing beacon frames. These frames include the Rx power and noise conditions obtained by the interface. When an interface has established a communication link, it is possible to obtain the number of bytes received and dropped, compounding dynamic evaluation conditions used by IM. In this case, the others maintain the listen state, in order to provide continuous medium validation. These medium-sensed metrics are aggregated and stored in a buffer. Throughput and SNR are calculated metrics composed of the number of bytes and packets received, as well as packet sending and reception times. These medium-sensed metrics are used to calculate the SNR.
The extracted packets per interface block consist of routines to obtain the amount of received, transmitted, dropped, lost, and successful packets per flow of messages (which occurs when a link is established). Each set of packets that composes a message has a tid (i.e., an identification field that describes the kind of access class of a packet). All of these blocks, which comprise the calculated medium-sensed conditions and the extraction of packets routines, are stored in a cyclic buffer, in order to avoid fluctuation effects, as this measurement is of a dynamic medium.
In each interval defined for a new IM validation, the decision-making algorithms are verified using the network-evaluated conditions stored in the buffer. These algorithms are composed of decision-tree algorithms with a heuristic of sum of points, as described in detail (with mathematical formulations and state diagrams) in (Ribeiro et al., 2021). The output of the interface manager is the best new interface to be used in the next message sending step. In this case, validation of this new interface is carried out, in order to compare it with the last one defined. If the new interface is different from the last one, the routines of downlink for the interface in use, then set and uplink for the new interface are started. Otherwise, the same conditions are maintained and nothing is done.
The block diagram that composes the interface manager system is formulated by algorithms consisting of two main parts: sensed and calculated metrics, and a heuristic of sum of points. Algorithm 1 and Algorithm 2 describe these parts, respectively, and are applied in a decentralized manner (in each UAV). Thus, each UAV makes its own decision, based on the blocks sensed and calculated by itself, independently of others.
Algorithm 1 presents the sensed and calculated metrics used for dynamic evaluation of the medium dynamic conditions. The sensed metrics are described by rxPower (line 2), noiseSensed (line 3), bytesReceived (line 4), and bytesDropped (line 5). All of these metrics are obtained using beacon frames and traffic signs from an established link. The beacon frames are obtained from the listen state of interfaces which are not in use, and the sign messages captured by the interface used to establish the link in use. Thus, the procedure BufferSensingAndCalculateMetrics has, as inputs: MACframesDetected, which is composed of all frames received by a UAV using the MAC and PHY layer by interfaces, which uses a frequency band, where each frame has labels to identify the node that sends this message receivFrom, which node requires a link sendFor, and also which nodes stay within range (i.e., nodes remaining in the neighborhood; sourceNodes). In this way, rxPower (line 2) and noiseSensed (line 3) are captured metrics from beacon frames sensed by sourceNodes; while bytesReceived (line 4) and bytesDropped (line 5) are metrics obtained by a link established by a sink sendFor node and a source receivFrom node.
To analyze the network performance at application level from the traffic of different types of services, the MAC frames are aggregated, using the A-MPDU (Aggregated MAC Protocol Data Unit), into trailers which generate sets of packets in the network OSI layer, attaching their respective headers for each protocol, including fields such as destination and source IP address, and the ToS field for identification of the type of service IEEE (2007). The ToS packet header field is used for identification of packet access classes, as all the communication interfaces were set with QoS-enabled MAC models.
Thus, the packets are extracted between lines 6–11 of Algorithm 1, where all the extractPackets functions include the tid field as input. The tid is the ToS tag, which should mark packets forwarded down to the MAC layers, in order to set a TID (traffic id) for that packet; otherwise, it will be considered as belonging to AC_BE.
The calculated metric is described in lines 12–14 of Algorithm 1; that is, the SNR (line 13), calculated using the relation between the rxPower and noiseSensed from a MAC frame received calculated by calculateSNR function.
The throughput (line 14) is calculated using the calculateThroughput function, which considers the amount of bytes received totalBytesRx; the reception time of the last packet timeLastRxPacket received by a flow of messages, with respect to the amount of packets received successfully (packetsSuccess, confirmed by the receiver node); and the transmission time of the first packet of this flow timeFirstTxPacket.
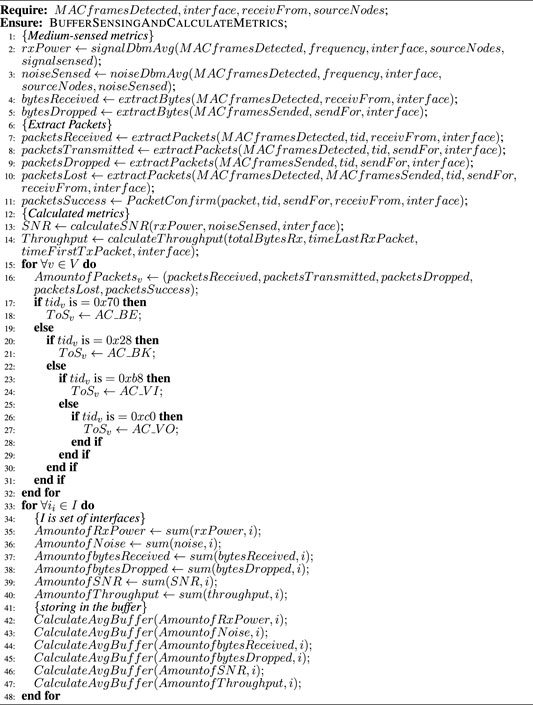
ALGORITHM 1. Sensing and Calculate metrics.
In this case, for each flow of messages v that belongs to the set of all flow messages trafficked by network V, the amount of packets generated AmountofPackets is verified (line 16). Each packet has a tid tag, in order to classify the packets received (lines 17–29). Here, tid = 0x70 denotes AC_BE data traffic, tid = 0x28 denotes AC_BK signals traffic, tid = 0xb8 denotes AC_VI video traffic, and tid = 0xc0 denotes AC_VO voice traffic, according to the IEEE AC classification.Lines 30–45 in Algorithm 1 describe routines to calculate aggregated network samples (lines 32–37) and the storage process in a buffer of ten positions, in order to avoid the fluctuation effects caused by medium dynamic variations (lines 38–45).The CalculateAvgBuffer function calls the cyclic buffer of samples received, and calculates the average obtained by each metric sample for each interface. The average obtained by the evaluation metrics are attached for each data set that belongs to an interface, which are used by the interface manager algorithm in its decisions.Algorithm 2 describes the interface manager operation. The algorithm has data sets as input interfaceA, interfaceB, interfaceC (or, how many interfaces are used by IM). The heuristic of sum of points consists of accumulating points (sumPointA, sumPointB, and sumPointC) (lines 1–3), conducting comparisons of the metrics achieved by each interfaces. In this case, if the AvgRxPower of interfaceA is greater than those of interfaceB and interfaceC, sumPointsA accumulates one point (lines 4 and 5); otherwise, if interfaceB presents better AvgRxPower, sumPointsB is increased by one, while if the better performance is that of interfaceC, the sumPointsC variable that is increased by one (lines 6–10). The same process is conducted for all evaluated metrics (lines 11–18). After that, we verify which interface has more points accumulated (lines 19–28). The greatest amount defines the best interface to be used in the next send of flow messages by a node; that is, the one which has better performance in a higher number of metrics. If there is a tie between the aggregated points, the last interface which presented the greatest amount of points is maintained as the best one (line 27).Lines 29–33 of Algorithm 2 describe the interface switching. Line 29 verifies whether the new (new) best interface is the same as the last best interface (old). If they are different, the current interface is dropped (downlink) using its IP address defined (node), and the best interface is set to be used in the node transmissions (lines 30–31). The uplink routine sets the new interface to send the next data flow (line 32).IM validations occurs in time intervals of 1 s during all simulations, where new interface data sets are obtained from the buffers stored by Algorithm 1, starting a new validation (line 35). In general, the computational cost of executing the algorithms is linear, as they are composed basically of comparisons between a determined unsorted number of elements, thus presenting O (a(n−1)) comparisons, where a is the number of evaluation metrics and n is the number of interfaces applied. Thus, it can be concluded that it is possible to run Algorithm 1 and Algorithm 2 in an embedded manner in various UAV OBUs (on-board units).
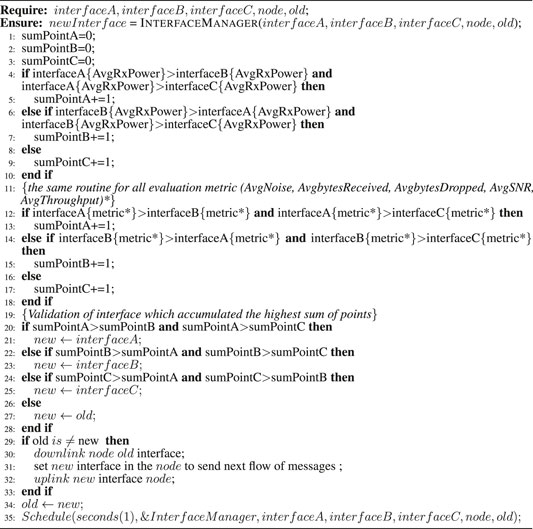
ALGORITHM 2. Interface Manager algorithm (example using three interfaces).
Experimental Procedures
Three experimental scenarios were defined, in order to evaluate the heterogeneous IM using different communication interface combinations. The trajectory (i.e., path to be covered) of each UAV was defined so that there were variations in distances between the UAVs during the execution of their paths. The paths were defined by the dotted lines shown in Figures 3–5. The start/end points (yellow squares)—that is, the points of take-off and landing, respectively—were common to all UAVs, with a few meters of difference for safety reasons. The UAV path can include one or more intermediate waypoints, and return to the base. The waypoints are described by arrows at the end of the dotted lines.
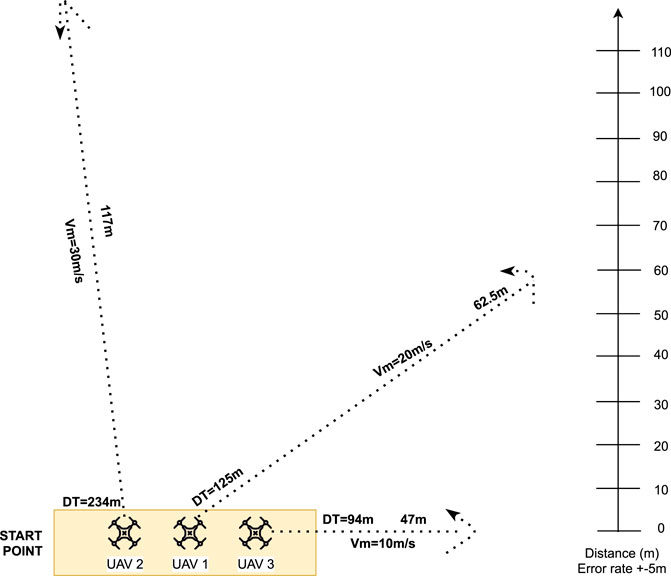
FIGURE 3. Three-node experimental scenario.
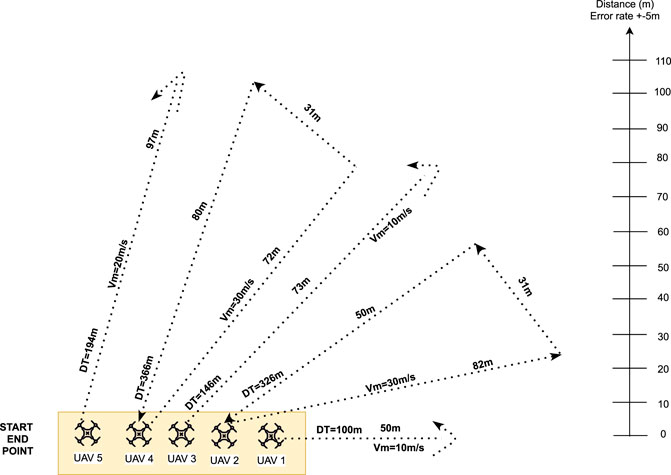
FIGURE 4. Five-node experimental scenario.
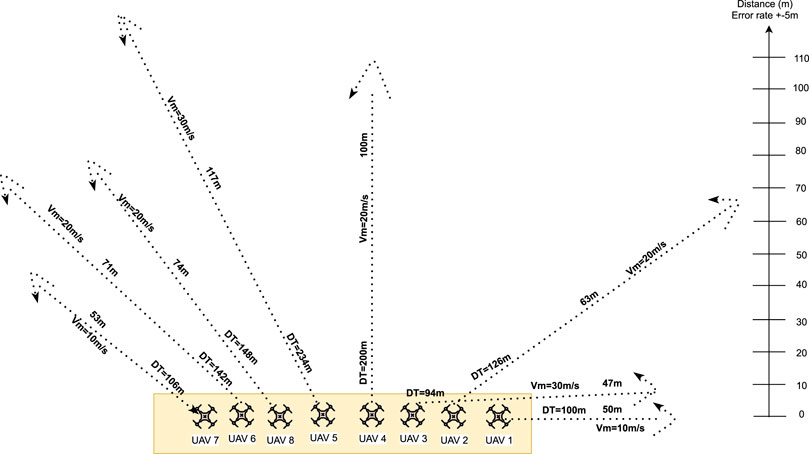
FIGURE 5. Eight-node experimental scenario.
The DT (distance traveled) by each UAV is shown over its dotted lines. It is calculated as the sum of the total distance traveled by the UAVs, including their return to base. The distance traveled between the waypoints is also shown over the corresponding dotted line. The average speed (Vm) of each UAV is also shown in the experimentation scenarios (3–5). Different average speeds were defined, in order to simulate different types of UAVs; for example, in the three-node scenario, the UAV that had the greatest distance traveled had the highest average speed (30 m/s).
The reference column located in the right corner of Figures 3–5 can be used to approximately check the distances reached (with an error rate of ±5 m) by the UAVs over their paths.
In the three-node scenario (Figure 3), UAV 1 had DT = 125 m with Vm = 20 m/s, UAV 2 had DT = 234 m with Vm = 30 m/s, and UAV 3 had DT = 94 m with Vm = 10 m/s. Using the distance column and the path of UAV 1 as the distance reference, the UAV 1 had up to 60 m of distance from UAV 2, as well as up to 110 m of distance from UAV 3; this was the maximum distance between paths reached in this scenario.
In the five-node scenario (Figure 4), UAV 1 had DT = 100 m with Vm = 10 m/s, UAV two had DT = 326 m with Vm = 30 m/s and three waypoints, UAV 3 had DT = 146 m with Vm = 10 m/s, UAV 4 had DT = 366 m with Vm = 30 m/s and three waypoints, and UAV 5 had DT = 194 m with Vm = 20 m/s. In this scenario, as the UAVs had more time inside the range, we defined UAVs as having intermediary waypoints (more than two) in their path with 30 m/s average speed, while UAVs with only two waypoints and paths of up to 70 m traveled at 10 m/s. Finally, the UAV which had a path with distance traveled more than 70 m traveled at 20 m/s. Once again, using UAV 1 as reference for the highest distance reached between UAVs, up to 150 m of distance from the path of UAV 5 was found. The other UAV paths, including the intermediary paths, presented up to 35 m distance between then.
For the eight-node scenario (Figure 5), UAV 1 had DT = 100 m with Vm = 10 m/s, UAV 2 had DT = 126 m with Vm = 20 m/s, UAV 3 had DT = 94 m with Vm = 10 m/s, UAV 4 had DT = 200 m with Vm = 20 m/s, UAV 5 had DT = 234 m with Vm = 30 m/s, UAV 6 had DT = 142 m with Vm = 20 m/s, UAV 7 had DT = 106 m with Vm = 10 m/s, and UAV 8 had DT = 148 m with Vm = 20 m/s. In this scenario, the UAVs had more sparse paths, reaching up to 175 m of distance between paths (UAV 1 and UAV 5), considering safety spaces of 2 m between UAVs. The distance between the paths of UAV 1 (50 m) and UAV 5 reached its second greatest at 117 m from the start point. The aim of this scenario was to include a larger number of UAVs in the spatial topology using a single waypoint, in order to simulate greater distances reached between the UAVs without exceeding the theoretical limits of communication interfaces without relay and repeaters.
In this scenario, longer distances (more than 50 m) were covered by faster UAVs, as shown in Figure 5, which includes a complete trajectory of the mission, defined by the start waypoint, intermediate waypoints, and the return to start waypoint.
The communication interfaces used were set to allow for a coverage area of approximately 300 m, in order to search a fair comparison. However, for IEEE 802.11p 5 GHz, its coverage area can vary from 350 m to 1 km (nominal range, according to the standard). All of the interfaces presented a transmission power of 16.02 dBm (40 mW), thus avoiding signal overlap, as shown in Table 1.
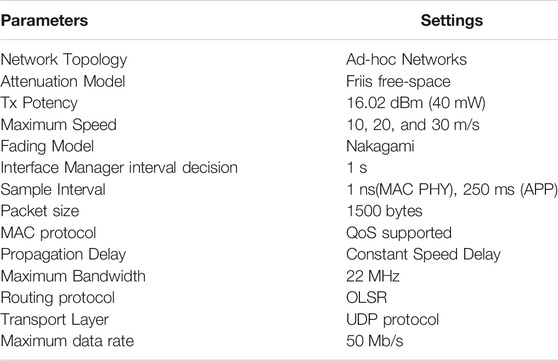
TABLE 1. Settings for various scenarios.
Constant speed delay was used as the propagation delay model, in order to verify the delay caused by the variation of distance between the nodes and the effects of difference distances reached from start point. These scenarios, with all settings described in this section, were used to carry out the IM evaluation, using different interface combinations, as detailed in Section 6.
Performance Evaluation
This section present the developed experiments, carried out using an integration of the NS-3 and Gazebo simulation platforms. NS-3 (Consortium, 2019) is a discrete event network simulator tool, which was used to validate the performance of the heterogeneous interface manager algorithm and to provide all network settings, such as the communication interface settings (e.g., frequency, bandwidth, IP addresses), amount of nodes, propagation loss models, and routing protocol configurations, as well as to define the evaluation metrics and type of services in the application layer. These settings were applied in UAV nodes that consist of Gazebo models, using the GzUAV tool (D’Urso et al., 2019) as an integration tool. GzUAV is a Gazebo-based framework for multi-UAV ArduCopter simulation, which allows for simulation of multiple instances of Gazebo (in the same scenario) integrated with NS-3 communication nodes through synchronized virtual channels. Gazebo (Koenig and Howard, 2004) is a robotics simulator used to define UAV models and other nodes, with various scenario settings such as waypoints, velocity, acceleration, start–end positions, and the dimensions of the outdoor scenario (without obstacles).
Another tool was used to provide the service of sending video frames between nodes, in order to evaluate the AC_VI (video access class) type of service message traffic. This tool is Evalvid (Klaue et al., 2003), which allows for assessment of the perception of transmission quality from audio and video services. Evalvid is an NS-3 integrated framework; this framework, in this work, was changed to allow the transmission of multiple video streams from multiple UAV nodes.
With the synchronization of all tools, it was possible to run experimental scenarios using multiple UAVs as communication nodes, sending different ToS in scenarios defined within Gazebo. Therefore, the scenarios defined in Section 5 were evaluated in two different experimental setups, in order to separately evaluate the IM performance metrics, according to how the data logs were generated: Application results or MAC and PHY results. The Application data logs were obtained after the end of the experiment. The IM application layer was evaluated in terms of the average and aggregated set of metrics which, in fact, implies the communication performance sensed by the end sink node at the end of the experiment.
The application results were defined to propose the evaluation of reliability in the delivery of messages and the quality of data received. Therefore, we observed typical network performance metrics, such as throughput, packet delivery rate (PDR), end-to-end delay, average latency, and amount of flow messages successfully delivered. Other metrics included the amount of packets of AC_BE, AC_BK, and AC_VO received, which were sent by nodes in broadcast mode alternately, lasting up to half of the experimental duration. Therefore, the sample interval was 250 ms, in which a sequence of AC_BE, AC_BK, and AC_VO packets up to 1,500 bytes in size can be sent. In the second half of the experiment, the traffic was composed only by video streaming, classified as AC_VI ToS, where the number and size of video frames received by nodes are verified. Video streaming was composed by frames of MPEG-4 video 637.7 Kbytes in size. The video resolution was 352 × 288, using 30 frames per second with 65 kbps bit rate.
The separation of AC_VI from other types of service was conducted to obtain more specific validations, as this is an important type of service applied in search and rescue missions.
MAC and PHY results were generated using metrics collected during the running time of the experiment. As this was also composed of ACK-type packets coming from the beacon frames received by the nodes within range of each other, these samples are collected at 1 ns intervals, depending on the spectral sensing events. Thus, to facilitate understanding of the results, they were standardized in aggregated sample sets.
Notably, the metrics received from the MAC and PHY layers were composed of sensed propagation parameters, such as reception power, delay, loss, RSSI, noise, and RSSI, including IM validations and SNR. The results of the MAC and PHY set supported the analysis of the quality and maintenance in the connectivity between the UAVs during the mission.
All of the experiments were performed using heterogeneous interfaces; that is, using the proposed IM with two (IM-2Int), three (IM-3Int), four (IM-4Int), or five (IM-5Int) wireless communication interfaces. For comparison purpose, all the interfaces used in IM settings were performed in homogeneous way.
The interfaces used in the experiments were:
• IM-2Int: IEEE 802.11n 2.4 GHZ and IEEE 802.11p 5.9 GHz. The first one was applied with non-overlap channel 6 (2,426–2,448 MHz) and 22 MHz of bandwidth, while the second one was in channel 172 (5,860–5,870 MHz), which is a safety channel with 10 MHz bandwidth, used as a traffic priority to send messages without association, based on node distance. These configuration are the same as employed in the other experiments.
• IM-3Int: Both interfaces described before plus IEEE 802.11ac 5 GHz. This interface uses channel 42 (5,170–5,250 MHz) reduced to 20 MHz of bandwidth with four spatial antennas and a short guard interval of 400 ns The HT (High-Throughput) data rate was also applied, which means it was possible to achieve more than 300 Mbps. These antenna settings and short guard interval of OFDM are defined by the IEEE protocol standard setting for this device.
• IM-4Int: All the interfaces described before plus IEEE 802.11ax 2.4 GHz. This interface uses channel 1 (2,401–2,423 MHz) with 20 MHz of bandwidth, with four spatial antennas and an OFDM short guard interval of 800 ns The HE (High-efficiency) data rate is enabled, in order to configure nodes when using this device, to allocate the whole channel to a single client node at a time or partition a channel to serve multiple users simultaneously.
• IM-5Int: At least one experiment used all communication interfaces described before plus IEEE 80211 ax 5 GHZ. This interface uses channel 42 (5,170–5,250 MHz) reduced to 20 MHz with 800 ns guard interval, and all of the other IEEE 802.11ax 2.4 GHz settings. These settings were installed by default, when IEEE 802.11ax is configured as per the standard in NS-3. The IEEE 802.11ax has been marketed as Wi-Fi 6 (2.4 and 5 GHz) by the Wi-Fi Alliance (Wi-Fi, 2000).
Table 1 presents relevant configuration parameters used in all scenarios. The Friis free-space propagation model was used, in the simulation, as a signal attenuation model. However, to include signal fading effects, the Nakagami statistical shading model was applied using a Rayleigh distribution, considering variations in signal strength due to multi-path fading, once the nodes could not be in LOS (line-of-sight) of each other, as seen in (Ribeiro et al., 2021).
The OLSR (Optimized Link State Routing) protocol was used, in order to reduce the message overhead, using link state information only in the case of network changes (i.e., adding/removing a node) and, thus, minimizing the number of control messages in the network.
The performance of each set of experiments is compared and discussed in this section, in order to describe in which aspects the use of heterogeneous communication can be favorable, as well as which configuration provides the best performance in these networks. The experimental duration varied for each scenario: around 132 s maximum for scenario 1 (three nodes), 140 s maximum for scenario 2 (five nodes), and 150 s maximum for scenario 3 (eight nodes). These durations correspond to the NS-3 simulation time, as it used the metrics of evaluation in its execution logs on the order of ns.
IM validation (switchings) for each experiment occurred at 1 s intervals, using the average of the condition decisions from buffers containing at least 10 samples, collected every 100 ms. This avoided instantaneous value fluctuations.
Application Results
Figure 6 shows the amount of packets received by the network, in terms of different ToS, for each experimental scenario. This metric was chosen to evaluate the network productivity when sending different types of services between nodes and, consequently, the effective capacity of the network to exchange these different types of service packets during the flight.
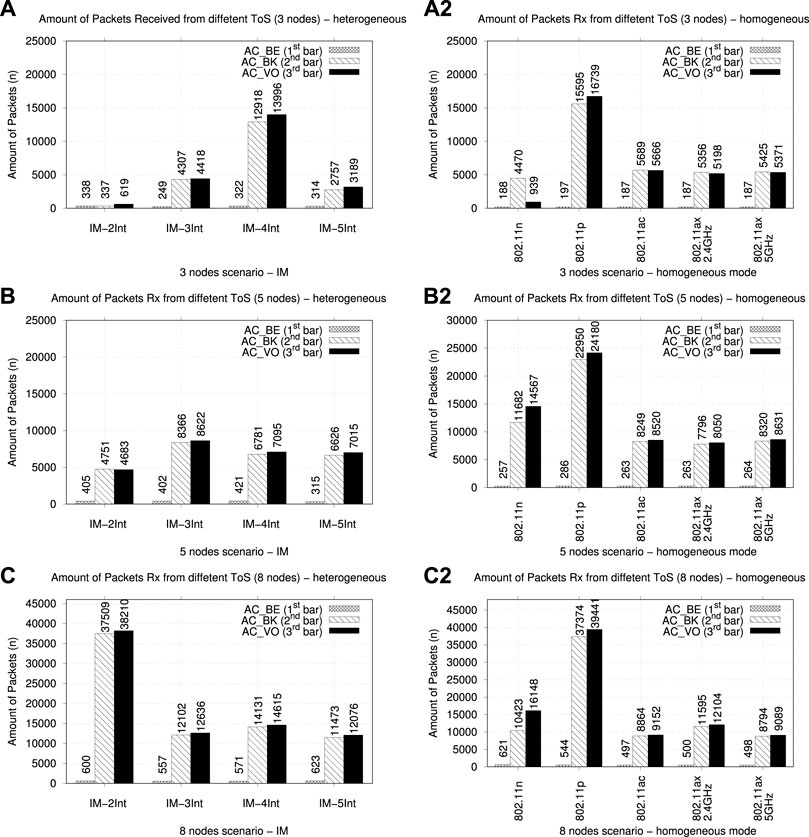
FIGURE 6. Amount of different ToS packets received by network: (A) Three-node scenario IM performances; (A2) three-node scenario homogeneous performances; (B) five-node scenario IM performances; (B2) five-node scenario homogeneous performances; (C) eight-node scenario IM performances; and (C2) eight-node scenario homogeneous performances.
In order to validate the performance of the IM experiments, MTxP (network) (i.e., the maximum capacity for transmitting packets over the network) was calculated, without inclusion of distance variation between nodes. Ideally, to determine MTxP, it is necessary to know the maximum network data rate (50 Mb/s, according to Table 1). Thereby MTxP can be calculated as shown in Eq. 1:
where TxP is the packet transmission rate per second and N is the number of nodes in the network. Thus, in this work, the MTxP was composed by the TxP multiplied by duration(s)/2. As it was defined in all scenarios, three ToS (AC_BE, AC_BK, and AC_VO) were sent and validated by all nodes for up to half of the maximum duration plus 1 s (safety time to start and end communication by sink node); for example, in the three-node scenario, considering the maximum data rate adopted by network, Eq. 1 results in:
For the three-node scenario (Figure 6A), the experiment IM-4Int performed best, with a greater number of successful AC_BK (12,918) and AC_VO (13,996) packets. In terms of AC_BE ToS, IM-2Int presented the best performance, achieving 338 packets. The second-best performance was the IM-3Int experiment, with 4307 and 4418 for AC_BK and AC_VO, respectively. In general, the addition of interfaces in IM implies different ToS packets propagated by the network. However, the IM-5Int experiment (which added a communication interface operating in the 5 GHz band, IEEE 802.11ax 5 GHz) generated an increase of packet loss in all ToS packets, when analyzed implicitly against the IM-4Int and IM-5Int experiments.
A possible cause for this is the use of IEEE 802.11ax in the same channel as IEEE 802.11ac, causing possibilities of co-channel interference; that is, if another node within the communication range is using the 802.11ac interface. All communication interfaces applied in the experiments used unlicensed frequency bands, meaning they do not guarantee channel allocation, thus potentially generating this type of interference. An alternative to minimize this problem is to use dynamic channel assignments, in an attempt to minimize the effects of co-channel existence.
Analyzing Figure 6A2 for the three-node scenario, which presented the performance of interfaces applied in a homogeneous manner, IEEE 802.11p showed the best performance for all access classes, with 197 AC_BE, 15,595 AC_BK, and 16,739 AC_VO. This means that the feature of short-time node association and the lower header inserted by 802.11p WAVE protocol are likely very favorable to ensure packet productivity in multi-UAVs networks. The interface 802.11n presented the worst performance for all access classes, correlating with both performances (homogeneous and heterogeneous). The worst performance of 802.11n obtained in a homogeneous situation reflects the worst performance obtained by the IM-2Int experiment, in which the IM used 802.11n and 802.11p in its decisions. The amount of AC_BK and AC_VO packets obtained by interfaces applied in homogeneous mode presented the best performance against the IM experiments. In terms of AC_BE packets, the IM experiments presented the best performance, with 135 more packets received than homogeneous experiments. Therefore, in terms of packets up to 144 bytes, the IM experiments presented the best performance. This means that the IM is less susceptible to noise and interference from medium and fading effects, where this type and size of packet is very likely to be affected under these conditions. Furthermore, the volume of packets for the homogeneous experiment was better, presenting a higher traffic capacity of the network; however, it is not sufficient to define the efficiency of a network, as these packets can present errors in data recovery or may comprise duplicate traffic. So, the end-to-end delay, latency, and PDR are important network evaluation metrics to define the quality of packet reception. End-to-end-delay and latency have special place in multi-UAV network QoS evaluation, mainly when the mission includes shared tasks and goals, and where the reception time is a critical factor during the mission execution.
For the five-node scenario, the experiments IM-3Int and IM-4Int performed better, with a greater amount of AC_BK (8366 and 6781, respectively) and AC_VO (8622 and 7095, respectively) packets. In this case, the IM-4Int experiment presented the best performance, in terms of AC_BE packets. In this scenario, with the exception of the IM-2Int experiment, the performance of the other IM experiments presented similar behavior, varying between 4751 (IM-2Int) to 8366 (IM-3Int) for AC_BK and 4683 (IM-2Ínt) to 8622 (IM-3Int) for AC_VO packets. The IM-5Int performance did not present the best performance, however, but was third in terms of AC_BK and AC_VO ToS, and the worst in terms of AC_BE ToS. Therefore, in the five-node scenario, more communication interfaces does not necessarily imply the best performance but, with a major density of nodes, the performance of the IM experiments presented similar results.
Figure 6B2 presents the performance of interfaces applied in a homogeneous manner. In this case, with an increase in the number of nodes and closer UAV paths, the interfaces using 802.11n and 802.11p presented the best performances, with 11,682 (AC_BK) and 14,567 (AC_VO) for 802.11n, and 22,950 (AC_BK) and 24,180 (AC_VO) for 802.11p. For AC_BE, 802.11n presented the worst performance, with 257 received packets. In this case, 802.11p used in homogeneous mode implied three times more packets received than the best performance verified in the IM experiments (IM-3Int). Therefore, in terms of traffic volume, 802.11p applied homogeneously could provide a good interface to be used for signals, control, and voice transmissions. Once more, the IM experiments presented better performance, in terms of short-packet (AC_BE) traffic, reaching approximately two times more packets received. The 802.1ac, 802.11ax 2.4GHz, and 802.11ax 5 GHz experiments presented similar performance as the IM combination experiments for AC_BK and AC_VO traffic.
For the eight-node scenario, the IM-2Int experiment presented better performance, considering AC_BK and AC_VO packets, while the IM-5Int experiment was best for AC_BE packet traffic. The other experiments varied between 557 (IM-3Int) and 623 (IM-5Int) for AC_BE; for AC_BK, between 37,509 (IM-2Int) and 11,473 (IM-5Int); and, for AC_VO, between 38,210 (IM-2Int) and 12,076 (IM-5Int).
This scenario presented more spatial UAVs routes and a higher density of nodes, which generated more traffic requests, composed of signaling short-packets (between 66 and 144 bytes) of the AC_BE packet type. For this reason, a larger amount of request and ack packages were generated than in other scenarios. The same happened with other ToS packets, having a higher amount of packets.
Analyzing the homogeneous IEEE standard performance in the eight-node scenario, all of the IM combinations presented better performance, reaching up to three times more packets received. The best performance IM combination (IM-2Int) presented very close performance to 802.11p, with 600 AC_BE, 37,509 AC_BK, and 38,210 AC_VO packets against 544 AC_BE, 37,374 AC_BK, and 39,441 AC_VO packets, respectively. Therefore, in fact, the IM made decisions considering the best interface to apply in these scenarios.
In this scenario, the co-channel interference may also be applied in this case, as the best efficiency in packet traffic came from the experiment considering the IM with only two interfaces (IEEE 802.11n 2.4 GHz and IEEE 802.11p 5.9 GHz). This can be justified by the adaptability of the 802.11p protocol in sparse environments, with a theoretical range of communication of about 1 km without an RSU (Road Side Unit).
Thus, the scenarios that presented more than three nodes had similar performance behavior, in terms of the number of packets received for the different types of service packets. However, the best performance was reached in each scenario by IM- 4Int (three-node scenario), IM-3Int (five-node scenario), and IM-2Int (eight-node scenario), having performances up to 2 times better. In the homogeneous case, 802.11p presented the best performance in all scenarios, representing a better option for AC_BK and AC_VO traffic in high mobility networks. Another conclusion was that 802.11n 2.4 GHz presented bad performance in scenarios up to three nodes, as seen in IM-2Int and 802.11n in Figures 6A,A2, with an increase in the number of nodes increasing its performance, being part of the best combination in IM experiments (IM-2Int).
In general, the IM combinations were less susceptible to interference than the interfaces applied homogeneously, which can be seen in the eight-node scenario, with a high volume of packet traffic in a high-frequency concurrency scenario.
The combination of interfaces applied to the IM which showed the best performances demonstrated that a greater number of interfaces applied in IM does not imply better performance; instead, the performance was defined by which interfaces were defined to be used, which frequencies and channels were set and, finally, the scenarios and type of services were applied in a certain mission.
Figure 7 describes the average latency obtained by the networks and the amount of successful flow messages. The flow of messages is defined in terms of the successful links established between nodes to send packets.
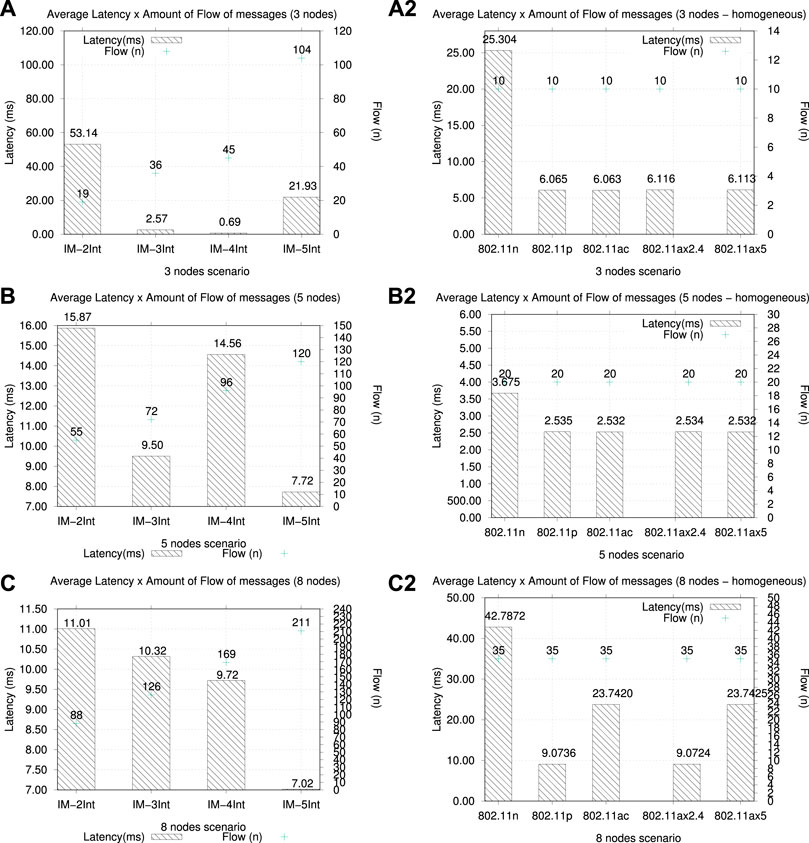
FIGURE 7. Average Latency and amount of flow messages trafficked by network in IM and homogeneous experiments: (A) Three-node scenario; (A2) three-node scenario (homogeneous); (B) five-node scenario; (B2) five-node scenario (homogeneous); (C) eight-node scenario; and (C2) eight-node scenario (homogeneous).
From Figure 7A, it is possible to see that the IM-4Int experiment also presented the best performance, considering the relationship between average latency and flow of message, presenting 0.69 ms of latency per 45 effective messages delivered. The greatest amount of flow messages was determined in the experiment IM-5Int but, as seen in Figure 6A, this does not imply a higher reception of ToS packets, as a message flow could consist only of acknowledgment messages from beacon frames. For homogeneous experiments (Figure 7A2) the best performance was obtained by 802.11ac, with 6.063 ms of average latency per 10 messages delivered. 802.11 n presented the worst performance, with 25 ms of latency for the same amount. This performance reflected the performance obtained in the IM-2Int experiment (which was the worst performance obtained in the IM setting).
All of the interfaces applied homogeneously presented the same amount of flow obtained during the mission, in all scenarios. The latency variance presented in homogeneous experiments highlights the intrinsic difference in protocols; in this case, IM-4Int presented a four-fold higher flow of messages delivered in the lowest amount of time. This describes the benefits of heterogeneous communications, used to dynamically adapt to a network with medium conditions.
Figure 7B shows IM-5Int, which presented the best performance, considering the proportion of average latency obtained (7.72 ms per 120 flow messages). In this case, evaluating this proportion plus the amount of packets received by the different types of service, as seen in Figure 6B, this experiment presented the best performance for the five-node scenario, as it represents the nodes communicating more frequently, with lower latency and quantities similar to other packet reception experiments using different types of services. Analyzing the interfaces applied in a homogeneous manner, the 802.11p 5.9 GHz presented performance close to that of 802.11ax 2.4 GHz; this is interesting, as they use different frequency bands. Meanwhile, 802.11ac 5 GHz presented equal performance to 802.11ax 5 GHz; in this case, both presented the same frequency band and channel. These performances indicate that MAC and PHY layers of these interfaces present some common compositions.
In the eight-node scenario, presented in Figure 7C, IM-5Int showed the best performance, considering the proportion of average latency obtained (7.02 ms per 211 flow messages). However, considering the amount of packets received, as shown in Figure 6C, the IM-5Int experiment was much lower than the best performance of IM-2Int, such that this larger amount of flow may only be composed of requests and responses from nodes or the establishment of links, without sending relevant payloads. In this case, evaluating both Figures, the best performance was still obtained from the IM-2Int experiment, followed by the IM-4Int experiment. For homogeneous performance, the best performance was that of 802.11p and 802.11ax 2.4 GHz, which presented almost the same performance. In this scenario, the same homogeneous behavior was presented by the five-node scenario, where 802.11p presented very similar performance to 802.11ax 2 GHz and 802.11ac from 802.11ax 5 GHz. Using, as reference, the performance of IM-5Int and 802.11ax 2.4 GHz, the interface manager allowed around six times more amount of data flow to be successfully received.
To conclude, as can be verified by comparing Figures 6, 7, it is not enough to simply establish more communication flows with the nodes with the lowest latency, when dealing with a mission that requires different types of service; it is also necessary to consider the type and amount of payload for each packet received. Furthermore, the best IM settings presented similar performance to 802.11 p, in terms of the amount of packets received from different ToS. Thus, IM is capable to achieving the lowest latency with a higher flow of messages (i.e., payload successfully delivered) than all of the interfaces applied in a homogeneous manner.
Another important consideration is the heuristic of sum of points used by the IM, applying equal weights to the evaluation metrics, does not allow the algorithm to be biased towards missions where greater performance in the flow of data is needed, in terms of more flow messages (i.e., establishing links) or seeking the lowest latency at any cost. This can be the subject of future research.
In this way, evaluating the results together allows for more precise conclusions. Figure 8 presents the performance of delay compounded by the preparation for sending message time in the source node, including the IM decision time, up to the reception procedure in the sink node. According to Figures 8A–C, as expected, with more nodes present in the experiment, a higher flow of messages is received. The same did not occur with the delay and flow, as seen in Figures 8B,C. In this case, lower delay was presented by IM-2Int (with 55 flow) and IM-5Int (with 211 flow). In the five-node scenario, considering time-restricted missions, the best performance was attained by IM-5Int, presenting 0.0500 s of average end-to-end delay and latency of 7.72 ms, as seen in Figure 7B.
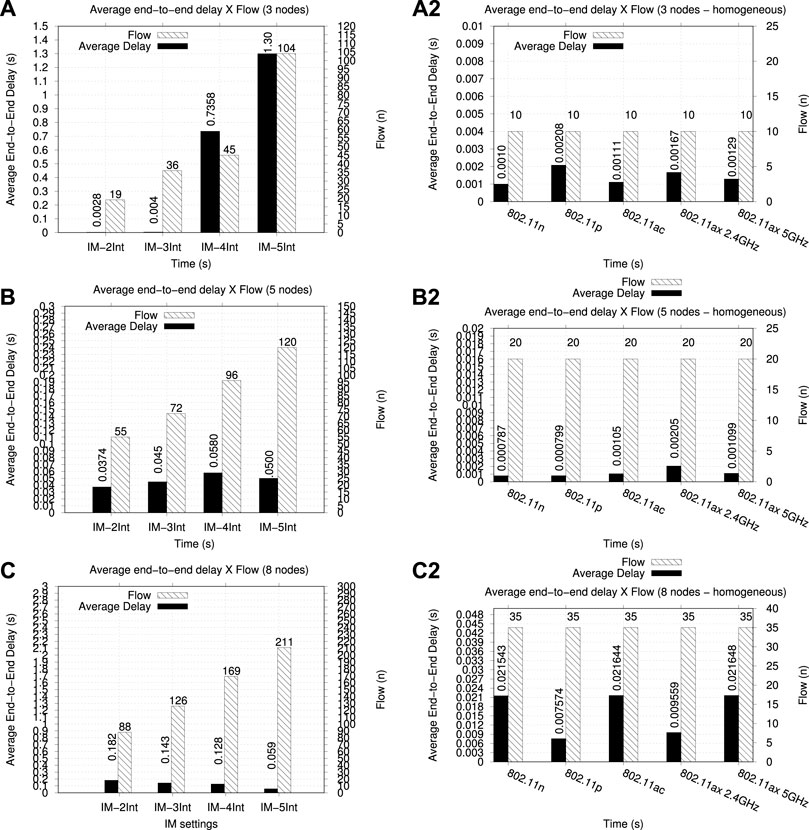
FIGURE 8. Average end-to-end delay and amount of flow messages trafficked by network per IM and homogeneous experiment: (A) Three-node scenario; (A2) three-node scenario (homogeneous); (B) five-node scenario; (B2) five-node scenario (homogeneous); (C) eight-node scenario; and (C2) eight-node scenario (homogeneous).
For the eight-node scenario (Figure 8C), if the mission also presented time restrictions, IM-5Int presented the best performance, considering the average delay of 0.059 s and latency of 7.02 ms (Figure 7C). Considering only the performance of average end-to-end delay for the three-node scenario, the best performance was found in the IM-3Int experiment (0.004 s), but it should be noted that a higher amount of data flow was not presented.
Using the roaming delay of the 802.11 standard described in IEEE-SA Standards Board, 2011 as reference, the user generally does not perceives any notable delay in voice over WLAN phone calls if the delay is no higher than 150 ms. Thus, in case of missions with time restrictions and traffic comprised mainly of voice ToS (AC_VO), the IM-4Int and 5-Int settings for the three-node scenario and IM-2Int for the eight-node scenario will not obtain the best performance.
Evaluating the homogeneous experiments in the three-, five-, and eight-node scenarios (Figures 8A–C), in general, the homogeneous experiments presented better performances than IM settings, with lower end-to-end delay. This demonstrates that IM leads to some delay in the sending and receiving of messages, due to its executions; whoever, considering the flow of messages trafficked by the network, and with the exception of the IM-4Int and IM-5Int experiments for the three-node scenario, which presented delays
Thus, evaluating all of the experiments presented up to this point, two important verifications are necessary for the use of heterogeneous communications in networks composed of high mobility nodes, such as UAVs: 1) Which applied interfaces can provide the best performance, considering the mission application? and 2) What are the most important metrics for collaborative mission success? With these questions in mind, the use of different weights for the most important metrics could provides a good basis for designing a UAV network.
Figure 9 describes the throughput and PDR (Packet Delivery Rate). One can see that the PDR presents different behavior than the throughput.
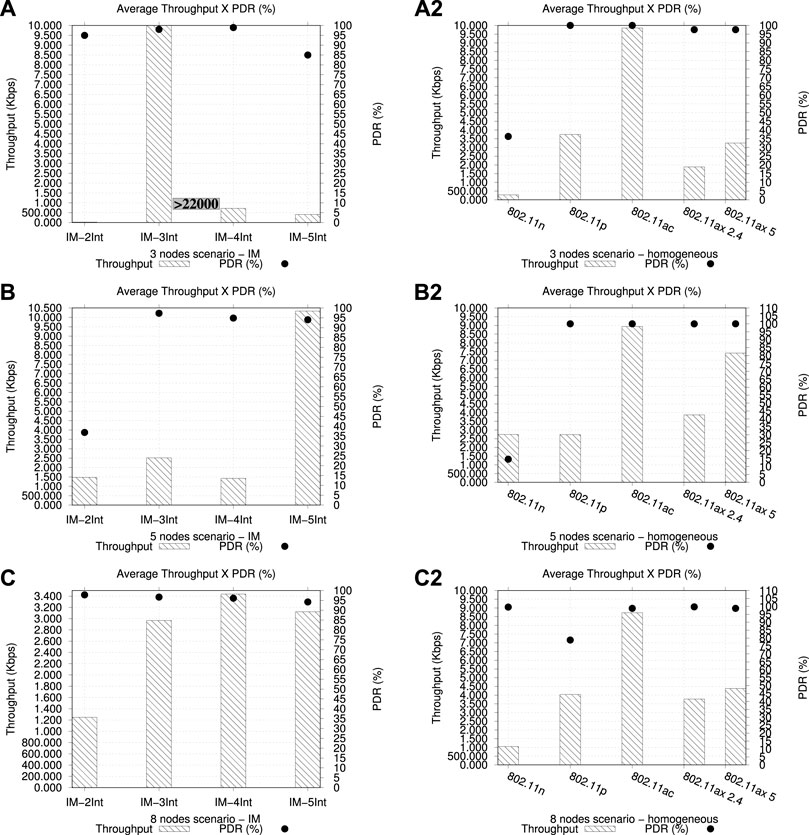
FIGURE 9. Average throughput and PDR obtained by IM experiments: (A) Three-node scenario IM performances; (A2) three-node scenario homogeneous performances; (B) five-node scenario IM performances; (B2) five-node scenario homogeneous performances; (C) eight-node scenario IM performances; and (C2) eight-node scenario homogeneous. performances.
Throughput refers to how fast data is transmitted from source to sink node, through a link successfully established between them. PDR refers to quality of data delivered in this transmission, as many packets can be sent but not received, due to the 802.11 standard multipath transmission technologies, noise, and background interferences, as well as losses related to the attenuation generated as a function of the distance.
In these terms, for the three-node scenario, the IM-2Int experiment presented a throughput of 18.0863 Kbps with 94% PDR, the IM-3Int experiment presented 22,460 Kbps of throughput and 97% PDR, the IM-4Int presented 722.11 Kbps of throughput and 98% PDR, and the last one, IM-5Int, presented 407.84 Kbps of throughput and 84% PDR. In this case, the experiment that presented the best performance, in terms of throughput and PDR analyzed together, was IM-3Int. In comparison with the homogeneous experiments presented in Figure 9A2, all of the interfaces presented better performances than IM-2Int, IM-4Int, and IM-5Int, in terms of average throughput, with the exception of 802.11n, which had 280 Kbps and 36% PDR. The best performance and throughput, obtained by IM-3Int, were twice that of 802.11ac (the best homogeneous performance).
For the five-node scenario, the IM-2Int experiment presented a throughput of 1473.26 Kbps with 36% PDR, the IM-3Int experiment presented 2516.20 Kbps of throughput and 97% PDR, the IM-4Int presented 1418.36 Kbps of throughput and 94% PDR and the last one, IM-5Int, presented 10,332.44 Kbps of throughput and 94% PDR. In this case, the experiment that presented the best performance, in terms of throughput and PDR analyzed together, was IM-5Int; which, if we consider the performance obtained in all the other metrics seen before (even those not presented)—for example, the best performance in terms of amount of packets Figure 6B and average end-to-end delay Figure 8B—was the best when we analyze the set of APP metrics together.
Analyzing the homogeneous performance for the five-node scenario seen in Figure 9B2, all of the interfaces presented better performance than those of the IM settings. The exception was IM-5Int, which present 1.200 Kbps more than the 802.11ac, which had the best homogeneous performance.
For the eight-node scenario, the IM-2Int experiment presented a throughput of 1247 Kbps with 97% PDR, the IM-3Int experiment presented 2967.02 Kbps of throughput and 96.67% PDR, the IM-4Int presented 3436.37 Kbps of throughput and 96.10% PDR and the last one, IM-5Int, presented 3122.05 Kbps of throughput and 94.21% PDR. In this case, the experiment that presented the best performance, in terms of throughput and PDR analyzed together, was IM-4Int; however, this experiment was not the best in several other metrics, as can be seen in Figures 6C, 7C, 8(c).
Regarding homogeneous performances (Figure 9C2), all of the interfaces presented better performances than in IM settings. The best one, 802.11ac, presented 8700 Kbps, which was almost three times higher than IM-4Int (with the best throughput performance). So, for the eight-node scenario, the use of IM does not imply better throughput than the interfaces applied homogenously. In these scenarios, the IM increased end-to-end delay, directly affecting the throughput.
When analyzing according to the mission application, if the amount of quality packets delivered is the most important feature, all the IM settings and (with the exception of 802.11p) all the interfaces applied homogeneously presented good performances; however, if it is necessary to find a configuration with higher throughput, IM-3Int (for a three-node scenario), IM-5Int (for a five-node scenario), and 802.11ac (for all scenarios) would be the best IM settings and interfaces to apply. An important observation is that, although 802.11p presented the best performance, in terms of amount received of different ToS, delay, and latency, it did not present better throughput and PDR, as can be seen from Figure 9C2. This highlights the importance of the definition of metric requirements in network deployment.
Figure 10 presents the amount of valid frames (sent by the source node and confirmed by the sink node) by the size of frames. Thus, in this experiment, only the AC_VI ToS was propagated by the APP layer in the network and the nodes send video frames continuously, compounded as a video trace file. For the three-node scenario, the amount of frames obtained under IM-5Int was higher than in the other experiments, with more than 50,000 frames arriving, which describes a higher volume of data propagated in this experiment. The other experiments presented similar performance, in descending order (from the largest to the smallest volume): IM-5Int, IM-4Int, IM-3Int, and IM-2Int. In this case, the use of IEEE 802.11ax interfaces in IM (5Int, 5 GHz; and 4Int, 2.4 GHz) presented higher frame volumes.

FIGURE 10. Amount of video frames successfully received by the network, considering the size of frames per each IM experiment: (A) Three-node scenario; (B) five-node scenario; and (C) eight-node scenario.
For the five-node scenarios, the experiments sorted in descending order (from the largest to smallest volume of frames propagated) were as follows: IM-3Int, IM-4Int, IM-5Int, and IM-2Int. In this case, the use of IEEE 802.11ac interfaces (IM-3Int) in IM-2Int (the worst performance) led to an increase of 200 times the amount of valid frames received, reaching the best performance. This validates the idea that it is not enough to just add more interfaces but, instead, to evaluate which ones might actually be useful to increase the reliability and quality of network traffic.
Finally, in the eight-node scenario, the descending order was as follows: IM-4Int, IM-2Int, IM-3Int, and IM-5Int. Here, once more, IM-5Int was not the best but, instead, the worst-case for video frame transmissions, highlighting the conclusion obtained for the five-node scenario.
Thereby, two set of conclusions were obtained from these experiments: 1) To establish a network with reliable connections and reliable message delivery in UAV networks, it is necessary to verify which metric will be used to analyze the quality of message transmissions and receptions (presented in this work as amount of packets and PDR), as well as which type of service will be shared by the nodes of the network (presented in this work as the amount of packets, classified into access classes); 2) Taking into consideration the mission requirements, such as delay tolerance (end-to-end delay, in this work), what are the limits of latency for a good transmission without generating continuous disconnections (latency), and how often do the nodes need to communicate (flow of messages, in this work)?
MAC and PHY Results
Figure 11 presents the results of the performance experiments, considering the average latency obtained under distance variation. For this experiment, the delay measurements occurred until the maximum distance possible between nodes was reached. The x-axis presents the number of samples obtained (network productivity) during the experiment, versus the average distance reached between the UAV nodes. Thus, more dots in the curve, indicates more packets propagated by the network using a determined IM setting.
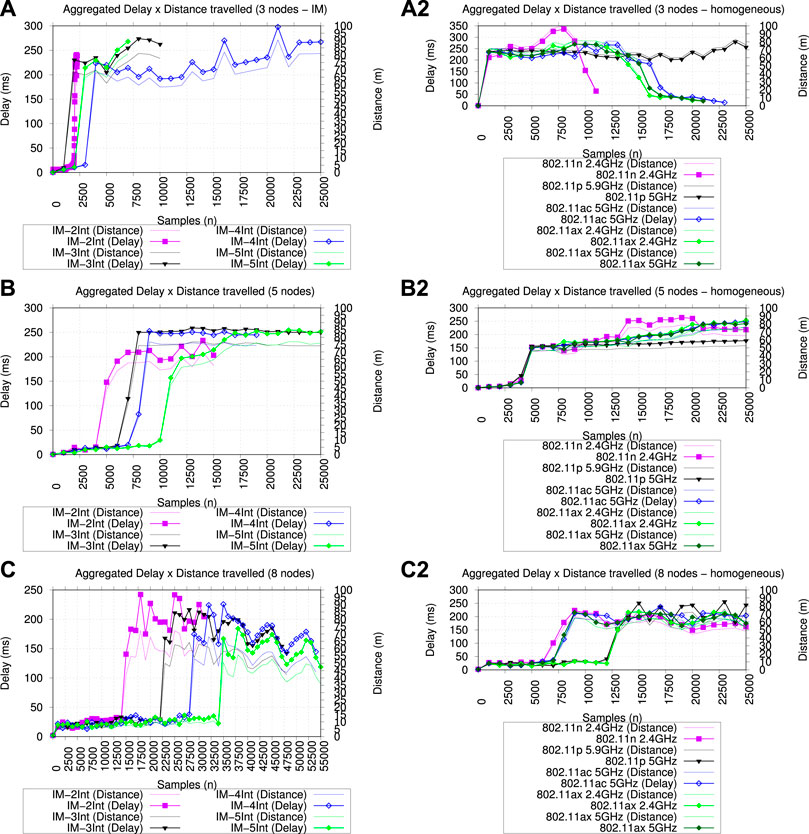
FIGURE 11. Aggregated delay and distance traveled by UAVs for each IM experiment: (A) Three-node scenario IM performances; (A2) three-node scenario homogeneous performances; (B) five-node scenario IM performances; (B2) five-node scenario homogeneous performances; (C) eight-node scenario IM performances; and (C2) eight-node scenario homogeneous performances.
For the three-node scenario IM performance, the IM-4Int experiment presented the best performance, in terms of productivity versus distance reached by nodes. Of course, if the distance increases, the delay also increases, considering the free-space propagation delay. The IM-4Int experiment remained between 200 and 250 ms, when a 300 ms of delay peak is verified with 100 m distance. The reception of some ToS packets could be affected with a delay greater than 200 ms (reached at 70 m); for example, for high quality video transmissions, the maximum delay is 150 ms, as mentioned previously. The worst case was IM-2Int, because the delay performance was close to 250 ms with a smaller number of samples.
Considering the performance achieved by interfaces applied in a homogeneous manner, all the interfaces presented an increase of 250 ms maximum of delay with an increase in distance between nodes. When the nodes reached 70 m, the delay was maintained at this rate, with the exception of the 802.11n interface, which maintain the link between nodes up to 100 m with 350 ms of delay (high delay, unfeasible in multi-UAV scenarios). In this case, the best performance was obtained by 802.11p, which maintained the multi-UAV communication link with 280 ms delay at 70 m between nodes, allowing for 25,000 samples to be received. In contrast, the maximum samples received by the other interfaces was around 22,500, with average distance of 60 m. Once more, the worst behavior was that of 802.11n using 2.4 GHz, receiving only 11,000 samples at 260 ms when the distance is 70 m.
In comparison with IM different settings, using the best performance IM-4Int and 802.11p, the IM was capable of maintaining the communication link with a maximum of 260 ms delay up to 80 m distance between nodes, with 25,000 samples.
For the five-node scenario, IM-5Int presented the best performance, with a delay of around 15 ms when the nodes had distance up to 15 m and generating 10,000 samples, with an ascendant curve formed between delay versus distance: the delay reached 250 ms with 10,000 samples at 75 m of distance between nodes, allowing for a higher number of samples with lower delay aggregated. The worst case was observed in the IM-2Int experiment, which presented an ascendant curve between 2500 and 5000 samples reaching 200 ms of delay with a maximum amount of 15,000 samples. A similar performance was obtained by IM-3Int and IM-4Int, highlighting the IM-3Int experiment which started with an increase in delay with 6000 samples reaching 250 ms of delay, maintaining communication up to 84 m.
Figure 11B2 presents the homogeneous performance in the five-node scenario. All of the interfaces presented an increase of 150 ms when the distance was more than 50 m between nodes, presenting 5000 traffic samples. In this case, using 50 m as a reference distance, the IM presented performances of 120 ms (IM-3Int), 80 ms (IM-4Int), and 30 ms (IM-5Int) delay, up to 55 m, with
For the eight-node scenario, IM-5Int presented the best performance, in terms of delay reaching 180 ms maximum in 75 m for 37,500 samples; as well as in terms of the amount of samples being higher than 55,000. The IM-4Int experiment presented the second-best performance, in terms of the amount of samples (53,000). In terms of the delay, this experiment showed two peaks at 225 ms for 32,500 and 35,000 sample, compared to IM-3Int, which presented 210 ms as a maximum delay at 47,500 samples.
Figure 11C2 presents the homogeneous performance in the eight-node scenario; in which, the interfaces allowed for delay samples up to 70 m of distance between nodes with low delay fluctuations and a maximum of 200 ms delay. The 802.11 p experiment presented peaks at 250 ms up to 70 m. In this context, the interfaces applied in a homogeneous manner presented better performance, in terms of delay (several samples with 200 ms) and communication range between nodes (70 m), than IM interface combinations in more sparse scenarios. The IM allows for a communication range of up to 60 m, presenting some delay peaks of 245 ms, but the adaptability of the IM solution allowed the network to receive around 55,000 samples, compared to 25,000 in homogeneous experiments. This implies more communication time between nodes.
Analyzing the three scenarios, it possible to see that, close to 100 m between nodes, more delay peaks were verified; this could indicate a possible communication range limit of IM employed with the interfaces used by this paper. An interesting phenomenon was also observed, considering the increase of density of nodes in the network. With more interfaces and nodes applied in the scenario, a lower average delay and more samples were achieved, until starting the ascendant curve, as seen when comparing Figure 11C against Figure 11A. The same behavior occurred for the homogeneous experiments.
Figure 12 presents the aggregated samples of Rx power obtained by nodes during the trajectories. A sharp curve describes the intensity of samples received of average signal power obtained by the nodes. Of all the scenarios, IM-5Int presented the best performance, maintaining reception between −40 dBm and −70 dBm, which represents a good reception power for 802.11 protocols.
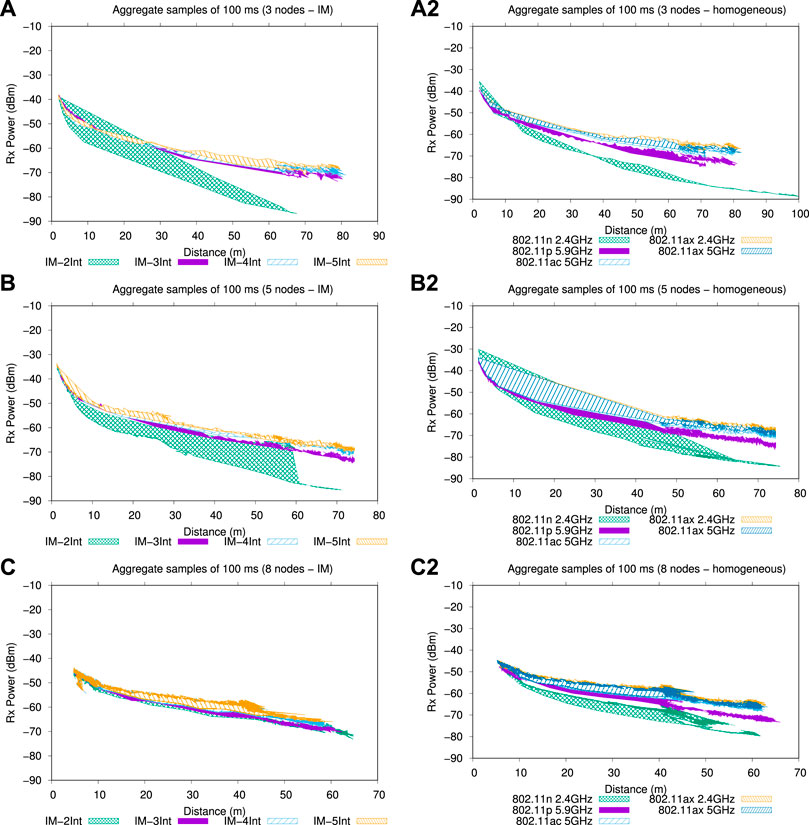
FIGURE 12. Aggregated samples of Rx Power performance in intervals of 100 ms for each IM experiment: (A) Three-node scenario IM performances; (A2) three-node scenario homogeneous performances; (B) five-node scenario IM performances; (B2) five-node scenario homogeneous performances; (C) eight-node scenario IM performances; and (C2) eight-node scenario homogeneous performances.
The IM-2Int experiment was the worst combination for three- and five-node scenarios, although presenting −70 dBm to −88 dBm between 30 m and 70 m, with a larger interval of reception of signal packets (the nodes become less time-audible). In this way, the IM-2Int experiment presented a more sparse curve.
The stable behavior obtained from IM-3Int, IM-4Int, and IM-5Int experiments shown in the three-, five-, and eight-node scenarios, with less samples fluctuations, make these set-ups more suitable for networks composed of high-mobility nodes with different speeds, leading to higher reliability in transmissions.
Figure 12A2–C2 present the performance of IEEE standards applied in a homogeneous manner. These figures highlight the IM attempts to define the best standard to apply, observing that the IM experiments presented more full curves (i.e., more beacon frames received). In terms of range, the IM presented a similar range of communication as homogeneous experiments. This behavior was expected, as the IM preserves the standard protocols in default mode. In case of homogeneous performance, 802.11n presented a high signal degradation above 40 m distance between nodes, while the other interfaces were capable of maintaining the reception power between − 50 dBm to − 70 dBm up to 80 m for three-node, up to 75 m for five-node, and up to 65 m for eight-node scenarios. Therefore, increasing the number of nodes caused a decrease in the communication link intensity.
Figure 13 presents the average aggregated loss obtained by nodes during the trajectories. In this case, a greater number of dots describes a greater amount of loss samples obtained by communication attempts between nodes, reflecting the results shown in Figure 12: for each sample of Rx power, there exists a sample of loss obtained. With the loss results, it is possible to evaluate how much the nodes were inside the communication range, as described by the presence of dots: with more dots present, the lower the quality of the signal received.
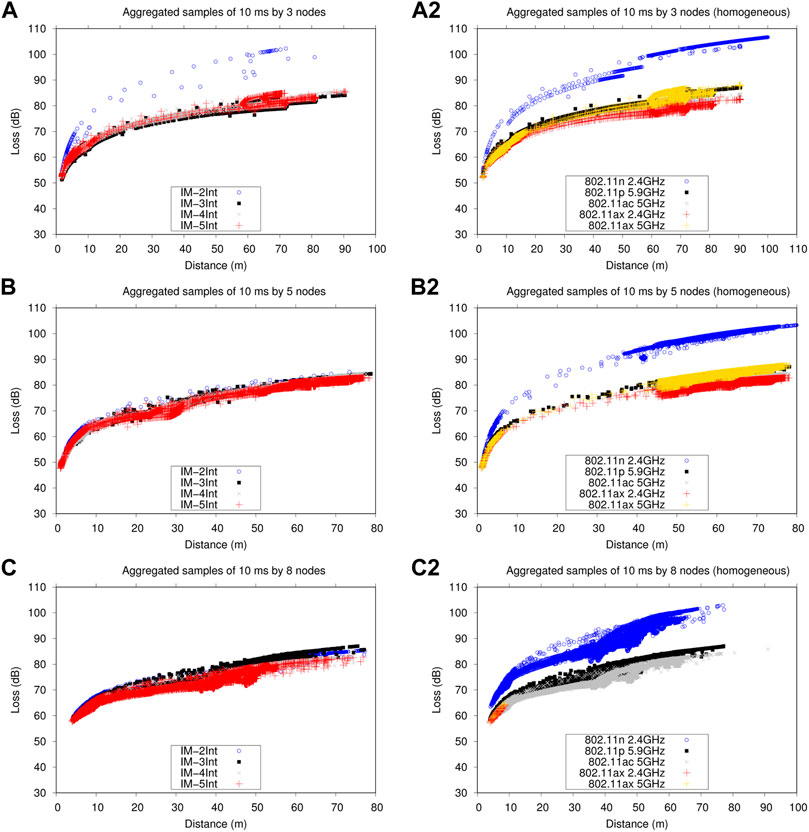
FIGURE 13. Aggregated samples of Loss performance in intervals of 10 ms per each experiment: (A) Three-node scenario IM performances; (A2) three-node scenario homogeneous performances; (B) five-node scenario IM performances; (B2) five-node scenario homogeneous performances; (C) eight-node scenario IM performances; and (C2) eight-node scenario homogeneous performances.
For the three-node scenario, IM-2Int presented 60–100 dB of signal attenuation loss, which indicates an excellent performance, up to 100 m of distance between nodes; but at the cost of fewer transmission attempts between them, as identified by the smaller amounts of dots represented in Figure 13A. This behavior is not ideal for missions that need to maintain continuous traffic in the network. In this case, IM-3Int presented the best performance, considering the quality of reception with samples between 50 and 80 dB, allowing for reception up to 90 m between nodes. For homogeneous experiments (Figure 13A2), 802.11n presented the same behavior as IM-2Int, but with more samples received. This indicates that, in fact, the 802.11n standard suffers in high-mobility scenarios, reaching
For the five-node scenario IM-3Int, -4Int, and -5Int presented similar performance, highlighting IM-3Int in terms of low density of dots, which represents less lost samples received, in terms of the loss indices. In this case, balancing between loss dots and levels, in ascending order of amount of samples, we have: IM-2Int, IM-3Int, IM-4Int, and IM-5Int. The same order occurred for the eight-node scenario, indicating that IM-2Int was the best, in terms of loss samples versus loss level, allowing for communication up to 78 m while maintaining loss indices up to 80 dB. In this case, 802.11p presented the best performance, in terms of loss intensity and amount of samples, considering the homogeneous experiments, as shown in Figure 13B2. The linear curve presented in the loss experiments represents more stability in the link, maintaining a loss level up to 80 dB (theoretical limit of IEEE standards loss, considering 100 m distance between nodes).
For the eight-node scenario, in terms of homogeneous performance, the interface 802.11ac presented the lowest maximum loss level of 75 dB, while 802.11p presented a more linear curve, with more loss samples received. 802.11 n presented the worst performance, showing fast signal degradation.
It important to note that, for 802.11 communications with up to 100 m between nodes without relays or repeaters in a free-space transmission, the theoretical calculated loss is 80 dB (Geier, 2010; Ribeiro et al., 2021). Observing all graphs presented in Figure 13, with the exception of the IM-2Int experiment for the three-node scenario, all IM combinations obtained loss values up to theoretical one, but with shorter distances (75, 60, and 55 m for three-, five-, and eight-node scenarios, respectively.
Figure 14 presents the performance of RSSI and Noise aggregated samples received during the experiments. This result highlights the background noise received by nodes. Here, it is possible to see the time interval in which the signal strength received by the nodes is decreased with increasing distance between them. We use, as reference, the maximum duration of the experiments, considering the trajectory from the departure of the UAVs (start point) up to their arrival, of: 132 s (three nodes), 140 s (five nodes), and 150 s (eight nodes).
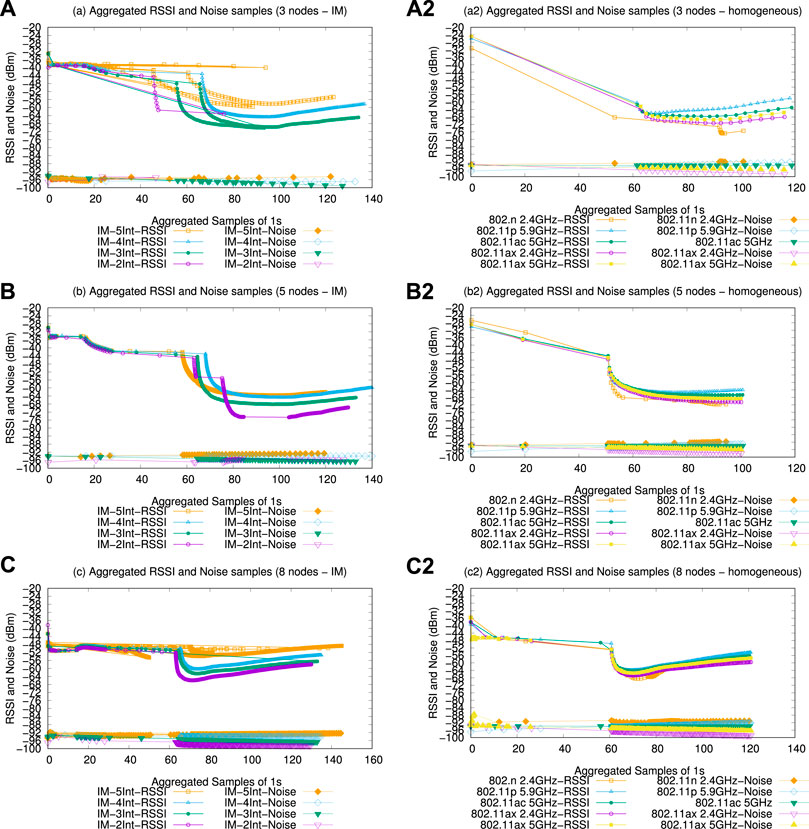
FIGURE 14. Aggregated samples of RSSI and Noise performance in intervals of 1 s per each experiment: (A) Three-node scenario IM performances; (A2) three-node scenario homogeneous performances; (B) five-node scenario IM performances; (B2) five-node scenario homogeneous performances; (C) eight-node scenario IM performances; and (C2) eight-node scenario homogeneous performances.
Thus, it is clear that, in all scenarios, that if a UAV is closer to their maximum of distance from the base, a significant decrease in RSSI will be observed. In all scenarios, this time interval is approximately half of the experiment, where the RSSI curves describes descendent curves.
For the three-node scenario in Figure 14A, IM-4Int took longer to suffer the impacts of distance decreasing the RSSI, maintaining −64 dBm after 70 s. The second experiment that took a longer time to present RSSI decrease was IM-3Int (after 60 s). These two experiments also showed a higher sample volume, with thicker lines.
In general terms, all of the experiments presented very good RSSI, in the range of − 32 to − 68 dBm, for the three-node experiment scenario, with controlled noise in range of − 92 to − 96 dBm.
For the five-node scenario, in the first half of the simulation, a significant decrease in RSSI was observed also, with IM-2Int, IM-3Int, IM-5Int, and IM-4Int in ascending order of RSSI decrease. For this scenario, IM-4Int maintained the received signal strength in the range − 36 to − 64 dBm. In this scenario, the presence of intermediary waypoints implied more noise detected after 60 s, as these waypoints cause more concurrence in the frequency spectrum, as the UAVs remained within each others communication range longer, presenting UAV trajectories with 35 m distance between nodes. Furthermore, the noise range obtained did not imply a significant decrease of signal reception.
For the eight-node scenario, the best performance was in the IM-5Int experiment, which presented less fluctuations of the RSSI, ranging from − 48 to − 64 dBm, thus maintaining communication with an excellent RSSI, even with more noise received ( − 92 dBm). All of the IM experiments allowed for greater connectivity of the nodes during the flight with an extensive amount of samples received.
This suggests the better performance obtained by heterogeneous IM in scenarios with more sparse routes (with distances greater than 35 m between nodes), when we compare the performances under the UAV routes defined in the three- and five-node scenarios. The network is probably more susceptible to co-channel interference or medium sharing background noise under shorter distances.
The intensity of the connection in levels can be verified from the result obtained by the RSSI network minimum, subtracting its average values of − 52 dBm (three nodes), − 60 dBm (five nodes), and − 56 dBm (eight nodes) from the average noise obtained: − 94, − 92, and − 96 dBm, respectively. Therefore, on a scale of 0 to − 100 (with 0 meaning the best signal possible and − 100 indicating the worst), the IM presented an RSSI value of around 40, which is generally considered excellent for most kind of network ToS.
Regarding the homogeneous performances for three-, five- and eight-node scenarios, it can be seen that a linear and descendent curve of decreasing RSSI was obtained for the five interfaces in the three scenarios. The IM settings allowed for smoothing in the descendent curves, maintaining the connections with − 52 and − 44 dBm of reception (IM-3Int and IM-4Int experiments, respectively) in the first half of the experiment, compared to − 64 dBm for the homogeneous 3-node scenario experiments.
The same behavior was seen in the five- and eight-node scenarios, where the IM setting maintained − 48 dBm up to 65 s. In this case, for homogeneous performance within 50 s of the experiment, the RSSI decreased to − 68 dBm for the five-node scenario, and within 60 s for the eight-node scenario.
In all experiments, when passing 60 s (i.e., half of the experiment), the video streaming started and the curves presented a rapid decrease of RSSI, reaching between − 68 and − 72 dBm. In conclusion, the AC_VI ToS packets require more data transmissions per second: the curves present an apparent thickening, which implies more samples of RSSI causing stress in the communications link. This causes degradation of the signal, in terms of coexistence of transmissions, describing also thicker noise curves in the second half of the experiment. The tdicker curves describe more incidence of noise sensed during the experiments. In general, the IM presented lower incidence with lower variations, which can be seen more clearly when comparing the performances for eight-node scenarios up to 20 s.
In general, the Noise was maintained with maximum of − 92 dBm, which represents a low incidence of medium noise sensed by the network (considering the − 94 dBm noise floor).
Figure 15 presents the RSSI obtained by IM validations. In this case, the curves represent the RSSI variations when the IM chooses a new communication interface (represented by samples of 0 dBm). Here, it is possible to see the number of IM interventions during the experiment. In this case, this experiment demonstrated which IM experiment led to less changes in the network, and how much this can imply the degradation of network performance. It is noteworthy that these samples were collected only in the IM validation intervals (1 s), and the 0 dBm samples do not represent total disconnection from the network; that is, a user would not be aware of the interface change.
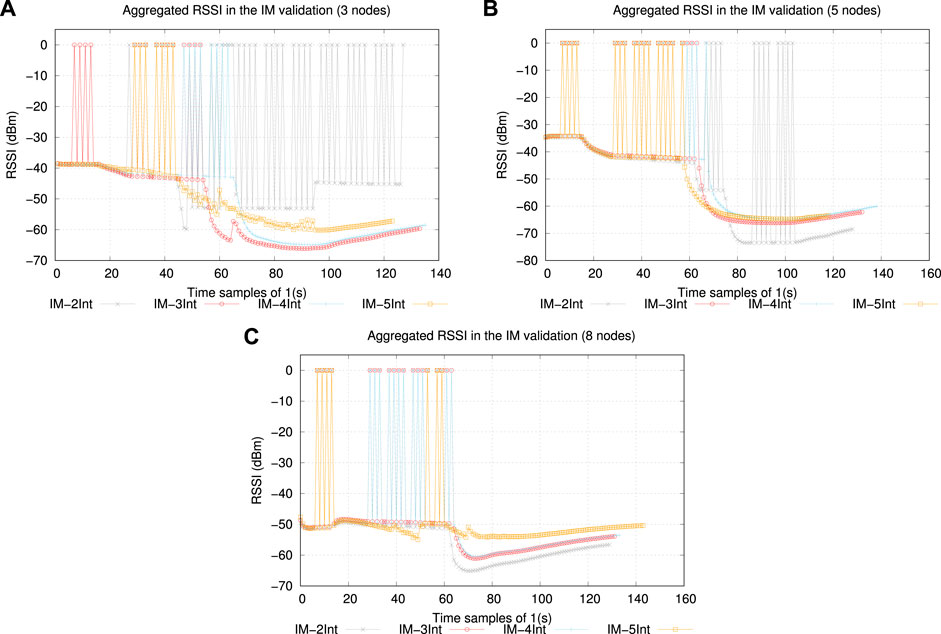
FIGURE 15. Aggregated samples of RSSI performance in intervals of 1 s, considering the IM validation effects per each IM experiment: (A) Three-node scenario; (B) five-node scenario; and (C) eight-node scenario.
Analyzing all scenarios, the three-node scenario presented a greater amount of interface switching, where the IM-2Int experiment required more switching than the IM-5Int experiment.
These variations demonstrate that the IM attempts to adjusts the network for better performance, but a greater amount of switches could imply less signal samples as beacon frames; this type of traffic is composed of short-packets, which means low recovery rate by the node receiver. This behavior can be seen in Figure 14A, where IM-2Int presents a thinner curve with a broad loss samples interval, as seen in Figure 13A.
For the five-node scenario, IM-2Int also presented more interface manager switchings, describing attempts to maintain the RSSI at satisfactory levels (up to − 70 dBm). The performance, in terms of signal frames, is verified in Figure 13B. The best performances in these scenario, sorted in descending order of RSSI performance, were: IM-4Int, which allowed communication up to 141 s with average RSSI of − 65 dBm; followed by IM-3Int, with the same RSSI average up to 134 s; and, finally, the IM-5Int experiment, which kept the RSSI at − 62 dBm up to 121 s.
For the eight-node scenario, the best performances were in the order of: IM-5Int, as it preserved the RSSI level up to 141 s at − 50 dBm; while IM-4Int and IM-3Int presented similar performance, maintaining the RSSI level of − 55 dBm up to 130 s. The worst case was also verified in the IM-2Int experiment, reaching − 65 dBm up to 126 s. In terms of number of IM interventions (switches) in all scenarios, the IM-2Int experiment presented more impacts in the aggregated RSSI during its switches and the IM-5Int implied less effects. In this case, more interfaces implied a lower amount of network interventions.
Table 2 shows the IM-aggregated decisions with interval of 1 s. The IM decisions are composed of the aggregated average of decisions, of which the aggregate decision is composed, with IM considered in most decisions.
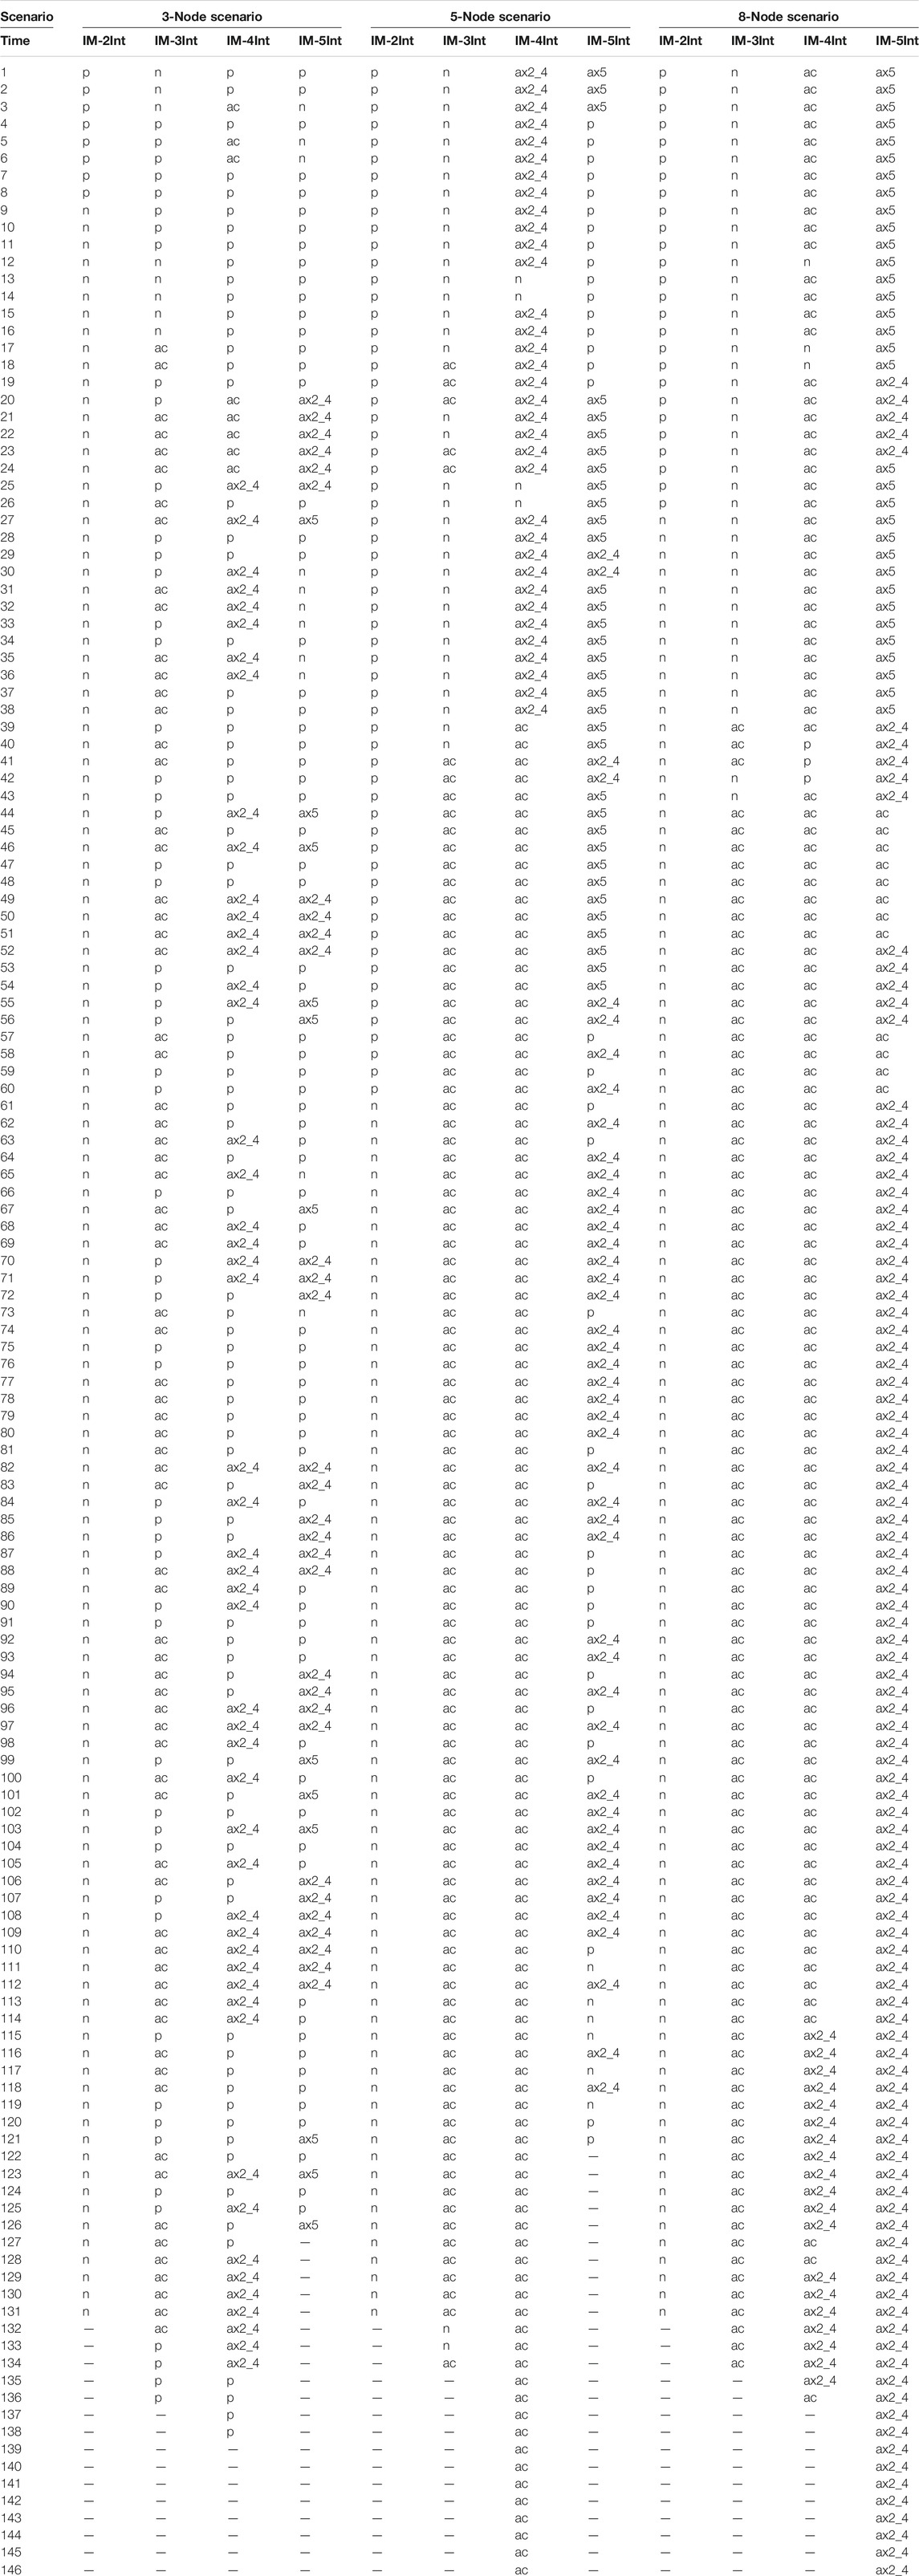
TABLE 2. IM validations for three-, five, and eight-node scenarios with 1 s sample interval.
Figure 16 presents the SNR obtained by the IM experiments for the three experimental scenarios by simulation duration. The SNR indicates the effective signal sensed by receiver nodes. For the three-node experiment, the best IM performance was obtained by IM-3Int, reaching 0.7 when the ToS changed to video streaming (60 s). In this scenario, with the exception of the 802.11n 2.4 GHz experiment, which presented 0.75 at 50 s, all other interfaces presented an increase, with peak of 0.7 at 60 s. The homogeneous performances in this scenario presented a faster increasing of SNR than the IM experiments, but at the cost of smaller volume of samples (slimmer curves).
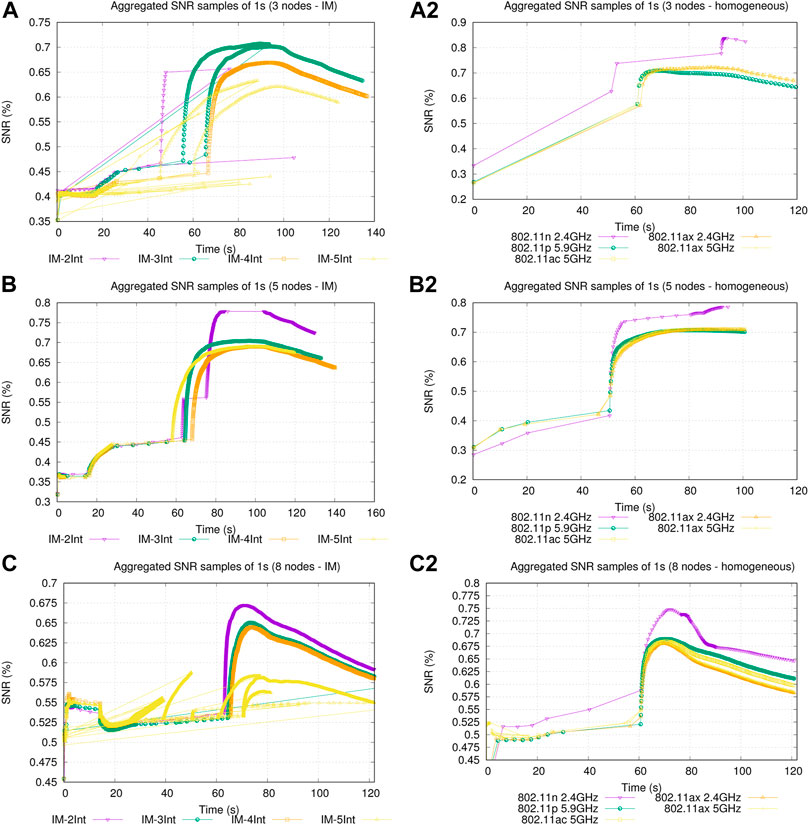
FIGURE 16. Aggregated samples of SNR performance in interval samples of 1 s per each experiment: (A) Three-node scenario IM performances; (A2) three-node scenario homogeneous performances; (B) five-node scenario IM performances; (B2) five-node scenario homogeneous performances; (C) eight-node scenario IM performances; and (C2) eight-node scenario homogeneous performances.
For the five-node scenarios, the SNR reached 0.78% of signal effective SNR in 80 s, against 0.75% obtained by 802.11n 2.4 GHz in the homogeneous experiments. Furthermore, the homogeneous interfaces presented SNR
For the eight-node scenarios, all of the IM settings presented a decrease of 0.025 between 0 s and 20 s; where, according to Table 2, the IM switched sometimes from IEEE 802.11p 5.9 GHz to interface 802.11ax 2.4 GHz. However, after 60 s, an increase by 0.25% occurred when the IM choose IEEE 802.11p for the most of nodes, in order to maintain this rate. A similar behavior occurred in five-node scenarios when IM-5Int had an early increase of SNR in the 60 s sample; additionally, according to Table 2, the interface manager switched between these same interfaces.
For both scenarios, the best performance was obtained with IM-2Int, which reflects the performances of 802.11n and 802.11p, as seen in Figure 16B2,C2. The worst performance was obtained by IM-5Int in all experiments, which presented very high fluctuations in the IM setting experiments.
This could represent that the interface added in this IM setting inserts more instability in the signal caused by shared medium with other interfaces operating at the same frequency. But, this behavior was also seen between 0 and 20 s in the eight-node scenario homogeneous performance for 802.11 ax 5 GHz and 802.11 ac 5 GHz, which could represents a protocol feature in node association of these protocols. These curves are both plotted in the same color, in order to clearly verify the co-channel interference and show that the 802.11ax 5 GHZ interface presented more susceptibility to interferences than 802.11ac 5 GHz, which presented more stable behavior.
802.11p 5.9 GHz and 802.11ac 5 GHz presented good SNR performances in these homogeneous scenarios, as well as when used in heterogeneous IM combinations, providing better signal reception efficiency. Thus, these combinations of interfaces could be favorable for better transmission rates, considering similar application scenarios. Such switches are a very powerful feature of heterogeneous networks to maintain or increase the communication intensity, especially if the IM or a software-defined radio has different frequencies available as a resource. In terms of the amount of samples, packets, and flow of messages, the IM was capable of presenting better performance, improving or maintaining the network connectivity to avoid load fluctuations and signal interruptions.
Related Works
To present a theoretical comparison of the proposed IM with other related works, thus highlighting the effectiveness of the IM, four relevant related works were chosen. These works were selected As they also consider multi-UAV communication systems provided by software solutions employing WLAN IEEE standards. Other similar features include the numbers of UAVs (up to 5) used in free-space experimental scenarios, and the use of U2U communications sending more than one type of service. These works also present performances in real test-bed or simulated scenarios developed using NS-3. The works using real test-beds were chosen to prove that this solution was tested in the close-to-reality simulation scenarios.
The first work analyzed was Zhou et al. (2015). The authors proposed an aerial–ground cooperative vehicular networking architecture, in which multi-UAVs are dispatched to areas of interest to collect information and transmit it to ground vehicle networks. The multi-UAVs could also be used as relay nodes to expand the range of ground communications. The experimental scenarios were conducted using two quadcopters (UAVs) cooperating with three ground vehicles in a real test-bed. The UAVs presented heterogeneous communication with pre-defined ToS, using IEEE 802.11 a (Wi-Fi) for image transmissions and IEEE 802.15.4 (Zigbee) for control message delivery, both in execution time. The first UAV collected images of the road situation ahead, while the second one relayed the information to the guided vehicle. This work presented results from both sub-networks: A2G (Aerial to Ground) and A2A (Aerial-to-Aerial). For the proposed comparison, we considered only the A2A communication, which means the same of U2U.
Shi et al. (2019) is the second work. In this study, the authors conducted experiments to evaluate the performance of the IEEE 802.11p standard applied in vehicular networks using one-hop communication in comparison ti a DAVN (Drone-Assisted Vehicular Network) approach. DAVN is a software-defined solution which decouples the control plane and data plane in an SDN. DAVN employs 2.4 GHz communication between drones and uses the IEEE 802.11 p with a frequency of 5.9 GHz to relay data to the vehicular network. The DAVN architecture naturally forms a group of controllers, where drones and vehicles can perform as SDN switches working on the data plane. The experiments were conducted by generating trace files for vehicles in a traffic generator, processing these data in NS-3 readable format, and then attaching the mobility points to each vehicle node and drone in NS-2 to perform evaluations.
Yanmaz et al. (2018) used three UAVs in several real-world applications with the aim to represent different UAV applications under several demands and constraints. They applied a centralized network manager when real-time data exchange is not critical, and a hybrid manager when the progress of the event and status of a target need to be sent by UAVs continuously to a base station. In case of a hybrid manager, the UAVs reposition themselves to form a communication relay chain propagating the target image (e.g., search-and-rescue missions) from the UAV that detects the target to base station, thus expanding the network range of communication. The UAVs routes varied between 950 and 1350 m. The authors applied IEEE 802.11 a, 802.11 n, 802.11 ac, 802.11 a, and 802.11 s, according to the considered topology (single- or multi-hop), evaluating the performances of combined and single standards to determine the associated throughput, where the main task was to send images to a base station. The images were about 3 MB in size, and captured every 10–15 s. The best performance obtained was with 802.11 a plus 802.11 s (802.11 a in mesh mode), as using mesh mode allowed the relay chain to reach 900 m from the base station with 5 Mbps throughput, as shown in Table 3.
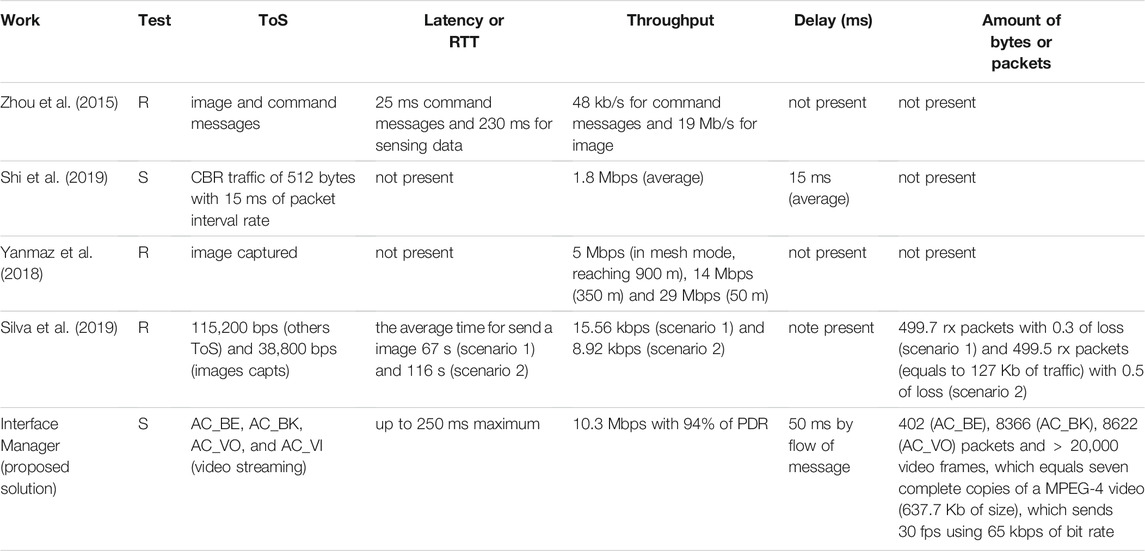
TABLE 3. Comparison of theoretical performance obtained by similar solutions.
The last work used for the comparison was (Silva et al., 2019). In this study, the authors presented a real test-bed consisting of a communication network for a squadron of multi-UAVs used for scanning a rocket impact area. The authors proposed a communication protocol using XBee sensors, which employ the ZigBee protocol to transmit images and information in real-time from U2U and U2B (UAV to Ground Base Station). They developed a system using the client server model which applies the transmission of images processed by a computer vision sub-system and other ToS; this software was designed to meet the requirements imposed by the image processing sub-system and to operate on a network composed of XBee sensors fragmenting and sendng data safely, thus increasing the reliability of the delivery of packets. The tests were performed using DJI Phantom three quadrotors in two real experimental scenarios. Scenario 1 was composed of two UAVs running as end-devices and one UAV running as a router, while scenario two featured two UAVs as end-devices and two UAVs as routers. The results obtained by peer-to-peer (U2U) communications were used for comparison.
Table 3 presents four criteria of comparison: The kind of evaluation tested (real, R; or simulated, S), the type of service evaluated (ToS), the average latency or RTT (Round-trip Time), and throughput, delay, and amount of bytes or packets trafficked. These criteria were defined according to the metrics evaluated by these works, and were used for comparison with the proposed interface manager. The interface manager was evaluated using seven application metrics (amount of packets, latency, end-to-end delay, throughput, PDR, amount of valid packets, and size of video frames) and seven MAC and PHY metrics (aggregated delay, distance traveled, Rx power, loss, RSSI, noise, and SNR), which is a differential aspect of this work. Another important differentiating factor is the performance analysis of a multi-UAV system considering four different access classes of ToS (AC_BE, AC_BK, AC_VO, and AC_VI—that is, video streaming). The IM experimental performance chosen for comparison with these related works was the five-node scenario, as the other works used a similar number of UAVs reaching similar distances between UAVs during the flight. In this case, the best IM interface combinations for each evaluation metric was used, as the IM manager employs the flexibility of adding and removing interfaces, thus comprising a modular solution.
From Table 3, it is possible to verify that the IM latency performance, describing up to 250 ms maximum, was very close to real scenario presented by (Zhou et al., 2015), with 230 ms for sensing data, and had better performance than the real scenario present by (Silva et al., 2019), which described 67–116 s for sending images using 802.15.4. Considering the throughput, the IM also presented realistic performance, with 10.3 Mbps on average against 48 kb/s to 19 Mb/s obtained by (Zhou et al., 2015), and 14 Mbps at 350 m between UAVs described by (Yanmaz et al., 2018).
The IM presented higher delay than the solution proposed by (Shi et al., 2019). This difference was due to the authors using packets with size up to 512 bytes maximum and a 15 ms packet interval rate, compared to 1500 byte packet size with interval samples of 250 ms in the IM experiments. Comparing the interface manager to the solution of (Silva et al., 2019), in terms of amount of bytes or packets trafficked, (Silva et al., 2019), presented 499.7 of reception of packets, requiring a lower baud rate of 115,200 bps. Using, as comparison, the AC_BE packets and AC_BK packets sent by the interface manager, which are traffic composed of short packets (up to 144 bytes), the IM presented 402 and 8.366 packets successfully received, respectively. This result showed some similarity of performance, in terms of short packets successfully trafficked, considering only AC_BE traffic. In terms of AC_VI, the performance of the interface manager was higher than this solution: 637 Kb with 94% PDR (IM) vs. 127 Kb with 99.9% PDR. There was a difference between the results, as the traffic of IM was composed by video frames, while that in (Silva et al., 2019) was composed of image captures; however, these performance results serve as parameters to validate the effectiveness of the interface manager among real and simulated solutions.
A practical comparison with other works is very difficult in the simulation field as, for this solution, we used an integration of NS3 and Gazebo tools through a framework composed by ROS topics, which includes time synchronization during execution. This allows multiple instances of UAVs to interact in the same scenarios at running time. Therefore, to propose a fair practical comparison with other works, the solutions will need to be developed in these same conditions, mainly using the NS-3 as a tool for network development and Gazebo to attain mobility settings in UAV nodes. This will be verified in a future work.
Conclusion
In this paper, we presented an extensive analysis of different communication interface combinations applied within a heterogeneous interface manager. The use of heterogeneous communication scenarios presented the best performance in several metrics in comparison to interface applied in homogeneous way, in terms of improved reliability and quality of communication for UAV networks. In order to propose a validation regarding the type of service, packages composed of different classes of service were sent throughout the execution of the experiments, in order to facilitate analysis regarding the different types of service that can be applied in these networks to meet the objectives of a given mission. Our main conclusion was that, depending on the type of service to be carried by the network, different network requirements are necessary and, in order to meet these requirements with reliable connections and quality of service, it is necessary to validate the main network metrics (e.g., latency, throughput, Rx power) that will culminate in the best traffic performance. The IM settings was capable to present less susceptibility to noise and interference from medium and fading effects in short-packet transmissions, better proportion of latency × amount o data flow received by network, achieving the lowest latency and the higher throughput with major payload successfully delivered than all of the interfaces applied in a homogeneous manner. In general terms, the IM present more flexibility and adaptability for UAV communications scenarios reaching better performances. Some interfaces combinations inputs more better results than others, but in macro-terms the IM was provide more adaptability in network, even leads some extra delay in the sending and receiving of messages. Among the homogeneous performances the 802.11 ac and 802.11 p interfaces presents better performance in these scenarios in terms of application metrics, and 802.11ax 2.4 GHz and 802.11p for MAC and PHY metrics, describing a very good performances for UAV networks. So, 802.11p is a good homogeneous alternative when it need to give good performances in several APP and MAC and PHY metrics.
Another important conclusion is that, depending of interfaces applied in heterogeneous communication, a greater number of interfaces added to nodes does not imply better performance; instead, the combinations which can be more propitious for a given traffic scenario should be determined, considering the mission constraints. In future research, a neural network will be developed in order to apply weights for medium-sensed metrics, according to the type of service, for a new means of comparison of performances, considering more stressful scenarios in terms of the distance between nodes.
Another future opportunity of improving communication between UAVs is to incorporate a cooperative MIMO Technique (C-MIMO) in the interface manager (de Freitas et al., 2012; Marinho et al., 2013). C-MIMO presents a significant increase in the communication range, throughput, and establish communications among distant nodes in a wireless sensor network, keeping the WSN connected for a much longer time minimizing the energy consumption for Long Distances Communications. So, this could increase the UAVs communication stability, reaching longer distances than presented by this work.
Data Availability Statement
The original contributions presented in the study are included in the article/Supplementary Material, further inquiries can be directed to the corresponding author.
Author Contributions
Investigation methodology, IM and LBB; Interface manager design and experimentation, LMBR.
Funding
This research was funded by the Federal Government of Brazil through the Coordination for the Improvement of Higher Education Personnel (CAPES) and by the State Government of Amazon through its Research Foundation (FAPEAM) using the notice of postgraduate scholarships n. 006/2018 –PROPG-CAPES/FAPEAM.
Conflict of Interest
The authors declare that the research was conducted in the absence of any commercial or financial relationships that could be construed as a potential conflict of interest.
Publisher’s Note
All claims expressed in this article are solely those of the authors and do not necessarily represent those of their affiliated organizations, or those of the publisher, the editors and the reviewers. Any product that may be evaluated in this article, or claim that may be made by its manufacturer, is not guaranteed or endorsed by the publisher.
Acknowledgments
The authors thank the Brazilian Coordination for the Improvement of Higher Education Personnel (CAPES), the Research Foundation from the State Government of Amazon (FAPEAM), the Federal University of Santa Catarina (UFSC), the Federal University of Rio Grande do Sul (UFRGS), and the Federal Institute of Amazon (IFAM) Manaus Distrito-Industrial campus.
Supplementary Material
The Supplementary Material for this article can be found online at: https://www.frontiersin.org/articles/10.3389/ffutr.2021.755998/full#supplementary-material
References
Alpern, N. J., and Shimonski, R. J. (2010). “Chapter 7 - Wide Area Networking,” in Eleventh Hour Network+. Editors N. J. Alpern, and R. J. Shimonski (Boston: Syngress). 107–119. doi:10.1016/B978-1-59749-428-1.00011-4
Batista da Silva, L. C., Bernardo, R. M., de Oliveira, H. A., and Rosa, P. F. F. (2017). “Multi-UAV Agent-Based Coordination for Persistent Surveillance with Dynamic Priorities,” in 2017 International Conference on Military Technologies (ICMT) (Brno, Czech Republic: IEEE), 765–771. doi:10.1109/MILTECHS.2017.7988859
Bekmezci, I., Sahingoz, O. K., and Temel, S. (2013). Flying Ad-Hoc Networks (FANETs). Ad Hoc Netw. 11, 1254–1270. doi:10.1016/j.adhoc.2012.12.004
Bekmezci, I., Sen, I., and Erkalkan, E. (2015). “Flying Ad Hoc Networks ( FANET ) Test Bed Implementation,” in 2015 7th International Conference on Recent Advances in Space Technologies (RAST) (Istanbul, Turkey: IEEE), 665–668. doi:10.1109/RAST.2015.7208426
Chang, B. Y., Chen, Y. C., and Wang, L.-C. (2018). Design and Implementation of UAV-Enabled Flying Access Points. Hualien, Taiwan: IEEE, 3–4. doi:10.1109/wocc.2018.8372714
Consortium, N. (2019). NS-3 a Discrete-Event Network Simulator for Internet Systems(version 3.30.1). [Dataset].
de Freitas, E. P., da Costa, J. P. C. L., de Almeida, A. L. F., and Marinho, M. (2012). “Applying Mimo Techniques to Minimize Energy Consumption for Long Distances Communications in Wireless Sensor Networks,” in Internet of Things, Smart Spaces, and Next Generation Networking. Editors S. Andreev, S. Balandin, and Y. Koucheryavy (Berlin, Heidelberg: Springer Berlin Heidelberg), 379–390. doi:10.1007/978-3-642-32686-8_35
Durisi, G., Koch, T., and Popovski, P. (2016). Toward Massive, Ultrareliable, and Low-Latency Wireless Communication with Short Packets. Proc. IEEE 104, 1711–1726. doi:10.1109/JPROC.2016.2537298
D’Urso, F., Santoro, C., and Santoro, F. F. (2019). An Integrated Framework for the Realistic Simulation of Multi-Uav Applications, Comput. Electr. Eng.. 74, 196–209. (Elsevier). doi:10.1016/j.compeleceng.2019.01.016
Gielis, J., and Prorok, A. (2021). Improving 802.11p for Delivery of Safety-Critical Navigation Information in Robot-To-Robot Communication Networks. IEEE Commun. Mag. 59, 16–21. doi:10.1109/MCOM.001.2000545
Grigulo, J., and Becker, L. B. (2018). “Experimenting Sensor Nodes Localization in WSN with UAV Acting as Mobile Agent,” in 2018 IEEE 23rd International Conference on Emerging Technologies and Factory Automation (ETFA) (Turin, Italy: IEEE), 1, 808–815. doi:10.1109/ETFA.2018.8502536
Hui, K., Phillips, D., and Kekirigoda, A. (2017a). “Beyond Line-Of-Sight Range Extension with OPAL Using Autonomous Unmanned Aerial Vehicles,” in MILCOM 2017 - 2017 IEEE Military Communications Conference (MILCOM) (Baltimore, MD, USA: IEEE), 279–284. doi:10.1109/MILCOM.2017.8170774
Hui, K. P., Phillips, D., and Kekirigoda, A. (2017b). “Beyond Line-Of-Sight Range Extension in Contested Environments with OPAL Using Autonomous Unmanned Aerial Vehicles,” in 2017 27th International Telecommunication Networks and Applications Conference, ITNAC 2017 2017-January (Melbourne, VIC, Australia: IEEE), 1–5. doi:10.1109/ATNAC.2017.8215402
Hussen, H. R., Choi, S., Park, J., and Kim, J. (2018). “Performance Analysis of MANET Routing Protocols for UAV Communications,” in 2018 Tenth International Conference on Ubiquitous and Future Networks (ICUFN) (Prague, Czech Republic: IEEE), 70–72. doi:10.1109/ICUFN.2018.8436694
IEEE (2008). “Ieee Draft Standard for Information Technology–Telecommunications and Information Exchange between System– Local and Metropolitan Area Network–specific Requirements Part 11: Wireless Lan Medium Access Control (Mac) and Physical Layer (Phy) Specifications Amendment 5: Enhancements for Higher Throughput,” in IEEE Unapproved Draft Std P802.11n/D7.0.
IEEE (2007). “Ieee Standard for Information Technology - Telecommunications and Information Exchange between Systems - Local and Metropolitan Area Networks - Specific Requirements - Part 11: Wireless Lan Medium Access Control (Mac) and Physical Layer (Phy) Specifications,” in IEEE Std 802.11-2007 (Revision of IEEE Std 802.11-1999) (IEEE), 1–1076. doi:10.1109/IEEESTD.2007.373646
IEEE (2010). “Ieee Standard for Information Technology– Local and Metropolitan Area Networks– Specific Requirements– Part 11: Wireless Lan Medium Access Control (Mac) and Physical Layer (Phy) Specifications Amendment 6: Wireless Access in Vehicular Environments,” in IEEE Std 802.11p-2010 (Amendment to IEEE Std 802.11-2007 as Amended by IEEE Std 802.11k-2008, IEEE Std 802.11r-2008, IEEE Std 802.11y-2008, IEEE Std 802.11n-2009, and IEEE Std 802.11w-2009), 1–51. doi:10.1109/IEEESTD.2010.5514475
IEEE-SA Standards Board (2011). IEEE Standard for Wireless Access in Vehicular Environments (WAVE) : Multi-Channel Operation. IEEE.
Jawhar, I., Mohamed, N., Al-Jaroodi, J., Agrawal, D. P., and Zhang, S. (2017). Communication and Networking of Uav-Based Systems: Classification and Associated Architectures. J. Netw. Computer Appl. 84, 93–108. doi:10.1016/j.jnca.2017.02.008
Kaidenko, M., and Kravchuk, S. (2019). “Creation of Communication System for Unmanned Aerial Vehicles Using Sdr and Soc Technologies,” in 2019 International Conference on Information and Telecommunication Technologies and Radio Electronics (UkrMiCo) (Odessa, Ukraine: IEEE), 1–4. doi:10.1109/UkrMiCo47782.2019.9165422
Kim, H., and Choi, K. (2017). “A Modular Wireless Sensor Network for Architecture of Autonomous UAV Using Dual Platform for Assisting rescue Operation,” in Proceedings of IEEE Sensors, Orlando, FL, USA, 30 Oct.-3 Nov. 2016 (IEEE). 5–7. doi:10.1109/ICSENS.2016.7808895
Klaue, J., Rathke, B., and Wolisz, A. (2003). Evalvid Framework for Multimedia Simulations in NS-3. [Dataset].
Koenig, N., and Howard, A. (2004). “Design and Use Paradigms for Gazebo, an Open-Source Multi-Robot Simulator,” in IEEE/RSJ International Conference on Intelligent Robots and Systems (Sendai, Japan: IEEE), 2149–2154. doi:10.1109/IROS.2004.1389727
Lee, W. (2021). Enabling Reliable Uav Control by Utilizing Multiple Protocols and Paths for Transmitting Duplicated Control Packets. Sensors 21, 3295. doi:10.3390/s21093295
Li, B., Fei, Z., and Zhang, Y. (2018). Uav Communications for 5g and beyond: Recent Advances and Future Trends. IEEE Internet Things J. 6, 2241–2263. doi:10.1109/JIOT.2018.2887086
Marinho, M. A. M., de Freitas, E. P., Lustosa da Costa, J. P. C., de Almeida, A. L. F., and de Sousa, R. T. (2013). Using Cooperative Mimo Techniques and Uav Relay Networks to Support Connectivity in Sparse Wireless Sensor Networks. 2013 International Conference on Computing, Management and Telecommunications (ComManTel), Ho Chi Minh City, Vietnam. 21-24 Jan. 2013. IEEE. 49–54. doi:10.1109/ComManTel.2013.6482364
Masiukiewicz, A. (2014). Comparison of 802.11 Ac and 802.11 N Phy Layers. Warszawa, Poland: Kwartalnik Naukowy Uczelni Vistula, 111–123.
Menegol, M., Hübner, J., and Becker, L. (2018). Evaluation of Multi-Agent Coordination on Embedded Systems, 212–223. doi:10.1007/978-3-319-94580-4_17
Meng, W., He, Z., Su, R., Yadav, P. K., Teo, R., and Xie, L. (2017). Decentralized Multi-UAV Flight Autonomy for Moving Convoys Search and Track. IEEE Trans. Control. Syst. Technology 25, 1480–1487. doi:10.1109/TCST.2016.2601287
Merwaday, A. (2015). UAV Assisted Heterogeneous Networks for Public Safety Communications, 329–334. doi:10.1109/WCNCW.2015.7122576
Murillo, E. I., Poveda, H. E., Jo, K. H., and Hernandez, D. C. (2018). Evaluation of IEEE 802.11n and IEEE 802.11p Based on Vehicle to Vehicle Communications HSI. Proceedings - 2018 11th International Conference on Human System Interaction, Gdansk, Poland. 4-6 July 2018. 2018, 491–497. doi:10.1109/HSI.2018.8431337
Nasrallah, Y. Y., Al-Anbagi, I., and Mouftah, H. T. (2014). A Quality of Service Model for IEEE 802.11p Communication Protocol in a Smart City. 2014 Global Information Infrastructure and Networking Symposium. Montreal, QC, Canada. 15-19 Sept. 2014, 2014. Montreal, QC: GIIS, 2–4. doi:10.1109/GIIS.2014.6934257
Park, J.-G., Patel, A., Curtis, D., Teller, S., and Ledlie, J. (2012). Online Pose Classification and Walking Speed Estimation Using Handheld Devices. In Proceedings of the 2012 ACM Conference on Ubiquitous Computing. 05 September 2012. United States. 113–122. doi:10.1145/2370216.2370235
Park, J. H., Choi, S. C., Kim, J., and Won, K. H. (2018). Unmanned Aerial System Traffic Management with WAVE Protocol for Collision Avoidance. International Conference on Ubiquitous and Future Networks, ICUFN. Prague, Czech Republic. 3-6 July 2018. 8–10. doi:10.1109/ICUFN.2018.8436836
Raimundo, A., Fernandes, D., Gomes, D., Postolache, O., Sebastião, P., and Cercas, F. (2018). Uav Gnss Position Corrections Based on iotTM Communication Protocol. In 2018 International Symposium in Sensing and Instrumentation in IoT Era (ISSI). 17 November 2018. United Kingdom. 1–5. doi:10.1109/ISSI.2018.8538179
Ribeiro, L. M. B., and Buss Becker, L. (2019). “Performance Analysis of Ieee 802.11p and Ieee 802.11n Based on Qos for Uav Networks,” in Proceedings of the 9th ACM Symposium on Design and Analysis of Intelligent Vehicular Networks and Applications (New York, NY, USA: Association for Computing Machinery), 65–71. doi:10.1145/3345838.3356008
Ribeiro, L. M. B., Müller, I., and Buss Becker, L. (2021). Communication Interface Manager for Improving Performance of Heterogeneous Uav Networks. Sensors 21, 4255. doi:10.3390/s21134255
Ribeiro, L., Muller, I., and Becker, L. (2020). “Gerenciamento de interfaces para prover comunicação heterogênea em redes compostas por múltiplos uavs,” in Anais Estendidos do X Simpósio Brasileiro de Engenharia de Sistemas Computacionais (Porto Alegre, RS, Brasil: SBC), 49–56. doi:10.5753/sbesc_estendido.2020.13090
Sayyed, A., de Araújo, G. M., Bodanese, J. P., and Becker, L. B. (2015). Dual-stack Single-Radio Communication Architecture for UAV Acting as a mobile Node to Collect Data in WSNs. Sensors (Switzerland) 15, 23376–23401. doi:10.3390/s150923376
Sharma, V., Srinivasan, K., Chao, H. C., Hua, K. L., and Cheng, W. H. (2017). Intelligent Deployment of UAVs in 5G Heterogeneous Communication Environment for Improved Coverage. J. Netw. Computer Appl. 85, 94–105. doi:10.1016/j.jnca.2016.12.012
Shi, L., Marcano, N. J. H., and Jacobsen, R. H. (2019). “A Survey on Multi-Unmanned Aerial Vehicle Communications for Autonomous Inspections,” in 2019 22nd Euromicro Conference on Digital System Design (DSD) (Kallithea, Greece: IEEE), 580–587. doi:10.1109/DSD.2019.00088
Silva, L., Barros, J., Salvador, E., Nigam, V., and Brito, A. (2019). “A Multi-Uav Co-simulation Environment for Safety and Performance Analysis,” in Anais do IX Simpósio Brasileiro de Engenharia de Sistemas Computacionais (Porto Alegre, RS, Brasil: SBC), 161–168. doi:10.1109/sbesc49506.2019.9046071
Siris, V. A., and Delakis, M. (2011). Interference-aware Channel Assignment in a Metropolitan Multi-Radio Wireless Mesh Network with Directional Antennas. Computer Commun. 34, 1518–1528. doi:10.1016/j.comcom.2011.02.008
Skorobogatov, G., Barrado, C., and Salamí, E. (2020). Multiple Uav Systems: A Survey. Unmanned Syst. 8, 149–169. doi:10.1142/s2301385020500090
Vegni, A., Loscri, V., Calafate, C., and Manzoni, P. (2021). Communication Technologies Enabling Effective Uav Networks: A Standards Perspective. IEEE Communications Standards Magazine.
Werner-Allen, G., Johnson, J., Ruiz, M., Lees, J., and Welsh, M. (2005). Monitoring Volcanic Eruptions with a Wireless Sensor Network, 2005. Istanbul, Turkey: IEEE, 108–120. doi:10.1109/EWSN.2005.1462003
Yan, S., Peng, M., and Cao, X. (2018). A Game Theory Approach for Joint Access Selection and Resource Allocation in UAV Assisted IoT Communication Networks, 1. IEEE Internet of Things Journal–1. doi:10.1109/JIOT.2018.2873308
Yanmaz, E., Hayat, S., Scherer, J., and Bettstetter, C. (2014). Experimental Performance Analysis of Two-Hop Aerial 802.11 Networks. IEEE Wireless Commun. Networking Conf. WCNC 3, 3118–3123. doi:10.1109/WCNC.2014.6953010
Yanmaz, E., Yahyanejad, S., Rinner, B., Hellwagner, H., and Bettstetter, C. (2018). Drone Networks: Communications, Coordination, and Sensing. Ad Hoc Networks 68, 1–15. doi:10.1016/j.adhoc.2017.09.001
Yokoyama, R. S., Kimura, B. Y. L., and dos Santos Moreira, E. (2014). An Architecture for Secure Positioning in a UAV Swarm Using RSSI-Based Distance Estimation. ACM SIGAPP Appl. Comput. Rev. 14, 36–44. doi:10.1145/2656864.2656867
Yoon, H., Seok, H., Lim, C., and Park, B. (2020). An Online Sbas Service to Improve Drone Navigation Performance in High-Elevation Masked Areas. Sensors 20, 3047. doi:10.3390/s20113047
Yun, S., Kim, Y., Lim, Y., and Nam, S. (2015). Magnetic Tripolarizaiton Antenna for DSRC Applications, 225–226.
Zeng, Y., Zhang, R., and Lim, T. J. (2016). Wireless Communications with Unmanned Aerial Vehicles : Opportunities and Challenges. IEEE Commun. Mag. 54, 36–42. doi:10.1109/MCOM.2016.7470933
Keywords: wireless standards, heterogeneous communication, multi-UAV, high-mobility networks, communication interfaces, UAVs networks, FANETs
Citation: Ribeiro LMB, Müller I and Becker LB (2022) Performance Evaluation of Different ToS Using Heterogeneous Communication Interfaces in FANETs. Front. Future Transp. 2:755998. doi: 10.3389/ffutr.2021.755998
Received: 09 August 2021; Accepted: 16 November 2021;
Published: 04 January 2022.
Edited by:
Edison Pignaton De Freitas, Federal University of Rio Grande do Sul, BrazilReviewed by:
Marija Malnar, University of Belgrade, SerbiaJoao Paulo Carvalho Lustosa Da Costa, Hamm-Lippstadt University of Applied Sciences, Germany
Copyright © 2022 Ribeiro, Müller and Becker. This is an open-access article distributed under the terms of the Creative Commons Attribution License (CC BY). The use, distribution or reproduction in other forums is permitted, provided the original author(s) and the copyright owner(s) are credited and that the original publication in this journal is cited, in accordance with accepted academic practice. No use, distribution or reproduction is permitted which does not comply with these terms.
*Correspondence: Laura Michaella B. Ribeiro, laurarb@ifam.edu.br; Ivan Müller, ivan.muller@ufrgs.br; Leandro Buss Becker, leandro.becker@ufsc.br