 Samuel David Marshall
 Karl Snape1
 David Soper
 Mark Sterling
 Stefanie Gillmeier
- 1School of Engineering, University of Birmingham, Birmingham, United Kingdom
- 2Faculty of Science and Engineering, Manchester Metropolitan University, Manchester, United Kingdom
- 3Building Physics and Services, Department of the Built Environment, Eindhoven University of Technology, Eindhoven, Netherlands
For the first time, this paper examines the aerodynamic forces that arise in a platoon of Heavy Goods Vehicle lorries travelling in close proximity during an overtaking manoeuvre. Through an in-depth programme of wind tunnel experiments it is demonstrated that there is a complex relationship between the drag and side force coefficients, with a possible hysteresis-like behaviour shown. The influence of the overtaken lorry on the overtaking lorry is shown to be key in terms of the aerodynamic-induced forces experienced by the latter. Furthermore, the overtaking lorry is shown to benefit aerodynamically from the overtaken lorry, and this is attributed to the elliptical nature of the Navier-Stokes equations. In addition to examining the forces that arise during overtaking, the variation of the wind-induced forces with respect to yaw on a single lorry is compared to those on a middle lorry in a 3-lorry platoon. The aerodynamic benefits arising from platooning/vehicles travelling in close proximity are again demonstrated, although it is shown that these benefits may only exist over a limited range of yaw angles, raising questions about the real-world application of this approach. This has important implications for platooning in crosswinds and the drag force reduction that is assumed due to platooning.
1 Introduction
The aerodynamic performance of objects travelling in a line behind one another in close proximity (i.e., in a platoon) has received increasing interest over the last decade or so. Such behaviour is typically observed in motorsport (Dominy, 1990), competitive cycling (Blocken et al., 2013; Blocken and Toparlar, 2015; Blocken et al., 2023) and even in horse racing (Spence et al., 2009). Recently, advances in technology have made it possible that the platooning of commercial vehicles on highways may soon become a possibility (National Highways, 2022). Whilst the benefits of autonomous vehicles are being explored for commercialisation of private vehicles, it is likely that early adopters of this technology will be the heavy haulage industry due to the benefits in terms of fuel economy and staffing requirements. This possibility has encouraged researchers to explore the aerodynamic performance of lorries travelling in such a formation (Davilla et al., 2013; Humphreys and Bevly, 2016; Bruneau et al., 2017; Robertson et al., 2019; Veldhuizen et al., 2019; He et al., 2022).
The benefits that arise from such an arrangement for vehicles are mainly observed in terms of a reduced drag force, which in turns offers considerable energy savings and a reduction in emissions. For example, He et al. (2022) demonstrated that the leading lorry in a platoon of vehicles experienced a drag coefficient of ∼0.6, whereas the drag coefficient for the remaining vehicles was ∼0.2. In comparison, it was also demonstrated that the drag coefficient for an isolated lorry is ∼0.7–hence, it is clear that all vehicles, including the leading lorry, benefit from travelling in close proximity. To some extent, the reduction in drag coefficient can be considered as a function of the length of the platoon and the gap size between each vehicle, nevertheless the savings for hauliers could be considerable (Zabat et al., 1995; Wang et al., 2023). Research in this field has demonstrated that the flows surrounding the individual vehicles are characterised by a thick boundary layer with local peaks corresponding to the front of each vehicle (Robertson et al., 2019). Thus, from an aerodynamic perspective, several similarities exist with the flow around trains, particularly freight trains (Soper et al., 2014).
Most of the research undertaken to date has considered platoons moving in the open air, with simplified still wind conditions, where the flow around the platoon is governed by the motion of the platoon and the corresponding slipstream generated (Zabat et al., 1995; Robertson et al., 2019; Kospach and Irrenfried, 2022). However, for platoons to operate effectively in practice, it is important to consider the local weather conditions which could involve crosswinds. He et al. (2022) performed a Delayed Detached Eddy Simulation to examine the flow around eight lorries in a platoon subjected to a crosswind of 30° (relative to platoon direction of travel). It was shown that crosswinds can affect the flow around the platoon which in turn can result in higher drag forces (compared to the no crosswind case), i.e., up to 70% less reduction in drag force was observed. These changes in the flow acting on and within the platoon also impacted on the aerodynamic side and lift forces experienced by the vehicles in the platoon.
Whilst the research of He et al. (2022) and Robertson et al. (2019) considered one specific case, it is evident that the flow around and within a platoon is complex and the previously identified savings (in terms of reduced drag force) may be a challenge to realise in practice (Le Good et al., 2018). In the UK, it is common for commercial vehicles to not only travel in a platoon-like formation (albeit with relatively large inter vehicle gaps), but also for the individual vehicles in the platoons to perform overtaking manoeuvres. This has been explored to a limited extent in streamlined vehicles (Yamamoto et al., 1997; Tsuei et al., 1999; Tsuei and Savas, 2000; Noger et al., 2005; Uddin et al., 2017; Gan et al., 2020). It is reasonable to assume that any aerodynamic issues will be exacerbated in non-streamlined vehicles. Several studies over the past 50 years describe the impact of individual large vehicles on passenger cars, noting that distance, velocity, windspeed and vehicle shape/design are all factors that can result in relatively large disturbances (Heffley, 1973; Sano et al., 1984; Azim, 1994; Siegel, 2018; Liu et al., 2019). Unsurprisingly this has resulted in safety concerns for other road users and pedestrians.
Noting the above, it is hypothesised that overtaking manoeuvres will change the flow around the platoon and thus the corresponding forces experienced by the vehicles in the platoon, i.e., there will be a negative impact on drag reduction. To investigate this, research was undertaken at the Eindhoven University of Technology with a platoon of three Heavy Goods Vehicles (HGVs) travelling in a close-proximity configuration. The configuration of the platoon was altered to simulate an overtaking manoeuvre, and the moments and forces acting on one of the vehicles in the platoon were measured.
The paper is organised as follows: Section 2 outlines the experiments, methodology and facility which enabled the results to be obtained. Section 3 presents and discusses the results of the aerodynamic forces moments with respect to yaw angle acting on a single vehicle and the same vehicle placed in the centre of a three-vehicle platoon. The paper then considers the case of the central vehicle performing an overtaking manoeuvre for the zero-degree yaw angle case (i.e., no crosswinds). Relevant conclusions are presented in Section 4 with appropriate acknowledgements noted in the References Section.
2 Experiment methodology
2.1 Boundary layer wind tunnel
The experiments discussed in this paper were undertaken in the atmospheric boundary layer wind tunnel at the Eindhoven University of Technology in the Netherlands. For the benefit of the reader a summary of the wind tunnel and its capabilities is presented below.
The wind tunnel is a closed-circuit facility with cross sectional dimensions of 3 m (wide) by 2 m (tall) and a test section of 27 m in length (Figure 1A). The flow in the tunnel is generated by four AXC1600 55 kW axial fans of diameter 1.6 m (Figure 1B). Spires, roughness elements and a honeycomb grid (not shown) can be installed downstream of the fans to remove the swirl generated by the fans and create the appropriate levels of atmospheric turbulence. Typically, physical models of scales 1:20th–1:400th are tested in the wind tunnel.
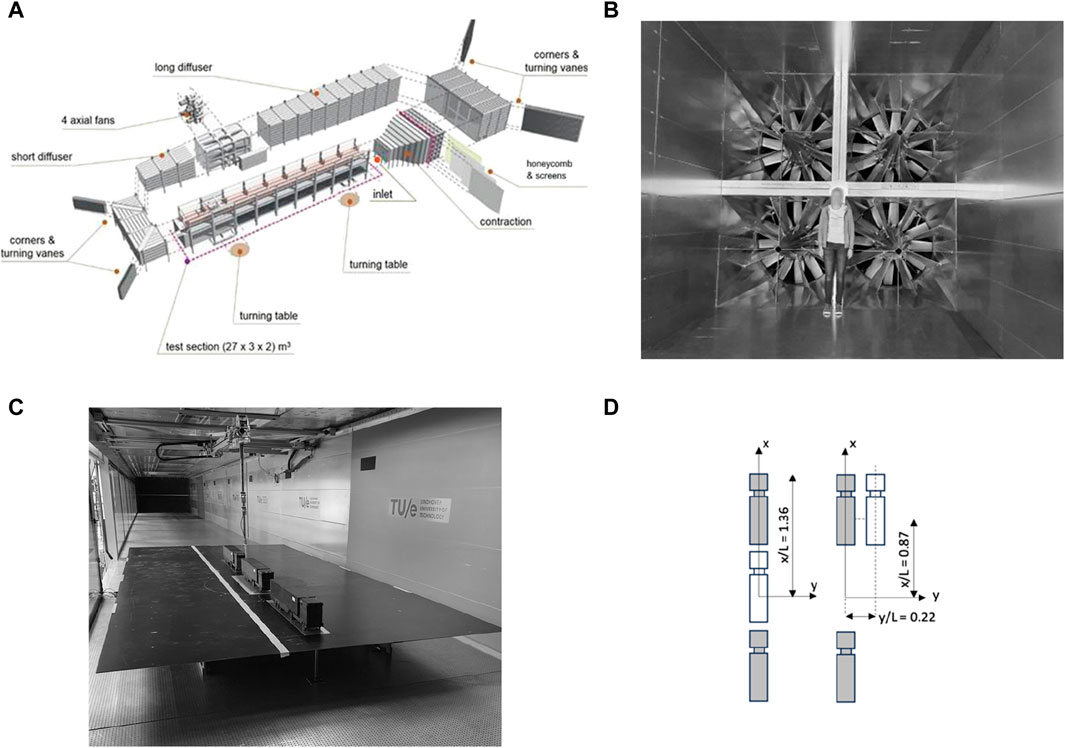
Figure 1. The boundary layer wind tunnel at the Eindhoven University of Technology. (A) Wind tunnel schematic. (B) Wind tunnel fans. (C) Photograph of model lorries installed on a suspended ground plane. (D) Schematic of the platoon at start and during overtaking.
For the current experiments, a suspended ground plane was installed 3 m downstream of the inlet following the contraction section, at a height of 0.3 m above the ground for a length of 5 m down the wind tunnel (Figure 1C). The suspended floor was used to minimise the impact of the boundary layer formation generated by the upstream fetch of the wind tunnel and ensure that the approaching flow was as uniform as possible. A wind speed of 25 m/s was employed, giving a Reynolds number of ∼3E+05. Figure 2A shows the distribution of normalised streamwise mean velocity with respect to vertical distance above the suspended ground plane, at a distance of 0.2 m ahead of the suspended floor. In Figure 2A, the reference velocity (
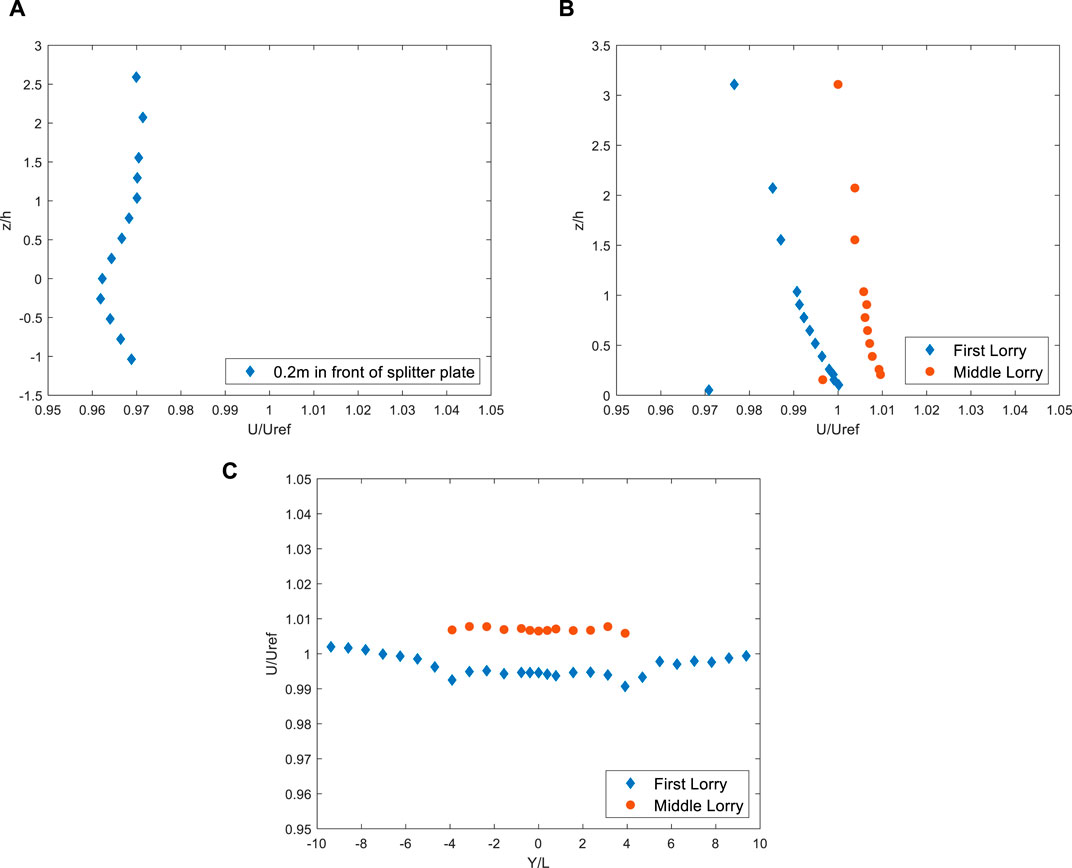
Figure 2. Velocity characteristics over the suspended ground plane. (A) Normalised mean streamwise velocity 0.2 m upstream of the splitter plate. (B) Variation of normalised mean streamwise velocity corresponding to the locations of the two lorries. (C) Lateral distribution of normalised mean streamwise velocity at vehicle height.
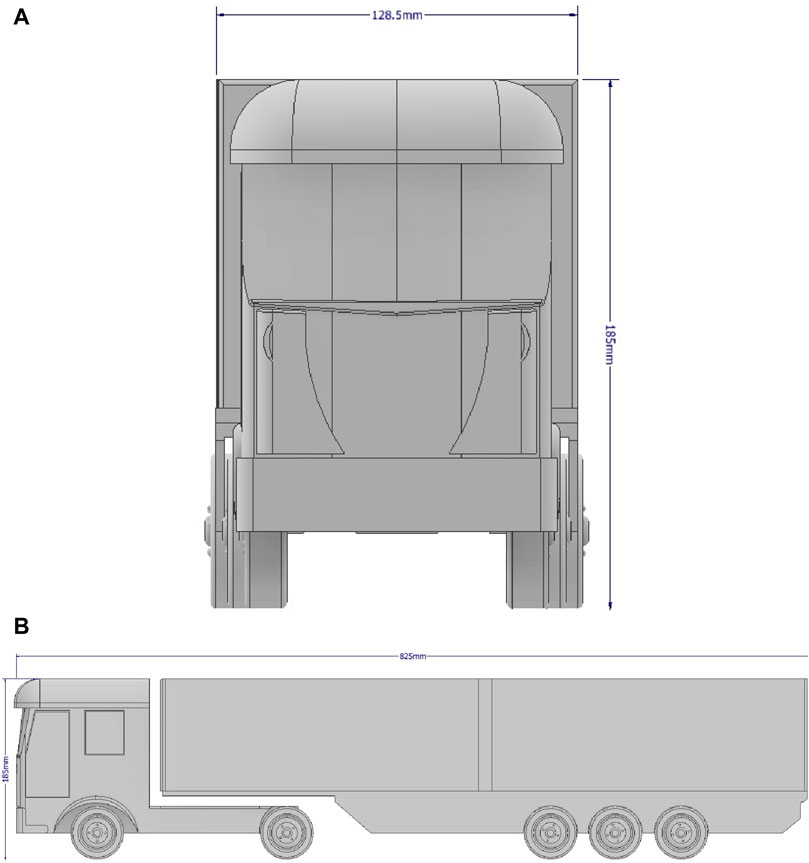
Figure 3. Model schematics illustrating key dimensions. (A) Front elevation of the HGV. (B) Side elevation.
2.2 Platoon model and instrumentation
Three Heavy Goods Vehicle lorries based on the DAF XF lorry with a European type trailer configuration were constructed out of polylactic acid using additive manufacturing techniques, at a scale of 1:20th. Figure 3 shows a schematic of the model, which has overall dimensions of 825 mm in length, a width of 128.5 mm and height of 185 mm. The central vehicle was placed on a six component Interface force balance and sampled every 0.1 s. The velocity (which is used to calculate the force and moment coefficients) was measured at vehicle height using a Series 100 Cobra probe and sampled every 0.001 s for a duration of 30 s.
The cartesian coordinate system adopted is shown in Figure 1D, i.e., x is considered positive towards the “direction of travel” (i.e., in the opposite direction to the approaching flow), y is perpendicular to x and is the horizontal plane, and z is perpendicular to the horizontal plane and positive towards the height of tunnel. The origin is located at the centre of gravity of the middle vehicle. The length of the model HGV lorry was 825 mm (∼16.5 m full-scale equivalent) and inter-vehicle gap is 300 mm (∼6 m full-scale equivalent), which was chosen to match the proposed UK Government policy design requirements for vehicles in close-proximity (National Highways, 2022). Figure 1D illustrates the maximum (normalised) lateral distance that the lorry moves in the y direction during the overtaking manoeuvre. Throughout the analysis the aerodynamic force coefficients [Drag (D), Side (S) and lift (L)] are aligned with the x, y, and z-axis respectively, and are defined as follows:
where
where M represents the relevant moment in the xy, xz or yz plane, h represents the height of the lorry above the splitter plate and all other variables are previously defined. In what follows, only the (initially) central lorry in the platoon has been instrumented. However, due to the overtaking manoeuvre performed, this central lorry ultimately becomes the leading lorry in the platoon.
The uncertainty in the force and moment coefficients is estimated to be 5.5% and 5.6% respectively and is based on the uncertainty associated with the individual variables in Eqs 1, 2, calculated using a propagation of error technique (Evans, 2019). Forty-four individual experiments were undertaken to simulate the different stages of a lorry overtaking, each location was tested with three repetitions (typically found to have a variation of <1%), then the wind tunnel was switched off and the platoon vehicles were moved relative to each other. The overtaking manoeuvre was performed in steps of equal distance, first moving laterally, then parallel to the direction of flow until the central vehicle is the gap size ahead of the previously leading vehicle. The lateral movement is then repeated in reverse until the platoon is in-line once more.
All results were corrected for any differences in temperature, atmospheric pressure and relative humidity that may have occurred during the measurement period. The blockage ratio for all experiments was
Unless stated otherwise, the frontal projected area
3 Results and discussion
3.1 The impact of yaw angles for isolated lorries and lorries in a platoon
Prior to performing any overtaking related experiments, the mean aerodynamic forces and moments acting on a single vehicle and on a platoon of vehicles for a limited selection of yaw angles were examined. Previous work by Baker et al. (2019) has shown that to compare different vehicle types and vehicle arrangements, it is instructive to normalise the relevant aerodynamic parameters by their respective values at 30-degree yaw. The magnitudes of normalising coefficients are given in Table 1.
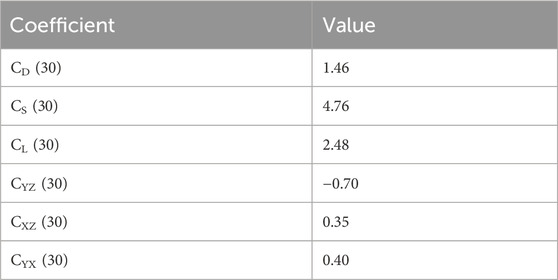
Table 1. Force and moment coefficients at a 30° yaw angle used to normalised both the isolated lorry data and the platoon data.
Figure 4 shows the variation of force coefficient and moment coefficient with respect to yaw. In Figure 4A the sheltering effect when the instrumented lorry is part of a platoon is clearly evident. For the range of yaw angles investigated, the drag coefficients are less when the vehicle is part of a platoon than compared to the isolated lorry case. As the yaw angle increases, the degree of sheltering tends to reduce and therefore the overall difference between the drag coefficients reduces as the middle vehicle in the platoon becomes more exposed to the oncoming wind. This is consistent with research undertaken for similarly bluff vehicles (Baker et al., 2019). There is an approximately linear increase from 0 to 30o in the current data, which again is consistent with the previous research mentioned.
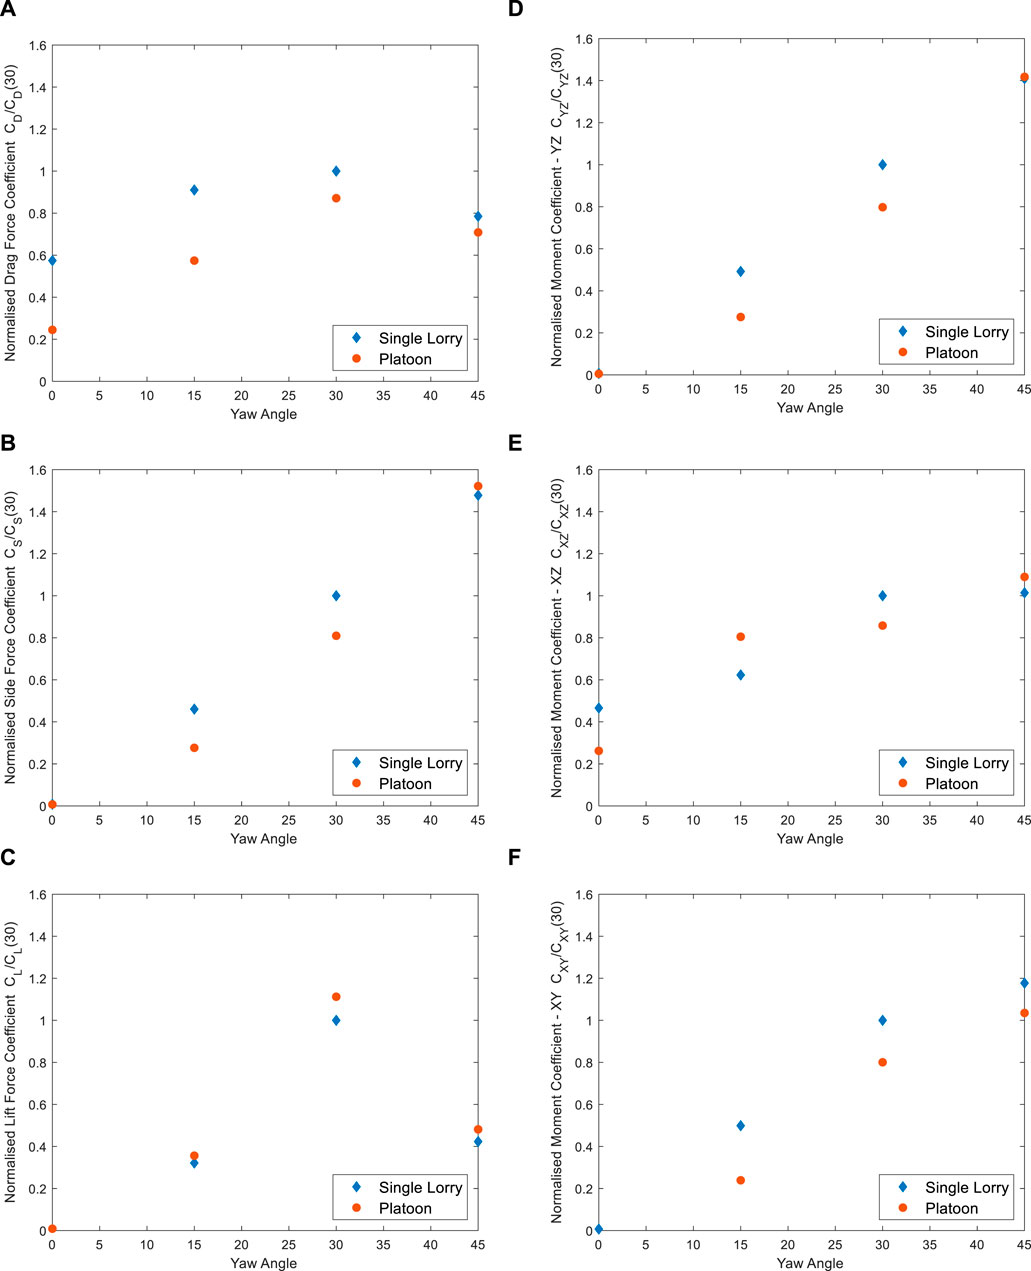
Figure 4. Variation of normalised mean force and moment coefficients with respect to yaw angle. Values for normalisation (i.e., CD, etc.) can be found in Table 1. (A) Drag coefficient w.r.t yaw angle. (B) Side coefficient w.r.t yaw angle. (C) Lift coefficient w.r.t yaw angle. (D) Moment coefficient in the YZ plane w.r.t yaw angle. (E) Moment coefficient in the XZ plane w.r.t yaw angle. (F) Moment coefficient in the XY plane w.r.t yaw angle.
Similar to the drag force coefficient, the trend in side force coefficient (Figure 4B) follows a (linear) increase with increasing yaw angle as the vehicles become more exposed to the oncoming wind. The overall magnitude of the side force coefficient values (when appropriately normalised) are similar to those demonstrated by some trains (Baker et al., 2019). The degree of sheltering that occurs in a platoon up to 30° yaw is evident by the difference between the single and platoon data. At zero degrees yaw the mean value of the side force coefficient is zero in both cases as would be expected noting the orientation of the vehicles to the oncoming flow, i.e., the mean wind induced force is in the x-direction as shown as in Figure 4A. For yaw angles of 15° and 30°, the side force (coefficient) increases as the area of the vehicle exposed to the wind increases. However, it is clear that the middle vehicle in the platoon experiences a degree of aerodynamic sheltering. To some extent, this sheltering is related to the reduced area seen by the approaching wind due to the configuration of the platoon. However, there are also aerodynamic benefits associated with the flow over and around the vehicles. As the flow separates at the rear of a vehicle, the size of the separated region is influenced by the surroundings vehicles in two ways. Firstly, at low yaw angles, the size of the unsteady wake which can develop at the rear of the leading vehicle is minimised due to the physical presence of middle vehicle–this in turn reduces the size of the turbulence seen by the middle vehicle, which in turn effects the forces on the vehicle. Secondly, the same process is repeated at the rear of the middle vehicle which minimises the pressure difference between the frontal area of the vehicle and its rear. At 45° the side force is more likely to be influenced by the flow separating over the vehicle’s roof and the associated wakes which develop on the leeward side. This helps to explain why there is little discernible difference between the two sets of data, i.e., any difference that exists is within the experimental uncertainty.
The lift force coefficient (Figure 4C) initially increases with yaw angle and then shows a reduction at 45°. Whilst much could be read into this behaviour, it is generally acknowledged that simulating the lift force in vehicle related experiments is extremely difficult to ascertain due to the small gap between the ground and the vehicle wheels (∼1–2 mm in this case). This small gap can result in unrealistic flow which would not occur at full-scale (Sterling et al., 2010). For this reason, the results are presented but not discussed.
Figures 4D–F show the corresponding moment coefficients which arise from the wind induced forces in the x, y, and z directions. These moments largely follow the trend of the corresponding forces and support the findings of Sterling et al. (2010) who investigated the wind induced forces on an isolated lorry using both wind tunnel experiments and CFD.
Figure 5 illustrates the actual rolling moment coefficient and compares it to the findings Sterling et al. (2010). In keeping with the manner in which the data was presented in Sterling et al. (2010), the data in Figure 5 has not been normalised by the respective value at 30°, unlike in Figure 4. The results of Sterling et al. (2010) were calibrated against full-scale measurements. Thus, a detailed discussion of the moment coefficients and their variation with yaw angle is not discussed in the current paper but the data is presented for completeness.
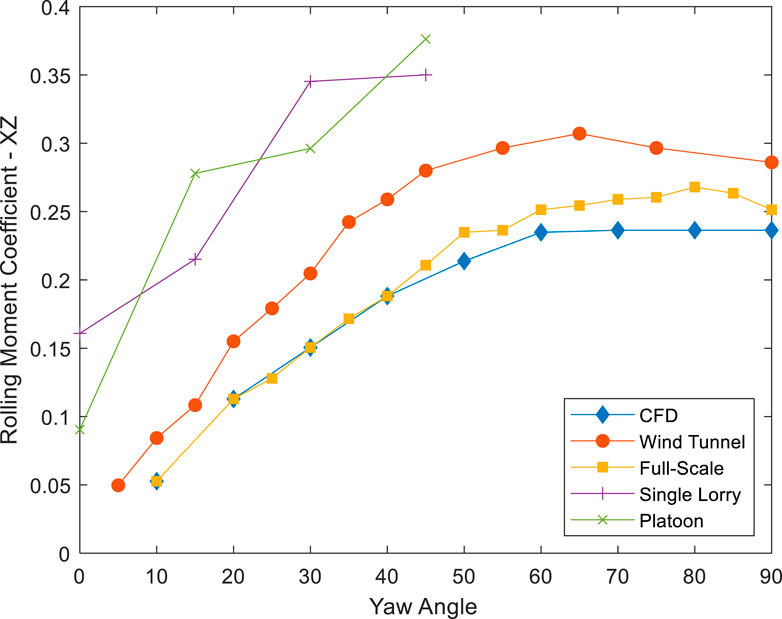
Figure 5. Mean rolling moment calculated from CFD, Wind Tunnel and Full-Scale testing with respect to yaw angle for an isolated vehicle from Sterling et al. (2010), as compared to the current Single Lorry and Platoon findings. The results from Sterling et al. (2010) have been renormalised to be based on the frontal area (as for the current findings) instead of the side area (as in the original publication).
Figure 6 illustrates the force data expressed in the
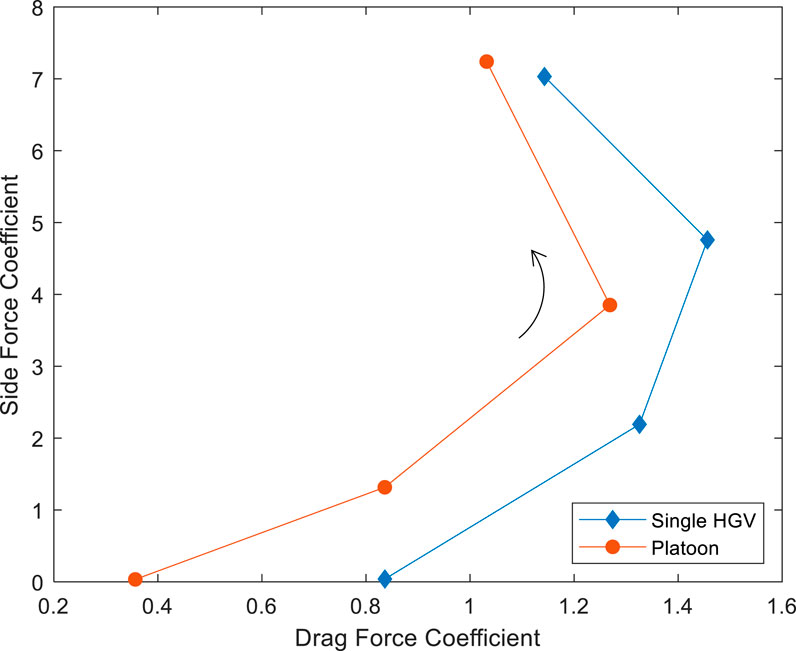
Figure 6. Side force coefficient against the drag force coefficient.
3.2 Force and moment coefficients during an overtaking manoeuvre
Figure 7 shows the aerodynamic mean drag, side and lift force and moment coefficients arising from the approaching flow on the central lorry during its overtaking manoeuvre at a zero-degree yaw angle. The data has been divided into two series to aid comparison, i.e., the first part of the manoeuvre corresponds to the lorry moving out and pulling alongside the leading vehicle and the second part of the manoeuvre is associated with the overtaking phase. As noted in Section 2.2, the data was obtained from forty-four separate experiments but is presented in Figure 7 as two different time series. In order to elucidate the changes that occur during overtaking, the y-axis range used in Figure 7 is different to that used in Figure 4.
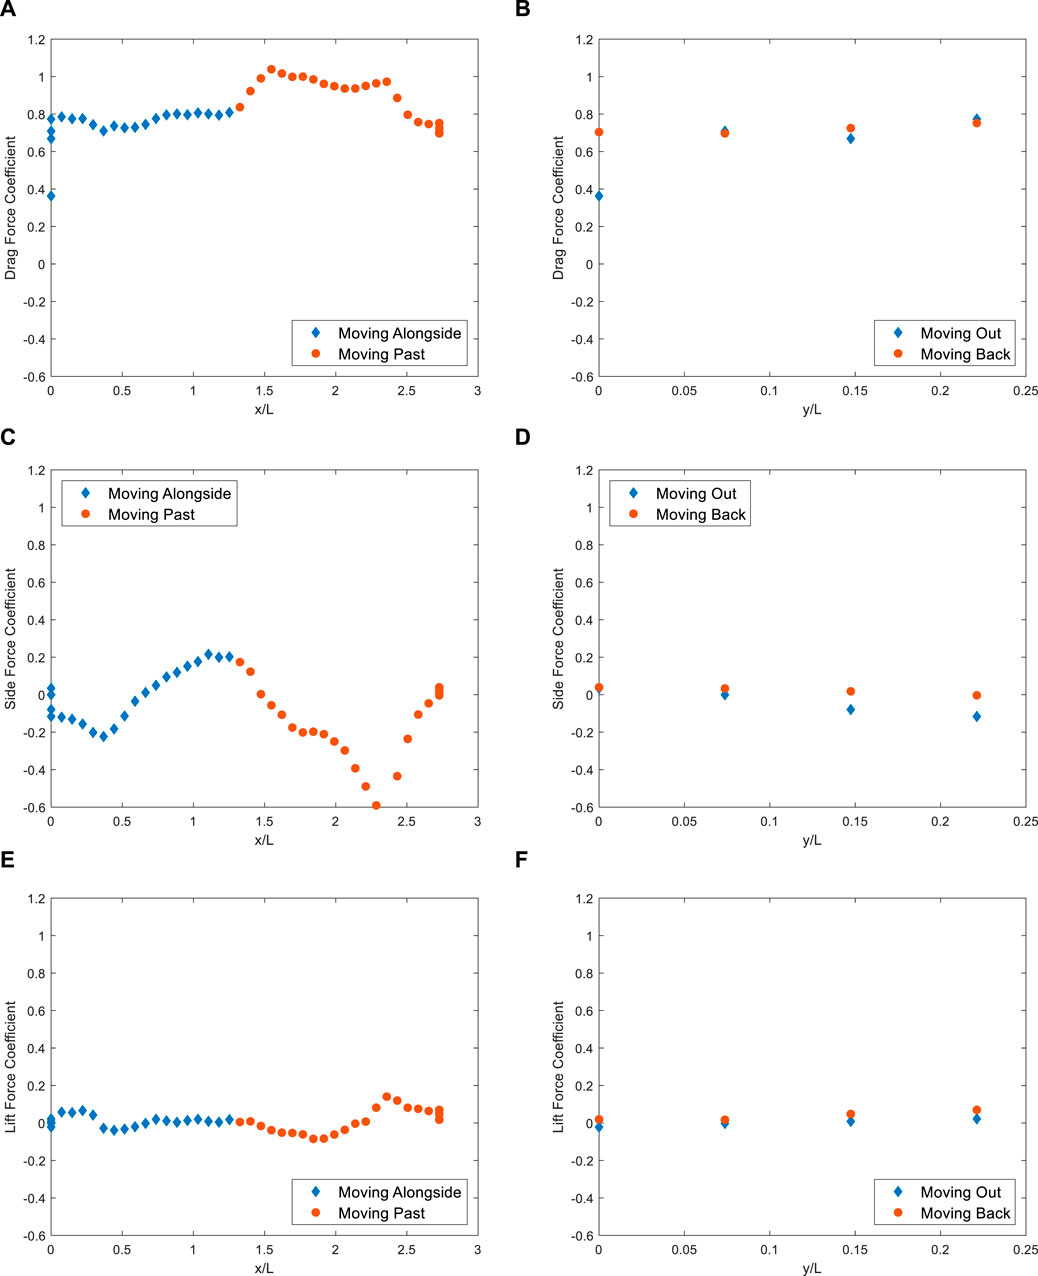
Figure 7. Variation of mean force coefficients w.r.t distance during overtaking. (A) Drag force coefficient w.r.t streamwise distance. (B) Drag force coefficient w.r.t lateral distance. (C) Side force coefficient w.r.t streamwise distance. (D) Side force coefficient w.r.t lateral distance. (E) Lift force coefficient w.r.t streamwise distance. (F) Lift force coefficient w.r.t lateral distance.
Figures 7A, C, E show the variation of force coefficient with respect to the normalised streamwise distance, whereas Figures 7B, D, F show the variation of force coefficient with respect to normalised lateral distance. Given the complexity of the overtaking manoeuvre, for clarity the latter figures only show readings from the initial increase in y/L increase as the overtaking vehicle moves out and the final decrease as the overtaking vehicle becomes the lead vehicle in the platoon, removing the forward motion section (which is constant in y/L).
In Figures 7A, B, it can be observed that the value of drag force coefficient increases from ∼0.33 to ∼0.77 during the initial phase of the overtaking manoeuvre (i.e., as the vehicle moves laterally). This is due to the increased exposure of the overtaking vehicle to the oncoming wind. It is evident from Figure 7A during this stage that a small increase in exposure (a small change in y/L) can result in a considerable increase in drag coefficient. For example, when the lateral distance corresponds to ∼0.5 the width of the lorry, the drag coefficient more than doubles with only a slight increase as the vehicle continues to move laterally. This is potentially due to the wake development from initially leading platoon lorry, with separating vortices emanating from the edges of the trailer and interacting with the overtaking lorry as it moves out of alignment, causing the entire lead face of the overtaking lorry to experience an effective wind speed, similar to that of the free stream effect. As the overtaking vehicle begins to move alongside the leading vehicle (i.e., x/L
Figures 7C, D show the variation in side force coefficient which is, in general, more pronounced that its drag force counterpart. However, unlike the drag force coefficient, the values of side force coefficient corresponding to the final and starting values are identical (within experimental uncertainty) demonstrating that there is no benefit in terms of platoon position (over the range examined).
As the lorry reaches its maximum lateral overtaking position (y/L = ∼0.22) and begins to move forward, the magnitude of the side force coefficient continues to reduce until the front of the overtaking lorry is parallel with the rear of the leading vehicle. It is hypothesised that this is due to the flow structures in the wake of the leading vehicle developing as the overtaking lorry moves sideways, i.e., the “platooning” benefit discussed by Blocken et al. (2023) and as noted above this reduces. The effect of this could be to create increased turbulence in the wake of the leading vehicles which in turn impacts on the rear of the overtaking vehicle, possibly as a result of vortex shedding from the side of the leading vehicle. As the overtaking vehicle continues to move alongside the leading vehicle, the side force starts to increase as both vehicles become more sheltered (in the y direction) and a local maximum is reached when the degree of shelter is maximised, i.e., when the front of the overtaking and overtaken vehicles are parallel with each other. It is also likely that the flow is accelerating between vehicles causing a local reduction in pressure in the gap between the vehicles, creating a difference in pressure between each side of the overtaking lorry, which aids to the change in sign of the side force coefficient.
As the overtaking vehicle starts to pass the overtaken vehicle, the side force coefficient begins to reduce and achieves a minimum value when the rear of the overtaking vehicle is coincident with the front of the overtaking vehicle. This trend could perhaps be attributed to the reduction in sheltering effected noted above, i.e., the flow structures which develop around the overtaking vehicle are no longer affected by the other vehicles in the platoon given the streamwise distance of the leading vehicle and its lateral offset (from the overtaken vehicle). As the streamwise distance increases and ultimately the lateral offset reduces to zero, the side force coefficient corresponds to the data presented in Figure 4A for a yaw angle of zero degrees.
Figures 7E, F have been included for completeness, but as noted above there are considerable challenges when simulating the appropriate underbody flow in wind tunnel experiments at these scales. As such, no detailed examination is presented, although it is noted that the trend does support the above discussion.
Figure 8 illustrates the drag force and lift force coefficients shown in Figure 7 plotted in the
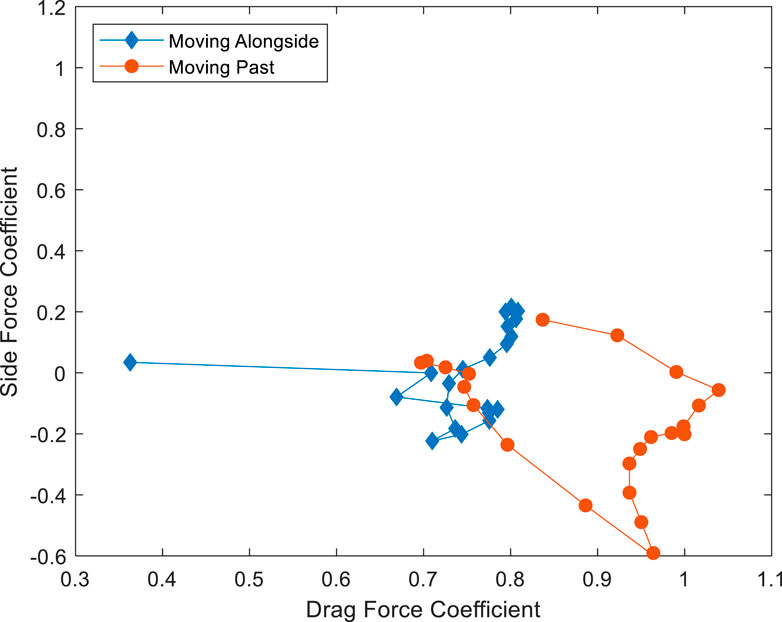
Figure 8. Variation of Side force and Drag force coefficients during overtaken.
Figure 9 shows the mean moment coefficients throughout the overtaking manoeuvre in three different perpendicular planes (N.B., a different y-axis range is used in Figure 9 than in Figure 8 to highlight trends.) As shown in Figure 9A, there is very little variation in the YZ plane as might be expected given that the flow is predominately in the x direction. However, there is a slight increase in moment coefficient as the vehicle moves alongside, followed by a steady reduction over ∼1.4
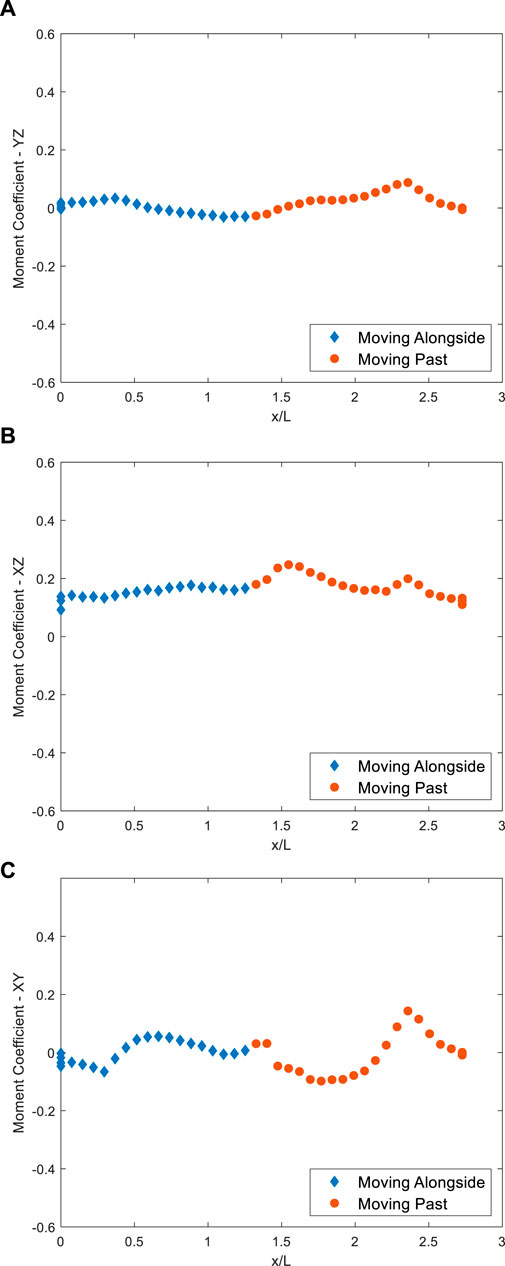
Figure 9. Variation of mean moment coefficients w.r.t distance during overtaking. (A) Moment coefficient in the YZ plane during overtaking. (B) Moment coefficient in the XZ plane during overtaking. (C) Moment coefficient in the XY plane during overtaking.
Figure 9B shows that this trend is also followed in the XZ plane, which suggests that there is an element of flow instability/vortex shedding having an impact on the moments experienced by the lorry during its manoeuvre, perhaps as a result of flow separation over the roof. The latter assertion is more evident in the XZ plane (Figure 9C) as one would expect and supports the trends observed in the force coefficient data.
4 Conclusion
This research has investigated the aerodynamic behaviour of an isolated lorry and a lorry in a platoon of three vehicles subject to a range of yaw angles. For the specific case of zero degrees yaw, i.e., pure head wind, it also investigates for the first time, the aerodynamic forces and moments acting on the central lorry of a platoon during an overtaking manoeuvre. The following conclusion can be drawn:
• The sheltering effect of the platoon is evident for yaw angles up to 30°, i.e., there is a reduction in drag and side force coefficients when travelling in a platoon compared to an isolated lorry. Maximum drag reduction was found to be 57.4% at 0° (12.9% at 30°) and maximum side force reduction was found to be 40% at 15° (19% at 30°).
• The magnitudes of the side force coefficients are consistent with those of other bluff vehicles, such as trains, and attain values greater than unity (largely due to the reference area selected).
• Over the range of yaw angles investigated, the moment coefficients exhibit trends which are largely consistent with their respective force coefficients. The magnitude of the moment coefficients is an order of magnitude lower than the force coefficients.
• Expressing the data in the
• The impact of sheltering is evident in the observed drag force coefficients during an overtaking manoeuvre:
• As the overtaking vehicle moves laterally, there is a considerable increase in drag coefficient (0.363–0.773, or 113%), as the lorry becomes more exposed to the oncoming wind.
• As the overtaking vehicle starts to move past the overtaken vehicle, there is a slight increase in
• The impact of side force coefficient during the overtaking manoeuvre is more pronounced than that of its drag force counterpart. Once again, the impact of the surrounding vehicles can be observed in the aerodynamic forces measured. For example, there are several local maximum/minimum values of
• At x/L ∼0.4 there is a local minimum of −0.223 as the overtaking lorry reaches the rear of the vehicle in front. The reduction in
• A local maximum of 0.216 is observed at x/L ∼1.4 as the front of overtaking vehicle becomes parallel with its overtaken counterpart. The increase in coefficient values between ∼0.4
• At x/L ∼2.4 as the rear of the overtaking vehicle is parallel with the front of the overtaken lorry, the flow structures arising from the overtaking lorry begin to fully impact on the overtaken lorry. Thus, the flow around the overtaking lorry changes, which in turn affects the overtaken lorry, leading to a minimum value of −0.617. As the lateral distance reduces, i.e., the lorry moves in line with the rest of the platoon, the side force coefficient returns to zero.
• The behaviour of the moment coefficient largely follows the force coefficient counterparts.
• The complex relationship between
Data availability statement
The original contributions presented in the study are included in the article/Supplementary material, further inquiries can be directed to the corresponding author.
Author contributions
SM: Data curation, Formal Analysis, Investigation, Methodology, Validation, Writing–review and editing. KS: Investigation, Methodology, Writing–review and editing. DS: Conceptualization, Funding acquisition, Resources, Supervision, Writing–review and editing. MS: Data curation, Writing–original draft, Writing–review and editing. SG: Resources, Writing–review and editing.
Funding
The author(s) declare that financial support was received for the research, authorship, and/or publication of this article. The authors wish to acknowledge the research council funding which has enabled this work. This research was conducted as part of the wider project EP/V010689/1 supported by the Engineering and Physical Sciences Research Council. This work is also part of the transnational access project “ERIES–THE AERODYNAMICS OF PLATOONING AND OVERTAKING VEHICLES,” supported by the Engineering Research Infrastructures for European Synergies (ERIES) project (www.eries.eu), which has received funding from the European Union’s Horizon Europe Framework Programme under Grant Agreement No. 101058684. This is ERIES publication number ERIES-J2.
Conflict of interest
The authors declare that the research was conducted in the absence of any commercial or financial relationships that could be construed as a potential conflict of interest.
Publisher’s note
All claims expressed in this article are solely those of the authors and do not necessarily represent those of their affiliated organizations, or those of the publisher, the editors and the reviewers. Any product that may be evaluated in this article, or claim that may be made by its manufacturer, is not guaranteed or endorsed by the publisher.
References
American Society of Civil Engineers (2022). Wind tunnel testing for buildings and other structures. American Society of Civil Engineers.
Azim, A. A. (1994). An experimental study of the aerodynamic interference between road vehicles (No. 940422). SAE Technical Paper.
Baker, C., Johnson, T., Flynn, D., Hemida, H., Quinn, A., Soper, D., et al. (2019). Train aerodynamics: fundamentals and applications. Butterworth-Heinemann.
Blocken, B., Defraeye, T., Koninckx, E., Carmeliet, J., and Hespel, P. (2013). CFD simulations of the aerodynamic drag of two drafting cyclists. Comput. Fluids 71, 435–445. doi:10.1016/j.compfluid.2012.11.012
Blocken, B., Gillmeier, S., Malizia, F., and van Druenen, T. (2023). Impact of a nearby car on the drag of a cyclist. J. Wind Eng. Industrial Aerodynamics 234, 105353. doi:10.1016/j.jweia.2023.105353
Blocken, B., and Toparlar, Y. (2015). A following car influences cyclist drag: CFD simulations and wind tunnel measurements. J. Wind Eng. Industrial Aerodynamics 145, 178–186. doi:10.1016/j.jweia.2015.06.015
Bruneau, C. H., Khadra, K., and Mortazavi, I. (2017). Flow analysis of square-back simplified vehicles in platoon. Int. J. Heat Fluid Flow 66, 43–59. doi:10.1016/j.ijheatfluidflow.2017.05.008
Davila, A., Aramburu, E., and Freixas, A. (2013). Making the best out of aerodynamics: platoons (No. 2013-01-0767). SAE Technical Paper.
Dominy, R. G. (1990). The influence of slipstreaming on the performance of a Grand Prix racing car. Proc. Institution Mech. Eng. Part D J. Automob. Eng. 204 (1), 35–40. doi:10.1243/pime_proc_1990_204_130_02
Gan, E. C. J., Fong, M., and Ng, Y. L. (2020). CFD analysis of slipstreaming and side drafting techniques concerning aerodynamic drag in NASCAR racing. CFD Lett. 12 (7), 1–16. doi:10.37934/cfdl.12.7.116
He, M., Huo, S., Hemida, H., Soper, D., Sterling, M., and Baker, C. (2022). The flow around a lorry platoon subject to a crosswind—a detached Eddy simulation. Front. Future Transp. 3, 901204. doi:10.3389/ffutr.2022.901204
Heffley, R. K. (1973). Aerodynamics of passenger vehicles in close proximity to trucks and buses. SAE Transactions, 901–914.
Humphreys, H., and Bevly, D. (2016). Computational fluid dynamic analysis of a generic 2 truck platoon (No. 2016-01-8008). SAE Technical Paper.
Kospach, A., and Irrenfried, C. (2022). “Truck platoon slipstream effects assessment,” in Energy-efficient and semi-automated truck platooning (Cham: Springer).
Le Good, G., Resnick, M., Boardman, P., and Clough, B. (2018). Effects on the aerodynamic characteristics of vehicles in longitudinal proximity due to changes in style (No. 2018-37-0018). SAE Technical Paper.
Liu, J., Gu, Z., Huang, T., Li, S., Zheng, L., and Sun, K. (2019). Coupled analysis of the unsteady aerodynamics and multi-body dynamics of a small car overtaking a coach. Proc. Institution Mech. Eng. Part D J. Automob. Eng. 233 (14), 3684–3699. doi:10.1177/0954407019831559
National Highways (2022). HelmUK advanced platooning trials - final report. London: National Highways. Available at: https://nationalhighways.co.uk/media/l43fgudu/helmuk-final-report.pdf.
Noger, C., Regardin, C., and Széchényi, E. (2005). Investigation of the transient aerodynamic phenomena associated with passing manoeuvres. J. fluids Struct. 21 (3), 231–241. doi:10.1016/j.jfluidstructs.2005.05.013
Robertson, F. H., Bourriez, F., He, M., Soper, D., Baker, C., Hemida, H., et al. (2019). An experimental investigation of the aerodynamic flows created by lorries travelling in a long platoon. J. Wind Eng. Industrial Aerodynamics 193, 103966. doi:10.1016/j.jweia.2019.103966
Sano, M., Nagahisa, T., and Kobayashi, T. (1984). Unsteady aerodynamical forces by interference of two bluff bodies moving closely: on unstable phenomenon of automobile running at high speed. Bull. JSME 27 (226), 675–682. doi:10.1299/jsme1958.27.675
Siegel, D. (2018). Bus manufacturer hit with $18.7M verdict over cyclist’s death CVN. Available at: https://blog.cvn.com/bus-manufacturer-hit-with-18.7m-verdict-over-defective-design-that-caused-cyclists-death (Accessed November 23, 2023).
Soper, D., Baker, C., and Sterling, M. (2014). Experimental investigation of the slipstream development around a container freight train using a moving model facility. J. Wind Eng. Industrial Aerodynamics 135, 105–117. doi:10.1016/j.jweia.2014.10.001
Spence, A. J., Thurman, A., Maher, M., and Wilson, A. M. (2009). Speed, strategy, drag and drafting in thoroughbred horse racing. Comp. Biochem. Physiology, Part A 2 (153), S127. doi:10.1016/j.cbpa.2009.04.216
Sterling, M., Quinn, A. D., Hargreaves, D. M., Cheli, F., Sabbioni, E., Tomasini, G. M., et al. (2010). A comparison of different methods to evaluate the wind induced forces on a high sided lorry. J. Wind Eng. Industrial Aerodynamics 98 (1), 10–20. doi:10.1016/j.jweia.2009.08.008
Tsuei, L., Hedrick, J. K., and Savas, Ö. (1999). Transient aerodynamic effects on a four-car platoon during passing maneuvers: data summary. UC Berkeley: California Partners for Advanced Transportation Technology.
Tsuei, L., and Savas, Ö. (2000). A wind tunnel investigation of the transient aerodynamic effects on a four-car platoon during passing maneuvers. SAE Technical Paper, 1470–1482.
Uddin, M., Chellaram, A. D., and Robinson, A. C. (2017). CFD investigations of the aerodynamics of vehicle overtaking maneuvers. AIP Conf. Proc. 1851 (1). doi:10.1063/1.4984714
Veldhuizen, R., Van Raemdonck, G. M. R., and Van der Krieke, J. P. (2019). Fuel economy improvement by means of two European tractor semi-trailer combinations in a platooning formation. J. Wind Eng. Industrial Aerodynamics 188, 217–234. doi:10.1016/j.jweia.2019.03.002
Wang, D., Xia, C., Jia, Q., and Yang, Z. (2023). Effects of vehicle numbers and vehicle types on drag reduction of platoons with different front-edge radius (No. 2023-01-0951). SAE Technical Paper.
Yamamoto, S., Yanagimoto, K., Fukuda, H., China, H., and Nakagawa, K. (1997). Aerodynamic influence of a passing vehicle on the stability of the other vehicles. JSAE Rev. 18 (1), 39–44. doi:10.1016/s0389-4304(96)00063-x
Keywords: platooning, wind tunnel, vehicle aerodynamics, HGVs, vehicle overtaking
Citation: Marshall SD, Snape K, Soper D, Sterling M and Gillmeier S (2024) The aerodynamic performance of a platoon of lorries in close-proximity during an overtaking manoeuvre. Front. Future Transp. 5:1356539. doi: 10.3389/ffutr.2024.1356539
Received: 15 December 2023; Accepted: 01 April 2024;
Published: 16 April 2024.
Edited by:
Paolo Schito, Polytechnic University of Milan, ItalyCopyright © 2024 Marshall, Snape, Soper, Sterling and Gillmeier. This is an open-access article distributed under the terms of the Creative Commons Attribution License (CC BY). The use, distribution or reproduction in other forums is permitted, provided the original author(s) and the copyright owner(s) are credited and that the original publication in this journal is cited, in accordance with accepted academic practice. No use, distribution or reproduction is permitted which does not comply with these terms.
*Correspondence: David Soper, ZC5zb3BlckBiaGFtLmFjLnVr