Tipping points in freshwater ecosystems: an evidence map
 Ana Hernández Martínez de la Riva1*
  Meagan Harper1,2
  Trina Rytwinski1,2 Angeli Sahdra1
  Jessica J. Taylor1,2 Brittany Bard3 Joseph R. Bennett1,2 Declan Burton1,2
  Irena F. Creed4 Laura S. E. Haniford1 Dalal E. Hanna1 Evaline J. Harmsen1 Courtney D. Robichaud1
  John P. Smol5
  Myra Thapar1
  Steven J. Cooke1,2
- 1Department of Biology, Carleton University, Ottawa, ON, Canada
- 2Canadian Centre for Evidence-Based Conservation, Institute of Environmental and Interdisciplinary Science, Carleton University, Ottawa, ON, Canada
- 3Department of Biology, University of Ottawa, Ottawa, ON, Canada
- 4Department of Physical and Environmental Sciences, University of Toronto Scarborough, Toronto, ON, Canada
- 5Paleoecological Environmental Assessment and Research Lab, Department of Biology, Queen's University, Kingston, ON, Canada
Freshwater ecosystems face numerous threats, including habitat alteration, invasive species, pollution, over extraction of resources, fragmentation, and climate change. When these threats intensify and/or combine with each other, their impacts can shift the ecosystem past a tipping point, producing a major and potentially irreversible shift in state, called a regime shift. We generated an evidence map to assess the current state of knowledge on tipping points in freshwater ecosystems. Our evidence mapping exercise revealed large knowledge gaps. Specifically, there are relatively few studies that explore the effects of tipping points in relation to (1) lotic systems (i.e., rivers, streams), (2) amphibians, mammals, or reptiles, and (3) the interactive impacts of multiple threats. In addition, most studies tended to have short study durations (<1 year), and few studies explored the reversibility of an ecosystem change after a tipping point was crossed. Concentrating future research on these gaps to improve understanding of tipping points in freshwater ecosystems in a holistic manner is important to help develop tools to forecast (and thus mitigate) the emergence and effects of tipping points, as well as to guide restoration actions.
1. Introduction
Crossing a “tipping point” can cause dramatic, long-term changes in ecosystem structure and function, resulting in entirely different ecosystems than were present before the transition. Tipping points have been identified in almost every ecosystem, with examples ranging from transitions of pine to broadleaf forest due to severe drought in terrestrial ecosystems (Haberstroh et al., 2022), to coral reefs being outcompeted by seaweed in systems with decreased herbivory in marine ecosystems (Holbrook et al., 2016). In freshwater ecosystems, examples of tipping points include switches in lakes from macrophyte-dominated, clear conditions to macrophyte-free, turbid conditions due to land-use changes (Schallenberg and Sorrell, 2009), post-invasion transitions from communities dominated by native species to invasive species communities (Hansen et al., 2013), and changes in species assemblage structure after dam construction (Gao et al., 2019), amongst other triggers.
Tipping points (also called thresholds or breakpoints) are often triggered by small alterations in the drivers present in the ecosystem (i.e., natural, or anthropogenic environmental parameters outside the natural range of variation for the ecosystem; Hughes et al., 2013; Côté et al., 2016). They may also be triggered by the intensification of single or multiple drivers, or the addition of new drivers that were not present prior to the change. If these changes in drivers result in a non-linear response in ecosystem conditions and the tipping point is crossed, the ecosystem will shift between two (or more) alternative states. This transition is considered a “regime shift” (Scheffer et al., 2001; Hughes et al., 2013; van Nes et al., 2016). If reinforced by feedback mechanisms, these transitions may be irreversible (Hughes et al., 2013; van Nes et al., 2016), at which point the ecosystem has entered a new alternative stable state (Scheffer and Carpenter, 2003). We use the term “stable” with the understanding that this is dependent on the timescale considered. Hysteresis is present if a new state can persist even when drivers are relaxed, making it difficult to return the ecosystem to its original state (Litzow and Hunsicker, 2016). While some regime shifts can be reversed once a tipping point has been crossed, it is often extremely difficult, expensive, and time-consuming to do so, making early identification and action an important goal for ecosystem managers (Kelly et al., 2014; Selkoe et al., 2015).
It is difficult to predict if tipping points will occur (Scheffer et al., 2009) or if an ecosystem has the capacity to be resistant or resilient to threats. The paths that can lead an ecosystem toward tipping are equally diverse and complex (Filbee-Dexter et al., 2017). Ecosystems that face numerous natural and anthropogenic drivers are particularly at risk of experiencing tipping points because of the increased likelihood of multiple drivers interacting additively or synergistically (Folt et al., 1999). This may push a system closer toward a tipping point than would otherwise be anticipated (Côté et al., 2016). Understanding if and when these interactions lead to tipping points, and how tipping points influence ecosystems, have been identified as research priorities across diverse ecosystems (Allsopp et al., 2019; Friedman et al., 2020; Dey et al., 2021).
Identifying the conditions that have led to previous tipping points is an important step in determining if, when, and where tipping points are likely to occur, due to the risks associated with complete ecosystem change [i.e., decline in biodiversity or ecosystem function (Evans et al., 2017) or loss of ecosystem functions and associated services (Watson et al., 2021)]. In many cases, the conditions leading to tipping points are identified only after a regime shift has occurred and therefore prediction of tipping points may not always be possible. Consequently, a better understanding of reversibility of tipping points is necessary to enable management entities to help bolster ecosystem components that facilitate management actions targeting reversibility, especially since restoration actions may not always have the expected results (e.g., Weber et al., 2020).
The threat of tipping points in freshwater ecosystems is significant (Jackson et al., 2010; Robin et al., 2014; Griffiths et al., 2017), and likely to grow. Freshwater ecosystems are in a biodiversity crisis (Harrison et al., 2018; Albert et al., 2021), with monitored vertebrates experiencing an 83% biodiversity decline since 1970 according to the Living Planet Report, well outpacing terrestrial, and marine declines (WWF, 2022). This may reflect a loss of functional resilience in these systems (e.g., Oliver et al., 2015) and is one early warning signal commonly used to identify impending tipping points (i.e., a critical slowing down; Scheffer et al., 2009). This biodiversity crisis has spurred the development of Emergency Recovery Plans to reverse this trend (Tickner et al., 2020), and calls for actions to decrease the potential for future tipping points in freshwater systems, such as controlling non-native species invasions or improving water quality.
Freshwater ecosystems are impacted by both persistent and emerging threats (e.g., Reid et al., 2019), which may interact to produce the conditions where tipping points are more likely to occur. Environmental decisions for freshwater systems will have to consider interactions of these drivers, whether they are between large-scale drivers such as climate change (IPCC, 2021), or smaller, local scale drivers such as increased boat traffic or construction of docks (Sagerman et al., 2020). With the status of many freshwater species still unclear due to lack of sufficient data (Desforges et al., 2022), improving our overall understanding of tipping points could inform future paths toward reducing the likelihood of pushing freshwater ecosystems past tipping points or in reversing the trajectory if a freshwater ecosystem has been pushed past a tipping point. Bodies involved in the regulation (i.e., government agencies), exploitation (i.e., developers or resource extractors), and protection (i.e., ecosystem managers or Indigenous communities) of freshwater ecosystems therefore require evidence of the threats, especially multiple and cumulative impacts of these threats, and of the potential for reversibility of the trajectory to and past tipping points across freshwater ecosystems.
Past reviews have focused on the theoretical basis for tipping points, including defining tipping points in different contexts (Milkoreit et al., 2018), identifying and detecting early warning signals (Burthe et al., 2016; Litzow and Hunsicker, 2016), and identifying and detecting alternative stable states (Petraitis and Dudgeon, 2004). Past reviews have also considered tipping points in different ecosystems such as marine (Rocha et al., 2015), Amazonian forest (Nobre and Borma, 2009), and polar regions (Lenton, 2012). Some of these previous reviews have focused on specific drivers of ecosystem change in different ecosystems [i.e., invasive species (Gaertner et al., 2014; Reynolds and Aldridge, 2021)]. While those reviews provide good evidence of the drivers and processes that ecosystems may experience prior to a tipping point, they do not summarize the specific evidence of freshwater tipping points for managers and practitioners faced with managing freshwater ecosystems. Freshwater tipping points are often used as examples of their occurrence in natural ecosystems (i.e., Scheffer and Carpenter, 2003), but freshwater ecosystems remain less represented in the tipping points literature than other ecosystems. For example, a recent bibliometric analysis of tipping points and related terms found marine ecosystems were represented more than twice as frequently in the literature as freshwater ecosystems (Carrier-Belleau et al., 2022). Identifying existing gaps in current knowledge of freshwater tipping points will be a valuable contribution to freshwater ecosystem management. Past reviews with a freshwater focus have considered experimental studies of tipping points due to multiple drivers across aquatic ecosystems (e.g., Carrier-Belleau et al., 2022), or field studies of regime shifts and alternative stable states in freshwater systems (Bayley et al., 2007; Capon et al., 2015), although without considering paleo-ecological data. Such syntheses provide an initial understanding of tipping points and regime shifts in freshwater ecosystems.
An evidence map is a method used to identify and describe key concepts, types of evidence, and gaps in research related to a defined area or field. The evidence map presented here provides an update to previous tipping point research by including new evidence. The objective of this evidence map is to provide a collated summary of the existing body of literature addressing the effects of tipping points, with a specific focus on freshwater ecosystems, and was initiated to help support ecological management in Canadian freshwaters but was intentionally global in scope. We describe key characteristics of the evidence base, including the number of publications, the use of tipping points terminology in these publications, the study locations and designs, the habitats and aquatic taxa, the single and multiple anthropogenic drivers of tipping points, and the measured outcomes (at the population or community level) of tipping points. We build on previous research by including: (1) observational studies (in addition to experimental studies) and paleo-ecological evidence; (2) a more recent search that includes both gray and peer-reviewed literature that captures new evidence; and (3) a description of whether studies assess the reversibility of tipping points. For this evidence map, we focus primarily on tipping points and alternative stable states, using the terminology and definitions proposed by Carrier-Belleau et al. (2022).
2. Methods
To improve the rigor, transparency, and repeatability of our methods, this synthesis was developed adopting best practices from the Collaboration for Environmental Evidence (2018) and ROSES reporting standards (Haddaway et al., 2018). At the beginning of this mapping exercise, we established an advisory team made up of Canadian scientists with knowledge of freshwater ecosystems and tipping points, and literature review experts. The advisory team consulted on all aspects of the work, including the development of the search string, inclusion criteria for article screening, and data extraction strategy.
2.1. Searching for articles
We conducted two literature searches in Web of Science Core Collection (WoSCC) accessed from the University of Ottawa's institutional subscription. The first search was conducted in October 2021 and the second in January 2022 (Table 1). We conducted a second search to capture additional terms identified from the work of Carrier-Belleau et al. (2022). A list of potentially relevant search terms was developed in consultation with the advisory team and broken into two components: population (freshwater ecosystem terms) and exposure (tipping points terms). The review team then developed a set of search strings that were modified and refined iteratively through a scoping exercise that evaluated the sensitivity of the search terms and associated wildcards. The comprehensiveness of the search strings was tested using a list of benchmark papers (Supplementary material 1) that were identified as relevant for this map by the advisory team. Search terms for both searches were limited to the English language due to project resource restrictions; however, no language, geographic, or document type restrictions were applied during the searches. We refined the results by using the post-query filter “research areas” and excluded papers from irrelevant disciplines such as medicine or criminology (Table 1). All articles found by WoSCC searches were exported into EPPI-Reviewer Web1 (Thomas et al., 2022). Prior to screening, duplicates were identified and removed. We also issued a call for evidence to target gray literature sources (i.e., thesis, government documents, consultant reports, etc.) and distributed to relevant mailing lists and social media platforms (Oct/Nov 2021).
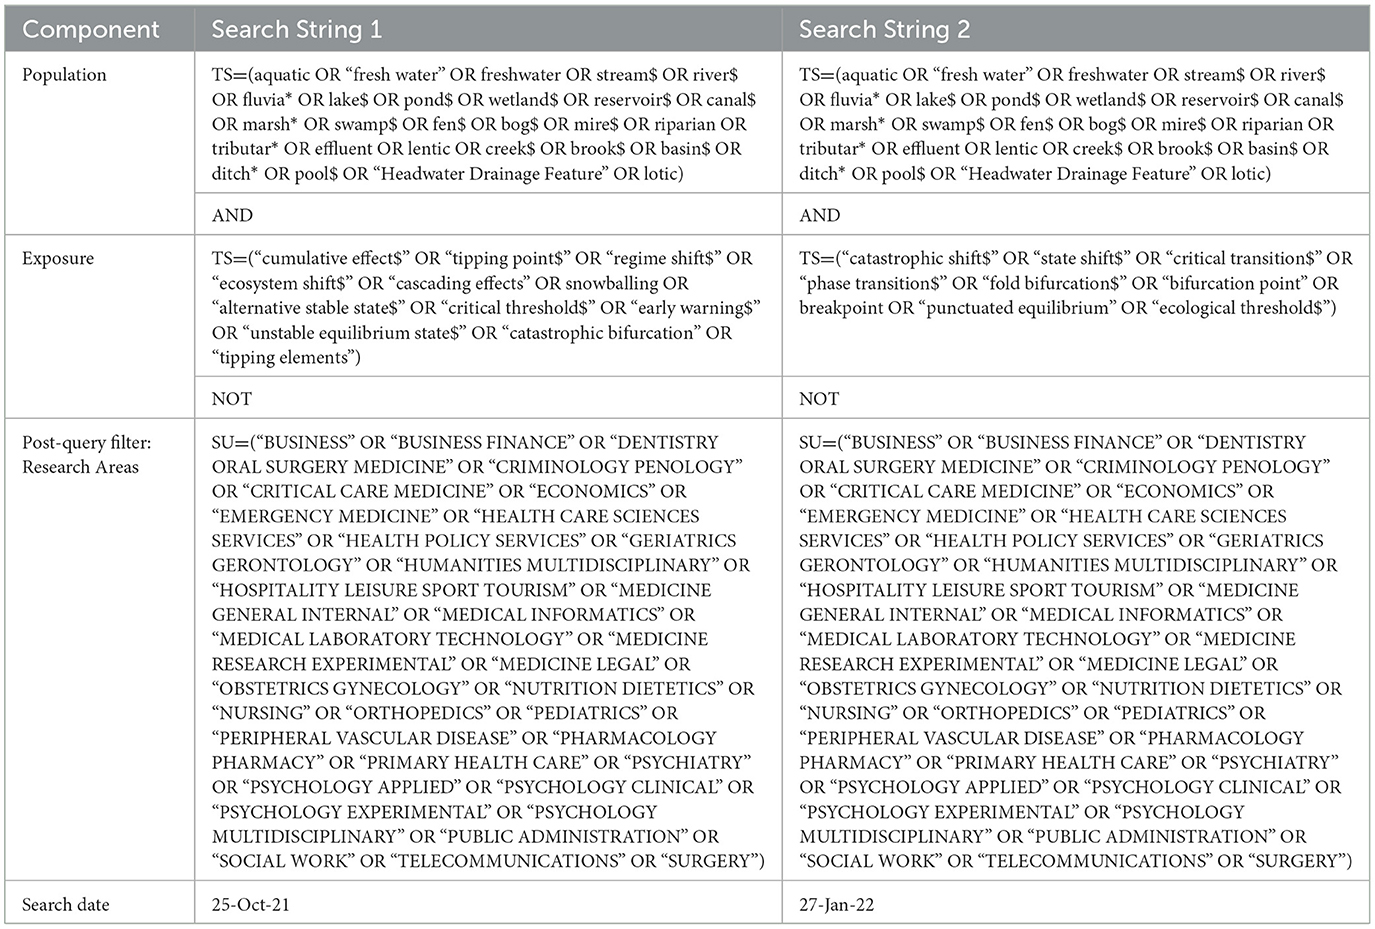
Table 1. Search strings used to execute searches in Web of Science Core Collection.
2.2. Screening and eligibility
2.2.1. Screening process
We screened articles found in WoSCC at two distinct stages: (1) title and abstract; and (2) full text. We screened articles found via the gray literature call at the full-text stage and these were not included in consistency checks. We used a semi-automated approach for title and abstract screening by employing a text-based machine learning algorithm in the EPPI-Reviewer software to prioritize relevant articles (Thomas, 2013). During this priority screening we identified a logical cut off point (i.e., a plateau where new articles were no longer being included) at which point title and abstract screening was stopped. All full-text screening was done in Microsoft Excel.
Prior to screening all articles, we performed a consistency check to ensure that consistent and repeatable decisions were being made by reviewers. This included allocating a subset of 167 articles at title and abstract screening (2% of all WoSCC search results) and 18 of 492 articles at full text (4% of included articles from WoSCC searches) screening stages for each reviewer to screen independently. After the consistency check screening, we did a comparison and any disagreements among reviewers were discussed and inclusion criteria clarified before moving forward. For complex cases, the review team consulted to discuss further. Reviewers did not screen any article at either stage to which they were an author. We made attempts to retrieve missing articles by requesting them via University of Ottawa and Carleton University Interlibrary Loans. No formal study validity assessment (i.e., study susceptibility to bias) was performed on included articles. However, the metadata extracted on study design allowed us to provide a very basic overview of the robustness and relevance of the evidence (i.e., internal validity) and incorporated into the discussion of results to provide recommendations for future research needs and considerations.
2.2.2. Eligibility criteria
Table 2 criteria had to be met for articles to be included in the evidence map.
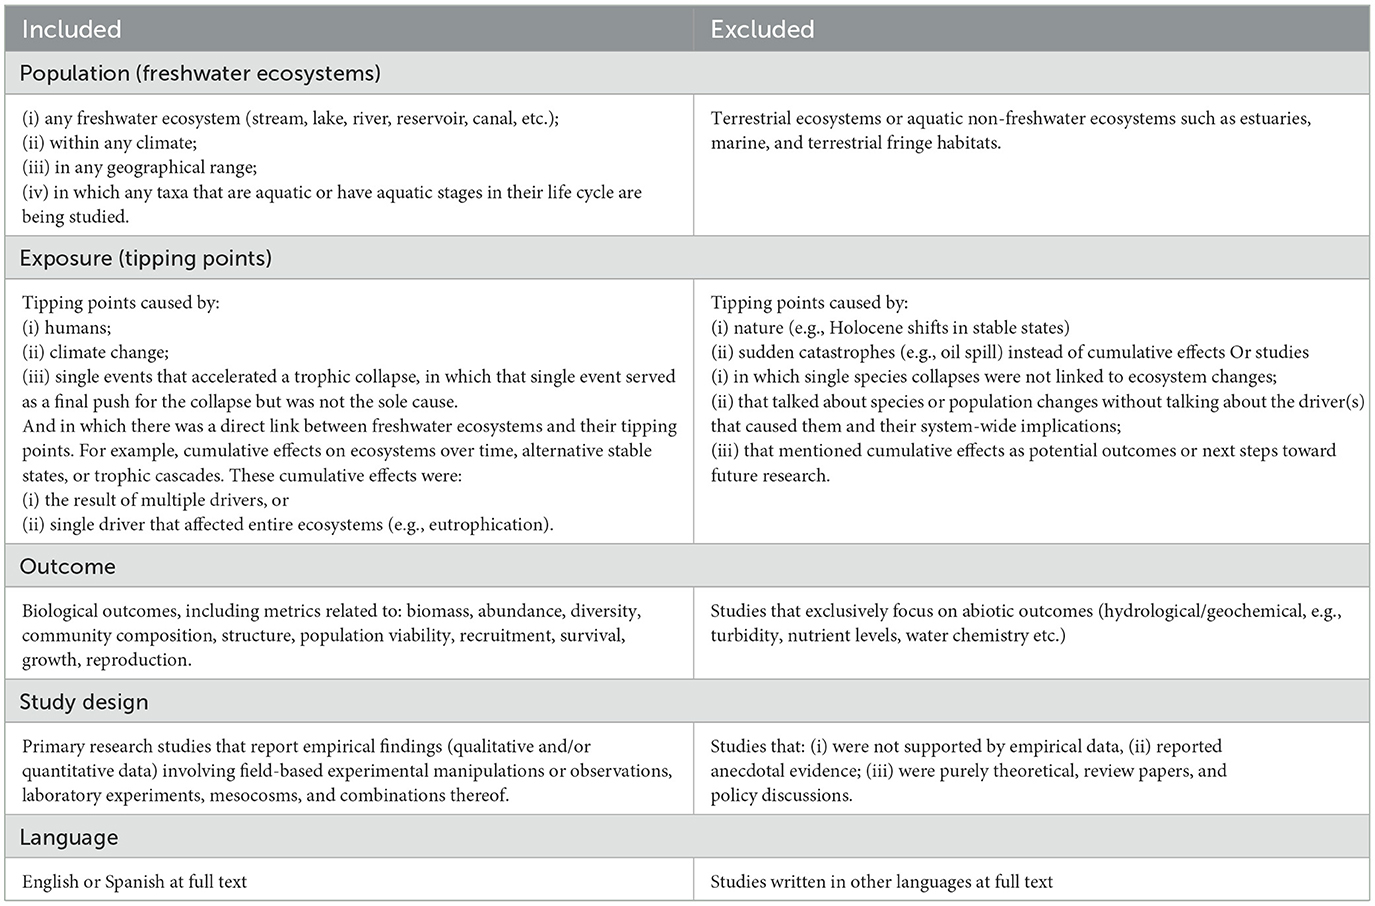
Table 2. Article inclusion and exclusion criteria.
2.3. Data coding strategy
Following full-text screening, we conducted meta-data extraction on all included articles. When multiple relevant studies were reported in a single article, and/or multiple datasets were used to analyze responses of different taxa to a tipping point being reached, we entered each study and/or dataset as independent lines in the codebook (refer to Table 3, for definitions of terms used throughout the evidence map). We identified and combined articles that reported data that could be found elsewhere or that could be combined with another more complete source. Here, we identified the most comprehensive article as the primary study and less complete sources as Supplementary material.

Table 3. Definition of terms used throughout the review.
In developing the evidence map data extraction form and codebook (i.e., code sheet for all codes used in extraction form), we identified the following key variables through scoping activities and discussion with the advisory team: (1) bibliographic information; (2) study location [i.e., country, type of freshwater ecosystem, habitat type sensu (WWF/TNC, 2019)]; (3) system information (i.e., type of driver, tipping points terminology, reversibility); (4) taxonomic information (i.e., type of organism, number of focal species); (5) study design (i.e., study duration, type of study); and (6) outcome information (i.e., biological indicators). We developed the coding options within these key variables in a partly iterative process, adding new categories and options as consistency checks, and then data extraction proceeded. When determining whether a study had assessed the reversibility of tipping points, we used a “Yes” code if the study incorporated reversibility into a before/after study design or reported data on a shift back to the “original” state (e.g., articles that evaluated the success of a restoration action, before/after state of an ecosystem). We used a “No” code when reversibility was not assessed, or authors only suggested possible reversibility but their statements were not supported by empirical data. In most cases, we extracted data based on author reported information, although we identified major habitat types (e.g., temperate floodplain rivers and wetlands using the Freshwater Ecoregion of the World Interactive Map2 (Abell et al., 2008). We coded data that were missing or unclear as “unclear”.
We conducted a consistency check (i.e., cross-checking) at the data extraction stage with a subset of nine articles to ensure that data extraction was conducted in a consistent and repeatable manner. When inconsistencies arose, we discussed discrepancies amongst the reviewers and included additional guidance in the codebook.
2.4. Data mapping method
We created the evidence map database in Microsoft Excel and provided the number and key characteristics of the studies found on tipping points in freshwater ecosystems (see Supplementary material 2). We used descriptive statistics to describe the key variables, summarizing information in figures. We compiled the distribution and frequency of the evidence base into structured heatmaps showing linkages between two categorical variables [e.g., tipping point drivers (columns) and taxonomic responses (rows) in the presence of tipping points, and the associated regime shift components (such as alternative stable states or hysteresis)]. Because studies could include multiple interactions between drivers and responses, we mapped individual studies to more than one cell if applicable. We describe results narratively at the level of the study (see definitions in Table 3). Note that the evidence map did not estimate or validate the direction, magnitude (including effect size) or statistical significance of the effect of drivers resulting in tipping points and causing taxonomic-specific responses, but was used to identify potential gaps in the available evidence base of tipping points research (i.e., subtopics that are un- or under-reported in the evidence base that may benefit from further primary research) and evidence clusters (i.e., areas with a higher frequency of studies that may be suitable for deeper synthesis).
3. Results
3.1. Literature searches and screening
The searches in WoSCC yielded 10,782 articles (Figure 1), of which 267 were identified as duplicates and removed from the screening process. This resulted in 10,515 articles for title and abstract screening. Using EPPI-Reviewer Priority Screening (Thomas, 2013), we stopped title and abstract screening after 95% of articles (9,977/10,515) were screened as a plateau was reached with no new inclusions made after 2,084 consecutive articles. This resulted in 538 articles assumed to be irrelevant and excluded at the title and abstract stage. Of the 9,977 articles screened at title and abstract, 9,522 were excluded, yielding 455 articles for full-text screening. Of these articles, one was not retrievable through University of Ottawa or Carleton University subscriptions or Interlibrary Loans.
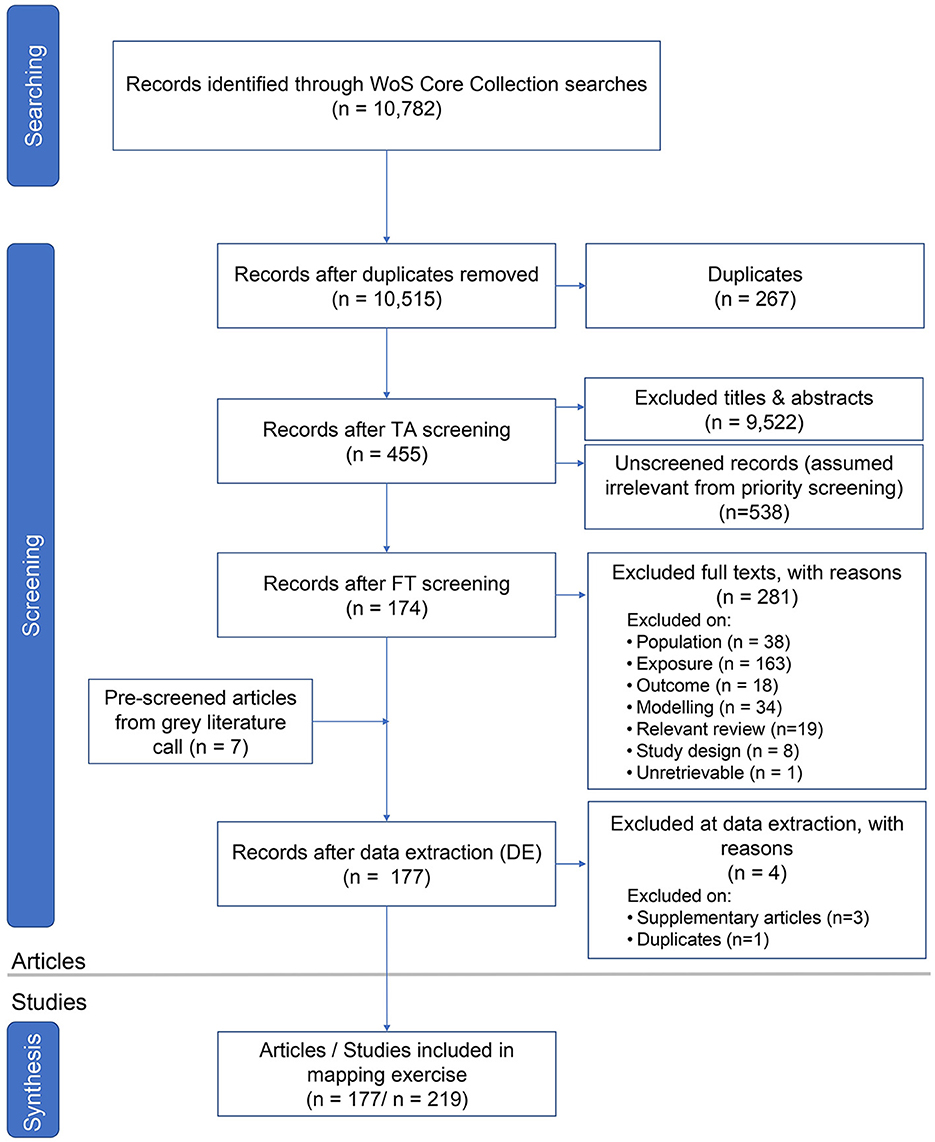
Figure 1. ROSES flow diagram (Haddaway et al., 2018) indicating the results of the literature search, and the number of articles included or excluded at the screening and data extraction stages.
Full text screening removed 281 articles, most of which were excluded because of an irrelevant exposure (e.g., article did not look at a cumulative impact at the ecosystem level and instead focused on sudden catastrophes or single species collapse), target ecosystem (e.g., article examined a tipping point or associated regime shift studied in a non-freshwater ecosystem), or outcome (e.g., article only measured impacts in abiotic factors such as turbidity and nutrient levels). Articles excluded at full text with reasons for their exclusion can be found in Supplementary material 3. An additional seven research items from pre-screened gray literature submissions were obtained via social media/email and were moved forward to data extraction.
A total of 181 articles were initially included for data extraction. We excluded four articles at this stage, including three that were considered Supplementary material and one that was a missed duplicate. This resulted in 219 studies from 177 articles included in the evidence map after data extraction (see Figure 1 for flow diagram of inclusion/exclusion process results).
3.2. Summary of the evidence base
3.2.1. Publication trends
Article publication dates ranged from 1993 to 2022. Most of the articles were published after 2016, suggesting an increased focus on tipping points in the last seven years (Figure 2).
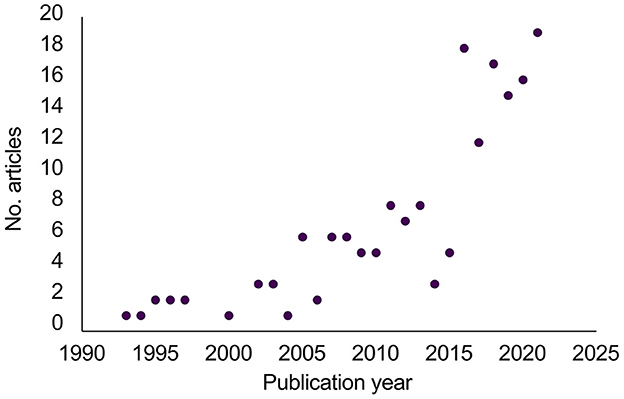
Figure 2. Publication years for the 177 included articles. An additional three articles published in early 2022 were included but not shown since searches only included 1 month in 2022.
The terminology that authors used to describe tipping point research changed over time (Figure 3), from being dominated by three terms (i.e., alternative stable state, cascading effects, and stable state) in the 1990s, to 16 terms in use after 2016. Frequency of use varied depending on the time period, and new terms came into use at various periods. For example, the use of the term “alternative stable state” was common between 1996–2000 (of the eight articles published during this time period, this was the only term used), but its proportional use was less common in other time periods, and “tipping points” did not become common usage until after 2011.
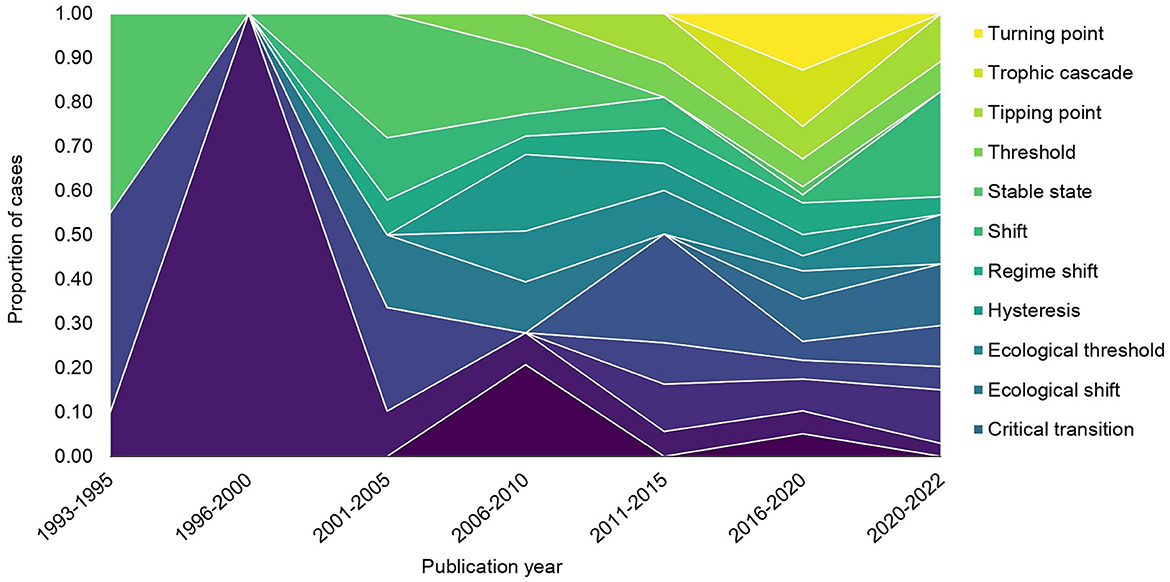
Figure 3. Change in author terminology for tipping point literature through time. The proportion of cases was determined from the total number of cases per five-year publication increment. Note that 1993-1995 and 2020-2022 are partial increments due to data availability. Only author terminology used five or more times in the database (i.e., ≥1% of all cases each) was considered.
Of the author terms used five or more times, the most frequently used terms were: regime shift (125/431 cases; 29%); alternative stable state (96; 22%); and thresholds (65; 15%). All other terms were used <30 times each. When comparing author terms that were the same as terms proposed in Carrier-Belleau et al. (2022), called “standardized terms” hereafter, breakpoint was most frequently consistent with this terminology (23/23 cases), followed by regime shift (121/125 cases), alternative stable state (89/96 cases), and tipping point (21/26 cases). Hysteresis was consistently used 50% of the time or did not match any definition clearly enough to be assigned (Figure 4).
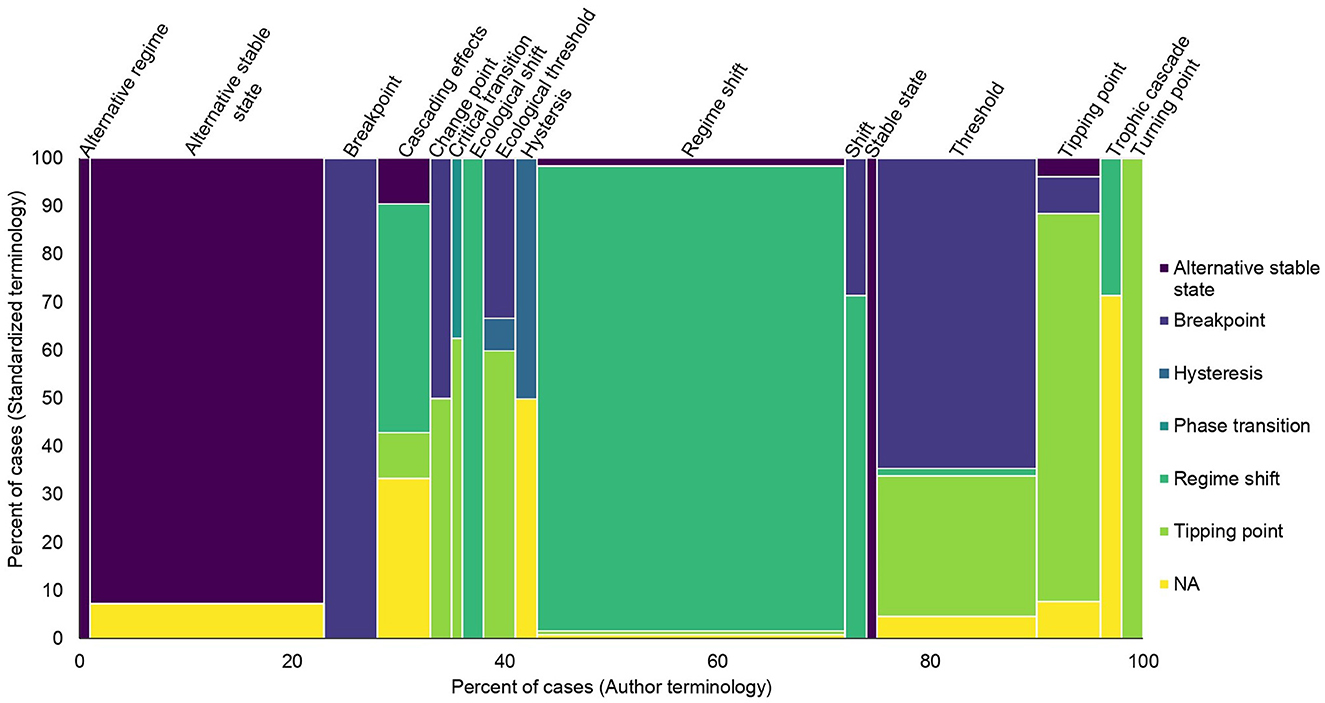
Figure 4. Comparison of author terms usage to standardized terminology as defined by the review team and based on Carrier-Belleau et al. (2022).
3.2.2. Study location
A total of 234 cases were studied in 44 countries (one additional case did not report the study location). Cases took place in Europe (83 cases; 35%), North and Central America (72 cases; 31%), and Asia (47 cases; 20%) (Figure 5). Cases in South America, Africa, Oceania, and Eurasia accounted for the remaining 14% (Figure 5). The most frequently studied countries were the United States (47 cases; 20%) where the most represented state was Michigan, China (38 cases; 16%) where the most represented province was Hubei Province, and Canada (21 cases; 9%) where the most represented province/territory was Nunavut (Supplementary Figures S1a–c; Supplementary material 4).
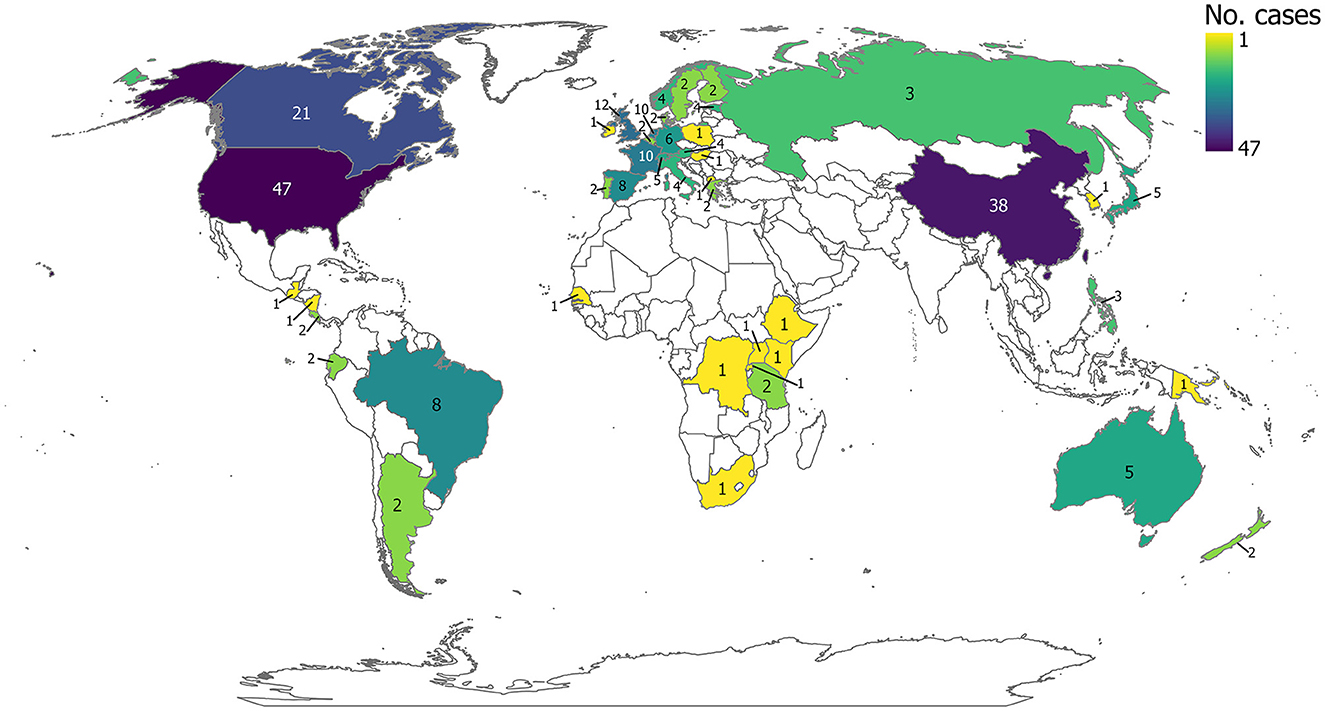
Figure 5. Geographic distribution of evidence, displaying the number of cases per country. Since some studies were conducted in more than one country, counts are the number of cases. Esri Inc. (2022). ArcGIS Pro (Version 10.8.2). Software. Redlands, CA: Esri Inc. (https://www.esri.com/en-us/arcgis/products/arcgis-pro/overview).
3.2.3. Study design
Study designs were either field-based, mesocosm experiments, laboratory-based, or a combination of different study designs. Among studies with a single study design, 157 studies (72% of 219 studies) were field-based (149 observational, eight experimental), 26 studies (12%) were mesocosm experiments, and five studies (2%) were laboratory experiments. For studies conducted using a combination of different study designs (31 studies; 14%), the majority combined field-based assessments with a laboratory or modeling component.
Study duration ranged from <1 to 61 years of sampling. Many cases had study durations of <1 year (47 cases; 21%) or between one and 10 years (62 cases; 27%) (Figure 6). There was insufficient information to determine study duration for 28 cases (12%). For studies using reconstructed sediment or peat cores or other historical sources (38 cases; considered here separately from other field-based monitoring studies for this key variable), the range in duration of years reconstructed was 60 to 2,000 years.
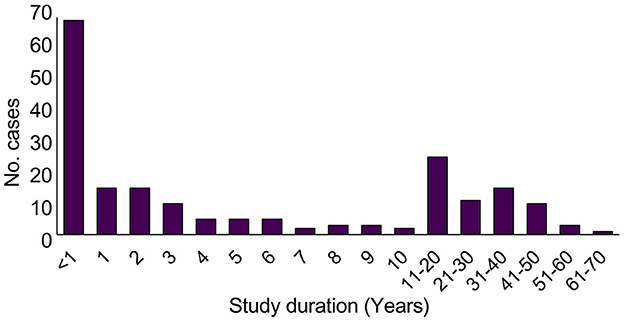
Figure 6. Frequency of study duration in years. An additional 28 cases did not specify study duration. Studies using reconstructed sediment or peat cores, or other historical data are not included in counts.
3.2.4. Ecosystems and major habitat types
The most studied ecosystems were lakes (109/219 studies; 50%), followed by rivers (22; 10%), and streams (20; 9%). Wetlands, ponds, peatlands, and reservoirs were considered in eight or fewer studies each (12%). A total of 31 studies (14%) were carried out in mesocosm/laboratory settings and could therefore not be attributed to a particular ecosystem. Nine studies (4%) took place in more than one type of ecosystem, and three studies (1%) took place in other types of ecosystems, such as navigation pools (a cross between a river and a reservoir), bay transition zones, or ditches. Therefore, of the studies that reported specific individual freshwater ecosystems, most occurred in lentic systems (61%) (Figure 7).
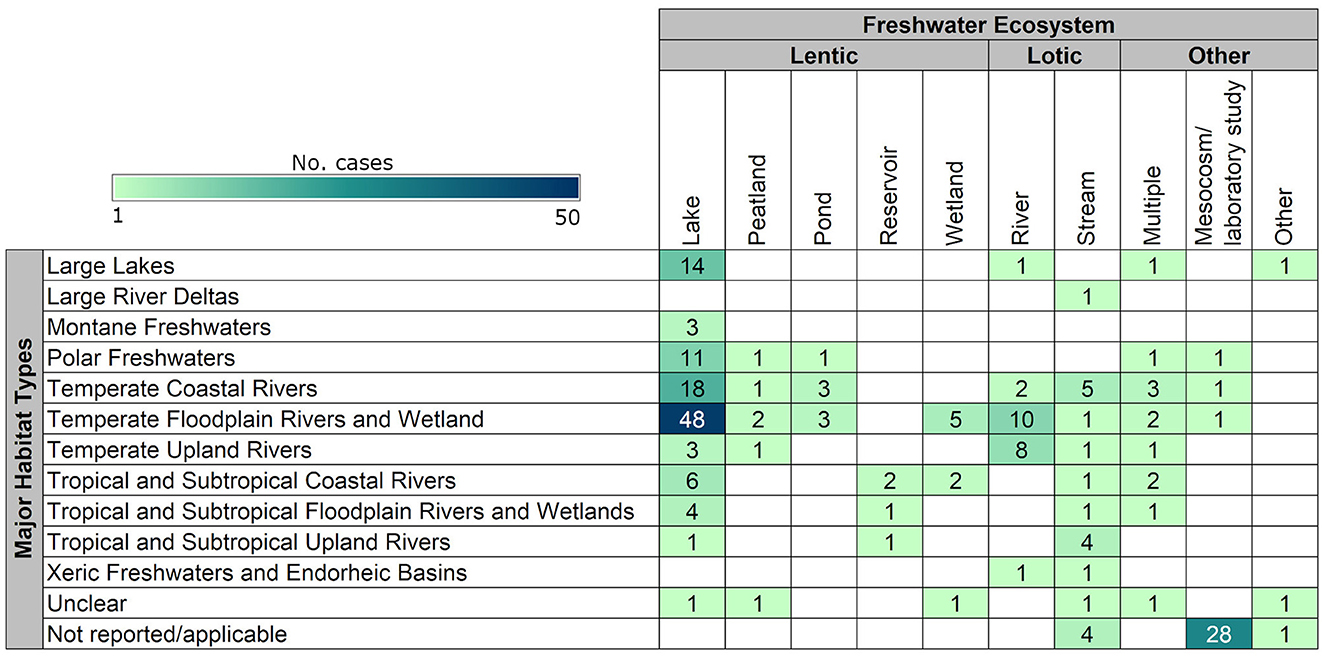
Figure 7. Distribution and frequency of cases (n = 222) occurring in different freshwater ecosystems (Abell et al., 2008) and major habitat types (WWF/TNC, 2019).
Regarding major habitat types, most of the cases took place in temperate floodplain rivers and wetlands (72/222 cases; 32%), followed by temperate coastal rivers (33; 15%). A similar number of cases took place in large lakes, polar freshwaters, temperate upland rivers, and tropical and subtropical coastal rivers, with between 13 to 17 cases each. Other major habitat types studied included tropical and subtropical floodplain rivers and wetlands, tropical and subtropical upland rivers, montane freshwaters, xeric freshwaters and endorheic basins, and large river deltas, with seven or fewer cases each. No cases took place on oceanic islands. Thirty-nine cases (18%) had either insufficient information to determine the type of major habitat type considered (i.e., information was unclear or not reported), or consideration of major habitat type was not directly applicable (i.e., in the case of mesocosm or laboratory studies; Figure 7).
When considering ecosystems within major habitat types, the most common combination was lakes in temperate floodplain rivers and wetlands (48 cases; 22%). Other common combinations included lakes in temperate coastal rivers (18 cases; 8%) and mesocosm or laboratory studies not attributed to a particular ecosystem (28 cases; 13%) (Figure 7).
3.2.5. Taxonomic groups
The most frequently studied taxonomic group was microbiota (138 datasets; 43%), followed by invertebrates (69 datasets; 21%), plants (59 datasets; 18%), and fish (50 datasets; 15%). The least studied taxonomic groups were birds (7 datasets; 2%), and amphibians (1 dataset; < 1%). No studies considered mammals or reptiles (Figure 8).
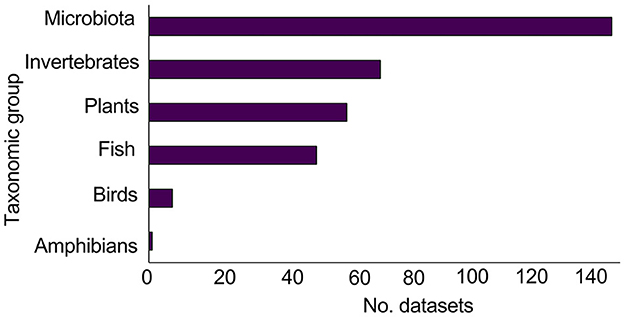
Figure 8. Number of datasets (n = 324) for each taxonomic group. No studies considered mammals or reptiles.
3.2.6. Anthropogenic drivers
There were 147 studies (67%) that investigated a single driver, 66 studies that investigated multiple drivers (30%), and six studies (3%) that did not provide sufficient information to determine the type of driver studied. The most common single driver studied was chemical (67 studies; 31%), followed by climate change (28 studies; 13%), physical (25 studies; 11%), and biological (24 studies; 11%). Three studies (1%) examined other types of drivers such as flooding (potentially linked to climate change; Laine and Frolking, 2019), land-cover changes (including a gradient of agricultural, urban and impervious surfaces; Utz et al., 2009), and unspecified anthropogenic impacts due to agriculture (Krynak and Yates, 2018). The most common multiple driver combinations studied were biological/chemical and chemical/physical (18 studies; 8% each), and biological/chemical/climate change (10 studies; 5%). All other combinations were considered in fewer than 10 studies each. A single study considered four drivers (Kovalenko et al., 2018).
3.2.7. Measured outcomes
Outcome categories refer to the types of metrics that were measured in the target taxa in evaluations of tipping points (Table 4). Because several metrics could be measured for each taxon, there were 497 cases. Outcomes focused on productivity metrics such as abundance (190 cases; 38%) and biomass (121 cases; 24%), followed by metrics of community diversity (77 cases; 15%) and community composition (55 cases; 11%). Some studies reported measures on growth (18 cases; 4%), survival (9 cases; 2%), and reproduction (6 cases; 1%). Comparatively few cases focused on age-class structure (5 cases; 1%) or recruitment (1 case), and no cases measured population viability (Table 4). Examples of other types of outcomes (15 cases; 3%) included mercury (Hg) concentrations (Zhou et al., 2017) or water filtration rates in clams (Diamond et al., 2022).
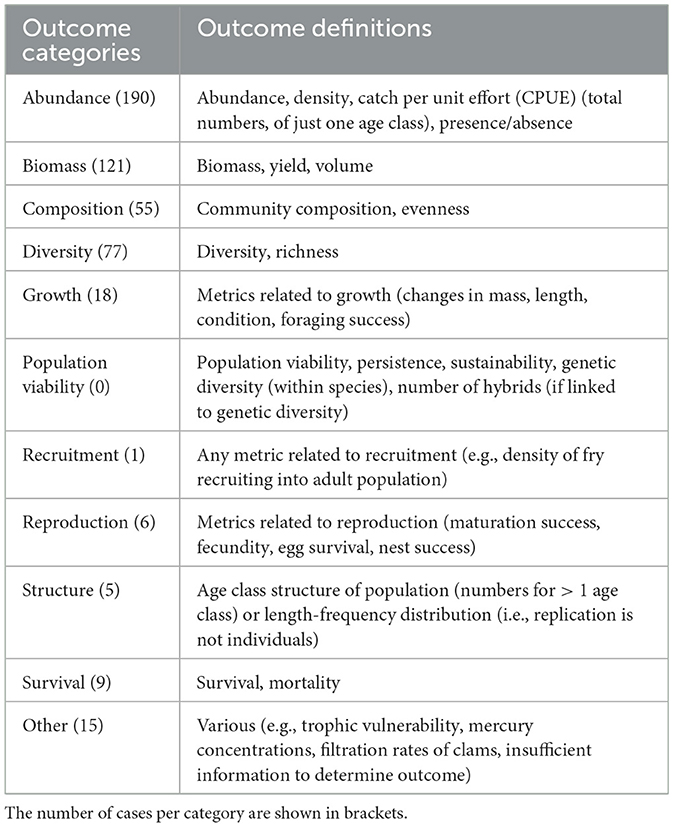
Table 4. Outcome categories and definitions used to measure biological responses to ecosystem drivers and resulting tipping points.
Figure 9 summarizes the distribution and frequency of tipping points studies for various intersections of taxonomic groups, drivers, and outcomes.
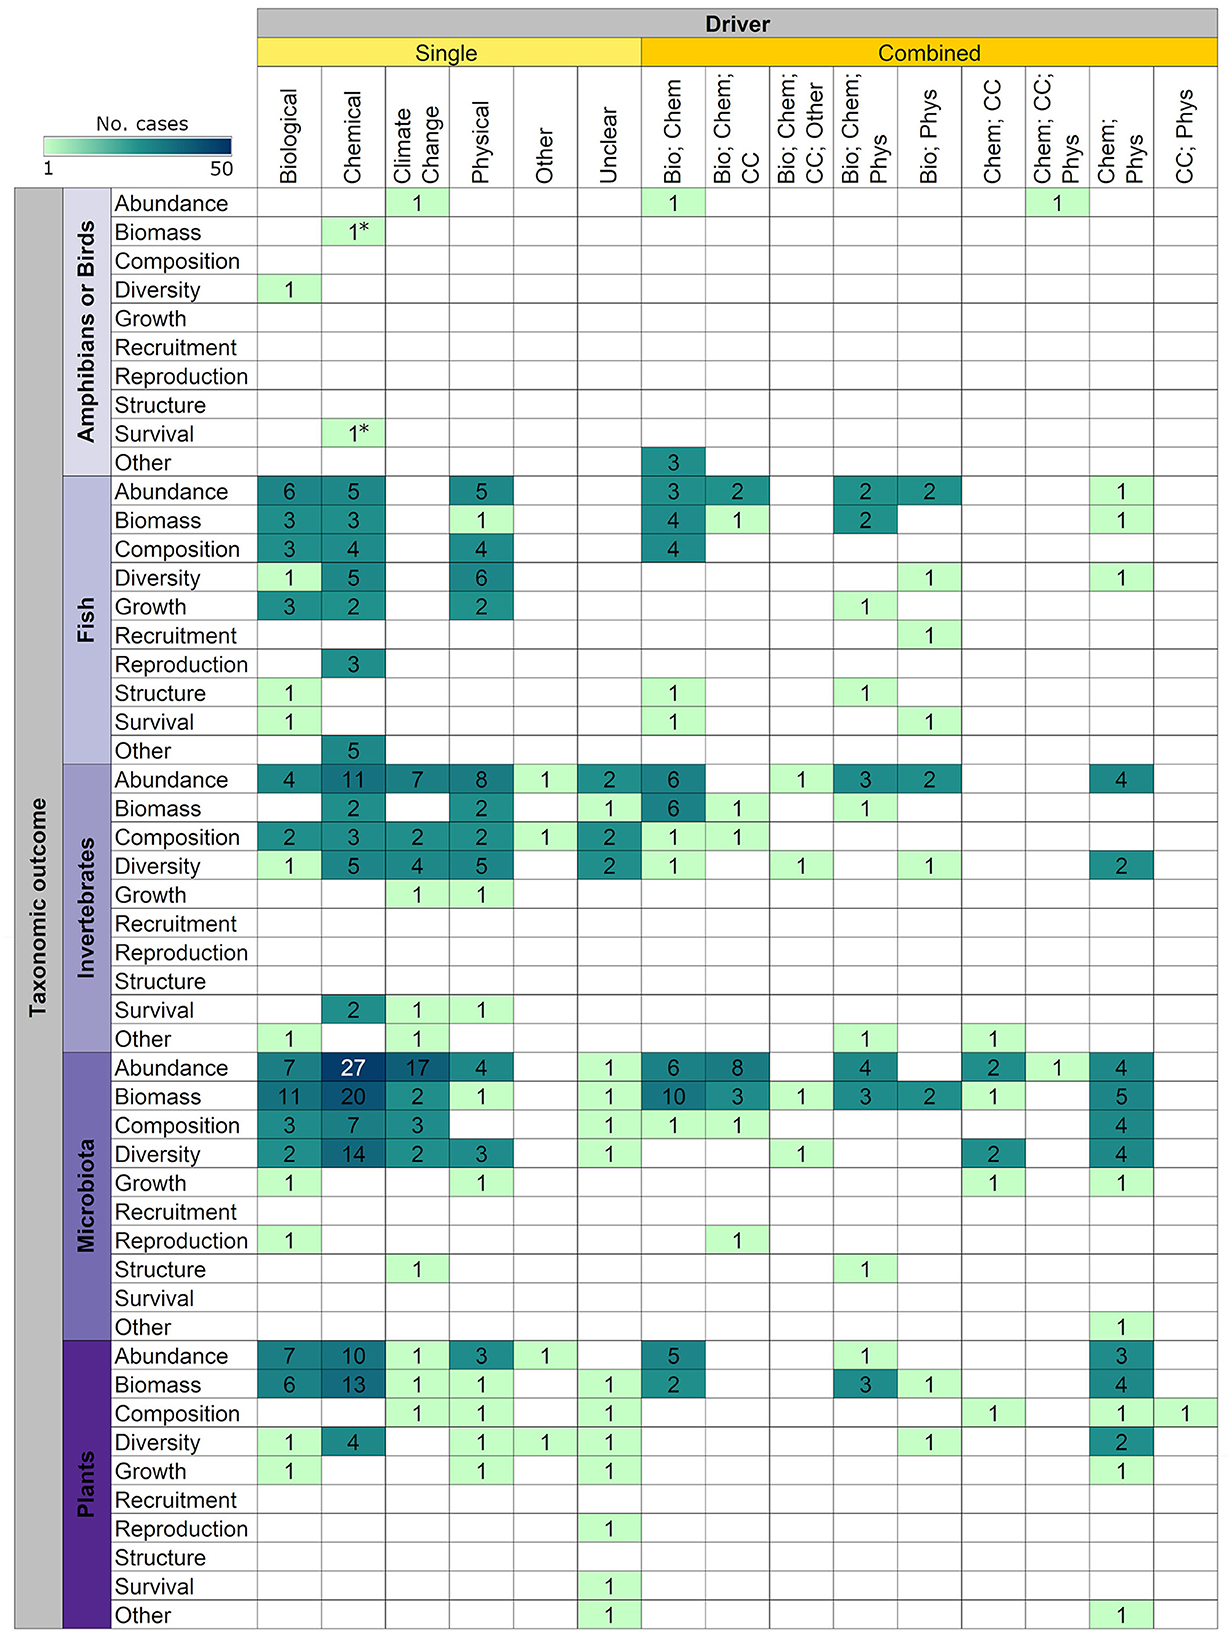
Figure 9. Distribution and frequency of cases (n = 497) examining single and combined drivers of ecosystem change and resulting tipping points on taxonomic outcomes by taxa. Reptiles and mammals were not present in the captured evidence base. The only two cases considering amphibians are denoted with an asterisk (*). Bio, Biological; Chem, Chemical; CC, Climate change; Phys, Physical.
3.2.8. Tipping point identification and reversibility of effects
Most studies identified a point or date at which a tipping point occurred (142/221 cases; 64%), while 67 cases (30%) did not identify a specific moment, and 12 cases (~5%) presented unclear information regarding the event or events that led to the tipping point.
A few cases (38/221; 17%) explored reversibility after a tipping point for a given driver and its outcomes on the studied taxa. Chemical drivers were the most studied type of driver for which reversibility was assessed (17 of 38 cases).
Out of the 38 cases that assessed reversibility after a tipping point, 27 cases identified a specific point in time at which the tipping point occurred (71%), 10 (26%) cases did not, and one case (3%) provided unclear information. Out of the 183 cases that did not assess reversibility after a tipping point, 115 cases identified a specific point in time at which a tipping point occurred (63%), 57 (31%) cases did not, and 11 cases (6%) provided unclear information (Figure 10).
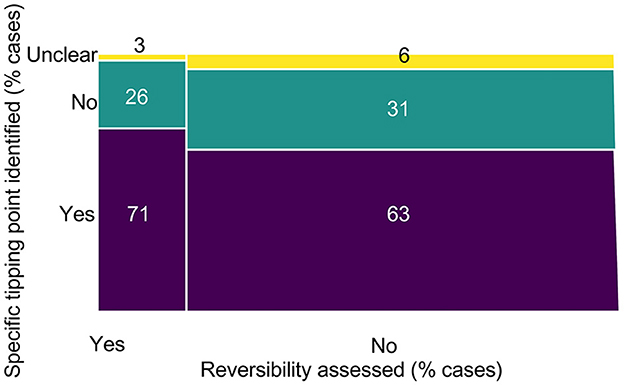
Figure 10. Percentage of cases identifying specific points or dates at which tipping points occurred, by the percentage of those cases that were assessed for reversibility.
4. Discussion
4.1. Review limitations
Although our search strategy did not intend to impose any regional restrictions on the captured evidence, it may have been inherently biased toward North American studies. For instance, due to project resource limitations, we could not conduct searches in additional databases or in other languages. Furthermore, most authors and advisory team members contributing to this map were Canadian. We did attempt to mitigate some potential bias, in part, by supplementing the search with a broad call for gray literature on social media platforms. However, we acknowledge that the existing literature base is likely broader than what we captured through our search strategy and that the comprehensiveness of this map could be further improved by: (1) conducting searches in multiple databases, thesis repositories, and languages; (2) including information found in theoretical modeling studies; (3) incorporating a citation chasing strategy (backwards and forwards citation), in addition to searching bibliographies of relevant reviews; and (4) searching websites of key organizations specializing in the study of tipping points to further capture additional gray literature. With that being noted, to our knowledge, this evidence map provides the most comprehensive and up-to-date overview of the existing literature of tipping points research in freshwater ecosystems, identifying 219 studies from 177 articles.
4.2. General observations regarding the evidence base
Publication rates within the topic of tipping points appear to be increasing linearly since 2007, suggesting a stable (albeit slow) growth in research on the topic (i.e., at a rate of ~1 article per year on average; Figure 2), rather than increasing exponentially as witnessed in many evidence synthesis (e.g., Bernes et al., 2015; Haddaway et al., 2017). However, this increase in the number of tipping points papers might be an artifact of an overall increase in the number of published articles and emergence of new journals over the last few decades. According to the metrics reported in SJR Scopus data3, the total number of documents published in 2007 in the list of journals captured by this evidence map was 20,412 whereas by 2022 that number had more than quadrupled to 89,352 (Supplementary material 5). Furthermore, the use of tipping point terminology has varied over time (Figure 3), with fewer terms more historically used than others (i.e., alternative stable state, cascading effects, and stable state) and currently more than 16 terms in use. Terms such as “tipping point” have gradually become more popular. Carrier-Belleau et al. (2022) found similar patterns in the frequency in which terms were used in publications, also noting that some terms were more frequently used than others depending on the habitat being studied (e.g., “tipping point” more commonly used in terrestrial habitats compared to freshwater and marine ecosystems). In addition to changes in the frequency of term use, when comparing the context in which authors used terms with standardized definitions, terms such as “hysteresis” only matched those definitions half of the time. This implies that some terms can have multiple meanings and nuances, leading to confusion. For example, the term “threshold”, as per the definition used in this evidence map, is a synonym for tipping point (the value/zone along an environmental gradient where small changes in driver(s) cause non-linear responses in systems conditions, which lead to different states that are often irreversible) (Milkoreit et al., 2018; Carrier-Belleau et al., 2022). However, Suding and Hobbs (2009) defined “thresholds” as “points where even small changes in environmental conditions (underlying controlling variable) will lead to large changes in system state variables”. Both definitions are similar, in that “threshold” is a specific value or point, but they emphasize different aspects of the state change. Specifically, while our definition, in line with recent reviews on this subject, specifies that the new state is stable and/or potentially irreversible, the definition of Suding and Hobbs (2009) identifies these points as those that cause outsized alterations in state variables regardless of final state.
Studies evaluating tipping points were most commonly conducted in the United States, China, and Canada (Figure 5), and focused primarily on lakes (Figure 7), suggesting geographical and ecosystem biases in the evidence base. This focus on tipping points in lakes was also reported in Carrier-Belleau et al. (2022), and expected, as these systems are often considered models of complex dynamical systems reflecting how other freshwater ecosystems may work (Scheffer, 2009). However, lakes might have aroused particular research interest because they are big water bodies (and thus on the radar of publics and politicians) and some of them have immense social-economic value (e.g., the Laurentian Great Lakes, Lake Veluwe, Lake Atitlan). Most studies used observational field-based methods for assessments and only lasted a short duration (i.e., <1 year). Impacts from crossing tipping points on microbiota were most frequently studied, followed by invertebrates and plants, commonly measured by productivity (e.g., abundance, biomass) and/or diversity outcomes (Figures 8, 9). There was a general paucity of studies related to all other taxa. Two-thirds of the evidence base focused on investigating a single driver, focusing most frequently on chemical drivers, followed by climate change drivers. Additionally, there was a lack of data on the reversibility or restoration of freshwater ecosystems after a tipping point had been reached (Figure 10).
4.3. Implications for management and research
Our evidence map provides an overview of the scope and limitations of the tipping points literature in freshwater ecosystems, highlighting several points of consideration for managers and researchers.
First, most studies that we identified for the evidence map had sampling periods of <1 year. A similar pattern of short monitoring durations was also noted by Smol (2019), finding ~60% of the environmental monitoring programmes published in the 2018 volume of the Environmental Monitoring and Assessment journal, were <1 year long and over 80% <3 years in duration. This suggests that most studies examined a tipping point after or while it occurred without collecting information about the events leading to the tipping point or about the long-term impacts of that tipping point. In addition, in short-term studies it might be difficult to distinguish between the occurrence of tipping points altering the state of an ecosystem, and increased temporal variability in the response metrics that may not result in a change in state. An exception, in which sampling periods were short but reconstructed data accounted for long periods of time, were sediment and peat cores. For example, Monchamp et al. (2021) took sediment cores from Lake Joux (Switzerland) during 2016 and 2017 and reconstructed paleoecological data from approximately 1000 to 2015 CE using molecular techniques; the authors found that a change in nutrient regime had led to a regime shift during 1963–1969 CE. We acknowledge that there are multiple obstacles in designing both experimental and long-term studies, such as cost and logistics, but understanding the context in which tipping points occur can provide valuable information for the design of effective management strategies. Although long-term studies cannot be substituted by paleoecological studies, one strategy for overcoming the difficulties in establishing long-term studies could be to use paleoecological data for covering longer timescales and complementing the findings of shorter duration studies.
Second, most studies took place in lakes located in temperate regions and assessed the impacts of chemical drivers on microbiota. Accumulating knowledge of tipping points in lakes and chemical drivers can potentially result in the creation or improvement of mathematical models to assess the state of ecosystems. For example, Janssen et al. (2019) developed a model to better understand the effects of eutrophication and monitor water quality in stratified and non-stratified freshwater lakes. This kind of model can be useful for managers and policymakers in the development of early warning tools. However, for these tools to be more widely applicable and accurate, we need to improve our understanding of tipping points for: (i) different ecosystems (i.e. lotic systems, such as rivers and streams, but also other lentic systems such as wetlands, especially outside of temperate regions); (ii) un- or under-represented taxonomic groups (i.e. amphibians, mammals, and reptiles); and (iii) other types of drivers (i.e. physical and biological drivers, such as the creation of dams or the impacts of invasive species). In addition, most studies focused on productivity measures on target taxa, such as abundance and biomass. We were unable to find any studies that explicitly assessed population viability. This may have profound implications for conservation since population viability analysis can potentially be used in the tipping points context for identifying thresholds or evaluating the feasibility and success of recovery actions (Boyce, 1992).
Third, this evidence map suggests a small number of evidence clusters (i.e., most studied subtopics) that may warrant future evidence synthesis. We used an arbitrary cut-off of > 25 cases to suggest these subtopics, acknowledging that there are currently, to our knowledge, no Collaboration for Environmental Evidence standards or guidelines for setting quantitative thresholds to identify knowledge clusters and gaps. We chose a relatively large threshold of >25 cases to identify knowledge clusters to increase the chance that these subsets will have a sufficiently large sample size to conduct future secondary reviews (e.g., narrative synthesis approach or even meta-analysis). We identified two potential subtopics of interest: (1) evaluations of a single chemical driver leading to a tipping point considering (a) all aquatic taxa combined in relation to measured outcomes of abundance (53 cases), biomass (39 cases), and diversity (28 cases), and (b) microbiota alone in relation to changes in abundance (27 cases); and (2) evaluations of a (single) climate change driver leading to a tipping point considering all available aquatic taxa combined in relation to changes in abundance (26 cases) (Figure 9). From these subtopics, we could ask questions such as: How does eutrophication alter the abundance of different taxonomic groups in freshwater ecosystems? What is the effect of pesticides on freshwater biodiversity? Digging deeper into these questions might be useful for understanding the effects of tipping points at broader ecosystem scales. For example, Lewis et al. (2021) conducted a mesocosm experiment in which they tested the effects of different types of insecticides on zooplankton abundance, phytoplankton biomass, and leopard frog mass, and the potential interactive effects of these insecticides with different road salt concentrations. The authors found that not all insecticides had the same effects on the taxa studied and that salt concentrations didn't have the same interactive effects with the insecticides. Extracting data on similar studies could provide some insights about the direction of driver effects.
Lastly, few studies explored the effects of multiple drivers combined, and those that analyzed the interactions of various drivers focused on chemical drivers combined with most often, biological, physical, or climate change drivers. Disentangling the effects of multiple driver interactions on target taxa and ecosystems can be challenging (Ormerod et al., 2010), not only because of logistical constraints in experimental designs (i.e., data availability for all drivers at appropriate temporal scales), but also because drivers can act synergistically or antagonistically with each other, and in non-linear or consistent directions (Folt et al., 1999). For instance, Hoveka et al. (2016) found that the distribution of the top five freshwater invasive plants in South Africa could be expanded for some species and diminished for others due to the effects of climate change; therefore, tipping points in these freshwater ecosystems could be due to the interaction between invasive species and climate change drivers. In addition, there is also a lack of studies examining the reversibility of tipping points. Understanding if and how an ecosystem can return to its original (or near original), usually more desirable, state requires a deep understanding of the pathways that led to the tipping point and the pathways that can reverse that tipping point. The challenge is that often the pathway to reverse the tipping point is not the same as the pathway that led to the tipping point in the first place [i.e., hysteresis is present in the system (Beisner et al., 2003)]. For example, Jones (2020) examined the recovery of a section of the Potomac River (Virginia, USA). This river had a history of eutrophication due to phosphorus loading, in which subsequent reductions in phosphorus loading (up to a 90% reduction in 1980s) didn't translate to a shift back to a clear state until ~25 years later. This lagged response following an alternative pathway for recovery is an example of hysteresis; however, full recovery back to the original state may not always be possible or feasible, and we should strive to prevent an ecosystem from reaching a tipping point whenever possible.
5. Conclusion
The evidence base regarding tipping points in freshwater systems is growing rapidly yet there are still numerous deficiencies in our knowledge that make it difficult for researchers and managers to understand uncertainty and make evidence-informed decisions. It is our hope that this evidence map will identify opportunities for researchers to address research gaps and for funding bodies to prioritize efforts to address those gaps. Identifying thresholds for where tipping points occur so they can be predicted and avoided is a logical starting point for decision makers that are attempting to apply tipping point concepts and evidence to their given context. In the current context of climate change timely action is needed, however, a look into the future needs to be accompanied by reflecting on the past. It is possible that due to shifting baselines (Pauly, 1995), what we now consider a healthy ecosystem was considered degraded in the past and we need to generate intergenerational learning experiences for future generations of researchers and managers to be aware of current and past conditions.
Author contributions
AH: Conceptualization, Formal analysis, Writing—original draft, Writing—review and editing. MH: Conceptualization, Formal analysis, Writing—review and editing. TR: Conceptualization, Project administration, Writing—review and editing, Funding acquisition. AS: Conceptualization, Formal analysis, Writing—original draft. JT: Conceptualization, Project administration, Writing—review and editing, Funding acquisition. BB: Conceptualization, Formal analysis, Writing—original draft. JB: Conceptualization, Writing—review and editing, Funding acquisition, Project administration. DB: Conceptualization, Formal analysis, Writing—original draft. IC: Conceptualization, Writing—review and editing, Funding acquisition, Project administration. LH: Conceptualization, Formal analysis, Writing—original draft. DH: Conceptualization, Writing—review and editing. EH: Conceptualization, Formal analysis, Writing—original draft. CR: Conceptualization, Writing—review and editing. JS: Conceptualization, Writing—review and editing, Funding acquisition, Project administration. MT: Conceptualization, Formal analysis, Writing—original draft. SC: Conceptualization, Writing—review and editing, Funding acquisition, Project administration, Supervision.
Funding
The author(s) declare financial support was received for the research, authorship, and/or publication of this article. We thank Fisheries and Oceans Canada for a contribution agreement titled Identifying When Cumulative Impacts on Freshwater Ecosystems Lead to Tipping Points in Ecosystem Health that supported this work.
Acknowledgments
The authors would like to thank Carleton University and University of Ottawa library staff for help with article retrieval through the Interlibrary Loans program and Cindy Chu, Jon Midwood, Karen Smokorowski, Cody Dey, and Marten Koops for early input on the ideas explored here.
Conflict of interest
The authors declare that the research was conducted in the absence of any commercial or financial relationships that could be construed as a potential conflict of interest.
The author JS declared that they were an editorial board member of Frontiers, at the time of submission. This had no impact on the peer review process and the final decision.
Publisher's note
All claims expressed in this article are solely those of the authors and do not necessarily represent those of their affiliated organizations, or those of the publisher, the editors and the reviewers. Any product that may be evaluated in this article, or claim that may be made by its manufacturer, is not guaranteed or endorsed by the publisher.
Supplementary material
The Supplementary Material for this article can be found online at: https://www.frontiersin.org/articles/10.3389/ffwsc.2023.1264427/full#supplementary-material
Footnotes
1. ^https://eppi.ioe.ac.uk/EPPIReviewer-Web/home
References
Abell, R., Thieme, M. L., Revenga, C., Bryer, M., Kottelat, M., Bogutskaya, N., et al. (2008). Freshwater ecoregions of the world: a new map of biogeographic units for freshwater biodiversity conservation. BioScience 58, 403–414. doi: 10.1641/B580507
Albert, J. S., Destouni, G., Duke-Sylvester, S. M., Magurran, A. E., Oberdorff, T., Reis, R. E., et al. (2021). Scientists' warning to humanity on the freshwater biodiversity crisis. Ambio 50, 85–94. doi: 10.1007/s13280-020-01318-8
Allsopp, N., Slingsby, J. A., and Esler, K. J. (2019). Identifying research questions for the conservation of the Cape Floristic Region. S. Afr. J. Sci. 115, 1–8. doi: 10.17159/sajs.2019/5889
Bayley, S. E., Creed, I. F., Sass, G. Z., and Wong, A. S. (2007). Frequent regime shifts in trophic states in shallow lakes on the Boreal Plain: alternative “unstable” states? Limnol. Oceanography 52, 2002–2012. doi: 10.4319/lo.2007.52.5.2002
Beisner, B., Haydon, D., and Cuddington, K. (2003). Alternative stable states in ecology. Front. Ecol. Environ. 1, 376–382. doi: 10.1890/1540-9295(2003)001[0376:ASSIE[2.0.CO;2
Bernes, C., Carpenter, S. R., Gårdmark, A., Larsson, P., Persson, L., Skov, C., et al. (2015). What is the influence of a reduction of planktivorous and benthivorous fish on water quality in temperate eutrophic lakes? A systematic review. Environ. Evid. 4, 7. doi: 10.1186/s13750-015-0032-9
Boyce, M. S. (1992). Population viability analysis. Annual Rev. Ecol. Syst. 23, 481–497. doi: 10.1146/annurev.es.23.110192.002405
Burthe, S. J., Henrys, P. A., Mackay, E. B., Spears, B. M., Campbell, R., Carvalho, L., et al. (2016). Do early warning indicators consistently predict nonlinear change in long-term ecological data? J. Appl. Ecol. 53, 666–676. doi: 10.1111/1365-2664.12519
Capon, S. J., Lynch, A. J. J., Bond, N., Chessman, B. C., Davis, J., Davidson, N., et al. (2015). Regime shifts, thresholds and multiple stable states in freshwater ecosystems; a critical appraisal of the evidence. Sci. Total Environ. 534, 122–130. doi: 10.1016/j.scitotenv.2015.02.045
Carrier-Belleau, C., Pascal, L., Nozais, C., and Archambault, P. (2022). Tipping points and multiple drivers in changing aquatic ecosystems: a review of experimental studies. Limnol. Oceanography 67, S312–S330. doi: 10.1002/lno.11978
Collaboration for Environmental Evidence (2018). Guidelines and Standards for Evidence synthesis in Environmental Management. Version 5.0. Eds. A. S. Pullin, G. K. Frampton, B. Livoreil, and G. Petrokofsky. Available online at: www.environmentalevidence.org/information-for-authors/ (accessed November, 2022).
Côté, I. M., Darling, E. S., and Brown, C. J. (2016). Interactions among ecosystem stressors and their importance in conservation. Proc. R. Soc. B Biol. Sci. 283, 20152592. doi: 10.1098/rspb.2015.2592
Desforges, J. E., Clarke, J., Harmsen, E. J., Jardine, A. M., Robichaud, J. A., Serré, S., et al. (2022). The alarming state of freshwater biodiversity in Canada. Can. J. Fish. Aquatic Sci. 79, 352–365. doi: 10.1139/cjfas-2021-0073
Dey, C. J., Rego, A. I., Bradford, M. J., Clarke, K. D., McKercher, K., Mochnacz, N. J., et al. (2021). Research priorities for the management of freshwater fish habitat in Canada. Can. J. Fish. Aquatic Sci. 78, 1744–1754. doi: 10.1139/cjfas-2021-0002
Diamond, J. S., Moatar, F., Cohen, M. J., Poirel, A., Martinet, C., Maire, A., et al. (2022). Metabolic regime shifts and ecosystem state changes are decoupled in a large river. Limnol. Oceanography 67, S1. doi: 10.1002/lno.11789
Evans, P. M., Newton, A. C., Cantarello, E., Martin, P., Sanderson, N., Jones, D. L., et al. (2017). Thresholds of biodiversity and ecosystem function in a forest ecosystem undergoing dieback. Sci. Rep. 7, 6775. doi: 10.1038/s41598-017-06082-6
Filbee-Dexter, K., Pittman, J., Haig, H. A., Alexander, S. M., Symons, C. C., and Burke, M. J. (2017). Ecological surprise: concept, synthesis, and social dimensions. Ecosphere 8, e02005. doi: 10.1002/ecs2.2005
Folt, C. L., Chen, C. Y., Moore, M. V., and Burnaford, J. (1999). Synergism and antagonism among multiple stressors. Limnol. Oceanography 44, 864–877. doi: 10.4319/lo.1999.44.3_part_2.0864
Friedman, W. R., Halpern, B. S., McLeod, E., Beck, M. W., Duarte, C. M., Kappel, C. V., et al. (2020). Research priorities for achieving healthy marine ecosystems and human communities in a changing climate. Front. Marine Sci. 7, 5. doi: 10.3389/fmars.2020.00005
Gaertner, M., Biggs, R., Te Beest, M., Hui, C., Molofsky, J., and Richardson, D. M. (2014). Invasive plants as drivers of regime shifts: identifying high-priority invaders that alter feedback relationships. Diver. Distribut. 20, 733–744. doi: 10.1111/ddi.12182
Gao, X., Fujiwara, M., Winemiller, K. O., Lin, P., Li, M., and Liu, H. (2019). Regime shift in fish assemblage structure in the Yangtze River following construction of the Three Gorges Dam. Sci. Rep. 9, 4212. doi: 10.1038/s41598-019-38993-x
Griffiths, K., Michelutti, N., Sugar, M., Douglas, M. S. V., and Smol, J. P. (2017). Ice-cover is the principal driver of ecological change in High Arctic lakes and ponds. L Zhu, Ed. PLoS ONE 12, e0172989. doi: 10.1371/journal.pone.0172989
Haberstroh, S., Werner, C., Grün, M., Kreuzwieser, J., Seifert, T., Schindler, D., et al. (2022). Central European 2018 hot drought shifts scots pine forest to its tipping point. Plant Biol. 24, 1186–1197. doi: 10.1111/plb.13455
Haddaway, N. R., Hedlund, K, Jackson, L. E., Kätterer, T, Lugato, E., Thomsen, I. K., et al. (2017). How does tillage intensity affect soil organic carbon? A systematic review. Environ. Evid. 6:30. doi: 10.1186/s13750-017-0108-9
Haddaway, N. R., Macura, B., Whaley, P., and Pullin, A. S. (2018). ROSES RepOrting standards for Systematic Evidence Syntheses: pro forma, flow-diagram and descriptive summary of the plan and conduct of environmental systematic reviews and systematic maps. Environ. Evid. 7, 7. doi: 10.1186/s13750-018-0121-7
Hansen, G. J. A., Ives, A. R., Vander Zanden, M. J., and Carpenter, S. R. (2013). Are rapid transitions between invasive and native species caused by alternative stable states, and does it matter? Ecology 94, 2207–2219. doi: 10.1890/13-0093.1
Harrison, I., Abell, R., Darwall, W., Thieme, M. L., Tickner, D., and Timboe, I. (2018). The freshwater biodiversity crisis. Science 362, 1369–1369. doi: 10.1126/science.aav9242
Holbrook, S. J., Schmitt, R. J., Adam, T. C., and Brooks, A. J. (2016). Coral reef resilience, tipping points and the strength of herbivory. Sci. Rep. 6, 35817. doi: 10.1038/srep35817
Hoveka, L. N., Bezeng, B. S., Yessoufou, K., Boatwright, J. S., and Van der Bank, M. (2016). Effects of climate change on the future distributions of the top five freshwater invasive plants in South Africa. S. Afr. J. Bot. 102, 33–38. doi: 10.1016/j.sajb.2015.07.017
Hughes, T. P., Linares, C., Dakos, V., van de Leemput, I. A., and van Nes, E. H. (2013). Living dangerously on borrowed time during slow, unrecognized regime shifts. Trends Ecol. Evol. 28, 149–155. doi: 10.1016/j.tree.2012.08.022
IPCC (2021). Climate Change 2021: The Physical Science Basis. Contribution of Working Group I to the Sixth Assessment Report of the Intergovernmental Panel on Climate Change. Eds. V. Masson-Delmotte, P. Zhai, A. Pirani, S.L. Connors, C. Péan, S. Berger (Cambridge; New York, NY: Cambridge University Press).
Jackson, Z. J., Quist, M. C., Downing, J. A., and Larscheid, J. G. (2010). Common carp (Cyprinus carpio), sport fishes, and water quality: ecological thresholds in agriculturally eutrophic lakes. Lake Reser. Manag. 26, 14–22. doi: 10.1080/07438140903500586
Janssen, A. B., Teurlincx, S., Beusen, A. H., Huijbregts, M. A., Rost, J., Schipper, A. M., et al. (2019). PCLake+: A process-based ecological model to assess the trophic state of stratified and non-stratified freshwater lakes worldwide. Ecol. Model. 23–32. doi: 10.1016/j.ecolmodel.2019.01.006
Jones, R. C. (2020). Recovery of a tidal freshwater embayment from eutrophication: a multidecadal study. Estuaries Coasts 43, 1318–1334. doi: 10.1007/s12237-020-00730-3
Kelly, R. P., Erickson, A. L., and Mease, L. A. (2014). How not to fall off a cliff, or, using tipping points to improve environmental management. Ecology Law Q. 41, 843–886. doi: 10.15779/Z38FP1H
Kovalenko, K. E., Reavie, E. D., Barbiero, R. P., Burlakova, L. E., Karatayev, A. Y., Rudstam, L. G., et al. (2018). Patterns of long-term dynamics of aquatic communities and water quality parameters in the Great Lakes: Are they synchronized? J. Gt. Lakes Res. 44, 660–669. doi: 10.1016/j.jglr.2018.05.018
Krynak, E. M., and Yates, A. G. (2018). Benthic invertebrate taxonomic and trait associations with land use in an intensively managed watershed: implications for indicator identification. Ecol. Indicat. 93, 1050–1059. doi: 10.1016/j.ecolind.2018.06.002
Laine, A. M., and Frolking, S. (2019). Spring-season flooding is a primary control of vegetation successional trajectories in primary mires. Mires Peat 24, 1–8. doi: 10.19189/MaP.2019.BG.393
Lenton, T. M. (2012). Arctic climate tipping points. Ambio, 41, 10–22. doi: 10.1007/s13280-011-0221-x
Lewis, J. L., Agostini, G., Jones, D. K., and Relyea, R. A. (2021). Cascading effects of insecticides and road salt on wetland communities. Environ. Pollut. 272, 116006. doi: 10.1016/j.envpol.2020.116006
Litzow, M. A., and Hunsicker, M. E. (2016). Early warning signals, nonlinearity, and signs of hysteresis in real ecosystems. Ecosphere 7, e01614. doi: 10.1002/ecs2.1614
Milkoreit, M., Hodbod, J., Baggio, J., Benessaiah, K., Calderón-Contreras, R., Donges, J. F., et al. (2018). Defining tipping points for social-ecological systems scholarship—an interdisciplinary literature review. Environ. Res. Let. 13, 033005. doi: 10.1088/1748-9326/aaaa75
Monchamp, M. È., Bruel, R., Frossard, V., McGowan, S., Lavrieux, M., Muschick, M., et al. (2021). Paleoecological evidence for a multi-trophic regime shift in a perialpine lake (Lake Joux, Switzerland). Anthropocene 35, 100301. doi: 10.1016/j.ancene.2021.100301
Nobre, C. A., and Borma, L. D. S. (2009). ‘Tipping points' for the Amazon forest. Curr. Opin. Environ. Sustain. 1, 28–36. doi: 10.1016/j.cosust.2009.07.003
Oliver, T. H., Isaac, N. J. B., August, T. A., Woodcock, B. A., Roy, D. B., and Bullock, J. M. (2015). Declining resilience of ecosystem functions under biodiversity loss. Nat. Commun. 6, 10122. doi: 10.1038/ncomms10122
Ormerod, S. J., Dobson, M., Hildrew, A. G., and Townsend, C. (2010). Multiple stressors in freshwater ecosystems. Freshwater Biol. 55, 1–4. doi: 10.1111/j.1365-2427.2009.02395.x
Pauly, D. (1995). Anecdotes and the shifting baseline syndrome of fisheries. Trends Ecol. Evol. 10, 430. doi: 10.1016/S0169-5347(00)89171-5
Petraitis, P. S., and Dudgeon, S. R. (2004). Detection of alternative stable states in marine communities. J. Exp. Marine Biol. Ecol. 300, 343–371. doi: 10.1016/j.jembe.2003.12.026
Reid, A. J., Carlson, A. K., Creed, I. F., Eliason, E. J., Gell, P. A., Johnson, P. T. J., et al. (2019). Emerging threats and persistent conservation challenges for freshwater biodiversity. Biol. Rev. 94, 849–873. doi: 10.1111/brv.12480
Reynolds, S. A., and Aldridge, D. C. (2021). Global impacts of invasive species on the tipping points of shallow lakes. Glob. Change Biol. 27, 6129–6138. doi: 10.1111/gcb.15893
Robin, J., Wezel, A., Bornette, G., Arthaud, F., Angélibert, S., Rosset, V., et al. (2014). Biodiversity in eutrophicated shallow lakes: determination of tipping points and tools for monitoring. Hydrobiologia 723, 63–75. doi: 10.1007/s10750-013-1678-3
Rocha, J., Yletyinen, J., Biggs, R., Blenckner, T., and Peterson, G. (2015). Marine regime shifts: drivers and impacts on ecosystems services. Phil. Trans. R. Soc. B Biol. Sci. 370, 20130273. doi: 10.1098/rstb.2013.0273
Sagerman, J., Hansen, J. P., and Wikström, S. A. (2020). Effects of boat traffic and mooring infrastructure on aquatic vegetation: a systematic review and meta-analysis. Ambio 49, 517–530. doi: 10.1007/s13280-019-01215-9
Schallenberg, M., and Sorrell, B. (2009). Regime shifts between clear and turbid water in New Zealand lakes: environmental correlates and implications for management and restoration. N. Z. J. Marine Freshwater Res. 43, 701–712. doi: 10.1080/00288330909510035
Scheffer, M. (2009). “III.17 Alternative stable states and regime shifts in ecosystems,” in The Princeton Guide to Ecology, eds S. A. Levin, S. R. Carpenter, H. C. J. Godfray, A. P. Kinzig, M. Loreau, J. B. Losos, B. Walker, and D. S. Wilcove (Princeton, NJ: Princeton University Press), 395–406. doi: 10.1515/9781400833023.395
Scheffer, M., Bascompte, J., Brock, W. A., Brovkin, V., Carpenter, S. R., Dakos, V., et al. (2009). Early-warning signals for critical transitions. Nature 461, 53–59. doi: 10.1038/nature08227
Scheffer, M., Carpenter, S., Foley, J. A., Folke, C., and Walker, B. (2001). Catastrophic shifts in ecosystems. Nature 413, 591–596. doi: 10.1038/35098000
Scheffer, M., and Carpenter, S. R. (2003). Catastrophic regime shifts in ecosystems: linking theory to observation. Trends Ecol. Evol. 18, 648–656. doi: 10.1016/j.tree.2003.09.002
Selkoe, K. A., Blenckner, T., Caldwell, M. R., Crowder, L. B., Erickson, A. L., Essington, T. E., et al. (2015). Principles for managing marine ecosystems prone to tipping points. Ecosystem Health Sustain. 1, 1–18. doi: 10.1890/EHS14-0024.1
Smol, J. P. (2019). Under the radar: long-term perspectives on ecological changes in lakes. Proc. R. Soc. B 286, 20190834. doi: 10.1098/rspb.2019.0834
Suding, K. N., and Hobbs, R. J. (2009). Threshold models in restoration and conservation: a developing framework. Trends Ecol. Evol. 24, 271–279. doi: 10.1016/j.tree.2008.11.012
Thomas, J. (2013). Diffusion of innovation in systematic review methodology: why is study selection not yet assisted by automation. OA Evid. Based Med. 1, 1–6. doi: 10.13172/2053-2636-1-2-1109
Thomas, J., Graziosi, S., Brunton, J., Ghouze, Z., O'Driscoll, P., Bond, M., et al. (2022). EPPI-Reviewer: Advanced Software for Systematic Reviews, Maps and Evidence Synthesis. London: EPPI Centre, UCL Social Research Institute, University College London
Tickner, D., Opperman, J. J., Abell, R., Acreman, M., Arthington, A. H., Bunn, S. E., et al. (2020). Bending the curve of global freshwater biodiversity loss: an emergency recovery plan. BioScience 70, 330–342. doi: 10.1093/biosci/biaa002
Utz, R. M., Hilderbrand, R. H., and Boward, D. M. (2009). Identifying regional differences in threshold responses of aquatic invertebrates to land cover gradients. Ecol. Indicat. 9, 556–567. doi: 10.1016/j.ecolind.2008.08.008
van Nes, E. H., Arani, B. M. S., Staal, A., van der Bolt, B., Flores, B. M., Bathiany, S., et al. (2016). What do you mean, ‘tipping point'? Trends Ecol. Evol. 31, 902–904. doi: 10.1016/j.tree.2016.09.011
Watson, S. C. L., Newton, A. C., Ridding, L. E., Evans, P. M., Brand, S., McCracken, M., et al. (2021). Does agricultural intensification cause tipping points in ecosystem services? Landscape Ecol. 36, 3473–3491. doi: 10.1007/s10980-021-01321-8
Weber, M. J., Wilkinson, G. M., Balmer, M. B., and Bevil, M. C. (2020). Restoration of eutrophic lakes in Iowa, USA. Hydrobiologia 847, 4469–4486. doi: 10.1007/s10750-020-04310-1
WWF (2022). Living Planet Report 2022 – Building a Nature Positive Society. Eds. R. E. A. Almond, M. Grooten, D. Juffe Bignoli, and T. Petersen (Gland: WWF).
WWF/TNC (2019). Freshwater Ecoregions of the World (FEOW) Major Habitat Types. Available online at: https://www.feow.org/global-maps/major-habitat-types (accessed November, 2022).
Keywords: alternative stable states, critical threshold, cumulative effects, evidence synthesis, environmental pressure, multiple stressors
Citation: Hernández Martínez de la Riva A, Harper M, Rytwinski T, Sahdra A, Taylor JJ, Bard B, Bennett JR, Burton D, Creed IF, Haniford LSE, Hanna DE, Harmsen EJ, Robichaud CD, Smol JP, Thapar M and Cooke SJ (2023) Tipping points in freshwater ecosystems: an evidence map. Front. Freshw. Sci. 1:1264427. doi: 10.3389/ffwsc.2023.1264427
Received: 20 July 2023; Accepted: 25 September 2023;
Published: 11 October 2023.
Edited by:
Theodore Henry, Heriot-Watt University, United KingdomReviewed by:
Robert Al-Chokhachy, United States Department of the Interior, United StatesAdam Brysiewicz, Institute of Technology and Life Sciences, Poland
Copyright © 2023 Hernández Martínez de la Riva, Harper, Rytwinski, Sahdra, Taylor, Bard, Bennett, Burton, Creed, Haniford, Hanna, Harmsen, Robichaud, Smol, Thapar and Cooke. This is an open-access article distributed under the terms of the Creative Commons Attribution License (CC BY). The use, distribution or reproduction in other forums is permitted, provided the original author(s) and the copyright owner(s) are credited and that the original publication in this journal is cited, in accordance with accepted academic practice. No use, distribution or reproduction is permitted which does not comply with these terms.
*Correspondence: Ana Hernández Martínez de la Riva, anahernandezmartine@cmail.carleton.ca