 Abulgasim Ahbara1,2*
 Hussain Bahbahani3
 Faisal Almathen4
 Mohammed Al Abri5
 Mukhtar Omar Agoub6
 Ayelle Abeba7
 Adebabay Kebede8,9
 Hassan Hussein Musa10
 Salvatore Mastrangelo11
 Fabio Pilla12
 Elena Ciani13
 Olivier Hanotte1,9
 Joram M. Mwacharo14*
- 1School of Life Sciences, University of Nottingham, Nottingham, United Kingdom
- 2Department of Zoology, Faculty of Sciences, Misurata University, Misurata, Libya
- 3Department of Biological Sciences, Faculty of Science, Kuwait University, Safat, Kuwait
- 4Department of Veterinary Public Health and Animal Husbandry, College of Veterinary Medicine, King Faisal University, Al-Ahsa, Saudi Arabia
- 5Department of Animal and Veterinary Sciences, College of Agriculture and Marine Sciences, Sultan Qaboos University, Muscat, Oman
- 6Agricultural Research Center, Misurata, Libya
- 7Debre Berhan Research Centre, Debre Berhan, Ethiopia
- 8Amhara Regional Agricultural Research Institute, Bahir Dar, Ethiopia
- 9LiveGene, International Livestock Research Institute, Addis Ababa, Ethiopia
- 10Faculty of Medical Laboratory Sciences, University of Khartoum, Khartoum, Sudan
- 11Dipartimento di Scienze Agrarie e Forestali, Viale delle Scienze, Università Palermo, Palermo, Italy
- 12Dipartimento Agricoltura, Ambiente e Alimenti, Università degli Studi del Molise, Campobasso, Italy
- 13Dipartimento di Bioscienze, Biotecnologie e Biofarmaceutica, Università degli Studi di Bari “Aldo Moro,” Bari, Italy
- 14Small Ruminant Genomics, International Center for Agricultural Research in the Dry Areas (ICARDA), Addis Ababa, Ethiopia
Variations in body weight and in the distribution of body fat are associated with feed availability, thermoregulation, and energy reserve. Ethiopia is characterized by distinct agro-ecological and human ethnic farmer diversity of ancient origin, which have impacted on the variation of its indigenous livestock. Here, we investigate autosomal genome-wide profiles of 11 Ethiopian indigenous sheep populations using the Illumina Ovine 50 K SNP BeadChip assay. Sheep from the Caribbean, Europe, Middle East, China, and western, northern and southern Africa were included to address globally, the genetic variation and history of Ethiopian populations. Population relationship and structure analysis separated Ethiopian indigenous fat-tail sheep from their North African and Middle Eastern counterparts. It indicates two main genetic backgrounds and supports two distinct genetic histories for African fat-tail sheep. Within Ethiopian sheep, our results show that the short fat-tail sheep do not represent a monophyletic group. Four genetic backgrounds are present in Ethiopian indigenous sheep but at different proportions among the fat-rump and the long fat-tail sheep from western and southern Ethiopia. The Ethiopian fat-rump sheep share a genetic background with Sudanese thin-tail sheep. Genome-wide selection signature analysis identified eight putative candidate regions spanning genes influencing growth traits and fat deposition (NPR2, HINT2, SPAG8, INSR), development of limbs and skeleton, and tail formation (ALX4, HOXB13, BMP4), embryonic development of tendons, bones and cartilages (EYA2, SULF2), regulation of body temperature (TRPM8), body weight and height variation (DIS3L2), control of lipogenesis and intracellular transport of long-chain fatty acids (FABP3), the occurrence and morphology of horns (RXFP2), and response to heat stress (DNAJC18). Our findings suggest that Ethiopian fat-tail sheep represent a uniquely admixed but distinct genepool that presents an important resource for understanding the genetic control of skeletal growth, fat metabolism and associated physiological processes.
Introduction
African indigenous sheep originated in the Near East. They arrived, in the first instance, in North Africa via the Isthmus of Suez by the seventh millennium before present (BP) (Marshall, 2000). These sheep were of thin-tail type and their dispersion southwards into East Africa followed possibly the Nile river valley and the Red Sea coastline (Blench and MacDonald, 2006; Gifford-Gonzalez and Hanotte, 2011). The second wave brought fat-tail sheep into North and Northeast Africa via two entry points, the Isthmus of Suez and the Horn of Africa across the straits of Bab-el-Mandeb, respectively. The fat-rump sheep are a recent introduction and represent the third wave of arrival and dispersal of the species into eastern Africa (Epstein, 1971; Ryder, 1983; Marshall, 2000).
Sheep fulfill important socio-cultural and economic roles in the Horn of Africa. In Ethiopia they provide a wide range of products, including meat, milk, skin, hair, and manure, and are a form of savings and investment (Assefa et al., 2015). Ethiopia hosts many indigenous breeds of sheep, with currently 14 recognized populations/breeds, which are defined based on their geographic location and/or the ethnic communities managing them (Gizaw, 2008). Based on structure analysis, Edea et al. (2017) showed that the five Ethiopian indigenous sheep populations they analyzed clustered together based on their geographic distribution and tail phenotypes.
Fat depots act as an energy reserve that allows sheep to survive extreme environments and conditions such as prolonged droughts, cold, and food scarcity (Atti et al., 2004; Nejati-Javaremi et al., 2007; Moradi et al., 2012). Based on the combination of tail type and length, Ethiopian indigenous sheep can be classified as short fat-tail, long fat-tail, thin-tail, and fat-rump sheep. The short fat-tail inhabit sub-alpine mountainous regions, the long fat-tail predominate in mid- to high-altitude environments and the fat-rump sheep occur in semi-arid and arid environments (Gizaw et al., 2007). These populations are considered to be adapted to their production environments and they represent an important model species for investigating and enhancing our knowledge on the genome profiles of environmental adaptation, tail morphology, and fat localization.
Different approaches, that contrast groups of fat- and thin-tail sheep, have been used to identify candidate regions and genes associated with tail formation and morphotypes. Moradi et al. (2012) identified three regions on chromosomes 5, 7 and X associated with tail fat deposition in Iranian breeds. Using two fat-tail (Laticauda and Cyprus fat-tail) and 13 Italian thin-tail breeds, Moioli et al. (2015) identified BMP2 and VRTN as the likely candidate genes explaining fat-tail phenotype in the studied populations/breeds. Zhu et al. (2016) detected several copy number variations intersecting genes (PPARA, RXRA, and KLF11) associated with fat deposition in three Chinese native sheep (Large-tail Han, Altay, and Tibetan). Several candidate genes with possible links to fat-tail development, i.e., HOXA11, BMP2, PPP1CC, SP3, SP9, WDR92, PROKR1, and ETAA1, were identified using genome scans that contrasted fat- and thin-tail Chinese sheep (Yuan et al., 2017). Whole genome sequencing of extremely short-tail Chinese sheep revealed the T gene as the best possible candidate, among other nine genes, influencing tail size, following its association with vertebral development (Zhi et al., 2018). There is, so far, no information on the genetic basis of variation in tail fat distribution and size in African indigenous sheep.
In this study, using the Ovine 50 K SNP BeadChip genotypes, we investigated the (i) genetic relationships and structure within and between Ethiopian indigenous sheep of different fat-tail morphotypes alongside other sheep populations and breeds from the Caribbean, European, Middle East, China and Africa, and (ii) candidate genome regions and genes associated with tail morphology, fat deposition and possible eco-climatic adaptation in African indigenous sheep. For the latter, 11 Ethiopian indigenous sheep of different fat-tail morphotypes and two populations of thin-tail sheep from Sudan were analyzed.
Materials and Methods
DNA Samples and SNP Genotyping
The sampling strategy targeted breeds of indigenous sheep from different geographic regions in Ethiopia (Table 1 and Figure 1). Geographic positioning system (GPS) coordinates were recorded for all the populations. We used altitude to determine the agro-eco-climatic zones of the geographic locations where the sheep were sampled. All efforts were made to include populations representing the different tail phenotypes found in Ethiopia. Twenty DNA samples from two thin-tail sheep, Hammari and Kabashi, were obtained from Sudan. Genomic DNA was extracted from 146 ear tissue samples, collected from 11 Ethiopian indigenous sheep populations, using the NucleoSpin® Tissue Kit (http://www.mn-net.com) following the manufacturers protocol. All 166 genomic DNA samples were genotyped using the Ovine 50 K SNP BeadChip assay. The assay includes 54,240 SNPs composed of 52,413 autosomal, 1449 X-chromosome and 378 mitochondrial SNPs, respectively.
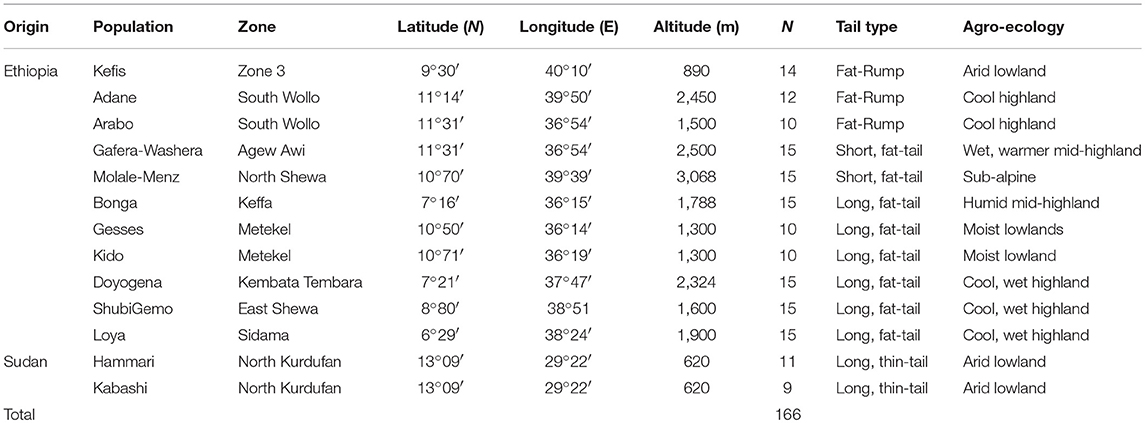
Table 1. Description of the populations that were sampled for this study.
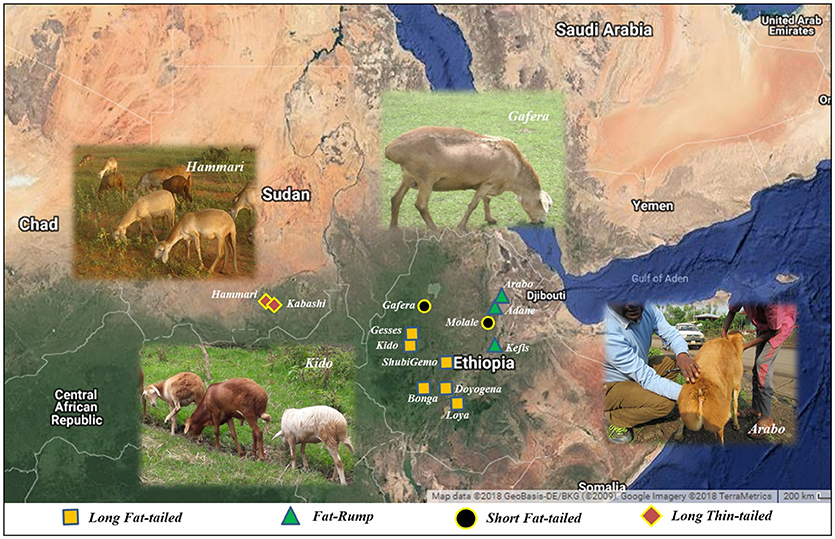
Figure 1. The locations where the Ethiopian and Sudanese sheep populations used in this study were sampled.
Ovine 50 K SNP BeadChip genotypes of Caribbean, European, Middle East and Chinese, as well as western, northern and southern African sheep, respectively were obtained from the Sheep HapMap database (http://www.sheephapmap.org/hapmap.php, Supplementary Table 1) and included in the study. The aim was to provide a global context of the genetic origins, trajectories of introduction, and dispersal of sheep into Ethiopia.
Quality Control and Genetic Diversity Analyses
The Sheep HapMap dataset were merged with the ones generated from Ethiopian and Sudanese sheep using PLINK v1.9 (Purcell et al., 2007). The data files for final analysis were generated after pruning the merged dataset of SNPs not mapping on any autosomes, with a minor allele frequency (MAF) ≤ 0.01 and animals and markers with ≥10 and 5% missing genotypes, respectively. This generated a dataset with 45,102 SNPs which were further pruned, using PLINK v1.9, to be in approximate linkage equilibrium to avoid the possible influence of clusters of SNPs on population genetic relationship and structure analysis (Yuan et al., 2017). Following the latter pruning, 34,088 SNPs were retained for population relatedness and structure analysis.
To minimize the possible loss of informative SNPs for selection signature analysis, the data for Ethiopian and Sudanese sheep was extracted from the dataset of 45,102 autosomal SNPs, that was obtained prior to LD pruning.
The proportion of polymorphic SNPs (Pn), expected (He), and observed (Ho) heterozygosity and inbreeding coefficient (F) were estimated for each population and across all populations using PLINK v1.9, to evaluate the levels of genetic diversity present in Ethiopian and Sudanese sheep, respectively.
Population Genetic Analyses
Principal component analysis (PCA) were performed using PLINK v1.9 to investigate the genetic structure and relationships among the studied breeds based on genetic correlations between individuals. A graphical display of the first two principal components (PC1 and PC2) was generated using GENESIS (Buchmann and Hazelhurst, 2014). Admixture analysis implemented in ADMIXTURE v1.3 (Alexander et al., 2009) was used to investigate underlying genetic structure and estimate the proportion of shared genome ancestry between the study populations. A 5-fold cross-validation procedure following Lawal et al. (2018), was used to determine the optimal number of ancestral genomes (K) and proportions of genome ancestry that was shared among the study populations.
To further evaluate historical relationships and interactions (gene flow) within and between Ethiopian and Sudanese populations, we used the maximum likelihood tree-based approach implemented in TreeMix (Pickrell and Pritchard, 2012) and included the Soay sheep as an out-group. The number of migration events (m) varied between 1 (migration between two populations and 15 (migration between all the populations). The value of “m” with the highest reproducibility and consistency, among the 15 tested, and which also had the highest log-likelihood value following six replication runs of the analysis, was chosen as the most optimal.
The f3 and f4 tests implemented in TreeMix were also performed. The f3-statistics (A, B, C) were to determine if A was derived from the admixture of populations B and C; a significantly negative value of the f3-statistics would suggest population A is admixed. The f4-statistics (A, B,) (C, D) were to test the validity of hierarchical clustering pattern in four-population trees. Significant deviations of the f4-statistics from zero for the three possible topologies of the four-population trees would provide evidence of gene flow between the populations tested. A significantly positive Z-score indicates gene flow between populations that are related to either A and C or B and D while a significantly negative Z-score indicates gene flow between populations that are related to A and D or B and C. Standard errors were estimated using blocks of 500 SNPs.
Analysis of Signatures of Selection
For this analysis, we separated 12 of the 13 Ethiopian and Sudanese populations into four genetic groups based on the population clusters revealed by PCA. The four population groups included, western (Bonga, Kido, Gesses) and southern (Loya, ShubiGemo, Doyogena) long fat-tail, and fat-rump (Kefis, Adane, Arabo) sheep from Ethiopia and thin-tail sheep (Hammari, Kabashi) from Sudan. One short fat-tail sheep (Molale) was included with the fat-rump sheep and the other (Gafera), which appeared to be genetically distinct, was dropped from further analysis. Equal numbers of samples were chosen at random to represent each genetic group. Three comparisons which contrasted the fat-rump (E1), western (E2) and southern (E3) long fat-tail sheep with the thin-tail sheep (S) from Sudan were performed. The selection signature analysis involved three approaches, FST, hapFLK and Rsb.
A sliding window approach was used to perform the FST analysis using the HIERFSTAT package (Goudet, 2005) of R (R Core Team, 2012). The window size of 200 Kb, was allowed to slide along the genome by a distance of 60 Kb. The window size and slide distance were determined based on linkage disequilibrium (LD) decay analysis (Supplementary Figure 1). The pairwise FST values (Weir and Cockerham, 1984) for each SNP in each window and between the genetic groups being tested were estimated as follows:
Where p1, p2 and q1, q2 are the frequencies of alleles A and a in the first and second group of the test populations, respectively, and pr and qr are the frequencies of alleles A and a, respectively, across the tested groups (Zhi et al., 2018). The FST values were standardized into Z-scores as follows:
Where μFST is the overall average value of FST and σFST is the standard deviation derived from all the windows tested for a given comparison. Supplementary Figure 2 shows the distribution of the ZFST values. We set the value of ZFST ≥ 4 as the threshold to identify candidate genomic regions under selection.
The hapFLK approach was implemented with hapFLK package v1.2 (Fariello et al., 2013) to detect selection signatures based on differences in haplotype frequencies between groups of populations. Reynolds genetic distances were converted into kinship matrix using an R script supplied with the package. The hapFLK values and kinship matrix were calculated assuming 15 clusters in the fastPHASE model (-K 15). The hapFLK statistic was then computed as the average value across 40 expectation maximization (EM) runs to fit the LD model. The P-values were obtained by running a python script “Scaling_chi2_hapFLK.py” available at (https://forge-dga.jouy.inra.fr/documents/588) which fits a chi-squared distribution to the empirical distribution. As with the FST calculations, the hapFLK statistics were also standardized using the formula:
The calculation of the raw P-values was based on the null distribution of empirical values (Fariello et al., 2013; Kijas, 2014). The P-values were plotted in a histogram to assess their distribution pattern and the cut-off value to determine significance was set at –Log10 (P-value) ≥ 3 (Supplementary Figure 2).
Using haplotype information, we performed the Rsb analysis implemented in rehh package (Gautier and Vitalis, 2012) of R. Haplotypes were estimated with SHAPEIT (Delaneau et al., 2014). To identify loci under selection, the Rsb values were log-transformed into PRsb (PRsb = –Log10 [1–2(Φ (Rsb)−0, 5)]), where Φ(x) represents the Gaussian cumulative distribution function (Gautier and Vitalis, 2012). Assuming that the Rsb values are normally distributed (under neutrality), the PRsb can be interpreted as –Log10 (P-value), where P is the two-sided P-value associated with the neutral hypothesis. For each comparison, SNPs that exhibited PRsb ≥ 3 (P-value = 0.001) were taken to be under selection (de Simoni Gouveia et al., 2017). The hapFLK and Rsb analysis were also performed using window sizes of 200 Kb sliding along the genome by a distance of 60 Kb.
Gene Annotation
Candidate regions that overlapped between FST, hapFLK, and Rsb were identified and compared using the intersectBed function of Bed Tools software (Quinlan and Hall, 2010). Considering an average marker distance of between 60 and 200 Kb (Moioli et al., 2015) and the observed LD decay pattern (Supplementary Figure 1), candidate regions under selection were identified by exploring the SNPs found up- and down-stream, and within, the most significant windows. The Oar v3.1 Ovine reference genome assembly (Jiang et al., 2014) was used to annotate the candidate regions. Functional enrichment analysis was performed using the functional annotation tool in DAVID (Huang et al., 2008) using Ovis aries as the background species. Gene functions were determined using the NCBI (http://www.ncbi.nlm.nih.gov/gene/) and OMIM databases (http://www.ncbi.nlm.nih.gov/omim/) and a review of literature.
Results
Genetic Diversity and Population Structure
The average values of Pn, He, Ho, and F, as indicators of within-breed genetic diversity, are shown in Table 2 and Supplementary Figure 3. The lowest values of Pn, He, and Ho were observed in Bonga while the highest values were observed in Molale-Menz, Hammari and Kabashi, and Arabo, respectively.
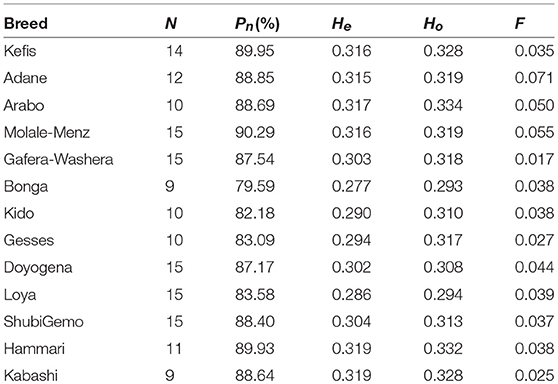
Table 2. Measures of genetic diversity for each of the 13 populations analyzed.
The PCA plot incorporating the global populations and which was constructed using a sample size of five animals that were selected at random per population, is shown in Figure 2. We used the uniform sample size of five animals since differences in sample sizes may influence clustering patterns on the PCA. The choice to use five samples per population was based on the smallest sample size of five individuals genotyped for Sidaoun and Berber breeds. In spite the sample size rebalancing, the population cluster patterns did not differ from that observed when the PCA was performed using unequal sample sizes (Supplementary Figures 4, 5). Generally, PC1 separates Ethiopian and South African fat-tail sheep, Sudanese thin-tail sheep, West African Djallonke and Algerian Sidaoun from the other sheep populations. Sheep from the Middle East and North Africa occur at the center of the PCA plot and, together with the Cyprus fat-tail and Chinese sheep (which cluster close together) are separated by PC2 from African Dorper, Barbados Blackbelly and European sheep. The two populations of Ethiopian short fat-tail sheep diverge from each other; Gafera-Washera clusters near Ethiopian long fat-tail sheep while Molale-Menz clusters together with the Ethiopian fat-rump sheep. The West African Djallonke clusters close to the two South African breeds (Ronderib and Namaqua). Sidaoun and Berber (both from Algeria) cluster separate, while the Cyprus fat-tail clusters close to the Chinese sheep (Figure 2).
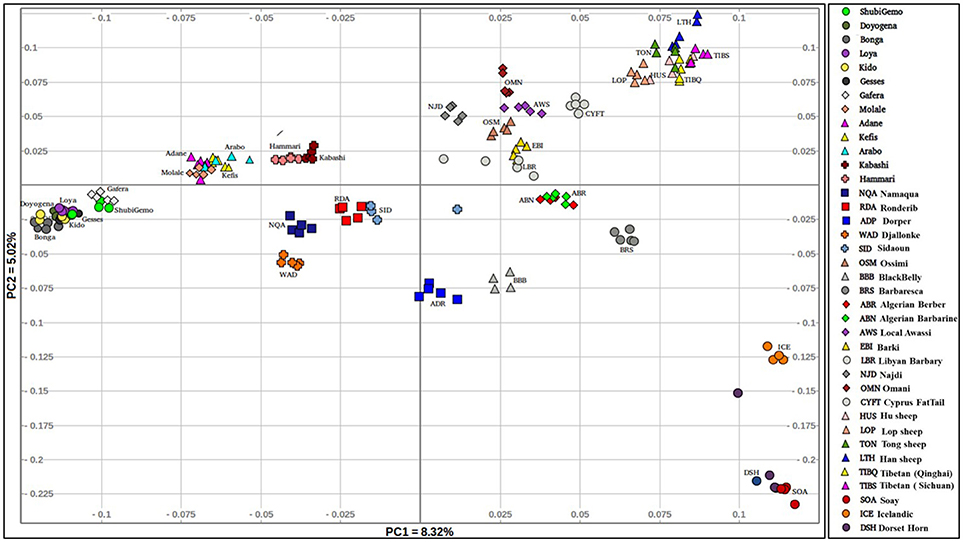
Figure 2. Genetic variation among the Ethiopian sheep populations in a global geographic context.
To obtain a clearer picture of the variation within the fat-tail sheep, we performed the PCA excluding the thin-tail sheep (Figure 3). PC1 separates the Ethiopian fat-tails from their Middle East, North Africa, Mediterranean and Chinese counterparts. PC2 differentiates the South African breeds from the Ethiopian ones. Like the global PCA, one Ethiopian short fat-tail sheep (Gafera-Washera) clusters with the Ethiopian long-fat tail sheep and the other (Molale-Menz) forms a cluster with the Ethiopian fat-rump sheep. Middle East sheep cluster together with the North African ones while the Mediterranean sheep unexpectedly cluster with the Chinese sheep despite the large geographic distance separating them.
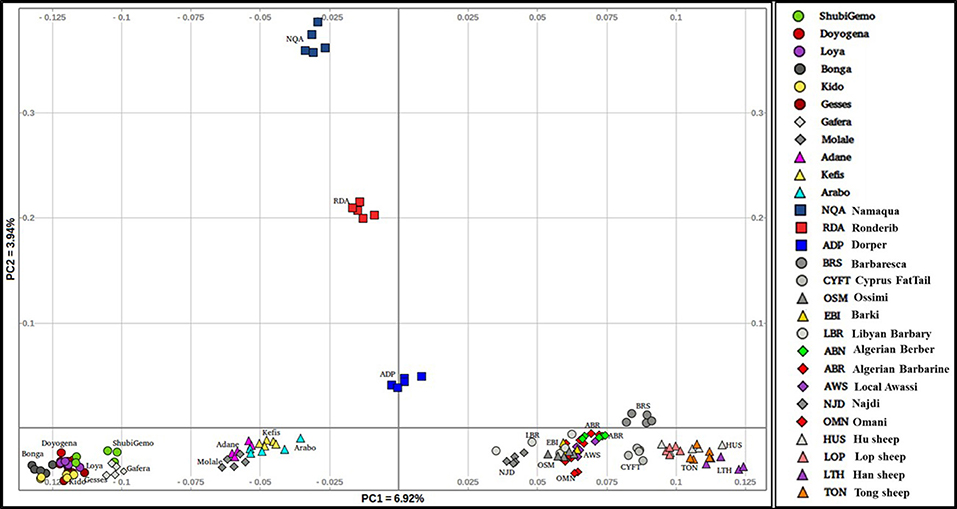
Figure 3. Distribution of genetic variation among the worldwide fat-tail sheep.
To further illustrate the distribution of genetic variation among East African populations, we performed the PCA with only the Ethiopian and Sudanese thin-tail sheep (Figure 4). PC1 separates Ethiopian fat-rump, Molale-Menz (Ethiopian short-fat tail) and thin-tail sheep from the Ethiopian long fat-tail and Gafera-Washera (Ethiopian short-fat tail) sheep. Generally, PC1 separates the fat-rump sheep from the fat-tail ones derived from western and southern Ethiopia. PC2 reveals further separation of the Ethiopian sheep: (i) Molale-Menz, Adane and some Arabo individuals from Kefis, and the remaining Arabo individuals, and (ii) Gafera-Washera, Kido and Gesses from Doyogena, ShubiGemo, Bonga and Loya.
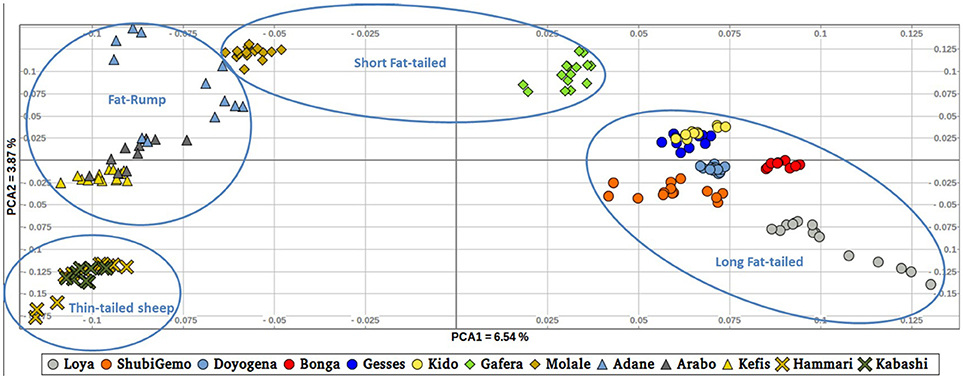
Figure 4. Distribution of genetic variation among the East African sheep populations (PC1 and PC2).
Admixture analysis on the global dataset, separates the study populations following their geographic origins (Figure 5). The cross-validation error registered the lowest value at K = 9 suggesting this to be the most optimal number of clusters explaining the variation in this dataset (Supplementary Figure 6a). Chinese sheep separate from the other populations at K ≥ 3. Among African breeds, the South African ones (Namaqua, Dorper, Ronderib) and the West African Djallonke show a distinct but common genetic ancestry with the Ethiopian and Sudanese sheep for 3 ≤ K ≤ 6.
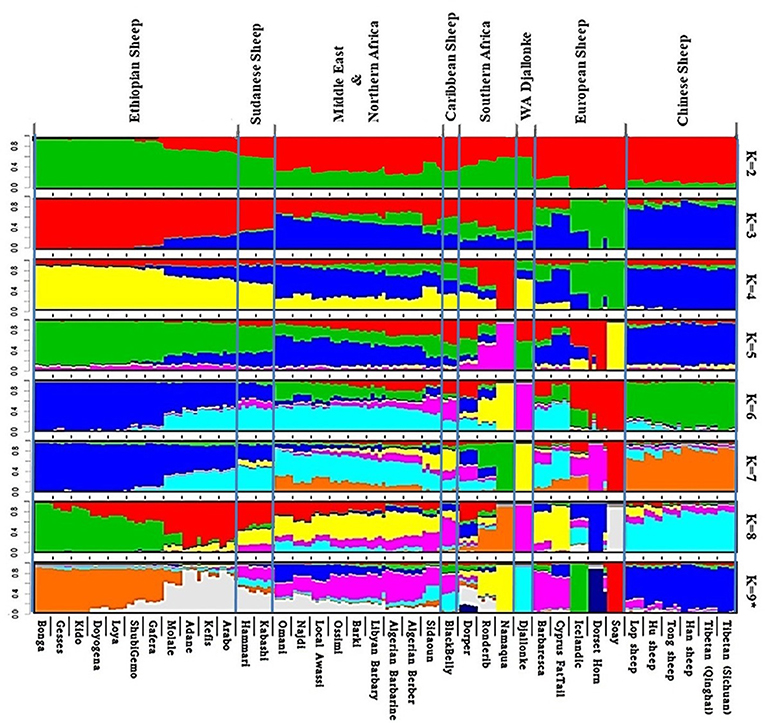
Figure 5. Admixture analysis of the studied populations in a global context (K = 9 had the lowest cross-validation error).
Two to six hypothetical ancestral clusters (K) were tested with Admixture on the East African dataset. The lowest cross-validation error suggests K = 4 (Supplementary Figure 6b) as the optimal number of ancestral clusters present in Ethiopian and Sudanese thin-tail sheep. The proportion of each ancestral cluster (referred to as A, B, C, and D) in each population at K = 4 is shown in Figure 6 and Supplementary Table 2. They occur with the highest proportion (>90%) in Loya (cluster A), Bonga, Kido and Gesses (cluster B), Molale-Menz and a few individuals of Adane (cluster C) and in thin-tail sheep (cluster D). Clusters A, B, and C are observed in ShubiGemo and Doyogena; B and C in Gafera-Washera and Molale-Menz; B, C, and D in some individuals of Adane while Arabo and Kefis had C and D clusters. The analysis also shows that Gafera-Washera, Adane, Molale-Menz, Arabo, and Kefis share cluster C, while Hammari and Kabashi share the D cluster with Arabo and Kefis. ShubiGemo, Loya and Doyogena, all long fat-tail sheep from southern Ethiopia, share cluster A.
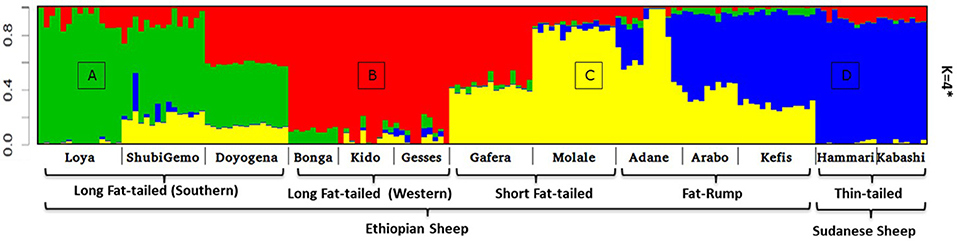
Figure 6. Admixture analysis involving Ethiopian indigenous sheep populations (K = 4 had the lowest cross-validation error). For brevity the four genetic clusters are designated (A)–(D), respectively.
TreeMix revealed possibilities of gene-flow between East African sheep. The f index representing the fraction of the variance in the sample covariance matrix (Ŵ) accounted for by the model covariance matrix (W) was used to identify the information contribution of each migration vector added to the tree. Up to 15 possible migration vertices were computed. The first eight migration edges (gene flow) accounted for more than half of the total model significance explained by the f statistic, with the first migration edge having a f value of 0.51. We therefore chose m = 8 as the best predictive value for the migration model. Vectors from 9 to 15 resulted in only small incremental changes in the f value (Figures 7A,B). The eight migration events were Loya and ShubiGemo (both long fat-tail); Arabo and Adane (both fat-rump); Gafera-Washera, Molale-Menz (both short fat-tail) and Adane (fat-rump); Molale-Menz (short fat-tail) and Adane (fat-rump) with ShubiGemo (long fat-tail); Bonga with ShubiGemo, Doyogena and Loya (all long fat-tail sheep); Molale-Menz (short fat-tail) and Arabo (fat-rump); ShubiGemo (long fat-tail) with Arabo (fat-rump) and Kefis (fat-rump); Gesses (long fat-tail) with Kabashi and Hammari (thin-tail).
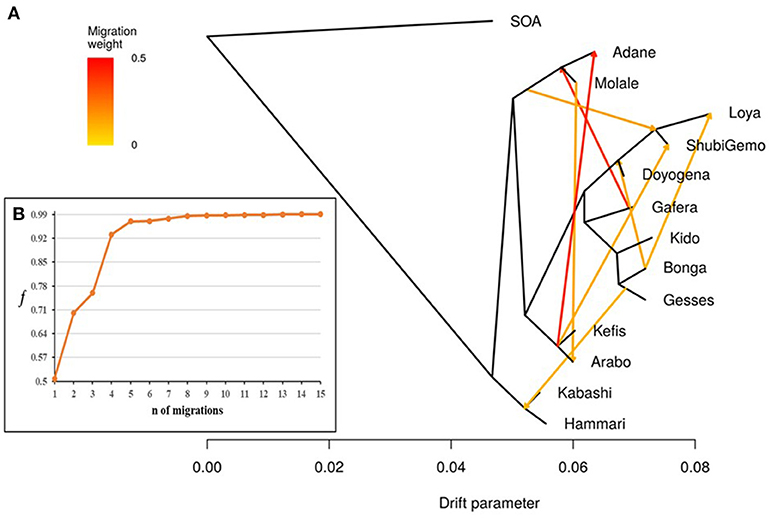
Figure 7. Tree-mix plot. (A) Phylogenetic network inferred by Tree-mix of the relationships between Ethiopian and Sudanese sheep populations. The first eight migration edges between populations are shown with arrows pointing in the direction toward the recipient group and colored according to the ancestry percentage received from the donor. (B) Shows the f index representing the fraction of the variance in the sample covariance matrix () accounted for by the model covariance matrix (W), as a function of the number of modeled migration events.
The f4-statistics, also highlighted possibilities of gene flow among various breeds. The highest Z values (>|50|) were observed between Hammari and Kabashi (thin-tails) and Arabo and Kefis (fat-rump) (Supplementary Table 3). The f3-statistics however, did not reveal any likelihood of gene-flow between the breeds analyzed (Supplementary Table 4). This could be due to a complex pattern of gene-flow between the study populations, which may not be accounted for by a three-way model.
Signatures of Selection
The Admixture, TreeMix and PCA (Figures 6, 7; Supplementary Figure 4) revealed three genetic groups in Ethiopian sheep viz fat-rump (E1), and long fat-tail from western (E2) and southern (E3) Ethiopia, respectively. The two short fat-tail sheep (Molale-Menz and Gafera-Washera) analyzed here were separated from each other (Figure 4) with Molale-Menz showing close genetic affinity to fat-rump sheep and Gafera-Washera appeared genetically distinct. The three groups are distinct from thin-tail (S) sheep (Figure 4). For selection signature analysis, we included Molale-Menz with the fat-rump sheep but excluded Gafera-Washera from the analysis due to its low sample size. We selected, at random, 20 samples to represent each of the four genetic groups and performed the selection signature analysis. We contrasted the three groups of Ethiopian sheep (E1, E2, and E3) with the thin-tail sheep (S). The top windows (Supplementary Table 5), which passed the significance threshold, for each method (hapFLK ≥ 3, ZFST ≥ 4, Rsb ≥ 3) were used to define candidate regions under selection.
For E1*S comparison, the fat-rump sheep were differentiated from the thin-tail in 23 candidate regions that overlapped between at least two selection signature methods and which spanned 86 genes (Figure 8, Table 3). Similarly, a total of 65 genes were present across 18 candidate regions that overlapped between at least two approaches in the E2*S (western Ethiopia long fat-tail verses thin-tail) comparison (Figure 9, Table 4). Furthermore, 10 genes that seemed to be highly selected were identified by Rsb in three candidate regions on Oar8, Oar14, and Oar18, respectively (Figure 9, Table 4). Twelve overlapping candidate regions spanning 36 genes, were observed in the southern Ethiopian fat-tail verses thin-tail sheep (E3*S) (Figure 10, Table 5). There were also 16 genes found across 1 (Oar26, 3 genes), 1 (Oar3, 1 gene), and 12 (Oar2, 1 gene; Oar3, 9 genes; Oar10, 2 genes) candidate regions that were identified by hapFLK, ZFST, and Rsb, respectively (Figure 10, Table 5).
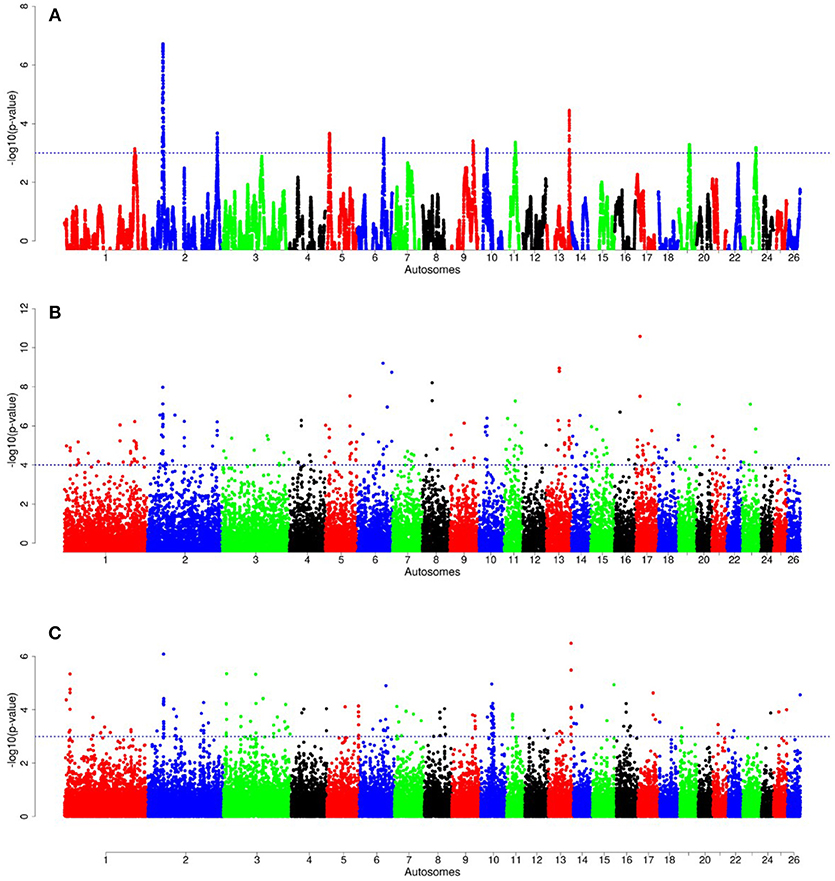
Figure 8. Manhattan plots of genome-wide autosomal hapFLK (A), ZFST (B) and RsB (C) analyses of Ethiopian fat-rump (E1) vs. thin-tail (S) sheep.
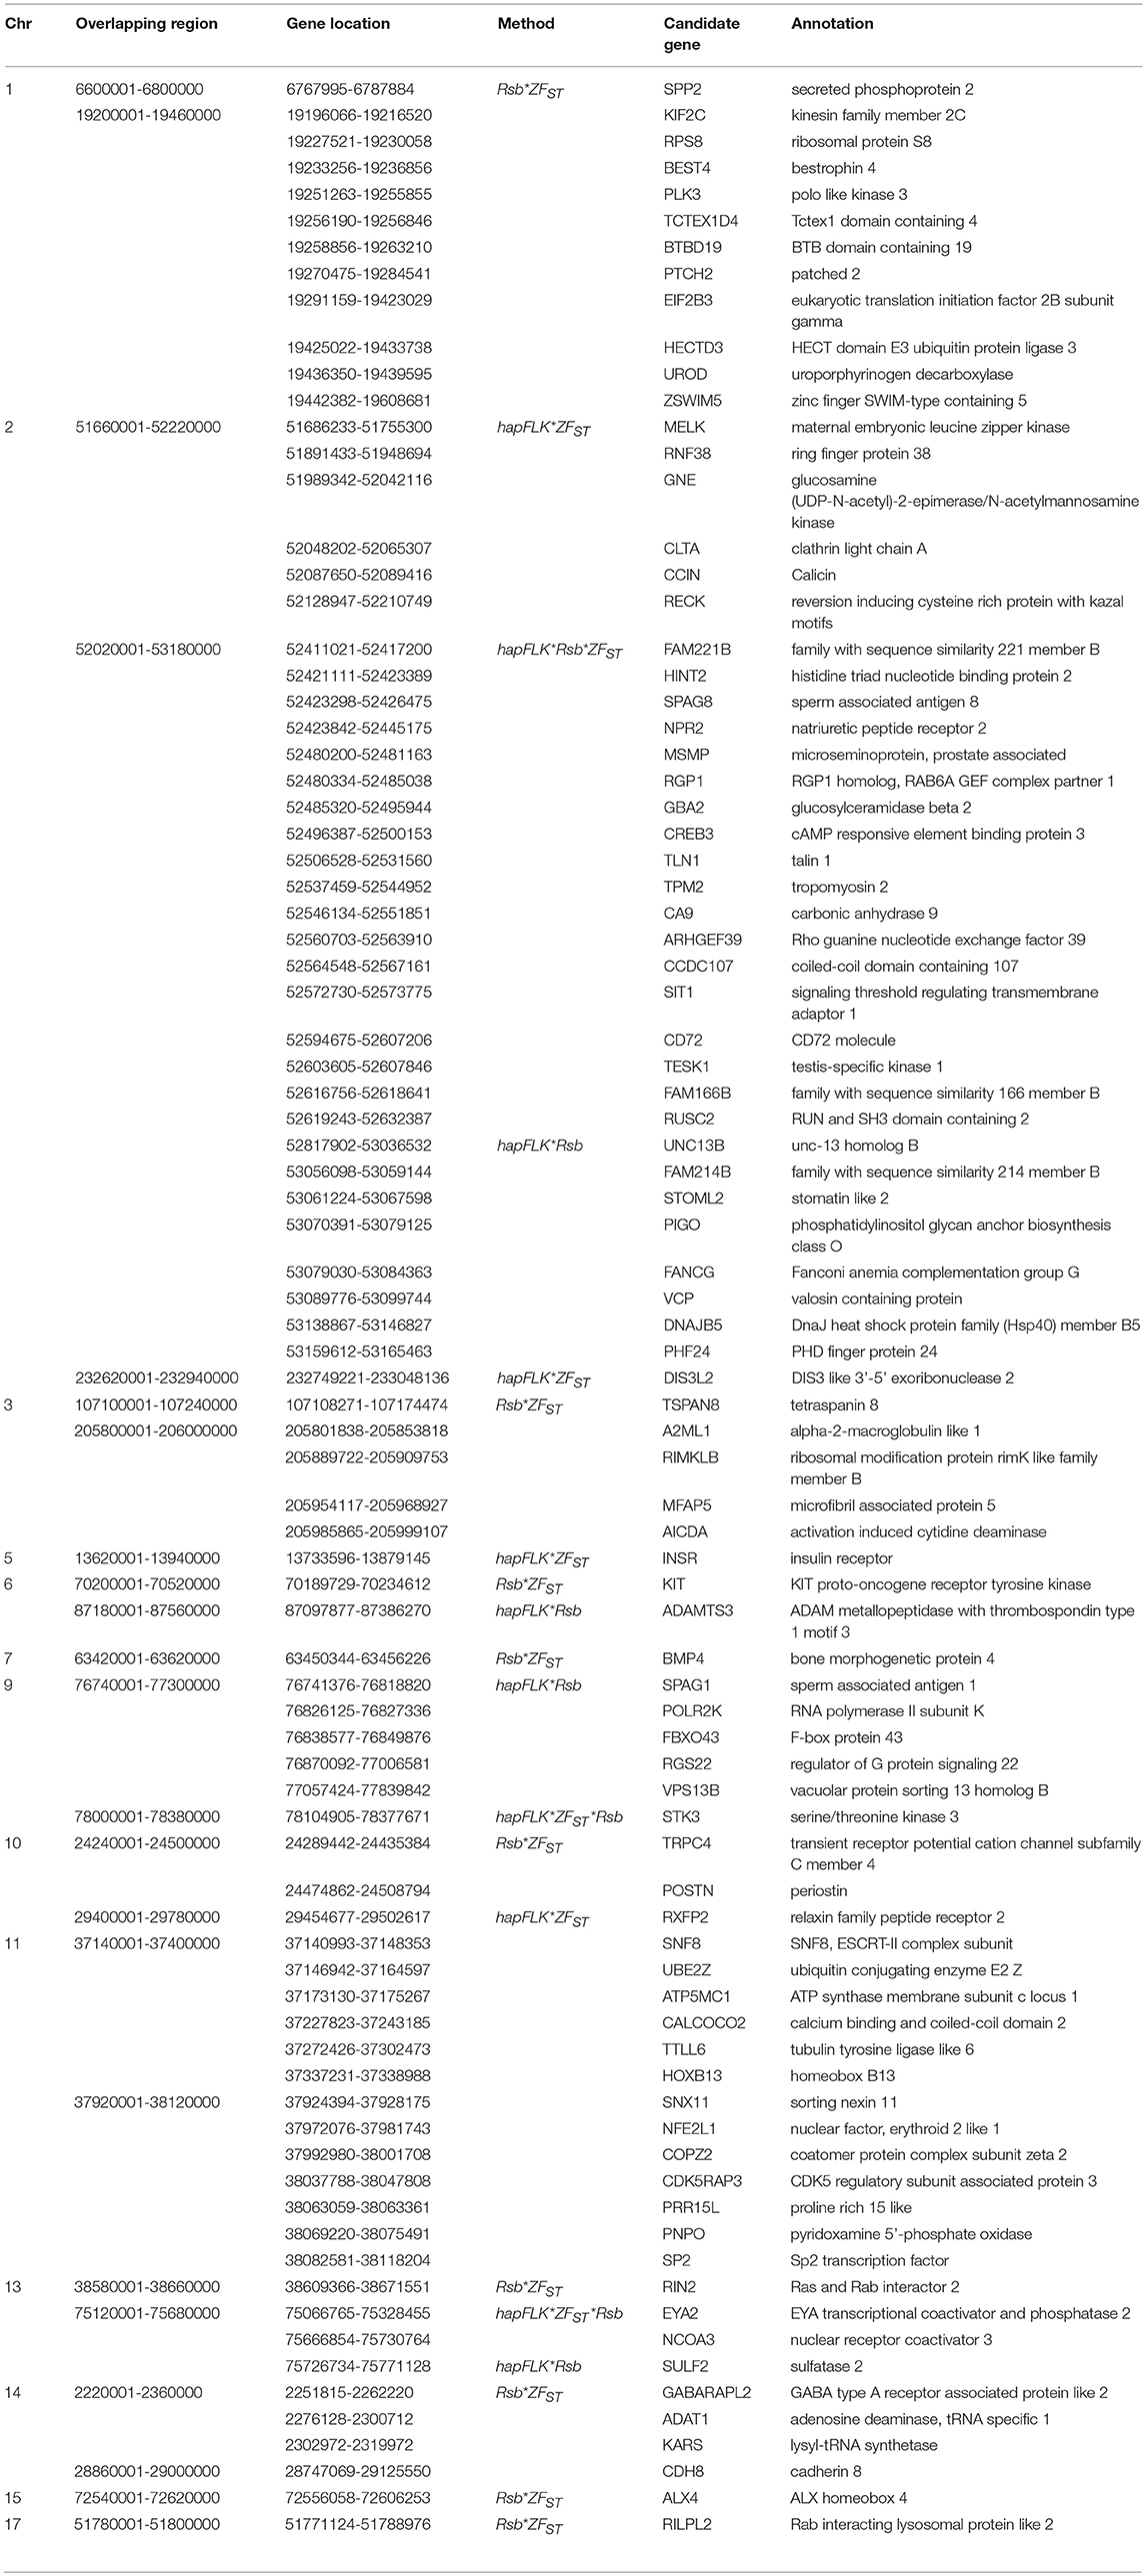
Table 3. Candidate regions and genes identified to be under selection by a combination of at least two methods in the Ethiopian fat-rump vs. Sudanese thin-tail sheep.
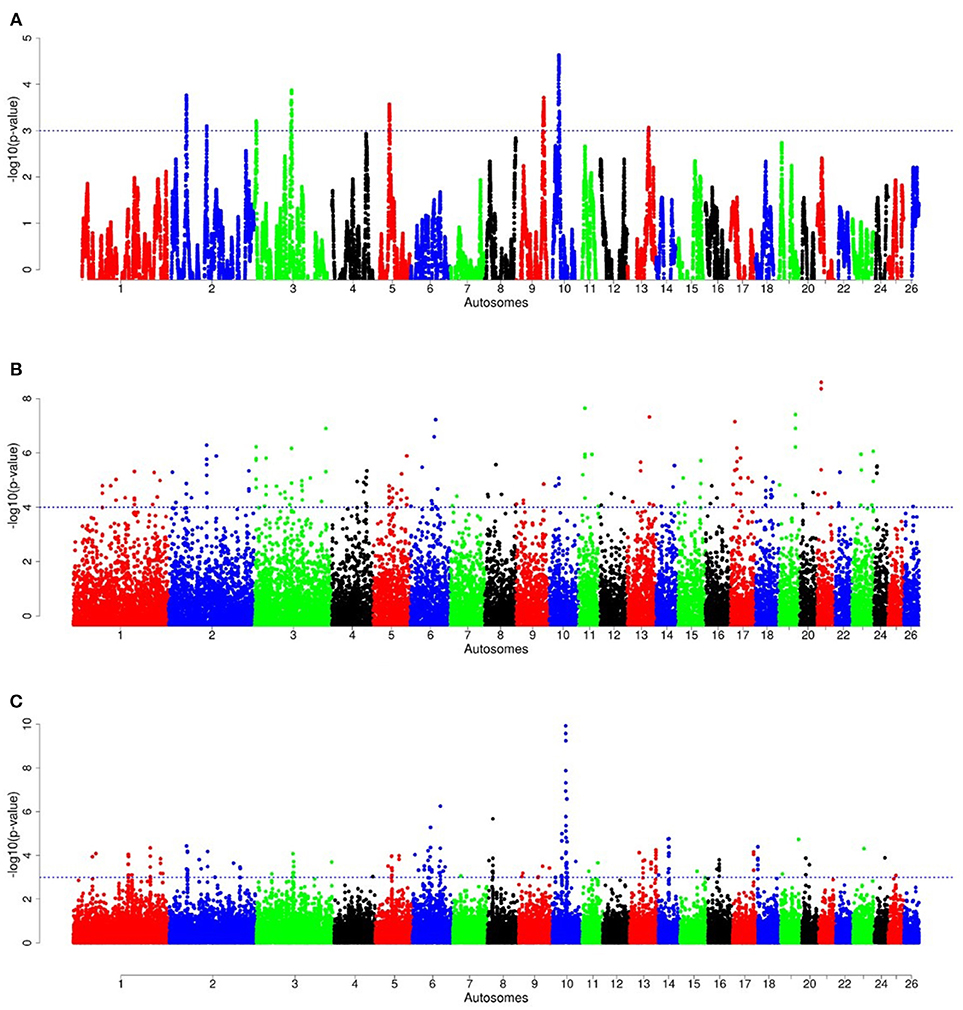
Figure 9. Manhattan plots of genome-wide autosomal hapFLK (A), ZFST (B) and RsB (C) analyses of western Ethiopian long fat-tail sheep (E2) vs. thin-tail (S) sheep.
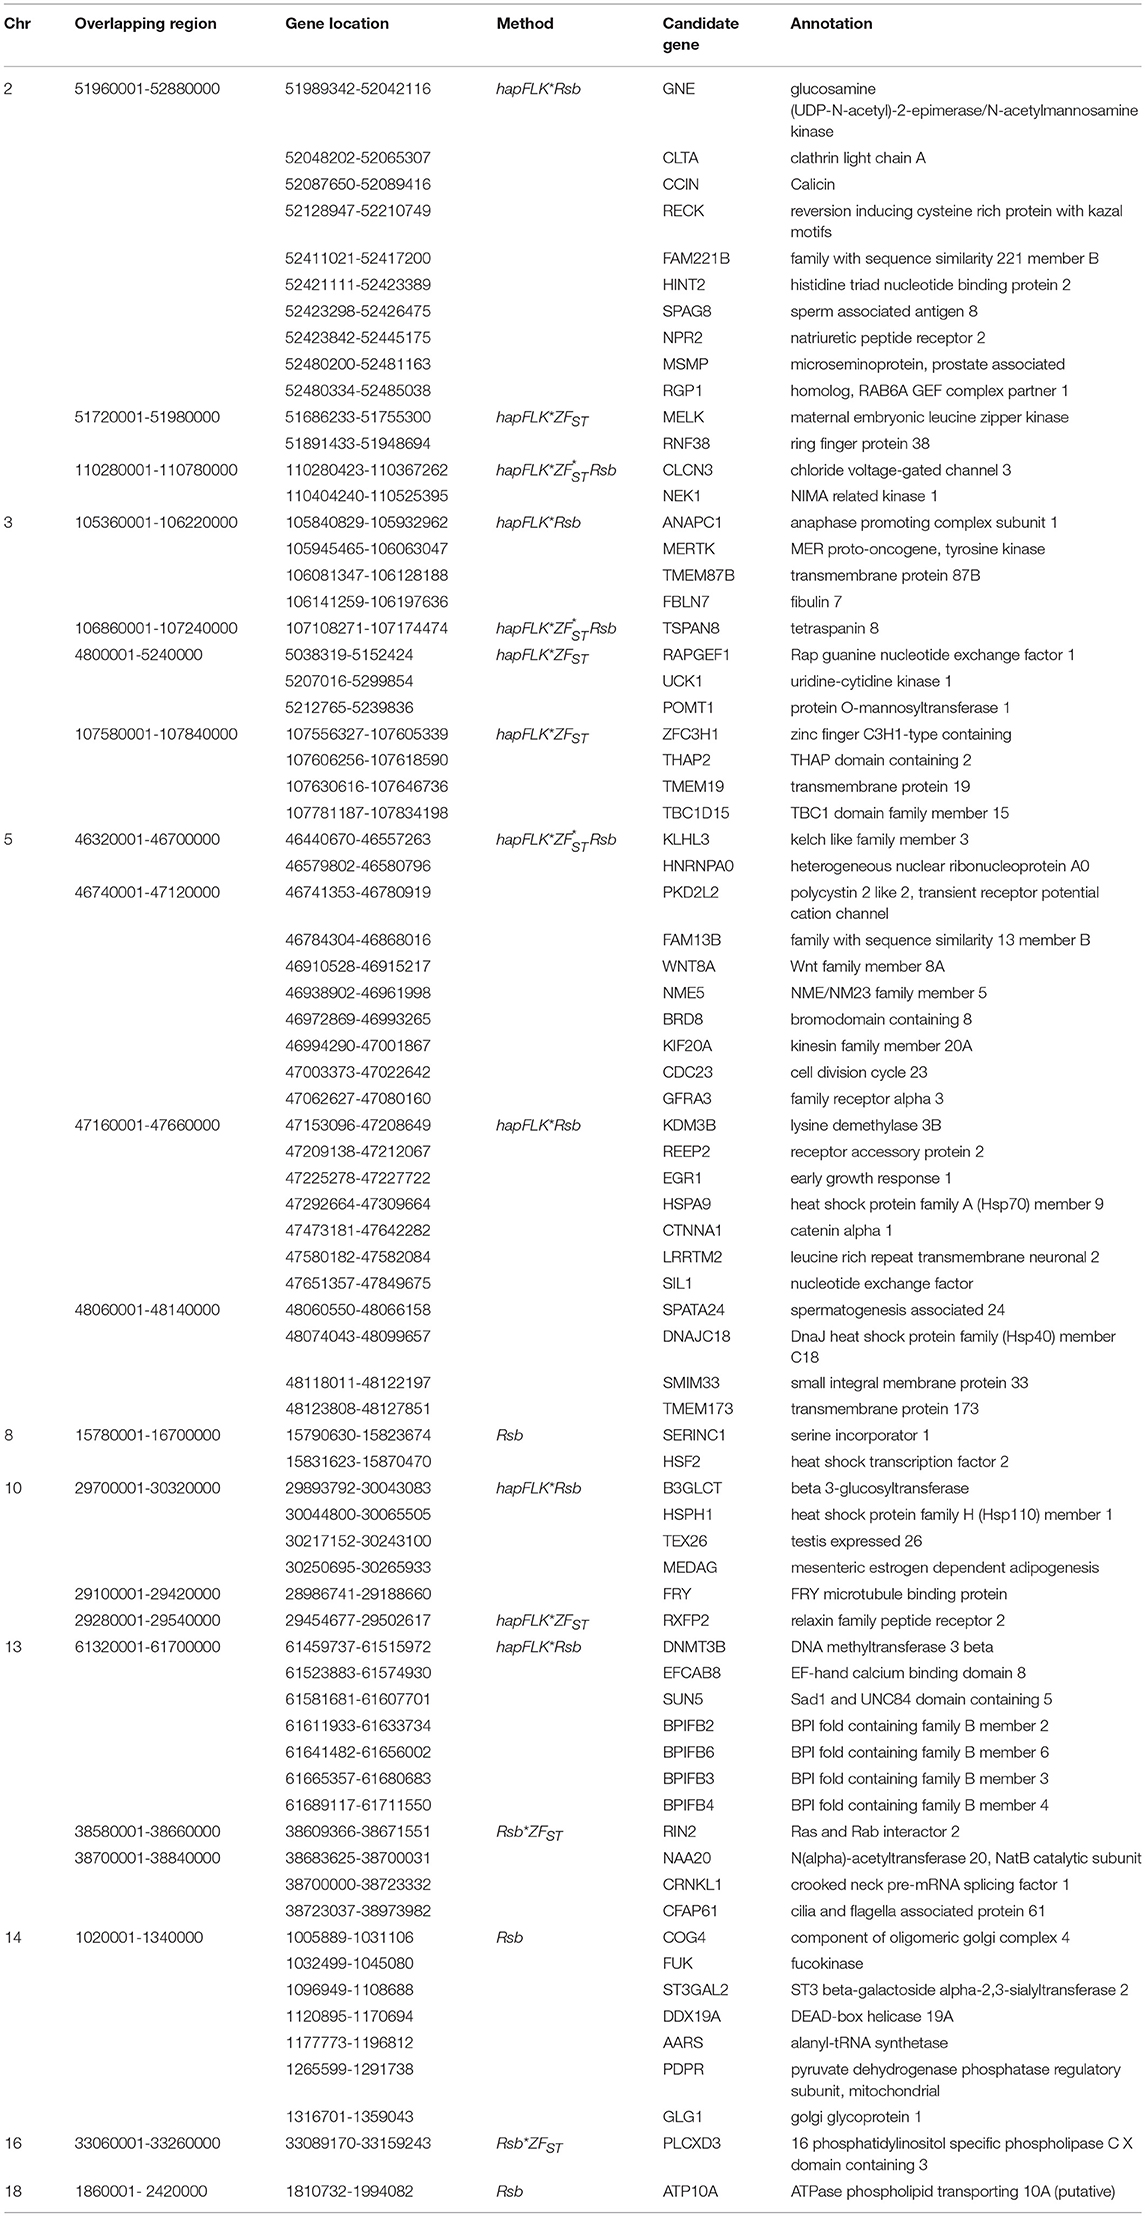
Table 4. Candidate regions and genes identified to be under selection by a combination of at least two methods in the Ethiopian western long fat-tail vs. Sudanese thin-tail sheep.
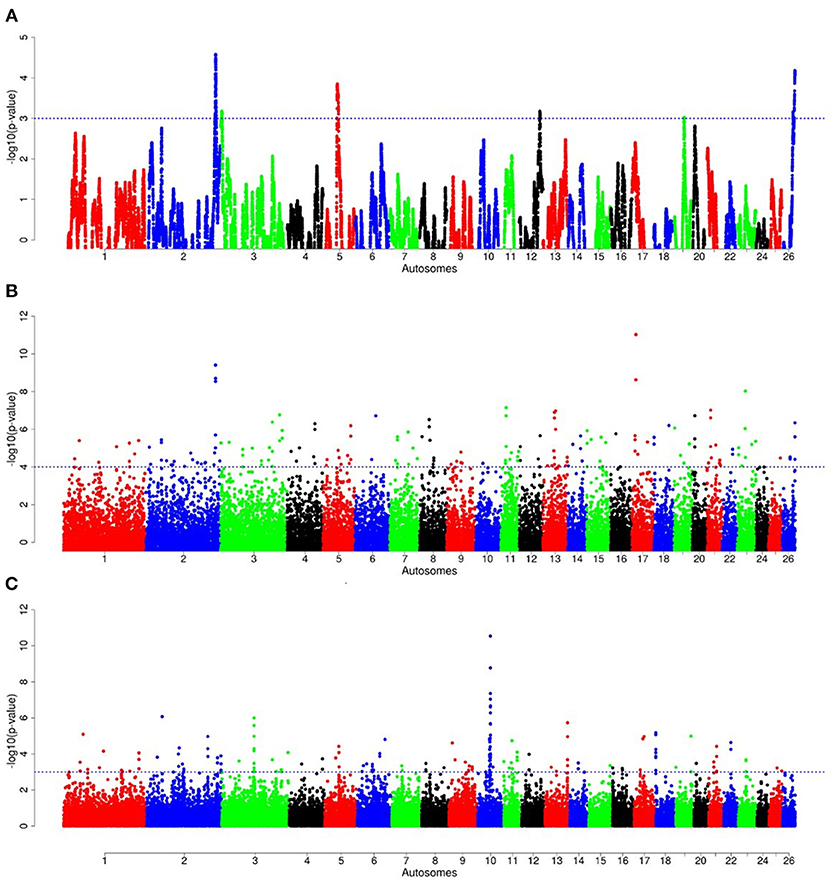
Figure 10. Manhattan plots of genome-wide autosomal hapFLK (A), ZFST (B) and RsB (C) analyses of southern Ethiopian long fat-tail (E3) vs. thin-tail (S) sheep.

Table 5. Candidate regions and genes identified to be under selection by a combination of at least two methods in the southern Ethiopia long fat-tail vs. thin-tail sheep.
We performed gene ontology (GO) enrichment analysis for the candidate genes revealed in each pairwise comparison (Supplementary Table 6). The five topmost GO terms associated with the candidate genes from the E1*S comparison include embryonic skeletal system morphogenesis (GO:0009952, GO:0048704, GO:0030224, GO:0048706), response to cold (GO:0009409), innervation (GO:0060384), stem cell maintenance (GO:0019827) and positive regulation of cell adhesion (GO:0045785). The top GO terms associated with the E2*S candidate genes include cellular response to heat (GO:0034605), lipid binding (GO:0008289), magnesium ion binding (GO:0000287) and response to gamma radiation (GO:0000287). The GO terms for the genes from the E3*S comparison included skin development (GO:0043588), regulation of actin cytoskeleton reorganization (GO:2000249) and wound healing (GO:0042060).
Discussion
In this study, we used Ovine 50 K SNP BeadChip generated genotype data to investigate autosomal genetic diversity in Ethiopian indigenous sheep. Including populations from other regions of the world and the African continent allowed us to assess this diversity in a global geographic context. Our findings showed that the Ethiopian indigenous sheep are genetically differentiated from the other populations including other African fat-tail sheep (Figures 2, 3). The finding that the Ethiopian fat-tail sheep are distinct from those found in North Africa, support the presence of at least two genetic groups of fat-tail sheep in the continent and two separate introduction events, one via the Northeast Africa and the Mediterranean Sea coastline, and the other via the Horn of Africa crossing through the strait of Bab-el-Mandeb, respectively. The distinct clustering of the thin-tail sheep suggests its independent introduction into the continent. The fact that the South African Ronderib and Namaqua sheep occur on the same PC planar axis with Ethiopian sheep (Figure 2) may suggest, a common genetic heritage between the two rather than with the North African breeds. The movement of sheep southwards remains speculative; some linguistic evidence suggests movement of bantu speaking populations from West Africa to South Africa through central Africa and following a western route rather than the more traditionally postulated eastern routes from East to South Africa (Newman, 1995). In such context a close clustering of the thin-tail West African sheep with some fat-tail southern African sheep breeds, such as the Namaqua from Namibia studied here is worth mentioning as it offers some possible insights. This however, will require further investigation beyond the scope of this study.
Our results agree with previous findings that were arrived at using microsatellite loci (Muigai, 2003) and 50 K SNP genotype data (Mwacharo et al., 2017). They are also in line with archaeological and anthropological evidences indicating the introduction first, of thin-tail sheep into the continent followed by fat-tail sheep, initially through the Sinai Peninsula and later the Horn of Africa region (Gifford-Gonzalez and Hanotte, 2011; Muigai and Hanotte, 2013).
Interestingly, the PCA results involving Ethiopian and Sudanese sheep separate the Ethiopian populations into three groups while ADMIXTURE revealed four genetic clusters in Ethiopian sheep irrespective of their geographic origins in the country. TreeMix revealed extensive gene flow between populations of different geographic origins and tail-types. These results suggest, most likely, current and historical intermixing of sheep following human socio-cultural and economic interactions. This appears to be a common feature in Ethiopia and most likely the Northeast and eastern Africa region as it was also observed in Ethiopian goats by Tarekegn et al. (2018). We propose here that the common D genetic background present in short fat-tail and fat-rump sheep may represent historical introgression of the thin-tail gene pool into short fat-tail and fat-rump genepool. This result calls for further investigation.
Our findings on the genetic relationships and differentiation between Ethiopian sheep populations agree with findings of previous studies, which were performed using either microsatellites (Gizaw, 2008) or 50 K SNP genotype data (Edea et al., 2017) and which indicated a grouping of Ethiopian indigenous sheep populations based on their tail phenotypes. However, uniquely in our study, the long fat-tail populations were further subdivided into two secondary groups representing sheep populations from western and southern Ethiopia (Figure 4). These two groups were also defined by different genetic backgrounds by ADMIXTURE (Figure 6) and they clustered separately in TreeMix (Figure 7). In addition, although they are defined by the same tail phenotype, the two populations of Ethiopian short fat-tail sheep did not cluster together. Geographic isolation coupled, most likely, with adaptation to different eco-climates, as well as ethnic, cultural and religious practices and differences, that can impede gene flow, may have shaped this genetic sub-structuring (Madrigal et al., 2001; Gizaw et al., 2007).
In selection signature analysis, we contrasted groups of Ethiopian indigenous sheep that showed variation in the size of the fat-tail with thin-tail sheep. Our results identified several genes as potential candidates controlling tail morphotype and fat localization in the study populations. Several genes occurred within candidate regions that overlapped between at least two of the three approaches used to detect signatures of selection (hapFLK, FST, Rsb). The FST approach detects signatures arising from an increase or decrease in allele frequency differentiation between populations/breeds, hapFLK detects the same but based on increase/decrease in haplotype frequency differentiation between populations while accounting for hierarchical population structure (Kijas, 2014) while Rsb detects signatures associated with the patterns of linkage disequilibrium between loci across the genome (Oleksyk et al., 2010; de Simoni Gouveia et al., 2014). Since these methods are based on different algorithms and assumptions, if common signatures are detected by at least two of the methods it suggests good reliability of the results while reducing the likelihood of interpreting false positives. They also detect signatures spanning different time periods; the FST and hapFLK detect signatures arising from long term differential selection while Rsb detects ongoing signatures of selection including those that arise in the short to medium term (Oleksyk et al., 2010).
In the E1*S comparison, three genes associated with growth traits were present on the candidate region on Oar2, i.e., histidine triad nucleotide binding protein 2 (HINT2), sperm associated antigen 8 (SPAG8) and natriuretic peptide receptor 2 (NPR2). Previous studies reported these genes to be associated with birth and carcass weights, and fat depth, respectively, in cattle (Casas et al., 2000; McClure et al., 2010) and sheep (Moradi et al., 2012; Wei et al., 2015). We also identified two genes on Oar5 (ANGPTL8, INSR), which might be responsible for fat accumulation in adipose tissues. Angiopoietin-like 8 (ANGPTL8), when induced by insulin receptor (INSR), inhibits lipolysis and controls post-prandial fat storage in white adipose tissue and directs fatty acids to adipose tissue for storage during the fed state (Mysore et al., 2017). The ADAMTS3 (ADAM metallopeptidase with thrombospondin type 1 motif 3) gene was present in the region identified on Oar6. This gene is expressed in cartilage, where collagen II is a major component, as well as in embryonic bone and tendon, suggesting that it could be a major procollagen processing enzyme in musculoskeletal tissues (Dubail and Apte, 2015). The homeobox B13 (HOXB13) and ALX homeobox 4 (ALX4) were identified on the candidate region on Oar11 and Oar15, respectively. Mutations in the former result in overgrowth of caudal spinal cord and tail vertebrae in mice (Economides et al., 2003), while the latter is involved in the development of limbs and skeleton (Fariello et al., 2014).
Our enrichment analysis for the E1*S genes revealed a cluster of genes (BMP4, MED1) with functions that could possibly be related to tail formation. Bone Morphogenetic Protein 4 (BMP4) was revealed by Rsb and FST to be on a candidate region on Oar7 and it has been implicated in tail formation (Moioli et al., 2015). Peroxisome Proliferator Activated Receptor Gamma (PPARG) expression has been associated with back-fat thickness in sheep (Dervish et al., 2011). Ge et al. (2008) reported Mediator Complex Subunit 1 (MED1) is an essential protein for the optimal functioning of PPARG. Despite this association, our analysis did not reveal any signals spanning PPARG, but two of our methods (Rsb and FST) revealed a signature on Oar20 that spanned the PPARD gene, a paralogue to PPARG.
In the same comparison (E1*S), we identified a cluster of genes (CDH8, ADRB3, THRA, TRPM8, PLAC8) that are associated with the GO biological process, response to cold. This is not surprising considering that three out of the four E1 populations are living at a high altitude and therefore in a relatively cold habitat. Indeed, Adreno receptor Beta 3 (ADRB3) plays a major role in energy metabolism and regulation of lipolysis and homeostasis (Wu et al., 2012). It is also associated with birth weight, growth rate, carcass composition and survival in various breeds of sheep (Horrell et al., 2009). The ion channel TRPM8 has been reported to play a major role in eliciting cold defense thermoregulation, metabolic and defense immune responses in humans (Kozyreva and Voronova, 2015).
Several other genes occurring in the E1*S candidate regions and which are associated with the GO term embryonic skeletal system development (GO:0048706) included HOXC6, SULF2, WNT11, and HOXB9. WNT11 was identified by ZFST on Oar15 while HOXC6 and HOXB9 were revealed by hapFLK on Oar3 and Oar13, respectively. The WNT gene family and the T gene have been implicated in vertebral development in laboratory mice (Greco et al., 1996), and with the short-tail phenotype in sheep (Zhi et al., 2018). In addition, the roles of the WNT gene family in lipid metabolic processes in fat-tail sheep have also been reported (Kang et al., 2017). The HOX genes represent transcriptional regulatory proteins that control axial patterning in bilaterians (Garcia-Fernàndez, 2005), where the inactivation of one of the HOX genes often causes transformations in the identity of vertebral elements (Mallo et al., 2010). The HOX genes are able to control morphologies along the anteroposterior axis (Lewis, 1978). Furthermore, HOXC11, HOXC12, and HOXC13 developmental genes were found to be expressed in the tail region indicating their possible associations with tail size and fat development in fat-tail sheep (Kang et al., 2017).
The candidate regions revealed by the E2*S comparison, spanned 65 candidate genes. Three genes of the BPI fold Containing Family B (BPIFB3, BPIFB4, and BPIFB6) were present in a candidate region on Oar13. These, along with other paralogs (BPIFB1, BPIFA3, BPIFB2, BPIFA1), formed a cluster of functional genes related to the GO term, lipid binding functional process (Supplementary Table 6). In contrast to the E1*S comparison, the cluster of genes identified in the E2*S comparison were associated with the GO terms, Magnesium ion binding, response to gamma radiation and cellular response to heat. This suggests, most likely, the propensity of this group of sheep to adapt to the eco-climatic conditions prevailing in their home-tract. This is consistent with the humid highland and moist lowland conditions of the geographic area where the populations representing the E2 group (Bonga, Gesses, Kido) were sampled. High fecundity and prolificacy is a common reproductive trait preferred by farmers in the Bonga sheep (field observations by the last author). This may explain the occurrence of the CIB4 and PRKAA1 in a candidate region in the E2*S comparison. The CIB4 gene was suggested to be linked, in some way, to high fecundity in the small Tail Han sheep (Yu et al., 2010) and PRKAA1 is involved in ewe's follicular development (Foroughinia et al., 2017).
The third comparison (E3*S) resulted in 36 genes that occurred in candidate regions that were revealed by at least two methods used to detect selection signatures. Fatty acid binding proteins FABP3 and FABP1 found on candidate regions on Oar2 and Oar3, respectively are the genes that relate most closely to fat deposition. SREBF1 along with PPARG are the main transcription factors controlling lipogenesis in adipose tissue and skeletal muscle (Ferré and Foufelle, 2010), and are mainly regulated by fatty acid-binding proteins (FABP) (Lapsys et al., 2000). Recently, Bahnamiri et al. (2018) evaluated the effects of negative and positive energy balances on the expression pattern of these genes in fat-tail and thin-tail lambs. They observed differential transcriptional regulation of lipogenesis and lipolysis during periods of negative and positive energy balances in the two groups of lambs. In general, the cluster of genes identified in this comparison was significantly enriched for GO terms relating to skin development, wound healing and regulation of actin cytoskeleton reorganization (Supplementary Table 6).
The overlapped genes between all comparisons are shown in Supplementary Figure 7. The commonest genes between the three comparisons are TSPAN8, RXFP2, and RIN2. The TSPAN8 (Tetraspanin 8) occurred in the candidate region on Oar3; it is among the genes that are reported to be associated with insulin release and sensitivity, and obesity in humans (Grarup et al., 2008), while the relaxin family peptide receptor 2 (RXFP2) has been associated with horn morphology (Johnston et al., 2011; Wiedemar and Drögemüller, 2015).
Twelve genes (MELK, RNF38, GNE, CLTA, CCIN, RECK, HINT2, SPAG8, NPR2, FAM221B, MSMP, RGP1) were common between E1*S and E2*S comparisons. On Oar2, three genes were identified within the overlapping candidate region, i.e., CLTA which is associated with prion protein deposition in sheep (Filali et al., 2014), GNE which is important for the metabolism of sialated oligosaccharides in bovine milk (Wickramasinghe et al., 2011) and RECK which encodes an inhibitor of angiogenesis, invasion and metastasis, DNA methylation, and increased mRNA in cell lines in humans (Su, 2012). Other genes (i.e., HINT2, SPAG8, and NPR2) are associated with fat deposition in sheep as herein discussed for each of the three comparisons.
Furthermore, one gene (DIS3L2) was in a candidate region that overlapped between the E1*S and E3*S comparisons. DIS3 like 3'-5' exoribonuclease 2 (DIS3L2) has also been identified, among genes involved in cancer, cellular function and maintenance, and neurological disease, in a candidate region under selection in cattle (Gautier et al., 2009). In sheep, using FST, iHS, and Rsb, de Simoni Gouveia et al. (2017) indicated that DIS3L2 is among genes associated with height variation. In addition, DIS3L2 has reportedly been associated with the Perlman syndrome, which is characterized by overweight in humans (Astuti et al., 2012).
Finally, seventeen genes (PKD2L2, FAM13B, WNT8A, NME5, BRD8, KIF20A, CDC23, GFRA3, CTNNA1, LRRTM2, SIL1, SPATA24, DNAJC18, SMIM33, TMEM173, FRY, ATP10A) were in candidate regions that overlapped between the E2*S and E3*S comparisons. Among these, DnaJ heat shock protein family (HSP40) member C18 (DNAJC18) and spermatogenesis associated 24 (SPATA24) on Oar5 were reported among genes involved in heat stress tolerance and male reproductive function, respectively, in East African Shorthorn Zebu cattle (Bahbahani et al., 2015).
Conclusion
Overall, our results revealed four distinct autosomal genomic backgrounds (A, B, C, D) in Ethiopian indigenous sheep. The genotypes of most of the individuals analyzed were made up of at least two genetic backgrounds which could be accounted for by some level of current or historical admixture between populations. Selection signature analysis identified several putative candidate regions spanning genes relating to skeletal structure and morphology, fat deposition and possibly adaptation to environmental selection pressures. Our results indicate that Ethiopian indigenous sheep could be a valuable animal genetic resource that can be used to understand genetic mechanisms associated with body fat metabolism and distribution. This is especially important because fat deposits are a crucial component of adaptive physiology and excessive fat deposition in adipose tissue can result in obesity and overweight, and energy metabolism disorders in humans.
Data Accessibility
Genotypic data of 160 animals representing eleven Ethiopian and two Sudanese sheep populations are deposited and available at (https://www.animalgenome.org/repository/pub/NOTT2018.0423/).
Ethics Statement
The animals used in this study are owned by farmers. Prior to sampling, the objectives of the study were explained to them in their local languages so that they could make an informed decision regarding giving consent to sample their animals. Government veterinary, animal welfare and health regulations were observed during sampling. The procedures involving sample collection followed the recommendation of directive 2010/63/EU. Skin tissues importation and/or exportation was permitted by the Ethiopian Ministry of Livestock and Fisheries under Certificate No: 14-160-401-16.
Author Contributions
AbA, JM, and OH conceived and designed the study. AbA analyzed the data and together with JM wrote the manuscript. JM and OH revised the manuscript. HB provided support in data analysis. SM, FP, and EC contributed to genotyping and genotype data of non-Ethiopian breeds (Najdi, Omani, and Libyan Barbary) and provided critical inputs on data analysis and in writing the manuscript. FA, MA, and MOA supported the sampling and genotyping of Najdi, Omani and Libyan sheep. AK and AyA lead and coordinated the sampling of Ethiopian sheep HM lead and coordinate the sampling of Sudanese sheep. All authors contributed to the interpretation of the results based on their knowledge on local indigenous sheep genetic resources of their respective countries. All the authors read and approved the final manuscript.
Conflict of Interest Statement
The authors declare that the research was conducted in the absence of any commercial or financial relationships that could be construed as a potential conflict of interest.
Acknowledgments
This study was conducted during AbA's PhD study which is sponsored by the Libyan Ministry of Higher Education and Scientific Research and the University of Misurata. Sampling of Ethiopian sheep was supported by the CGIAR Research Program on Livestock (Livestock CRP) and accordingly, ICARDA and ILRI wish to thank the donors supporting the Livestock CRP. This study forms part of our on-going efforts to understand the adaptation of local indigenous livestock to improve their productivity.
Supplementary Material
The Supplementary Material for this article can be found online at: https://www.frontiersin.org/articles/10.3389/fgene.2018.00699/full#supplementary-material
Supplementary Figure 1. Patterns of linkage disequilibrium (LD) calculated within the Ethiopian (ET) and Sudanese (SD) sheep populations.
Supplementary Figure 2. Distribution of the standardized Z-score values for (A) hapFLK and (B) FST for the autosomal markers.
Supplementary Figure 3. Distribution of genetic diversity indices within each breed. (A) SNP displaying polymorphism (Pn), (B) Expected heterozygosity (He); Observed heterozygosity (Ho); (C) Inbreeding coefficient (F).
Supplementary Figure 4. Genetic variation among the Ethiopian sheep populations in a global geographic context (all animals included for each population).
Supplementary Figure 5. Distribution of genetic variation among the worldwide fat-tail sheep (all animals included for each population).
Supplementary Figure 6. Cross-validation error plot for admixture analysis of the studied populations (A) in the national and (B) in the global context.
Supplementary Figure 7. Venn diagram showing the distribution and number of genes shared between the three groups of sheep (E1, E2, E3, S) used in the analysis of selection signatures.
Supplementary Table 1. Description of the world-wide breeds of sheep used in the study.
Supplementary Table 2. Proportion of the genetic backgrounds in each study population as identified by Admixture analysis.
Supplementary Table 3. Results of f4 statistics for the study breeds as generated with TreeMix.
Supplementary Table 4. Results of f3 statistics for the study breeds as generated with TreeMix.
Supplementary Table 5. Results of signature of selection between the three population groups.
Supplementary Table 6. Enriched functional term clusters and their enrichment scores following DAVID analysis for genes identified in the candidate regions under selection.
References
Alexander, D. H., Novembre, J., and Lange, K. (2009). Fast model-based estimation of ancestry ain unrelated individuals. Genome Res. 19, 1655–1664. doi: 10.1101/gr.094052.109
Assefa, F., Tigistu, T., and Lambebo, A. (2015). Assessment of the production system, major constraints and opportunities of sheep production in doyogena woreda, kembata tambaro zone, southern ethiopia. J Biol Agric Healthc. 5, 37–41. Available online at: https://iiste.org/Journals/index.php/JBAH/article/view/27068
Astuti, D., Morris, M. R., Cooper, W. N., Staals, R. H., Wake, N. C., and Fews, G. A. (2012). Germline mutations in DIS3L2 cause the Perlman syndrome of overgrowth and Wilms tumor susceptibility. Nat. Genet. 44, 277–284. doi: 10.1038/ng.1071
Atti, N., Bocquier, F., and Khaldi, G. (2004). Performance of the fat-tailed Barbarine sheep in its environment: adaptive capacity to alternation of underfeeding and re-feeding periods. Rev. Anim. Res. 53, 165–176. doi: 10.1051/animres:2004012
Bahbahani, H., Clifford, H., Wragg, D., Mbole-Kariuki, M. N., Van Tassell, C., Sonstegard, T., et al. (2015). Signatures of positive selection in East African Shorthorn Zebu: a genome-wide single nucleotide polymorphism analysis. Sci. Rep. 5:11729. doi: 10.1038/srep11729
Bahnamiri, H. Z., Zali, A., Ganjkhanlou, M., Sadeghi, M., and Shahrbabak, H. M. (2018). Regulation of lipid metabolism in adipose depots of fat-tailed and thin-tailed lambs during negative and positive energy balances. Gene 641, 203–211. doi: 10.1016/j.gene.2017.10.065
Blench, R., and MacDonald, K. (eds.). (2006). The Origins and Development of African Livestock: Archaeology, Genetics, Linguistics and Ethnography. London; New York, NY: Routledge; Taylor & Francis Group.
Buchmann, R., and Hazelhurst, S. (2014). Genesis Manual. Johannesburg: University of the Witwatersrand. Available online at: http://www.bioinf.wits.ac.za/software/genesis/Genesis.pdf
Casas, E., Shackelford, S. D., Keele, J. W., Stone, R. T., Kappes, S. M., and Koohmaraie, M. (2000). Quantitative trait loci affecting growth and carcass composition of cattle segregating alternate forms of myostatin. J Anim. Sci. 78, 560–569. doi: 10.2527/2000.783560x
de Simoni Gouveia, J. J., de, S., Silva, M.V.G.B. da., Paiva, S. R., and Oliveira, S. M. P., de (2014). Identification of selection signatures in livestock species. Genet. Mol. Biol. 37, 330–342. doi: 10.1590/S1415-47572014000300004
de Simoni Gouveia, J. J., Paiva, S. R., McManus, C. M., Caetano, A. R., Kijas, J. W., and Facó, O. (2017). Genome-wide search for signatures of selection in three major Brazilian locally adapted sheep breeds. Livest. Sci. 197, 36–45. doi: 10.1016/j.livsci.2017.01.006
Delaneau, O., Marchini, J., McVean, G. A., Donnelly, P., Lunter, G., and Marchini, J. L. (2014). Integrating sequence and array data to create an improved 1000 Genomes Project haplotype reference panel. Nat. Commun. 5:3934. doi: 10.1038/ncomms4934
Dervish, E., Serrano, C., Joy, M., Serrano, M., Rodellar, C., and Calvo, J. H. (2011). The effect of feeding system in the expression of genes related with fat metabolism in semitendinous muscle in sheep. Meat Sci. 89, 91–97. doi: 10.1016/j.meatsci.2011.04.003
Dubail, J., and Apte, S. S. (2015). Insights on ADAMTS proteases and ADAMTS-like proteins from mammalian genetics. Matrix Biol. 44, 24–37. doi: 10.1016/j.matbio.2015.03.001
Economides, K. D., Zeltser, L., and Capecchi, M. R. (2003). Hoxb13 mutations cause overgrowth of caudal spinal cordand tail vertebrae. Dev. Biol. 256, 317–330. doi: 10.1016/S0012-1606(02)00137-9
Edea, Z., Dessie, T., Dadi, H., Do, K. T., and Kim, K. S. (2017). Genetic diversity and population structure of Ethiopian sheep populations revealed by high-density SNP markers. Front. Genet. 8:218. doi: 10.3389/fgene.2017.00218
Epstein, H. (1971). The Origin of Domestic Animals of Africa, Volume 2. New York, NY: Africana Publication Corporation, 719.
Fariello, M. I., Boitard, S., Naya, H., San Cristobal, M., and Servin, B. (2013). Detecting signatures of selection through haplotype differentiation among hierarchically structured populations. Genetics 193, 929–941. doi: 10.1534/genetics.112.147231
Fariello, M. I., Servin, B., Tosser-Klopp, G., Rupp, R., Moreno, C., San Cristobal, M., et al. (2014). Selection signatures in worldwide sheep populations. PLoS ONE 9:e103813. doi: 10.1371/journal.pone.0103813
Ferré, P., and Foufelle, F. (2010). Hepatic steatosis: a role for de novo lipogenesis and the transcription factor SREBP-1c. Diabetes Obes. Metab. 12, 83–92. doi: 10.1111/j.1463-1326.2010.01275.x
Filali, H., Martín-Burriel, I., Harders, F., Varona, L., Hedman, C., and Mediano, D. R. (2014). Gene expression profiling of mesenteric lymph nodes from sheep with natural scrapie. BMC Genom. 15:59. doi: 10.1186/1471-2164-15-59
Foroughinia, G., Fazileh, A., and Eghbalsaied, S. (2017). Expression of genes involved in BMP and estrogen signaling and AMPK production can be important factors affecting total number of antral follicles in ewes. Theriogenology 91, 36–43. doi: 10.1016/j.theriogenology.2016.12.023
Garcia-Fernàndez, J. (2005). Hox, ParaHox, ProtoHox: facts and guesses. Heredity 94, 145–152. doi: 10.1038/sj.hdy.6800621
Gautier, M., Flori, L., Riebler, A., Jaffrézic, F., Lalo,é, D., Gut, I., et al. (2009). A whole genome Bayesian scan for adaptive genetic divergence in West African cattle. BMC Genom. 10:550. doi: 10.1186/1471-2164-10-550
Gautier, M., and Vitalis, R. (2012). rehh: an R package to detect footprints of selection in genome-wide SNP data from haplotype structure. Bioinformatics 28, 1176–1177. doi: 10.1093/bioinformatics/bts115
Ge, K., Cho, Y. W., Guo, H., Hong, T. B., Guermah, M., and Ito, M. (2008). Alternative mechanisms by which mediator subunit MED1/TRAP220 regulates peroxisome proliferator-activated receptor γ-stimulated adipogenesis and target gene expression. Mol. Cell. Biol. 28, 1081–1091. doi: 10.1128/MCB.00967-07
Gifford-Gonzalez, D., and Hanotte, O. (2011). Domesticating animals in Africa: Implications of genetic and archaeological findings. J. World Prehistory 24,1–23. doi: 10.1007/s10963-010-9042-2
Gizaw, S. (2008). Sheep Resources of Ethiopia: Genetic Diversity and Breeding Strategy. A Ph.D. thesis, Wageningen University. 145.
Gizaw, S., Van Arendonk, J. A., Komen, H., Windig, J. J., and Hanotte, O. (2007). Population structure, genetic variation and morphological diversity in indigenous sheep of Ethiopia. Anim. Genet. 38, 621–628. doi: 10.1111/j.1365-2052.2007.01659.x
Goudet, J. (2005). Hierfstat, a package for R to compute and test hierarchical F-statistics. Mol. Ecol. Resour. 5, 184–186. doi: 10.1111/j.1471-8286.2004.00828.x
Grarup, N., Andersen, G., Krarup, N. T., Albrechtsen, A., Schmitz, O., Jørgensen, T., et al. (2008). Association testing of novel type 2 diabetes risk alleles in the JAZF1, CDC123/CAMK1D, TSPAN8, THADA, ADAMTS9, and NOTCH2 loci with insulin release, insulin sensitivity, and obesity in a population-based sample of 4,516 glucose-tolerant middle-aged Danes. Diabetes 57, 2534–2540. doi: 10.2337/db08-0436
Greco, T. L., Takada, S., Newhouse, M. M., McMahon, J. A., McMahon, A. P., and Camper, S. A. (1996). Analysis of the vestigial tail mutation demonstrates that Wnt-3a gene dosage regulates mouse axial development. Genes Develop. 10, 313–324. doi: 10.1101/gad.10.3.313
Horrell, A., Forrest, R. H. J., Zhou, H., Fang, Q., and Hickford, J. G. H. (2009). Association of the ADRB3 gene with birth weight and growth rate to weaning in New Zealand Romney sheep. Anim. Genet. 40, 251–251. doi: 10.1111/j.1365-2052.2008.01807.x
Huang, D. W., Sherman, B. T., and Lempicki, R. A. (2008). Systematic and integrative analysis of large gene lists using DAVID bioinformatics resources. Nat. Protoc. 4, 44–57. doi: 10.1038/nprot.2008.211
Jiang, Y., Xie, M., Chen, W., Talbot, R., Maddox, J. F., Faraut, T., et al. (2014). The sheep genome illuminates biology of the rumen and lipid metabolism. Science 344, 1168–1173. doi: 10.1126/science.1252806
Johnston, S. E., McEwan, J. C., Pickering, N. K., Kijas, J. W., Beraldi, D., Pilkington, J. G., et al. (2011). Genome-wide association mapping identifies the genetic basis of discrete and quantitative variation in sexual weaponry in a wild sheep population. Mol. Ecol. 20, 2555–2566. doi: 10.1111/j.1365-294X.2011.05076.x
Kang, D., Zhou, G., Zhou, S., Zeng, J., Wang, X., Jiang, Y., et al. (2017). Comparative transcriptome analysis reveals potentially novel roles of Homeobox genes in adipose deposition in fat-tailed sheep. Sci. Rep. 7:14491. doi: 10.1038/s41598-017-14967-9
Kijas, J. W. (2014). Haplotype-based analysis of selective sweeps in sheep. Genome 57, 433–437. doi: 10.1139/gen-2014-0049
Kozyreva, T. V., and Voronova, I. P. (2015). Involvement of neurogenomic regulation in maintenance of temperature homeostasis in the cold. Russ. J. Genet. Appl. Res. 5, 569–576. doi: 10.1134/S2079059715060039
Lapsys, N. M., Kriketos, A. D., Lim-Fraser, M., Poynten, A. M., Lowy, A., and Furler, S. M. (2000). Expression of genes involved in lipid metabolism correlate with peroxisome proliferator-activated receptor γ expression in human skeletal muscle. J. Clin. Endocr. Metab. 85, 4293–4297. doi: 10.1210/jc.85.11.4293
Lawal, R. A., Al-Atiyat, R. M., Aljumaah, R. S., Silva, P., Mwacharo, J. M., and Hanotte, O. (2018). Whole-genome resequencing of red junglefowl and indigenous village chicken reveal new insights on the genome dynamics of the species. Front. Genet. 9:264. doi: 10.3389/fgene.2018.00264
Lewis, E. B. (1978). A gene complex controlling segmentation in Drosophila. Nature 276, 565–570. doi: 10.1038/276565a0
Madrigal, L., Ware, B., Miller, R., Saenz, G., Chavez, M., and Dykes, D. (2001). Ethnicity, gene flow, and population subdivision in Limon, Costa Rica. Am. J. Phys. Anthrop. 114, 99–108. doi: 10.1002/1096-8644(200102)114:2<99::AID-AJPA1010>3.0.CO;2-V
Mallo, M., Wellik, D. M., and Deschamps, J. (2010). Hox genes and regional patterning of the vertebrate body plan. Dev. Biol. 344, 7–15. doi: 10.1016/j.ydbio.2010.04.024
Marshall, F. (2000). The Origins and Spread of Domestic Animals in East Africa in The origins and Development of African Livestock: Archaeology, Genetics, Linguistics and Ethnography, London: University College London Press. 191–221.
McClure, M. C., Morsci, N. S., Schnabel, R. D., Kim, J. W., Yao, P., and Rolf, M. M. (2010). A genome scan for quantitative trait loci influencing carcass, post-natal growth and reproductive traits in commercial Angus cattle. Anim. Genet. 41, 597–607. doi: 10.1111/j.1365-2052.2010.02063.x
Moioli, B., Pilla, F., and Ciani, E. (2015). Signatures of selection identify loci associated with fat tail in sheep. J. Anim. Sci. 93, 4660–4669. doi: 10.2527/jas.2015-9389
Moradi, M. H., Nejati-Javaremi, A., Moradi-Shahrbabak, M., Dodds, K. G., and McEwan, J. C. (2012). Genomic scan of selective signals in thin and fat tail sheep breeds for identifying of candidate regions associated with fat deposition. BMC Genet. 13:10. doi: 10.1186/1471-2156-13-10
Muigai, A. W. T. (2003). Characterization and Conservation of Indigenous Animal Genetic Resources: Genetic Diversity and Relationships of Fat-Tailed and Thin-Tailed Sheep of Africa. Ph.D. thesis, Jomo Kenyatta, University of Agriculture and Technology Juja, Kenya.
Muigai, A. W. T., and Hanotte, O. (2013). Then origin of African sheep: Archaeological and genetics perspectives. Afr. Archaeol. Rev. 30, 39–50. doi: 10.1007/s10437-013-9129-0
Mwacharo, J. M., Kim, E.-S., Elbeltagy, A. R., Aboul-Naga, A. M., Rischkowsky, B. A., and Rothschild, M. F. (2017). Genomic footprints of dryland stress adaptation in Egyptian fat-tail sheep and their divergence from East Africa and western Asia cohorts. Sci. Rep. 7:17647. doi: 10.1038/s41598-017-17775-3
Mysore, R., Liebisch, G., Zhou, Y., Olkkonen, V. M., and Haridas, P. N. (2017). Angiopoietin-like 8 (Angptl8) controls adipocyte lipolysis and phospholipid composition. Chem. Phys. Lipids 207, 246–252. doi: 10.1016/j.chemphyslip.2017.05.002
Nejati-Javaremi, A., Izadi, F., Rahmati, G., and Moradi, M. (2007). Selection in fat-tailed sheep based on two traits of fat-tail and body weight versus single-trait total body weight. Int. J Agri. Biol. 9, 645–648. Available online at: http://www.fspublishers.org/Issue.php?categoryID=38
Newman, J. L. (1995). The Peopling of Africa: A Geographic Interpretation. Dexter, MI: Yale University Press.
Oleksyk, T. K., Smith, M. W., and O'Brien, S. J. (2010). Genome-wide scans for footprints of natural selection. Philos. Trans. R. Soc. Lond. B Biol. Sci. 365, 185–205. doi: 10.1098/rstb.2009.0219
Pickrell, J. K., and Pritchard, J. K. (2012). Inference of population splits and mixtures from genome-wide allele frequency data. PLoS Genet. 8:e1002967. doi: 10.1371/journal.pgen.1002967
Purcell, S., Neale, B., Todd-Brown, K., Thomas, L., Ferreira, M. A., and Bender, D. (2007). PLINK: a tool set for whole-genome association and population-based linkage analyses. Am. J. Hum. Genet. 81, 559–575. doi: 10.1086/519795
Quinlan, A. R., and Hall, I. M. (2010). BEDTools: a flexible suite of utilities for comparing genomic features. Bioinformatics 26, 841–842. doi: 10.1093/bioinformatics/btq033
R Core Team (2012). R: A Language and Environment for Statistical Computing. R Foundation for Statistical Computing, Vienna. Available online at: URL http://www.R-project.org/
Su, L. J. (2012). Diet, Epigenetics, and Cancer. In Cancer Epigenetics, Totowa, NJ: Humana Press, 377–393. doi: 10.1007/978-1-61779-612-8_24
Tarekegn, G. M., Tesfaye, K., Mwai, O. A., Djikeng, A., Dessie, T., Birungi, J., et al. (2018). Mitochondrial DNA variation reveals maternal origins and demographic dynamics of Ethiopian indigenous goats. Ecol Evol. 8, 1543–1553. doi: 10.1002/ece3.3710
Wei, C., Wang, H., Liu, G., Wu, M., Cao, J., and Liu, Z. (2015). Genome-wide analysis reveals population structure and selection in Chinese indigenous sheep breeds. BMC Genom. 16:194. doi: 10.1186/s12864-015-1384-9
Weir, B. S., and Cockerham, C. C. (1984). Estimating F-statistics for the analysis of population structure. Evolution 38, 1358–1370.
Wickramasinghe, S., Hua, S., Rincon, G., Islas-Trejo, A., German, J. B., Lebrilla, C. B., et al. (2011). Transcriptome profiling of bovine milk oligosaccharide metabolism genes using RNA-sequencing. PLoS ONE 6:e18895. doi: 10.1371/journal.pone.0018895
Wiedemar, N., and Drögemüller, C. (2015). A 1.8-kb insertion in the 3′-UTR of RXFP2 is associated with polledness in sheep. Anim. Genet. 46, 457–461. doi: 10.1111/age.12309
Wu, J., Qiao, L., Liu, J., Yuan, Y., and Liu, W. (2012). SNP variation in ADRB3 gene reflects the breed difference of sheep populations. Molecular Biol. Rep. 39, 8395–8403. doi: 10.1007/s11033-012-1690-0
Yu, Y., Zhang, Y., Song, X., Jin, M., Guan, Q., Zhang, Q., et al. (2010). Alternative splicing and tissue expression of CIB4 gene in sheep testis. Anim. Repro. Sci. 120, 1–9. doi: 10.1016/j.anireprosci.2010.01.004
Yuan, Z., Liu, E., Liu, Z., Kijas, J. W., Zhu, C., Hu, S., et al. (2017). Selection signature analysis reveals genes associated with tail type in Chinese indigenous sheep. Anim. Genet. 48, 55–66. doi: 10.1111/age.12477
Zhi, D., Da, L., Liu, M., Cheng, C., Zhang, Wang, Y., et al. (2018). Whole genome sequencing of hulunbuir short-tailed sheep for identifying candidate genes related to the short-tail phenotype. Gene Genom. Genet. 3:300307. doi: 10.1534/g3.117.300307
Keywords: admixture, Africa, fat-tail, Ovis aries, thin-tail
Citation: Ahbara A, Bahbahani H, Almathen F, Al Abri M, Agoub MO, Abeba A, Kebede A, Musa HH, Mastrangelo S, Pilla F, Ciani E, Hanotte O and Mwacharo JM (2019) Genome-Wide Variation, Candidate Regions and Genes Associated With Fat Deposition and Tail Morphology in Ethiopian Indigenous Sheep. Front. Genet. 9:699. doi: 10.3389/fgene.2018.00699
Received: 21 April 2018; Accepted: 13 December 2018;
Published: 09 January 2019.
Edited by:
Peter Dovc, University of Ljubljana, SloveniaReviewed by:
Kwan-Suk Kim, Chungbuk National University, South KoreaMarco Milanesi, São Paulo State University, Brazil
Copyright © 2019 Ahbara, Bahbahani, Almathen, Al Abri, Agoub, Abeba, Kebede, Musa, Mastrangelo, Pilla, Ciani, Hanotte and Mwacharo. This is an open-access article distributed under the terms of the Creative Commons Attribution License (CC BY). The use, distribution or reproduction in other forums is permitted, provided the original author(s) and the copyright owner(s) are credited and that the original publication in this journal is cited, in accordance with accepted academic practice. No use, distribution or reproduction is permitted which does not comply with these terms.
*Correspondence: Abulgasim Ahbara, Abulgasim.ahbara@nottingham.ac.uk; abulgasim68@gmail.com
Joram M. Mwacharo, j.mwacharo@cgiar.org