 Can Liu†Jideng Ma†Jinwei Zhang†Han ZhaoYan ZhuJing QiLingyan LiuLi Zhu
 Yanzhi JiangGuoqing TangXuewei Li
 Mingzhou Li*
- Farm Animal Genetic Resource Exploration and Innovation Key Laboratory of Sichuan Province, Sichuan Agricultural University, Chengdu, China
Mammalian mitochondrial biogenesis is a complex process involving mitochondrial proliferation and differentiation. Mitochondrial DNA transcription factor A (TFAM), which encodes a major component of a protein-mitochondrial DNA (mtDNA) complex, is regulated by peroxisome proliferator-activated receptor γ coactivator 1α (PGC1α). Testosterone is the primary male sex hormone and plays an increasingly important role in mammalian development through its interaction with androgen receptor (AR). However, the function of AR in mitochondrial biogenesis induced by testosterone deficiency has not been investigated. Here, we explored the molecular mechanism underlying the effect of testosterone deficiency on mitochondrial biogenesis using a Yorkshire boar model. Testosterone deficiency caused by castration induced changes in mtDNA copy numbers in various tissues, and AR showed the opposite tendency to that of mtDNA copy number, particularly in adipose tissues and muscle tissues. In addition, castration weakened the correlation of PGC1α and mtDNA copy number, while AR and TFAM showed a relatively high correlation in both control and castrated pigs. Furthermore, luciferase assays revealed that AR binds to potential AR elements in the TFAM promoter to promote TFAM expression. Taken together, testosterone may be involved in the pathway linking PGC1α to mitochondrial biogenesis through the interaction between AR and TFAM.
Introduction
As vital organelles in eukaryotic cells, mitochondria are involved in various biological processes, including cell energy metabolism (Aversa et al., 2017), calcium ion homeostasis (Detmer and Chan, 2007), and cell apoptosis (Teslaa et al., 2016). In mammals, the quantity, structure, and function of mitochondria can critically affect the development of various tissues and organs, especially those with higher energy metabolism, such as heart (Gustafsson and Gottlieb, 2008) and skeletal muscle (Wu et al., 2002). The two opposing processes, mitochondrial biogenesis and mitochondrial autophagy, finely influence the mitochondrial homeostasis, and an imbalanced response to either of two the processes results in functional deterioration of biological systems and promotes cell death (Palikaras and Tavernarakis, 2014). Mitochondrial biogenesis is a complex process involving mitochondrial proliferation and differentiation and is synergistically regulated by both mitochondrial and nuclear genomes (Attardi and Schatz, 1988). The PGC1 family plays a key role in inducing mitochondrial biogenesis and improving mitochondrial respiration (Lehman et al., 2000). As the master regulator of mitochondrial biogenesis, PGC1α can activate nuclear respiratory factors (NRF-1) and then upregulate the gene expression of nuclear TFAM, the first identified mitochondrial DNA (mtDNA) transcription factor that is essential for proper mtDNA copy number and transcription (Ekstrand et al., 2004; Clay Montier et al., 2009; Taherzadeh-Fard et al., 2011). Furthermore, recent studies have showed that Parkin and Pink1 proteins are involved in the mitochondrial autophagy induced by reduced membrane potential (Narendra et al., 2008, 2010). In addition, Bnip3 (Lee et al., 2011; Hanna et al., 2012) and ATG7 (Mortensen and Simon, 2010) are also closely related to mitochondrial autophagy. Accumulating evidence showed that mitochondrial dysfunction is closely related to human mtDNA-mutation diseases including skeletal muscle atrophy (Theilen et al., 2016), prostate cancer (Zhou et al., 2014), cardiovascular disease (Tsutsui et al., 2008) and breast cancer (Thyagarajan et al., 2013), which are associated with variations in mtDNA copy number. This suggests the crucial role of mitochondrial homoeostasis in maintaining a variety of normal physiological processes (Eskiocak et al., 2016). However, the tissue profile of mtDNA copy numbers and mitochondrial homoeostasis-associated gene expressions in mammals has not been well-studied.
Testosterone is the primary male sex hormone secreted by testis interstitial cells and has a wide variety of effects on sex differentiation (Isidori et al., 2005), fat deposition (Mammi et al., 2011; Kelly and Jones, 2013), muscle growth (Schaap et al., 2005), the cardiovascular system (Reckelhoff, 2005; Lopes et al., 2012), and the immune system (Trigunaite et al., 2015). In the cell cytoplasm, testosterone is often converted by 5α-reductase to the more active form, dihydrotestosterone (DHT). DHT efficiently binds to AR and triggers an AR conformational change, heat shock protein disaggregation and AR phosphorylation. AR then translocates to the nucleus, where it can recruit coactivators and transactivates testosterone-responsive genes by binding to androgen response elements (AREs) in the gene promoters (Shaffer et al., 2004; Burek et al., 2007). Although AR is widely expressed in mammalian cells and tissues, testosterone exerts its pleiotropic effects via AR-dependent or AR-independent mechanisms (Torres-Estay et al., 2017; Gaba et al., 2018). For example, testosterone prevents atherosclerosis through improving endothelial cell growth and survival via AR-independent mechanisms. In contrast, testosterone and DHT stimulate vascular smooth muscle cell proliferation via AR-independent and AR-dependent pathways (Nheu et al., 2011). Recent studies showed that testosterone can promote the mitochondrial biogenesis in skeletal muscle (Usui et al., 2014), and inhibit the proliferation of mitochondria in white adipocytes (Capllonchamer et al., 2014). Zawada et al. (2015) also indicated that the biogenesis of mitochondria might be regulated by sexual dimorphism, and further proved that testosterone and mitochondria are closely related. In addition, recent studies found that the knockdown of ATP1A1, an androgen-regulated gene, would induce mitochondrial dysfunction by disrupting ion homoeostasis, hence indicating the existence of the AR-mitochondria pathway (Jin et al., 2013; Eskiocak et al., 2016; Takase et al., 2017). Nonetheless, the potential relationship and underlying mechanisms between testosterone and mitochondrial homeostasis have not been fully illustrated.
In this study, we established a testosterone deficiency model in Yorkshire boars by prepubertal castration to research the effect and underlying molecular mechanism of testosterone on the AR distribution pattern and mitochondrial homoeostasis in various tissues. Our results suggested that testosterone might have pleiotropic effects on mitochondrial homoeostasis and the AR distribution pattern. These findings provide a foundation for further studying the correlation between testosterone and mtDNA copy number in different tissues and the effect of testosterone in the modulation of this link.
Materials and Methods
Animals and Tissue Collection
The experimental procedures used in this study were approved by the Institutional Animal Care and Use Committee of Sichuan Agricultural University (Approval No. DKY-S20153307, 15 November 2015). A total of twenty-four Yorkshire boars (including 12 pairs of full siblings) were used in this study. At the age of 7 days, both testicles of one piglet in each pair were removed by surgical castration under anesthesia (castrated group); the control piglet in each pair remained intact (control group). Animals were fed with free access to food and water. At the age of 10 months, all animals were humanely killed as necessary to ameliorate suffering and not fed the night before they were slaughtered. The phenotypic parameters of all animals (n = 24) in both group (control and castrated group) were determined, including body weight, serum testosterone level, and visceral indexes (i.e., the ratio of tissue weight/body weight). Next, four pigs of each group were randomly selected for tissue collection and subsequent assays. Adipose tissues (upper layer of backfat, inner layer of backfat, mesenteric adipose, intermuscular adipose, retroperitoneal adipose, greater omentum), muscle tissues (psoas major muscle, longissimus dorsi muscle, corpus linguae, left atrium, left ventricle), endocrine glands (adrenal gland, prostate, seminal vesicle, mammary gland), immunologic tissues (spleen, mesenteric lymph nodes, caecal submucosal lymphatic) and other major organs (liver, lung, kidney) were collected according to the guidelines for the care and use of experimental animals established by the Ministry of Agriculture of China. Tissues were then rapidly divided into small pieces, and partially frozen in liquid nitrogen and stored at -80°C until RNA and DNA extraction The remaining parts were stored with formalin fixation.
Three healthy male Yorkshire piglets were selected for primary cell preparation. Animals were killed at the age of 7 days under isoflurane anesthesia, by artery bleeding from the exposed aorta, and then disinfected with 75% alcohol. The piglets were rapidly dissected. Subcutaneous adipose tissues (regio scapularis) and longissimus dorsi muscle tissues were sampled under aseptic condition and used immediately for primary cell isolation. The experimental design is shown in the Figure 1.
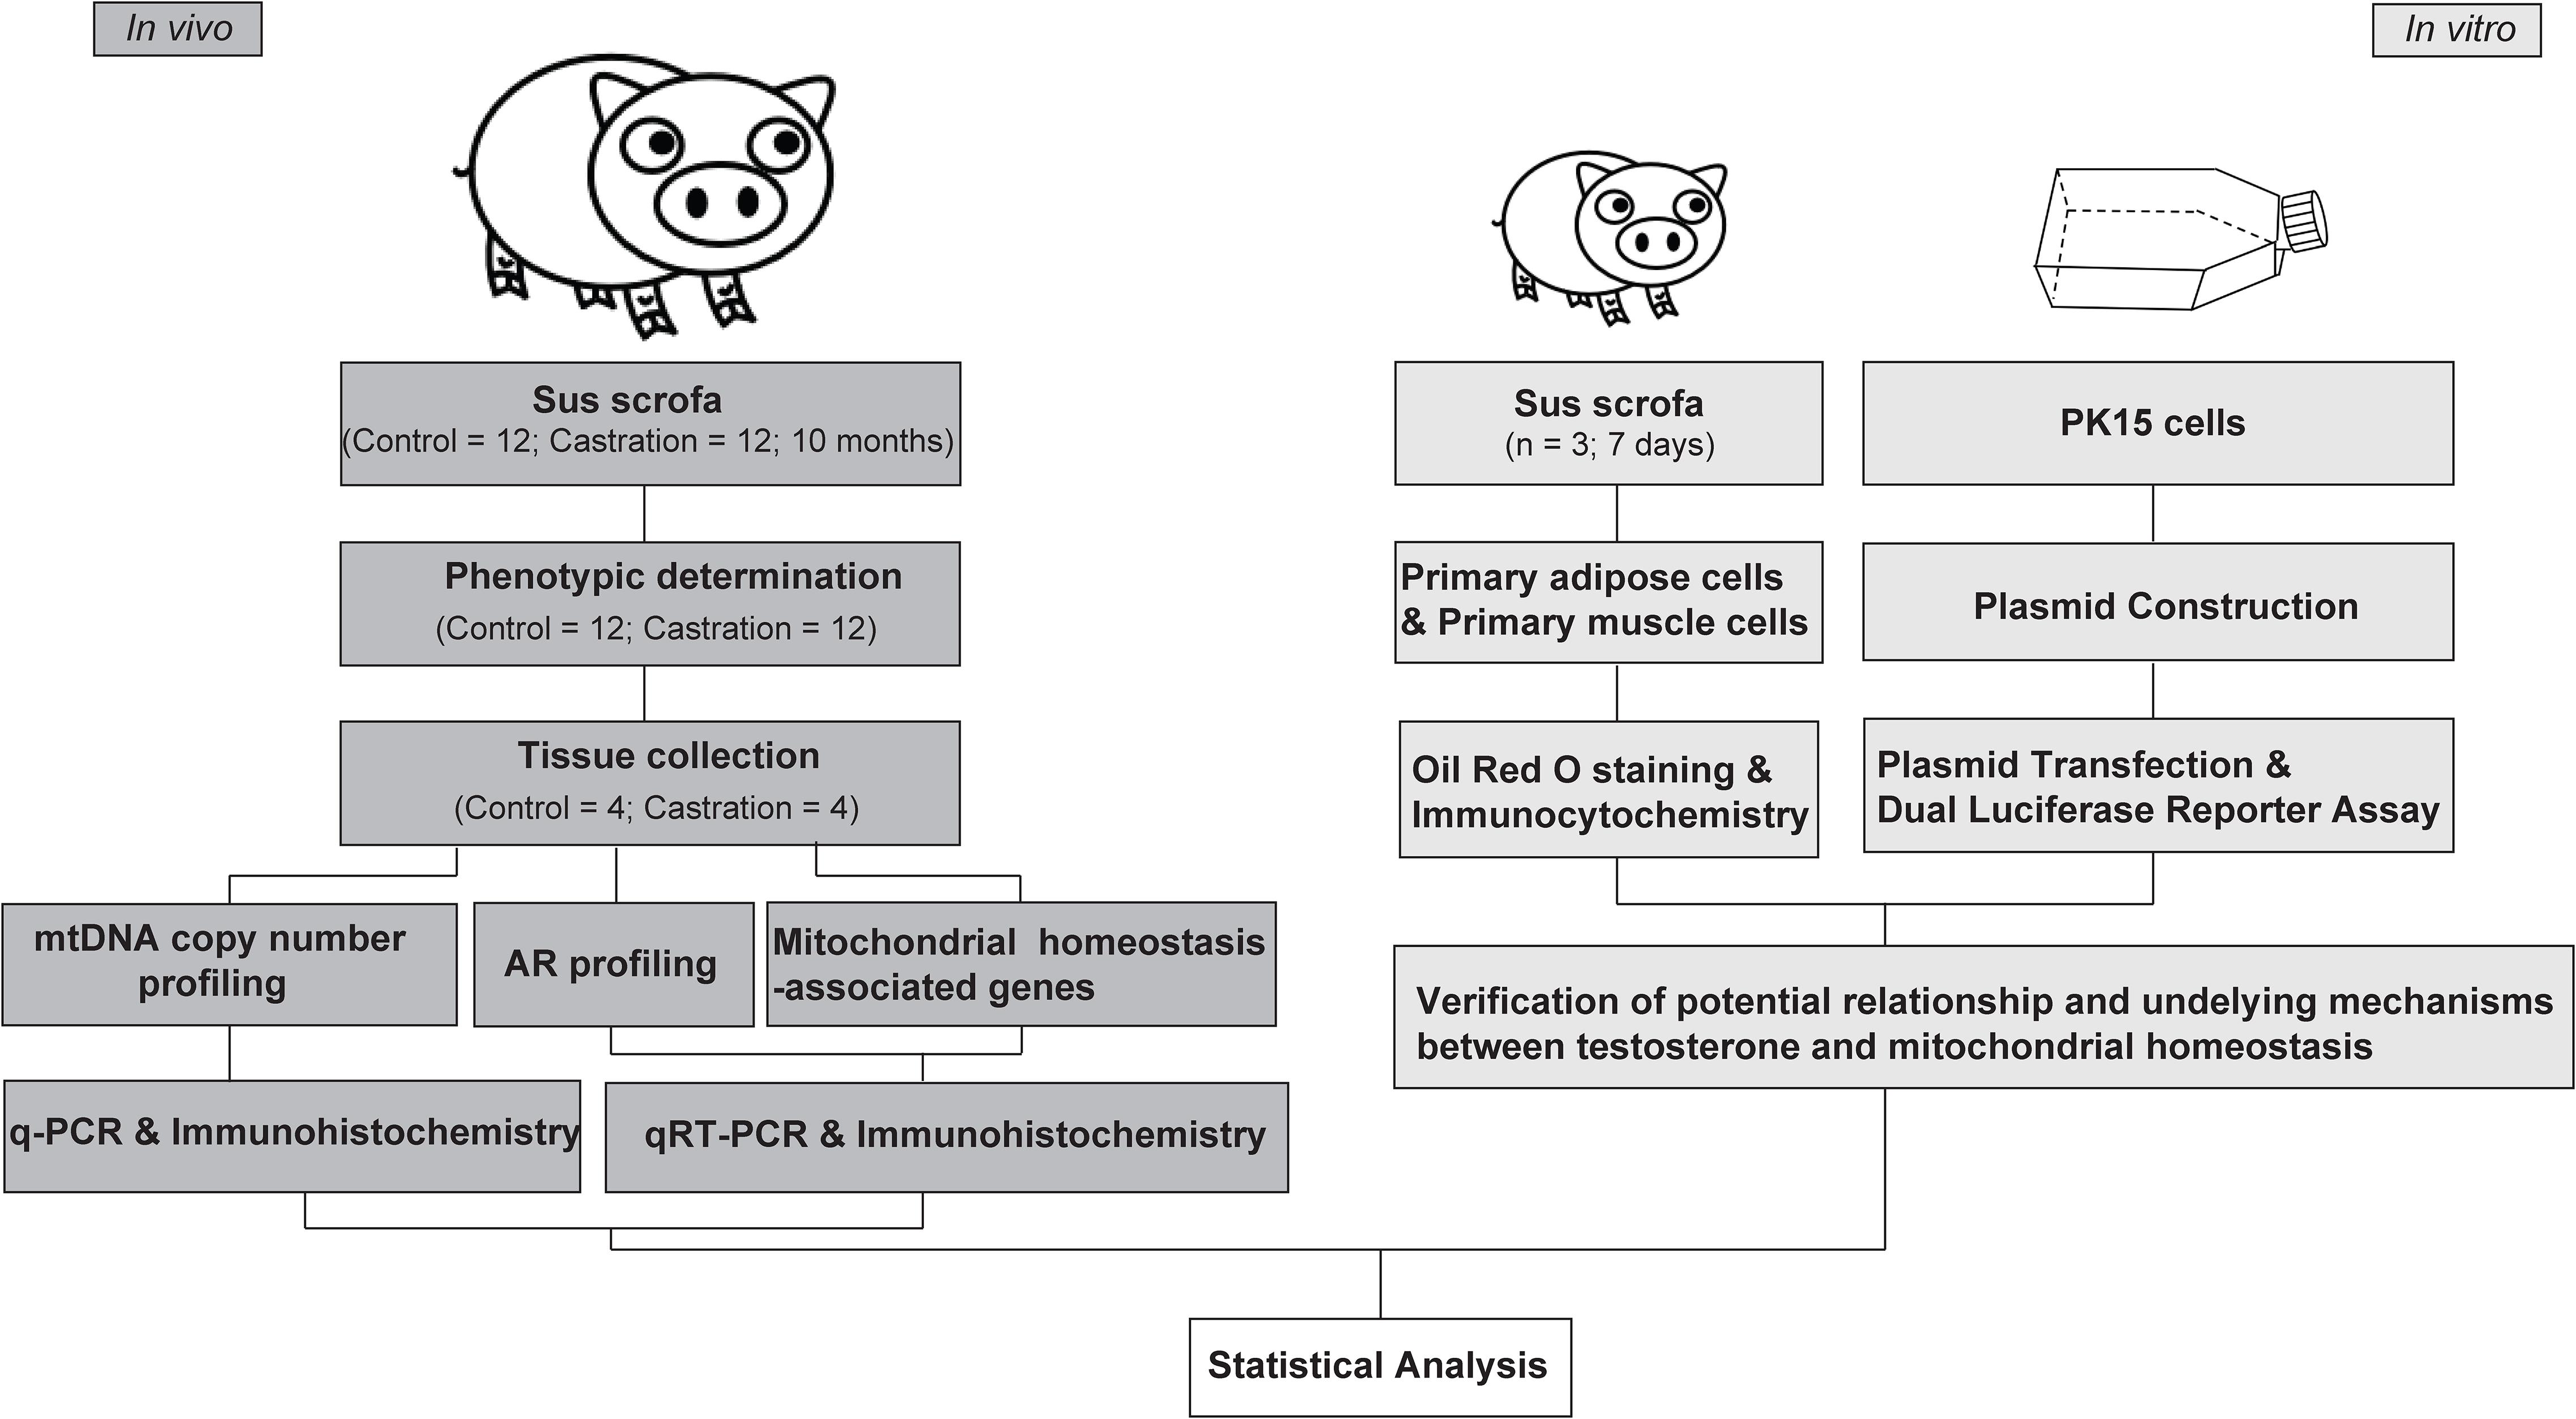
Figure 1. Experimental design overview.
Quantitative Real-Time RT-PCR (qRT-PCR)
Total RNA was extracted from tissues and cells using the RNAiso Plus reagent (TaKaRa, Tokyo, Japan) according to the manufacturer’s instructions. RNA concentration was detected using a NanoDropTM 2000 spectrophotometer (Thermo Scientific, Waltham, MA, United States). Complementary DNA (cDNA) was synthesized using the PrimeScriptTM RT reagent kit with gDNA Eraser (TaKaRa). cDNA was examined by qRT-PCR using the SYBR®Premix Ex TaqTM II (Tli RNaseH Plus) (TaKaRa) with specific primers and the CFX384 Real-Time PCR Detection System (Bio-Rad, Hercules, CA, United States). Data were normalized by GADPH and β-actin mRNA expression for each sample. The relative expression of mRNAs was calculated using the comparative 2-ΔΔCT method. Primer sequences used in this study are shown in Supplementary Table S1; all primers used in this study were synthesized by Tsingke (Chengdu, China).
MtDNA Quantification
We evaluated the mtDNA content relative to nuclear DNA by qRT-PCR as previously described (Miller et al., 2003), using diluted total DNA as a template and primers for ATP synthase F0 subunit 6 (ATP6), NADH dehydrogenase subunit 1 (ND1) and cytochrome c oxidase subunit 1 (COX1) as mitochondrial genes and glucagon (GCG) as a nuclear gene. Twice the ratio of ATP6/COX1/ND1 to single-copy nuclear gene number reflected the mtDNA amount per cell.
Immunohistochemistry
Fixed tissues were dehydrated using a full-automatic dehydrator, paraffin embedded and then sectioned into 5-mm thick samples. First, the dewaxed sections were placed into the dyeing tank with 3% methanol hydrogen peroxide at room temperature for 10 min. The samples were rinsed with PBS three times for 5 min each. The slices were dipped into 0.01 M citrate buffer (pH 6.0) and then heated in the microwave until boiling for 5 min interval; the heating was repeated once more. After cooling, the slice was washed with PBS two times for 5 min each. The sections were then blocked with a blocking serum (ZLI-9021, ZSGB-BIO) at room temperature for 20 min. The sections were incubated with the AR (C-19) antibody (1:100; sc-815, Santa Cruz) at 4°C overnight and then with a secondary antibody (1:250; sp-9001, ZSGB-BIO) for 30 min at 37°C. Samples were rinsed with PBS three times for 5 min each and then processed with the Concentrated DAB kit (K135925C, ZSGB-BIO). Sections were then dehydrated in alcohol, cleared in xylene and mounted in synthetic resin. Mitochondria staining of paraffin tissue sections was carried out using the anti-prohibitin antibody mitochondrial marker (1:100; ab28172, Abcam). The mean density of immunohistochemical staining was measured using Image-Pro Plus (IPP). n = 4 per group; five technical replicates.
Primary Cell Culture
Adipose tissues and muscle tissues samples were immersed in the PBS, supplemented with 100,000 U/L penicillin sodium and 100 mg/L streptomycin sulfate (Hyclone), washed three times and cut in small pieces with scissors, respectively. Adipose tissues were incubated with collagenase I in a shaking bath with 40 rpm speeds at 37°C for 1 h (muscle tissues were incubated for 1.5 h). After incubation, we neutralized the supernatant with an equivalent volume of complete medium that contained DMEM-F12 (Hyclone, Logan, UT, United States), then supplemented with 10% fetal bovine serum (GIBCO, Grand Island, NY, United States), 100,000 U/L penicillin, and 100 mg/L streptomycin (Hyclone). Subsequently, the suspensions were gently sieved through a cell strainer with 70 and 40 μm (Millipore, Billerica, MA, United States), centrifuged (1,000 rpm for 10 min) and discarded to remain the cell sedimentation. Afterward, the cells were washed twice with equivalent volume of PBS by centrifugation, resuspended in complete medium and seeded onto a 6-well culture plates (Corning).
The primary preadipocytes were cultured in DMEM-F12 (Hyclone, Logan, UT, United States) supplemented with 10% FBS and incubated at 37°C in a humid atmosphere of 5% CO2. At 2 days post-confluency (day 0), the medium was replaced with complete medium containing 500 μmol/L 3-isobutyl-1-methylxanthine (Sigma-Aldrich), 1 μmol/L dexamethasone (Sigma-Aldrich) and 1 ug/mL insulin (Sigma-Aldrich). After 2 days (day 2), the medium was changed to the complete medium containing 1 μg/mL insulin. After another 2 days (day 4), the medium was changed to the complete medium, which was then replaced every 2 days. The testosterone (10-7 mol/L) and EPI-001 (10-4mol/L) were added to the medium every change after day 0.
The primary myoblasts were cultured in DMEM-F12 supplemented with 10% FBS and incubated at 37°C in a humid atmosphere of 5% CO2. For differentiation, when cells reached 90% confluence, the medium was exchanged for a differentiation medium containing 2% horse serum (GIBCO, Grand Island, NY, United States). Testosterone (10-7 mol/L) and EPI-001 (10-4mol/L) were soluble in differentiation medium. The medium was changed every other day.
Oil Red O Staining
When differentiated at day 9, adipocytes were stained with Oil Red O (Sigma-Aldrich) to detect lipids. After removing the differentiation medium, cells were gently washed three times with PBS, and fixed in 10% formalin for 30 min. The fixed cells were stained with 0.5% Oil Red O for 1 h at room temperature. After cells were washed three times with PBS again, images were captured by an Olympus IX53 microscope (Olympus, Tokyo, Japan). To measure triglyceride contents, stained cells were eluted with isopropanol for 20 min, and the OD values were detected with a spectrophotometer at a wavelength of 510 nm.
Immunocytochemistry
The differentiated myoblasts were rinsed in PBS three times and washed in 0.3% Triton X-100 for 30 min, followed by blocking at room temperature for 1 h. These cells were incubated in anti-fast-MyHC (ab51263, Abcam) at 4°C overnight. The next day, the cells were incubated with Alexa Fluor®488 secondary antibody (ab150113; Abcam) for 1 h, and the cell nucleuses were stained by DAPI (Beyotime, Shanghai, China). Finally, the cells was imaged using Olympus IX53 microscope (Olympus, Tokyo, Japan) with cell Sens Standard software (v1.16, Olympus Instruments, Tokyo, Japan). Up to six fields of view were captured from each group.
Plasmid Construction
The potential AR binding sites in the TFAM promoter were predicted by JASPAR (Portalescasamar et al., 2010) and PROMO 3.0 (Messeguer et al., 2002). The sequence of the TFAM promoter containing the specific ARE binding sites (wild-type or mutant) was synthesized from TSINGKE (Chengdu, China), cleaved using Sac I/Xho I, and then inserted into the pGL3-basic reporter vector.
Plasmid Transfection and Dual Luciferase Reporter Assay
PK15 cells were seeded in 48-well plates. These cells, with 70–80% confluence, were transfected using Lipofectamine TM 3000 (Invitrogen, Carlsbad, CA, United States). Each well was transfected with 0.2 μg recombinant pGL3 vector and 0.02 μg internal control vector pRL-TK DNA using Lipofectamine TM 3000 (Invitrogen, Grand Island, NY, United States). Cells were collected 48 h after transfection and dual luciferase activity was measured using the Dual-Luciferase Reporter Assay System kit (Promega, Madison, WI, United States), according to the manufacturer’s instructions.
Statistical Analysis
Statistical comparisons were performed with Student’s t-test and one-way analysis of variance with Tukey’s post hoc test to evaluate the statistical significance for comparisons of two groups and multiple groups, respectively, using SPSS 19.0 software (SPSS, Inc., Chicago, IL, United States). Spearman’s rank correlation analysis was used for detecting the relationship between the mitochondrial homoeostasis-associated gene mRNA expression and the mtDNA copy number. Values of P < 0.05 were considered statistically significant. The data were expressed as means ± SD.
Results and Discussion
Establishment of a Testosterone Deficiency Model by Castration in Yorkshire Boars
Testis is an important site for spermatogenesis and secretion of androgen in male mammals (Wang et al., 2009). Testosterone deficiency caused by surgery or drug castration is widely used in animal production (Traish et al., 2003; Bretschneider, 2005) and serves as the main strategy for the clinical treatment of prostate cancer (Snyder et al., 2016). In this study, we established a testosterone deficiency model by prepubertal castration of Yorkshire boars at age of 7 days to investigate the effects of testosterone on mitochondrial homoeostasis. Interestingly, the body weight of the castrated pig obviously increased (Figure 2A). As shown in Figure 2B, prepubertal castration markedly resulted in a decrease of serum testosterone compared with the control in adult Yorkshire boars (10 months old) (P < 0.01). Castration also caused severe dysplasia of the accessory glands, including seminal vesicles [visceral index: 14.15 ± 2.06 versus 1.56 ± 0.30 (% × 10-2), P < 0.01; length: 18.01 ± 1.06 versus 6.05 ± 0.70 cm, P < 0.001; width: 13.73 ± 0.86 versus 6.95 ± 0.63 cm, P < 0.001], bulb urethral glands [visceral index: 8.66 ± 1.16 versus 0.18 ± 0.05 (% × 10-2), P < 0.01; length: 18.29 ± 1.25 versus 5.50 ± 0.66 cm, P < 0.001; width: 5.66 ± 0.75 versus 2.12 ± 0.23 cm, P < 0.01] and prostate [visceral index: 0.67 ± 0.16 versus 0.05 ± 0.01 (% × 10-2), P < 0.01; length: 5.67 ± 0.35 versus 1.92 ± 0.18 cm, P < 0.001; width: 4.71 ± 0.59 versus 1.48 ± 0.18 cm, P < 0.001] (Figures 2C–E). These results were consistent with previous reports that testosterone deficiency caused by castration led to reproductive system maldevelopment (O’Hara et al., 2011) and indicated the successful establishment of a testosterone deficiency model in Yorkshire boars.
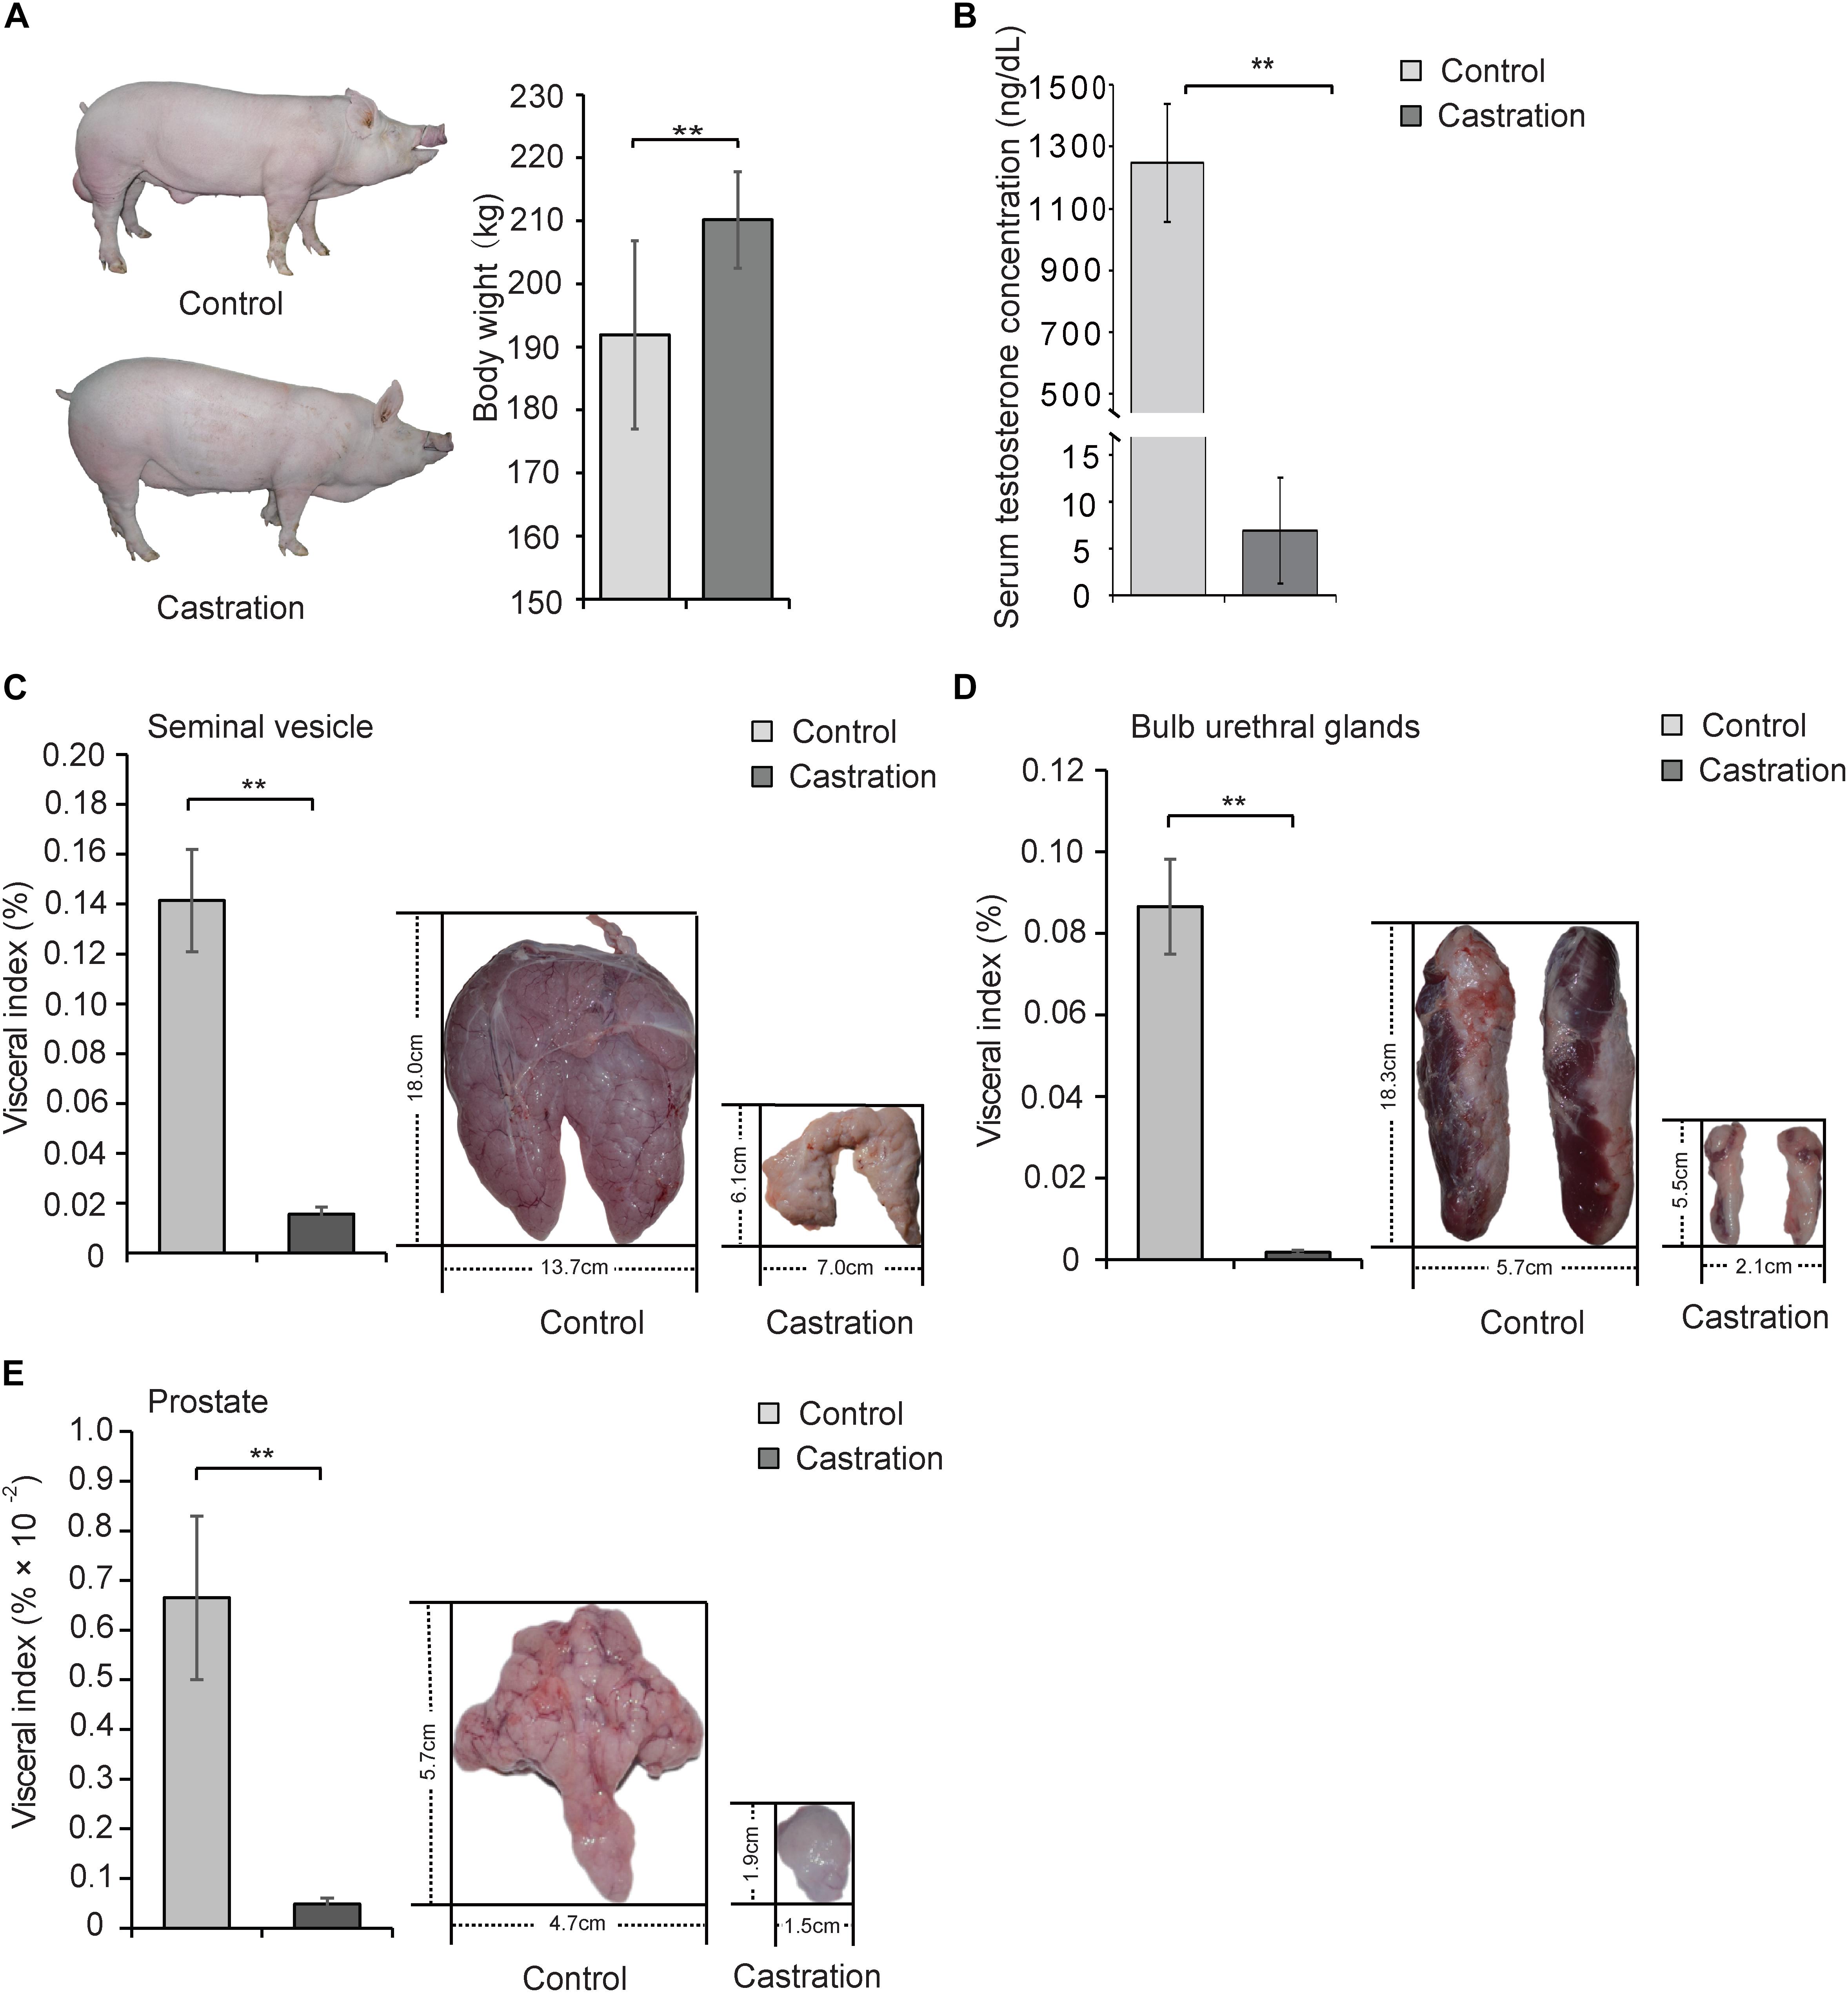
Figure 2. Prepubertal castration induced the decrease of serum testosterone and dysplasia of the accessory glands in adult Yorkshire boars. Castrated and control Yorkshire boars were established at 7 days old as described in Section “Materials and Methods” and the following parameters were determined in adult pigs (10 months old): (A) Body weight of control and castration. (B) Serum testosterone level and the visceral index (left panel) and size (right panel) of (C) seminal vesicle, (D) bulb urethral glands, and (E) prostate tissue. All data are expressed as means ± SD, n = 12 in each group. Student’s t-test, ∗∗P < 0.01.
Testosterone Deficiency Alters mtDNA Copy Number Pattern in Various Tissues
The amount of mtDNA is closely related to the level of energy metabolism in almost all cells and shows different distribution patterns in various tissues. For example, heart and skeletal muscle show a high energy demand, and each of these cells contain on average 10s of 1000s of mtDNA copies (Miller et al., 2003); in contrast, only a few 100 mtDNA copies are present in skin cells (García-Rodríguez, 2007). To examine the tissue expression distribution of mtDNA copy numbers in wild-type pigs, we determined mtDNA copy number as described in Section “Materials and Methods” by performing qRT-PCR of three mitochondria-specific genes (ATP6, ND1, and COX1) in five categories of tissue types, including adipose tissues, muscle tissues, endocrine glands, immunologic tissues, and other major organs. As shown in Figure 3A, we found that mtDNA copy numbers in muscle tissues were higher than that of adipose tissues (P < 0.05), followed by endocrine glands and immunologic tissues, indicating that muscle tissues with higher energy metabolism require more mtDNA copy numbers. Interestingly, adipose tissues showed similar mtDNA copy numbers as endocrine glands, which is in line with recent evidence that adipose tissues have endocrine function and can secrete numerous bioactive factors, termed adipokines (Kershaw and Flier, 2004; Waki and Tontonoz, 2007; Wozniak et al., 2009). Additionally, we also observed differential expression of mtDNA copy numbers within each tissue type, which indicated a tissue-specific distribution pattern of mtDNA copy number.
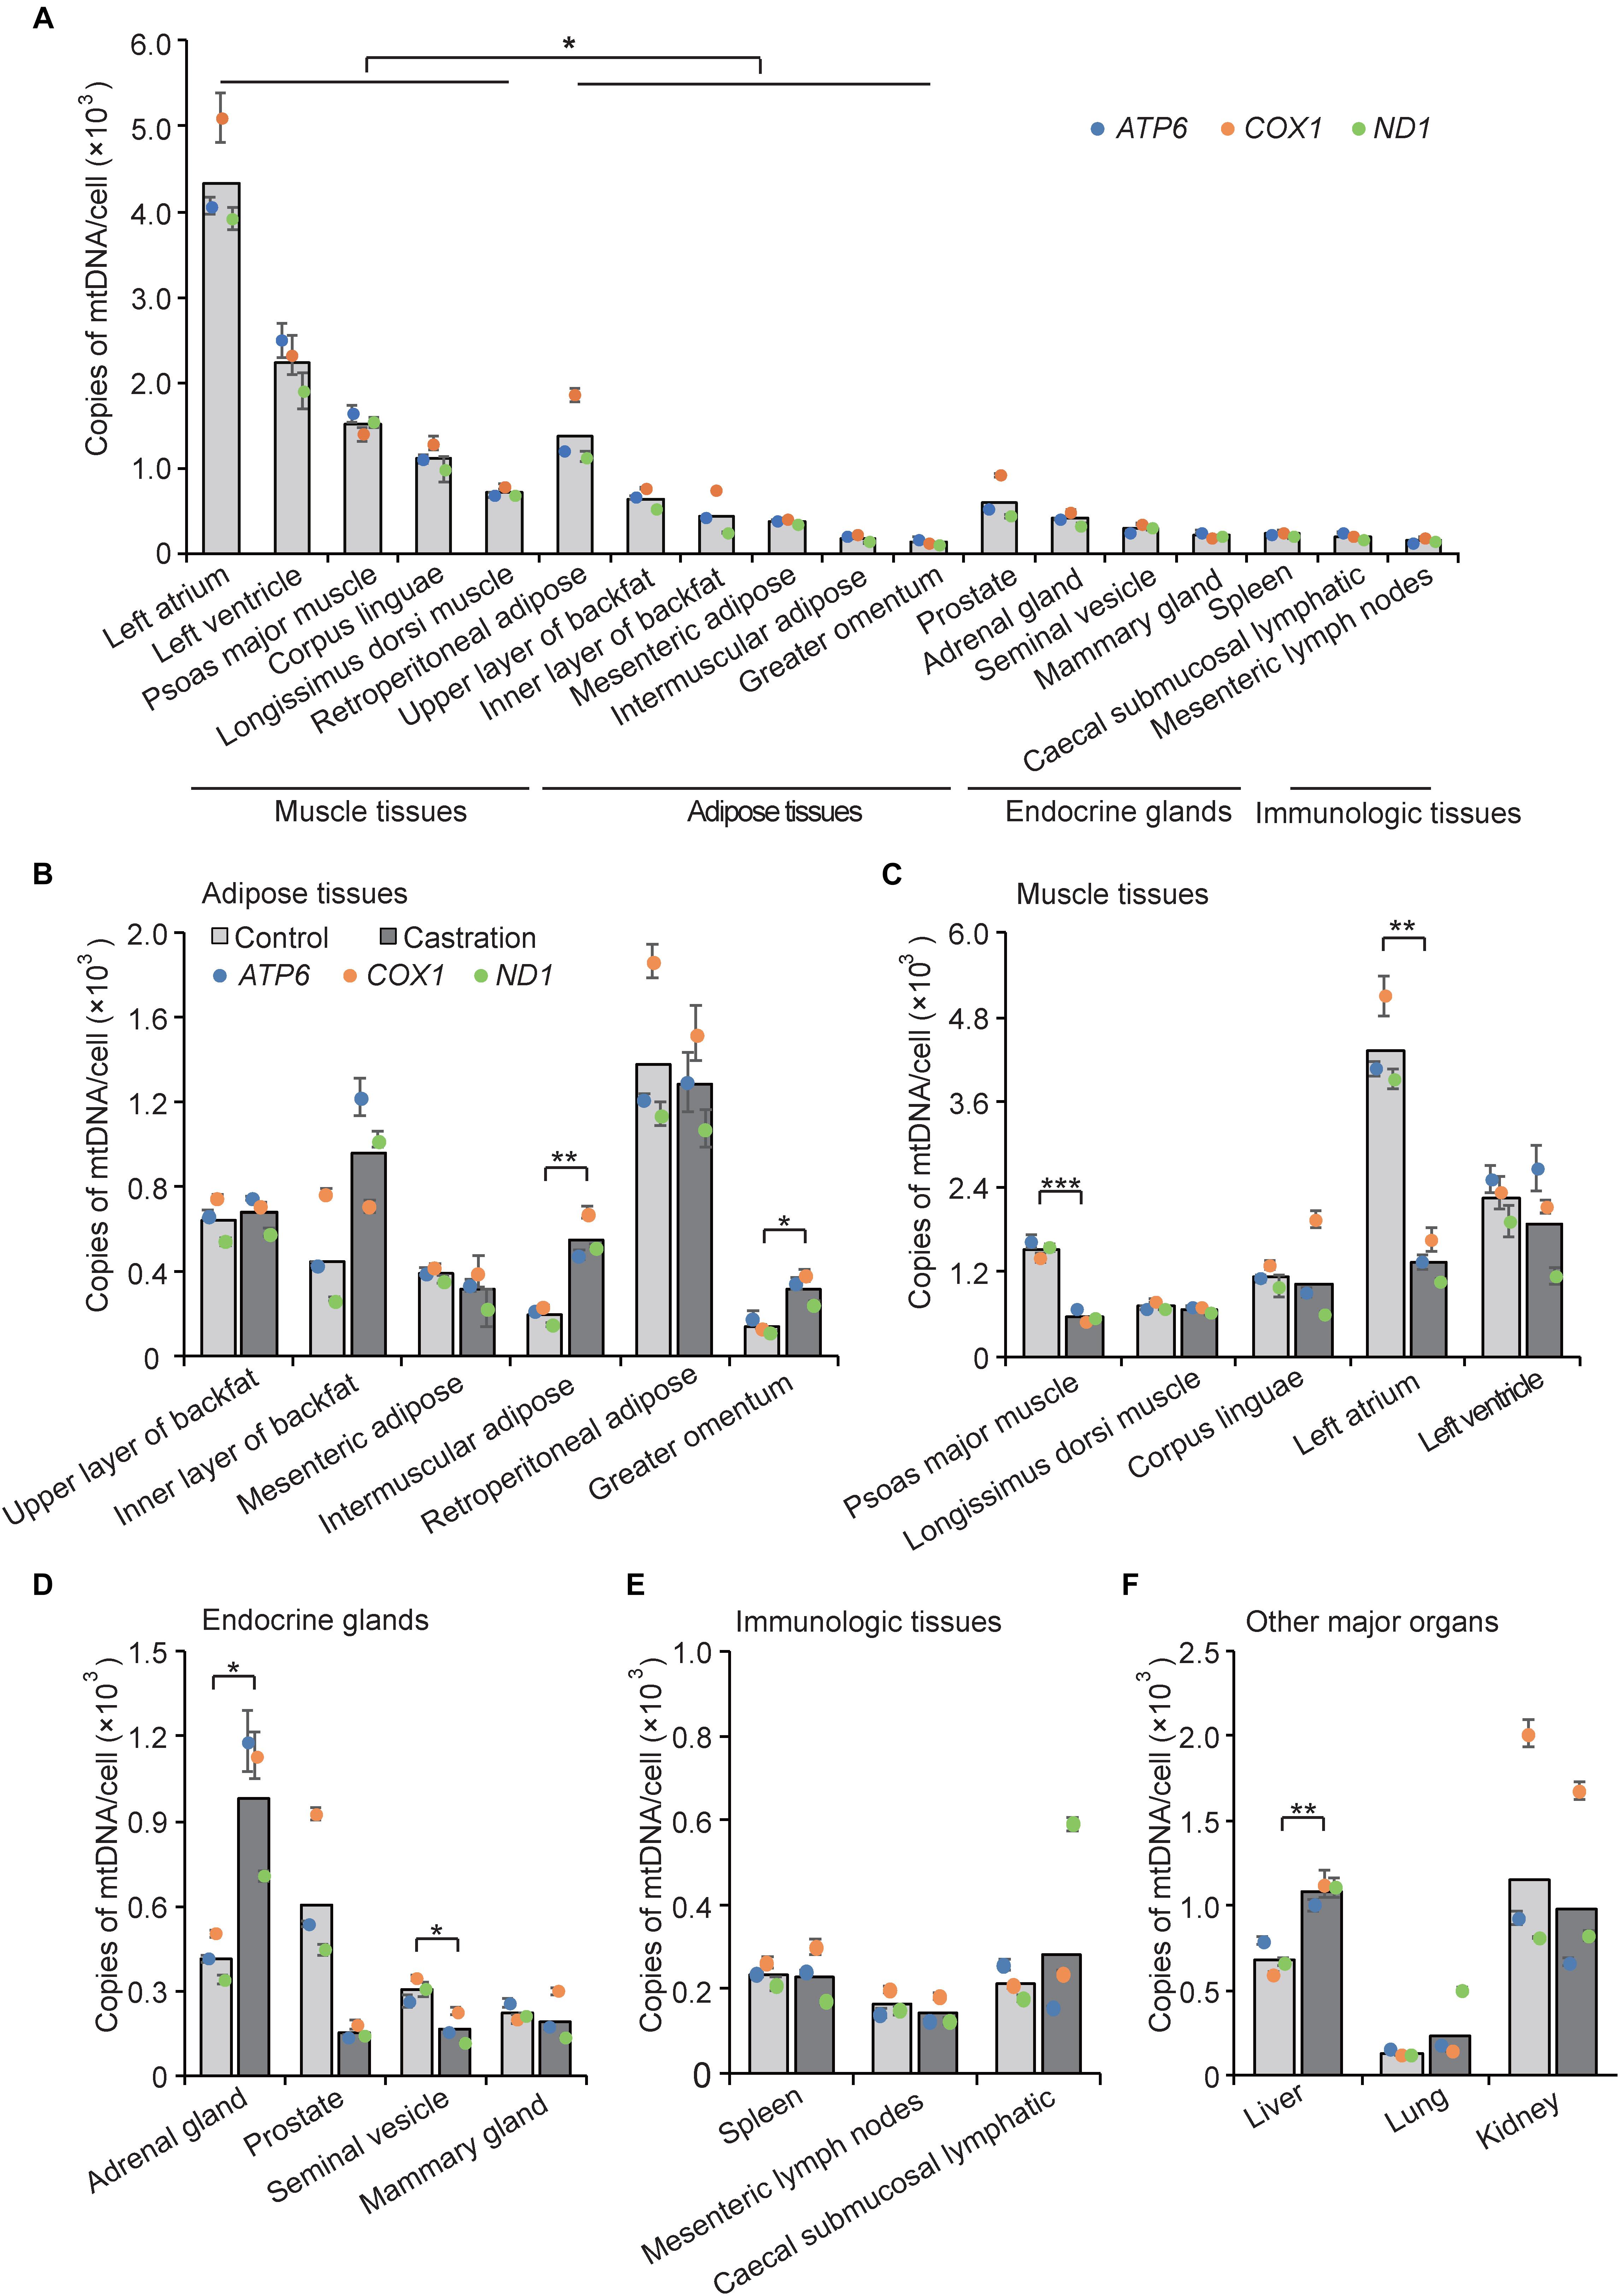
Figure 3. mtDNA copy number was determined by qRT-PCR analysis of three mitochondria-specific genes (ATP6, COX1, and ND1). Twice the ratio of ATP6/COX1/ND1 to single-copy nuclear gene number reflected the relative mtDNA content, and the solid bars represent mean values of mtDNA contents individually calculated by ATP6, COX1, and ND1. (A) Tissue profiling of mtDNA copy numbers in five categories of tissues in wild-type pigs. mtDNA copy numbers per cell in adipose tissues (B), muscle tissues (C), endocrine glands (D), immunologic tissues (E), and other major organs (F) in control and castrated pigs. All data are expressed as means ± SD, n = 4 in each group. Comparison between control and castration groups was performed by Student’s t-test, ∗P < 0.05, ∗∗P < 0.01, ∗∗∗P < 0.001.
We next examined mtDNA copy numbers in the testosterone deficiency pigs and found that castration resulted in large differences of mtDNA copy numbers in various tissues compared with the control pigs. MtDNA copy numbers were increased in adipose tissues in castrated pigs, especially in intermuscular adipose (fold-change = 2.84; P < 0.01) and greater omentum (fold-change = 2.29; P < 0.05), whereas that of mesenteric adipose and retroperitoneal adipose showed the opposite trend indistinctively (fold-change = 0.80 and fold-change = 0.93, respectively; both P > 0.05) (Figure 3B). Castration caused a decrease of mtDNA copy numbers in muscle tissues especially psoas major muscle (fold-change = 0.37; P < 0.001) and left atrium (fold-change = 0.31; P < 0.01) (Figure 3C). These results were consistent with studies showing that testosterone increased the protein expression level of PGC1α and promoted mitochondrial biogenesis in skeletal muscle (Usui et al., 2014), while it inhibited the proliferation of mitochondria in white adipocytes in vitro (Capllonchamer et al., 2014). The mtDNA copy numbers in some endocrine glands were also lower in the castration group than the control, with a significant decrease in seminal vesicle (fold-change = 0.54; P < 0.05) and a decreasing trend in prostate and mammary gland. Notably, adrenal glands (fold-change = 2.37; P < 0.05) showed a marked increase of mtDNA copy number after castration (Figure 3D), which might suggest that castration induced compensatory secretion of testosterone in adrenal gland, accompanied with the increase of mtDNA copy numbers, to ensure energy supply. Moreover, there was no obvious change in mtDNA copy numbers between castration and control pigs in the immunologic tissues (Figure 3E), suggesting that the immunologic tissues may employ some compensatory mechanism to maintain mitochondrial function (Walker et al., 2014) under castration treatment. Interestingly, mtDNA copy number in liver showed a significant increase in the castration group (fold-change = 1.59; P < 0.01) (Figure 3F). Mitochondria play an important role in lipid oxidation in hepatocytes, and a previous study showed that the accumulation of oxidative damage caused by castration triggers a compensatory increase of mtDNA copy number (Kamfar et al., 2016). Taken together, the tissue-specific pattern of mtDNA copy numbers shown by these results implied that tissues with high energy demand are often associated with higher mtDNA copy numbers to coordinate the energy metabolism of the entire body, and testosterone modulated the tissue-specific distribution of mtDNA copy numbers.
We also performed immunohistochemistry to assess mtDNA localization and quantity using a specific anti-prohibitin antibody (a specific mitochondrial marker) for 18 representative tissues (Figure 4A and Supplementary Figure S1). We then analyzed the integrated optical density (IOD) (see more details in Supplementary Table S2) and the results showed a high correlation between mitochondrial staining and qRT-PCR results (Spearman’s r = 0.759; P < 0.001) (Figure 4B).
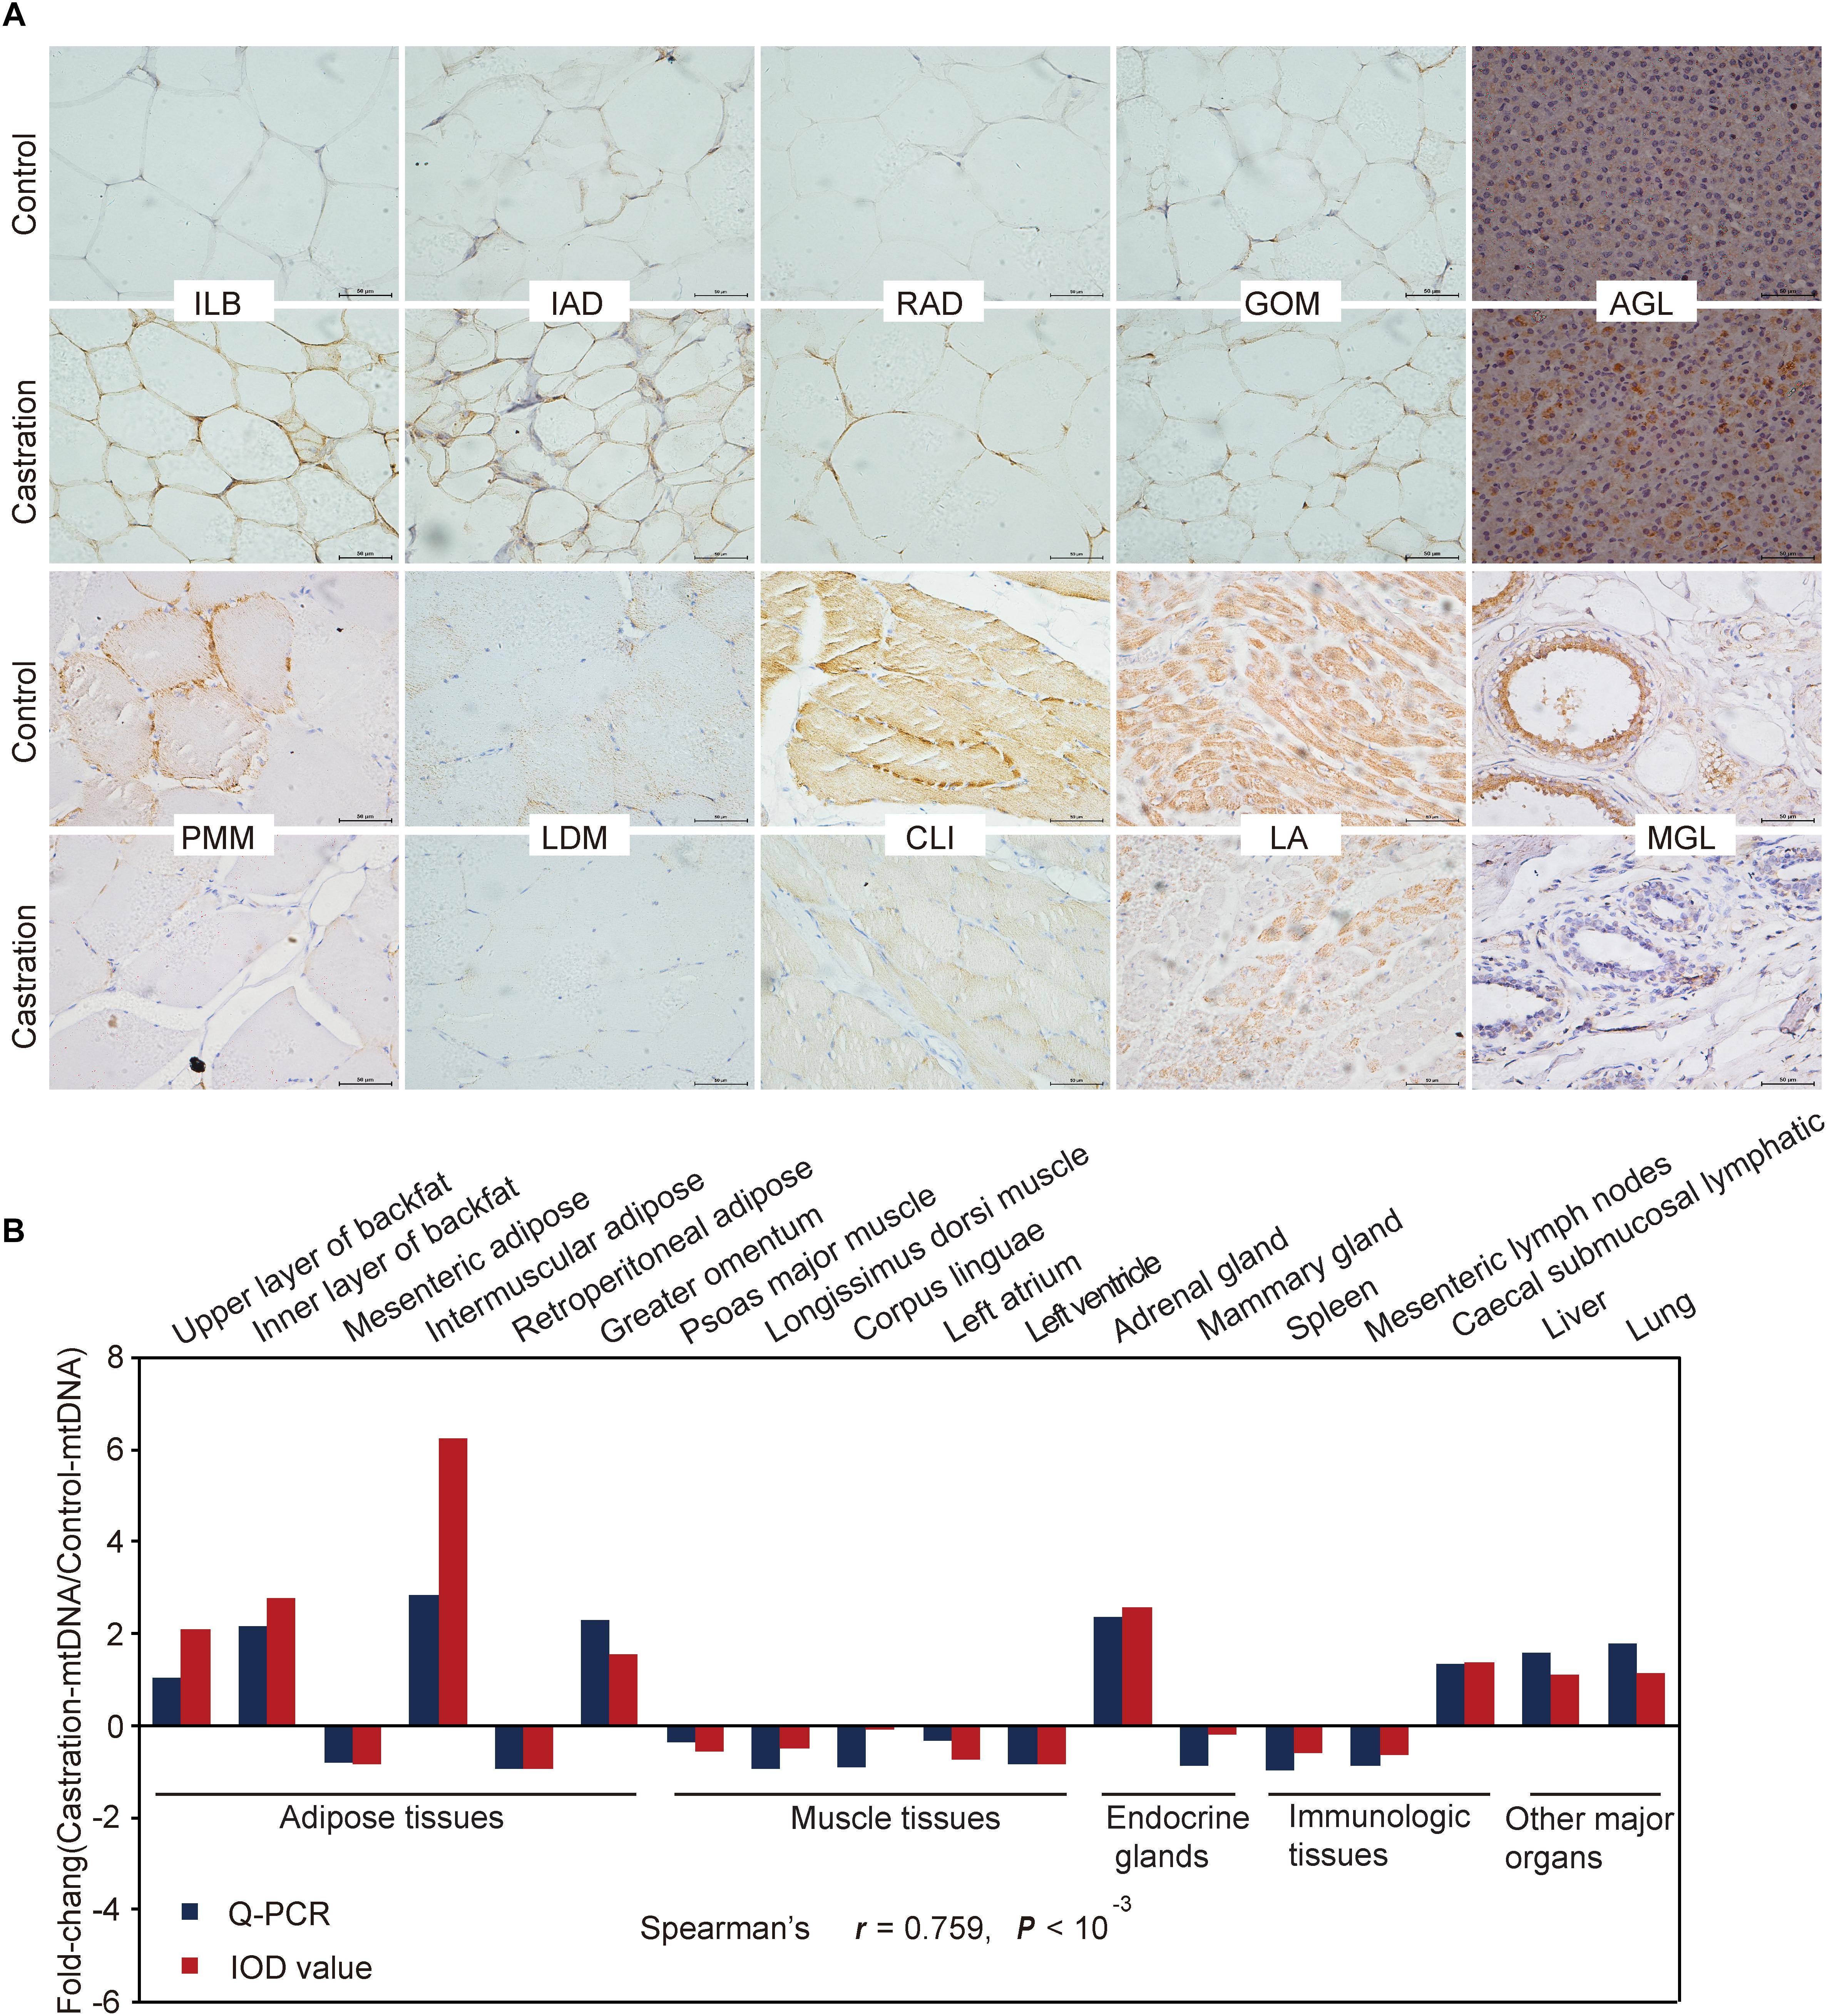
Figure 4. Immunohistochemical and correlation analysis between mitochondrial staining and qRT-PCR results of mtDNA. (A) Immunohistochemical analysis for 10 representative tissues using an anti-prohibitin antibody. Scale bars: 50 μm; 400× magnification. ILB, inner layer of backfat; IAD, intermuscular adipose; RAD, retroperitoneal adipose; GOM, greater omentum; AGL, adrenal gland; PMM, psoas major muscle; LDM, longissimus dorsi muscle; CLI, corpus linguae; LA, left atrium; MGL, mammary gland. (B) Fold change of mtDNA expression in tissues based on Spearman’s rank correlation. The relative expression levels were measured by qRT-PCR and IOD. n = 4 in each group.
Comprehensive Effect of Testosterone Deficiency on Mitochondrial Biogenesis
Our results showed that testosterone deficiency induced dramatic changes in mtDNA copy numbers in different tissues. mtDNA copy number is regulated by many factors, including mitochondrial biogenesis and mitochondrial autophagy (Gaziev et al., 2014; Santos et al., 2014). The dynamic balance of mitochondrial biogenesis and mitochondrial autophagy together determines the number of mitochondria (Santos et al., 2014). Thus, we next evaluated the expression of mitochondrial biogenesis-associated genes (PGC1α and TFAM) and mitochondrial autophagy-associated genes (PRKN, Bnip3, Pink1, and ATG7) using qRT-PCR analysis. Hierarchical clustering based on the expression profiles of these genes, that were co-expressed in all tissues of control pigs, showed that the six adipose tissues were tightly clustered into a subgroup and were clearly distinct from the three muscle tissues (Figure 5A). This significant distance in hierarchical clustering might reflect, at least in part, the physiological differences between adipose tissues and muscle tissues, for example, their functional and metabolic differences (Gondret et al., 2008). Interestingly, the mammary gland was clustered into the cluster of adipose tissues, which might attribute to the large amount of adipose tissues in the mammary glands (Santander et al., 2015). However, the expression pattern of mitochondrial homeostasis-associated genes was disrupted after castration (Figure 5B), which indicated that castration-induced testosterone deficiency dramatically altered the patterns of mtDNA copy number by modulating the mitochondrial homeostasis.
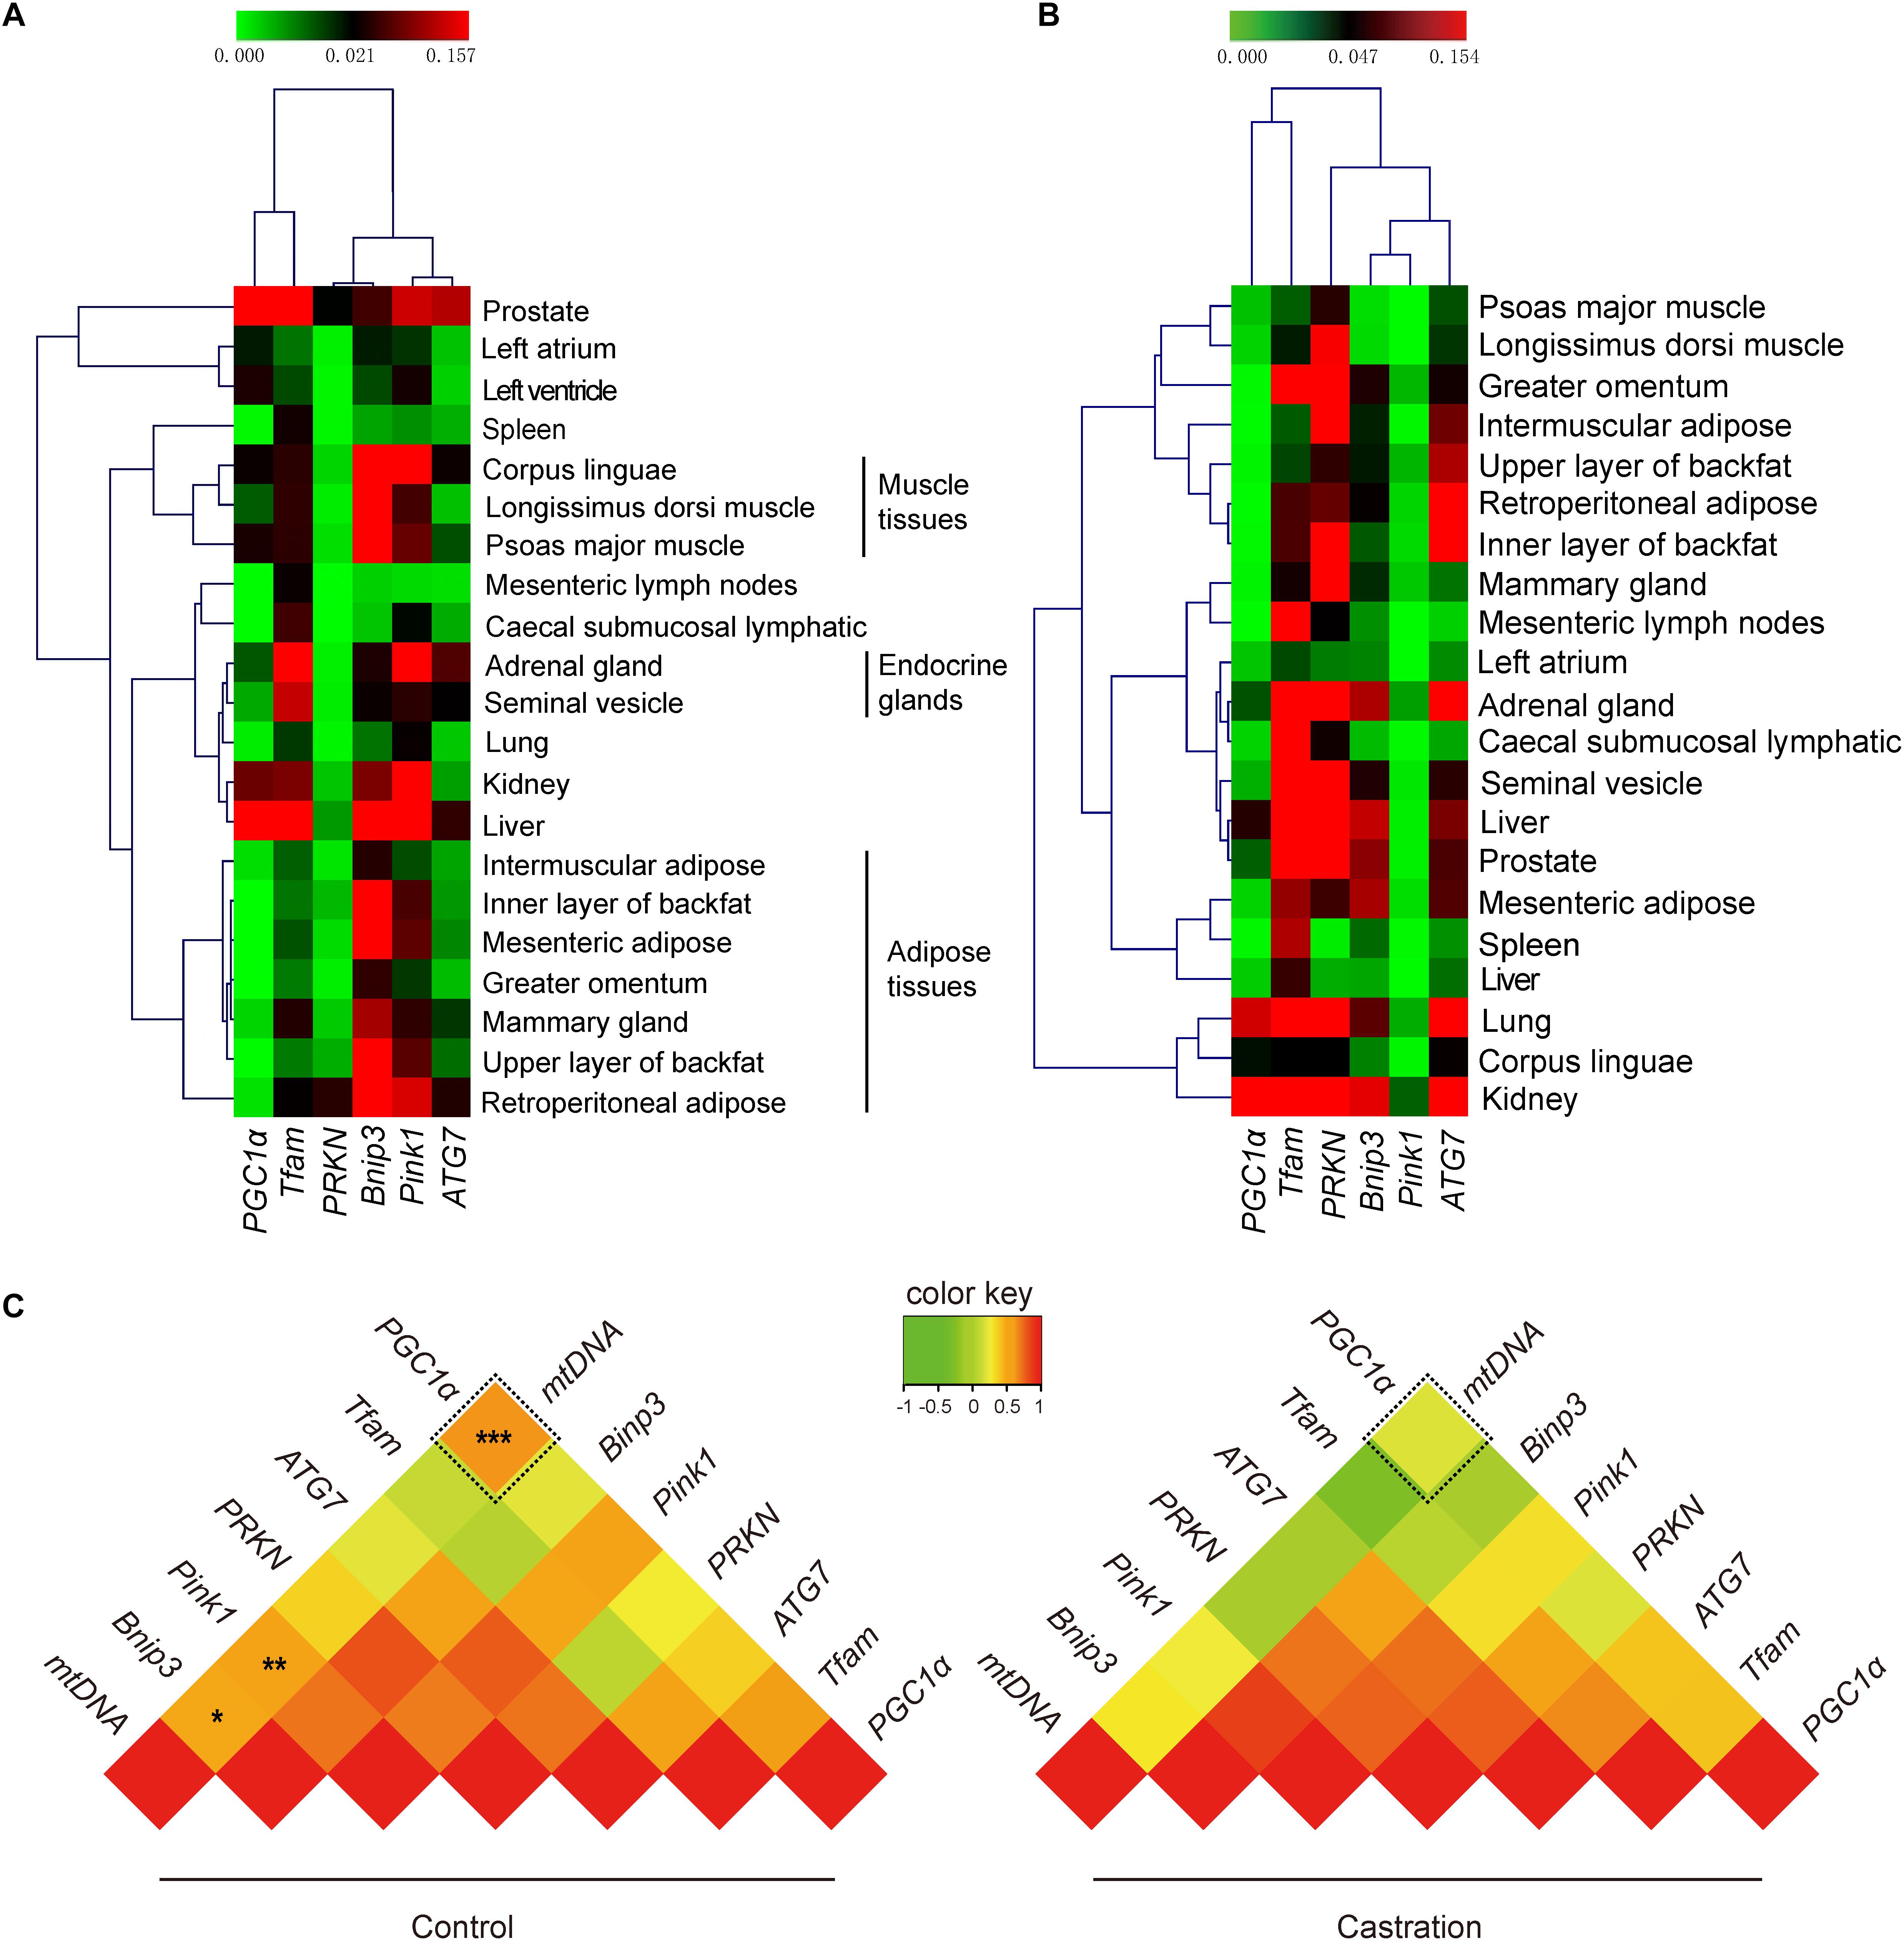
Figure 5. Tissue expression profiling of mitochondrial homeostasis-associated genes. The mRNA expression of PGC1a, TFAM, ATG7, PRKN, Pink1, and Bnip3 and mtDNA copy numbers in various tissues. Hierarchical clustering analysis for the mRNA expression of mitochondrial biogenesis-associated genes in 21 tissues in (A) control pigs and (B) castrated pigs. (C) Correlation analysis of mitochondrial biogenesis and mitochondrial autophagy-associated genes with mtDNA copy number. Values represent the correlation coefficient (r) based on Spearman’s rank correlation analysis. All data are expressed as means ± SD, n = 4 in each group. Tukey’s post hoc test, ∗P < 0.05, ∗P < 0.01, ∗∗∗P < 0.001.
We next performed Spearman’s rank correlation analysis between mtDNA copy numbers and mitochondrial homeostasis-associated genes to further investigate the mechanism as to how the testosterone deficiency affects mitochondrial homeostasis. As shown in Figure 5C, mtDNA copy numbers significantly correlated with PGC1α (r = 0.636; P < 0.001), Pink1 (r = 0.531; P < 0. 01) and Bnip3 (r = 0.487; P < 0.05) in control pigs, whereas this correlation was significantly weakened after castration (PGC1α, r = 0.200, P > 0.05; Pink1, r = 0.266, P > 0.05; Bnip3, r = 0.288, P > 0.05). Notably, the fold change in correlation coefficient of PGC1α (fold-change = 3.18) was higher than that of Pink1 (fold-change = 2.00) and Bnip3 (fold-change = 1.69), which indicated that testosterone deficiency more significantly weakened the effects of PGC1α on mitochondrial biogenesis (see more details in Supplementary Table S3). Together, these results suggested that testosterone deficiency affected the mtDNA copy numbers by modulating mitochondrial homeostasis-associated genes, particularly in mitochondrial biogenesis, which may be through weakening the links between PGC1a and mtDNA copy numbers.
The Potential Effect of AR on Mitochondrial Biogenesis
AR is a DNA-binding transcription factor which can be activated by binding androgenic hormones and is widely distributed in many types of cells. Testosterone exerts its physiological effects mainly through an AR-dependent process. Given that castration-induced testosterone deficiency resulted in the change of correlation between PGC1a and mtDNA copy number, we considered that AR might mediate this process. To examine this possibility, we first investigated the expression pattern of AR in various tissues in control pigs. As shown in Figure 6A, AR was highly expressed in many endocrine glands, especially in the gonads, followed by adipose tissues, and was relatively low in muscle tissues and immunologic tissues; these results indicated tissue-specific expression of AR. These results suggested that testosterone plays a crucial role in endocrine glands development and maturity, which is compatible with the higher expression of AR observed in our results.
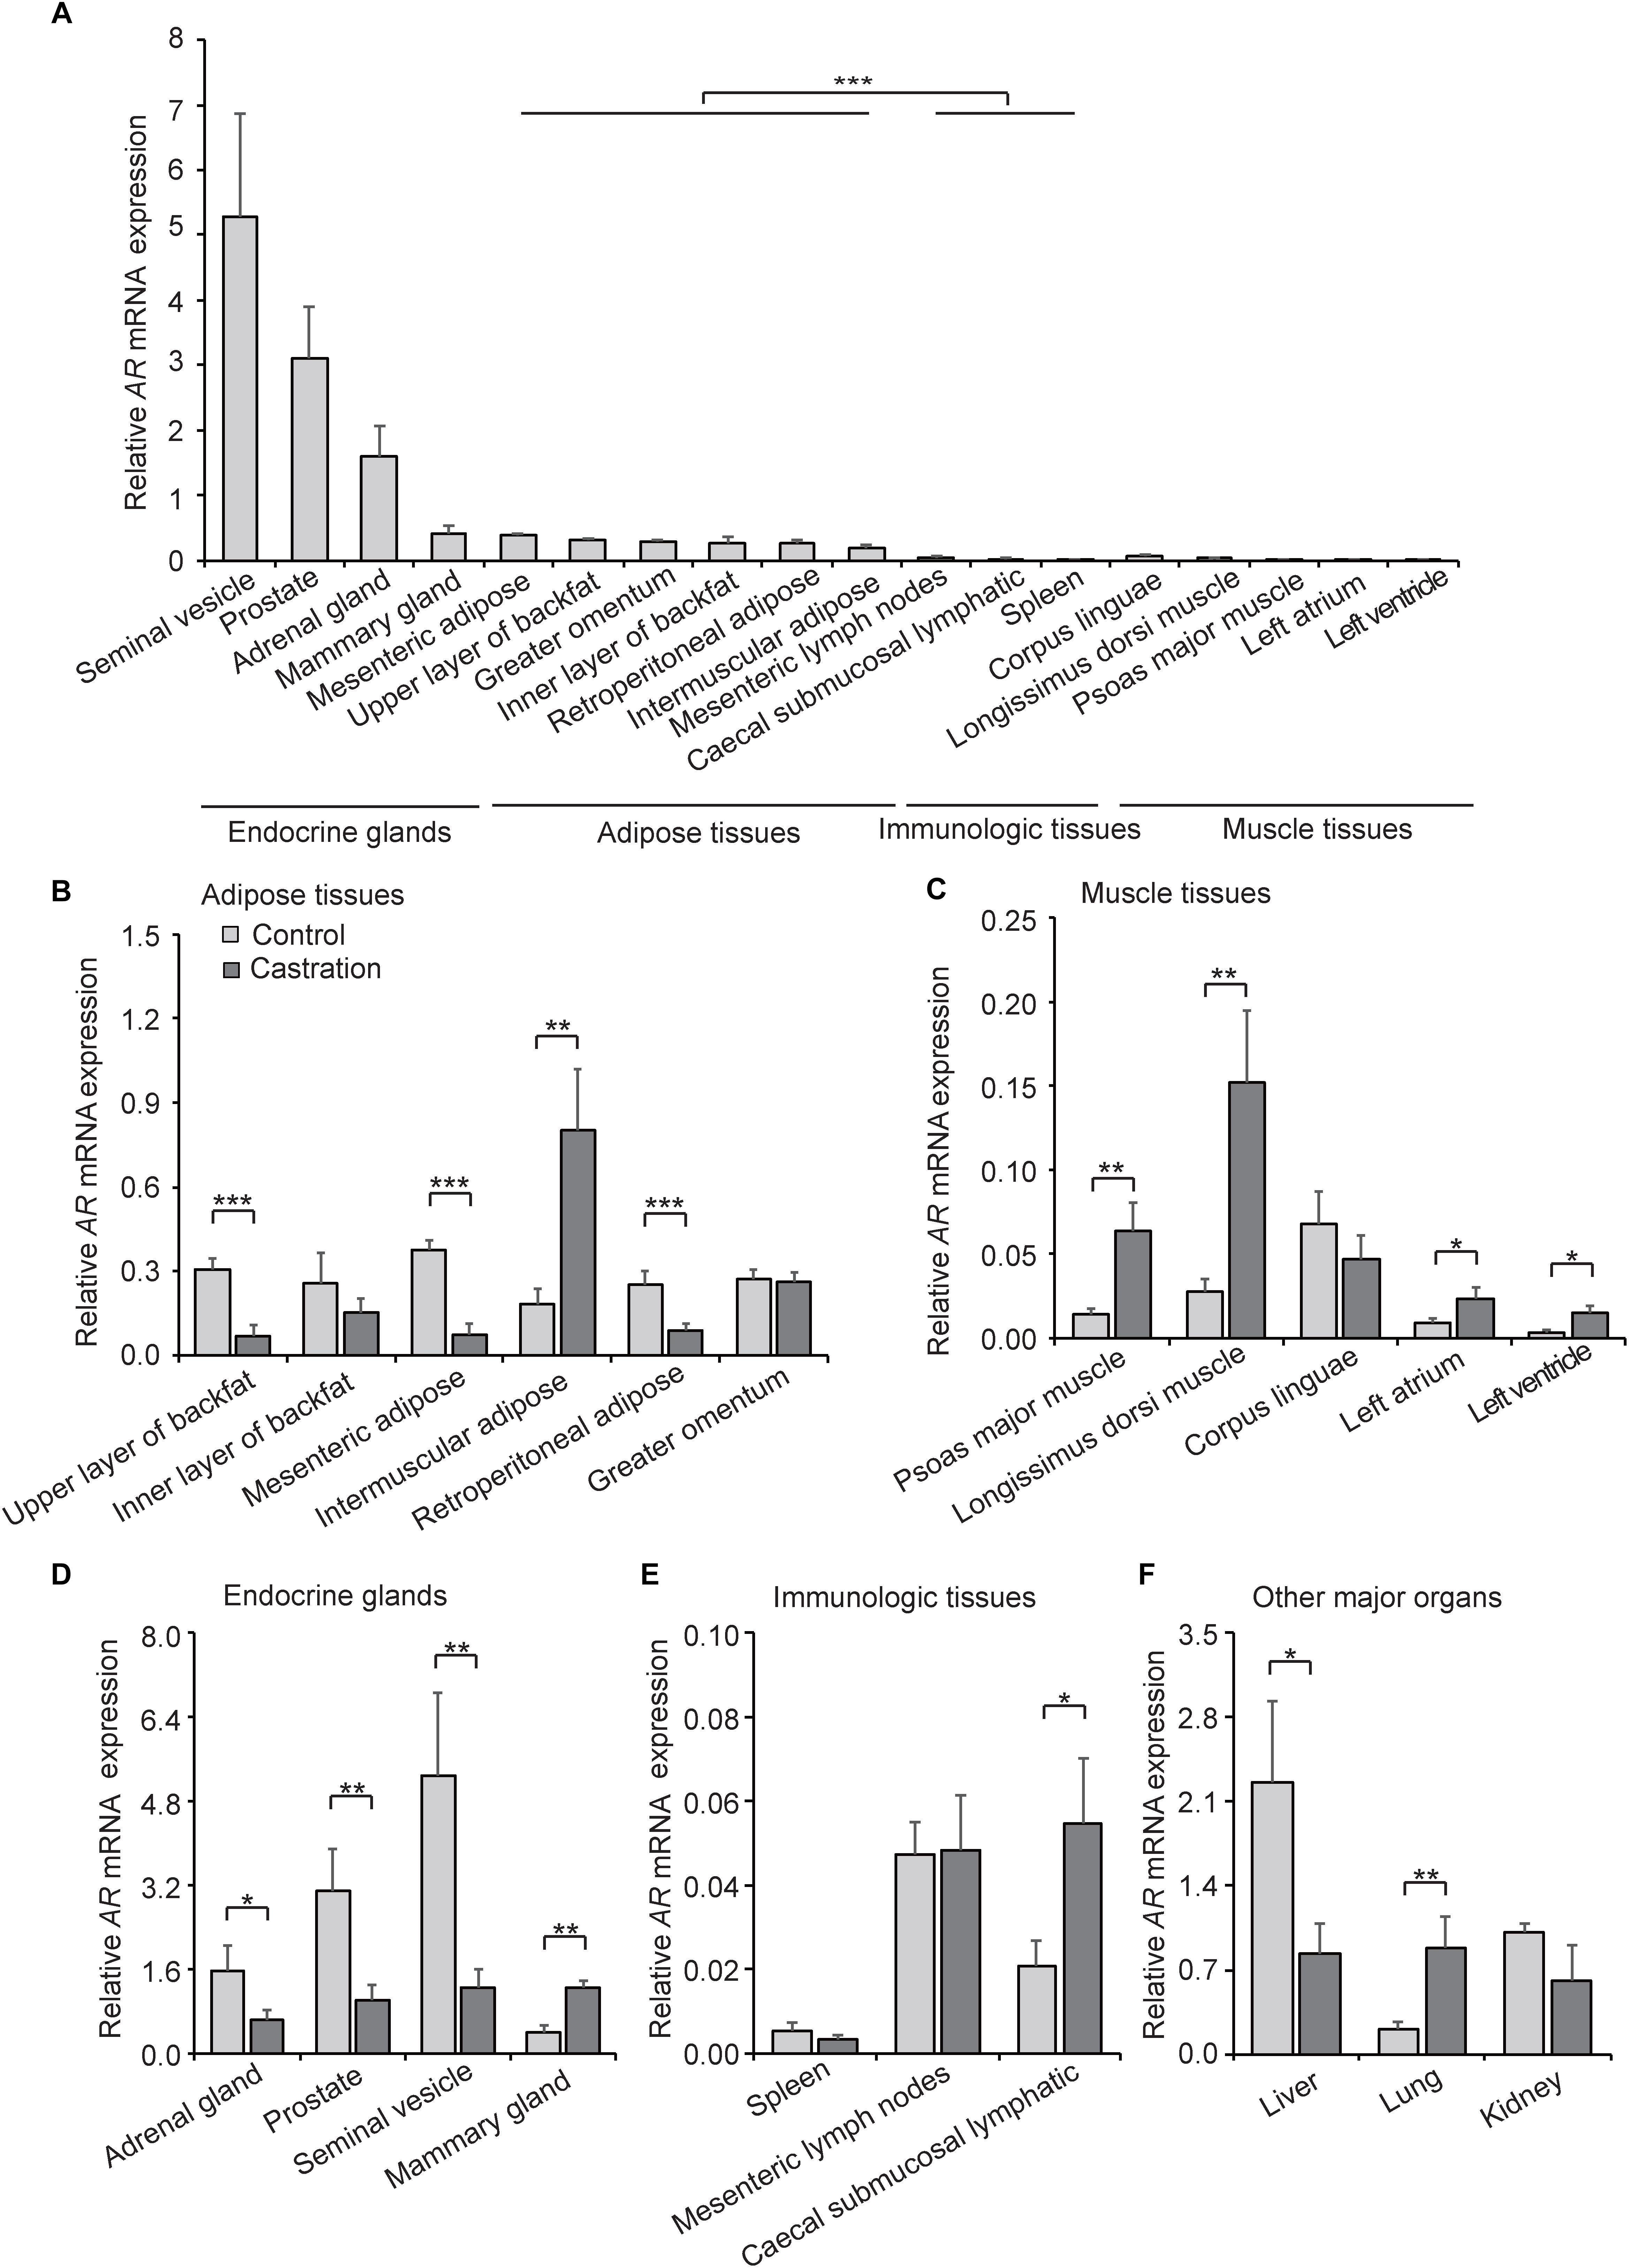
Figure 6. AR expression in various tissues. (A) Tissue expression profiling of AR in tissues from wild-type pigs. (B) AR mRNA expression in adipose tissues in control and castration pigs. (C) AR mRNA expression of muscle tissues in control and castration pigs. (D) AR mRNA expression of endocrine glands in control and castration pigs. (E) AR mRNA expression of immunologic tissues in control and castration pigs. (F) AR mRNA expression of other major organs in control and castration pigs. All data are expressed as means ± SD, n = 4 in each group. Student’s t-test,∗P < 0.05, ∗∗P < 0.01, ∗∗∗P < 0.001.
We next compared the expression pattern of AR in the castration group with the control. An overall decrease of AR expression in adipose tissues in the castration pigs was detected, especially in the upper layer of backfat (fold-change = 0.22; P < 0.01), mesenteric adipose (fold-change = 0.19; P < 0.01) and retroperitoneal adipose (fold-change = 0.35; P < 0.01), whereas the AR expression of intermuscular adipose increased significantly after castration (fold-change = 4.40; P < 0.01) (Figure 6B). In muscle tissues, the expression of AR was higher in castration pigs than the control, including psoas major muscle (fold-change = 4.51; P < 0.01), longissimus dorsi muscle (fold-change = 5.52; P < 0.01), left atrium (fold-change = 2.72; P < 0.05) and left ventricle (fold-change = 4.08; P < 0.05) (Figure 6C). Moreover, the expression levels of AR in endocrine glands, including adrenal gland (fold-change = 0.41; P < 0.05), prostate (fold-change = 0.33; P < 0.01) and seminal vesicle (fold-change = 0.24; P < 0.01), were lower in castration pigs compared with the control. On the contrary, the mammary gland (fold-change = 3.08; P < 0.01) appeared to increase significantly in the castration group (Figure 6D). Previous studies showed that the testosterone reduction leads to gynecomastia (Sansone et al., 2017) and AR-mediated androgen actions play an important role in mammary physiology (Pakula et al., 2017), thus castration causes the pathological upregulation of AR. In our study, AR expression of caecal submucosal lymphatic in castration pigs (fold-change = 2.65; P < 0.05) increased significantly compared with the control (Figure 6E). Intriguingly, among other major organs, the AR level in liver was significantly decreased in the castration group (fold-change = 0.37; P < 0.05) along with an opposite trend in lung (fold-change = 4.20; P < 0.01) (Figure 6F). These results suggested that castration-induced testosterone deficiency altered the tissue-specific pattern of AR expression, and the effects of testosterone deficiency on AR expression showed the opposite tendency compared with mtDNA copy number, particularly in adipose tissues and muscle tissues.
TFAM is a crucial factor to maintain stability and transcription. TFAM participates in the regulation of mtDNA copy number and transcriptional activity, which are key regulators of mitochondrial content and functional capacity. Studies showed that PGC1α is indirectly involved in regulating mitochondrial biogenesis through increased expression of TFAM, which involves coactivation by NRF-1 (Taherzadeh-Fard et al., 2011). Thus, we performed Spearman’s rank correlation coefficient on AR and TFAM expression. Correlation analysis demonstrated that AR and TFAM were significantly correlated both in the control group (r = 0.388; P < 0.05) and the castration group (r = 0.390; P < 0.05) (Supplementary Table S4). Our results showed that AR might be involved in mitochondria biogenesis through a relationship with TFAM.
We also performed immunohistochemistry analysis of AR for 18 representative tissues to verify the qRT-PCR results (Figure 7A and Supplementary Figure S2; see more details in Supplementary Table S5). The results from both these methods were highly correlated regarding AR expression (Spearman’s r = 0.839; P < 10-4) (Figure 7B).
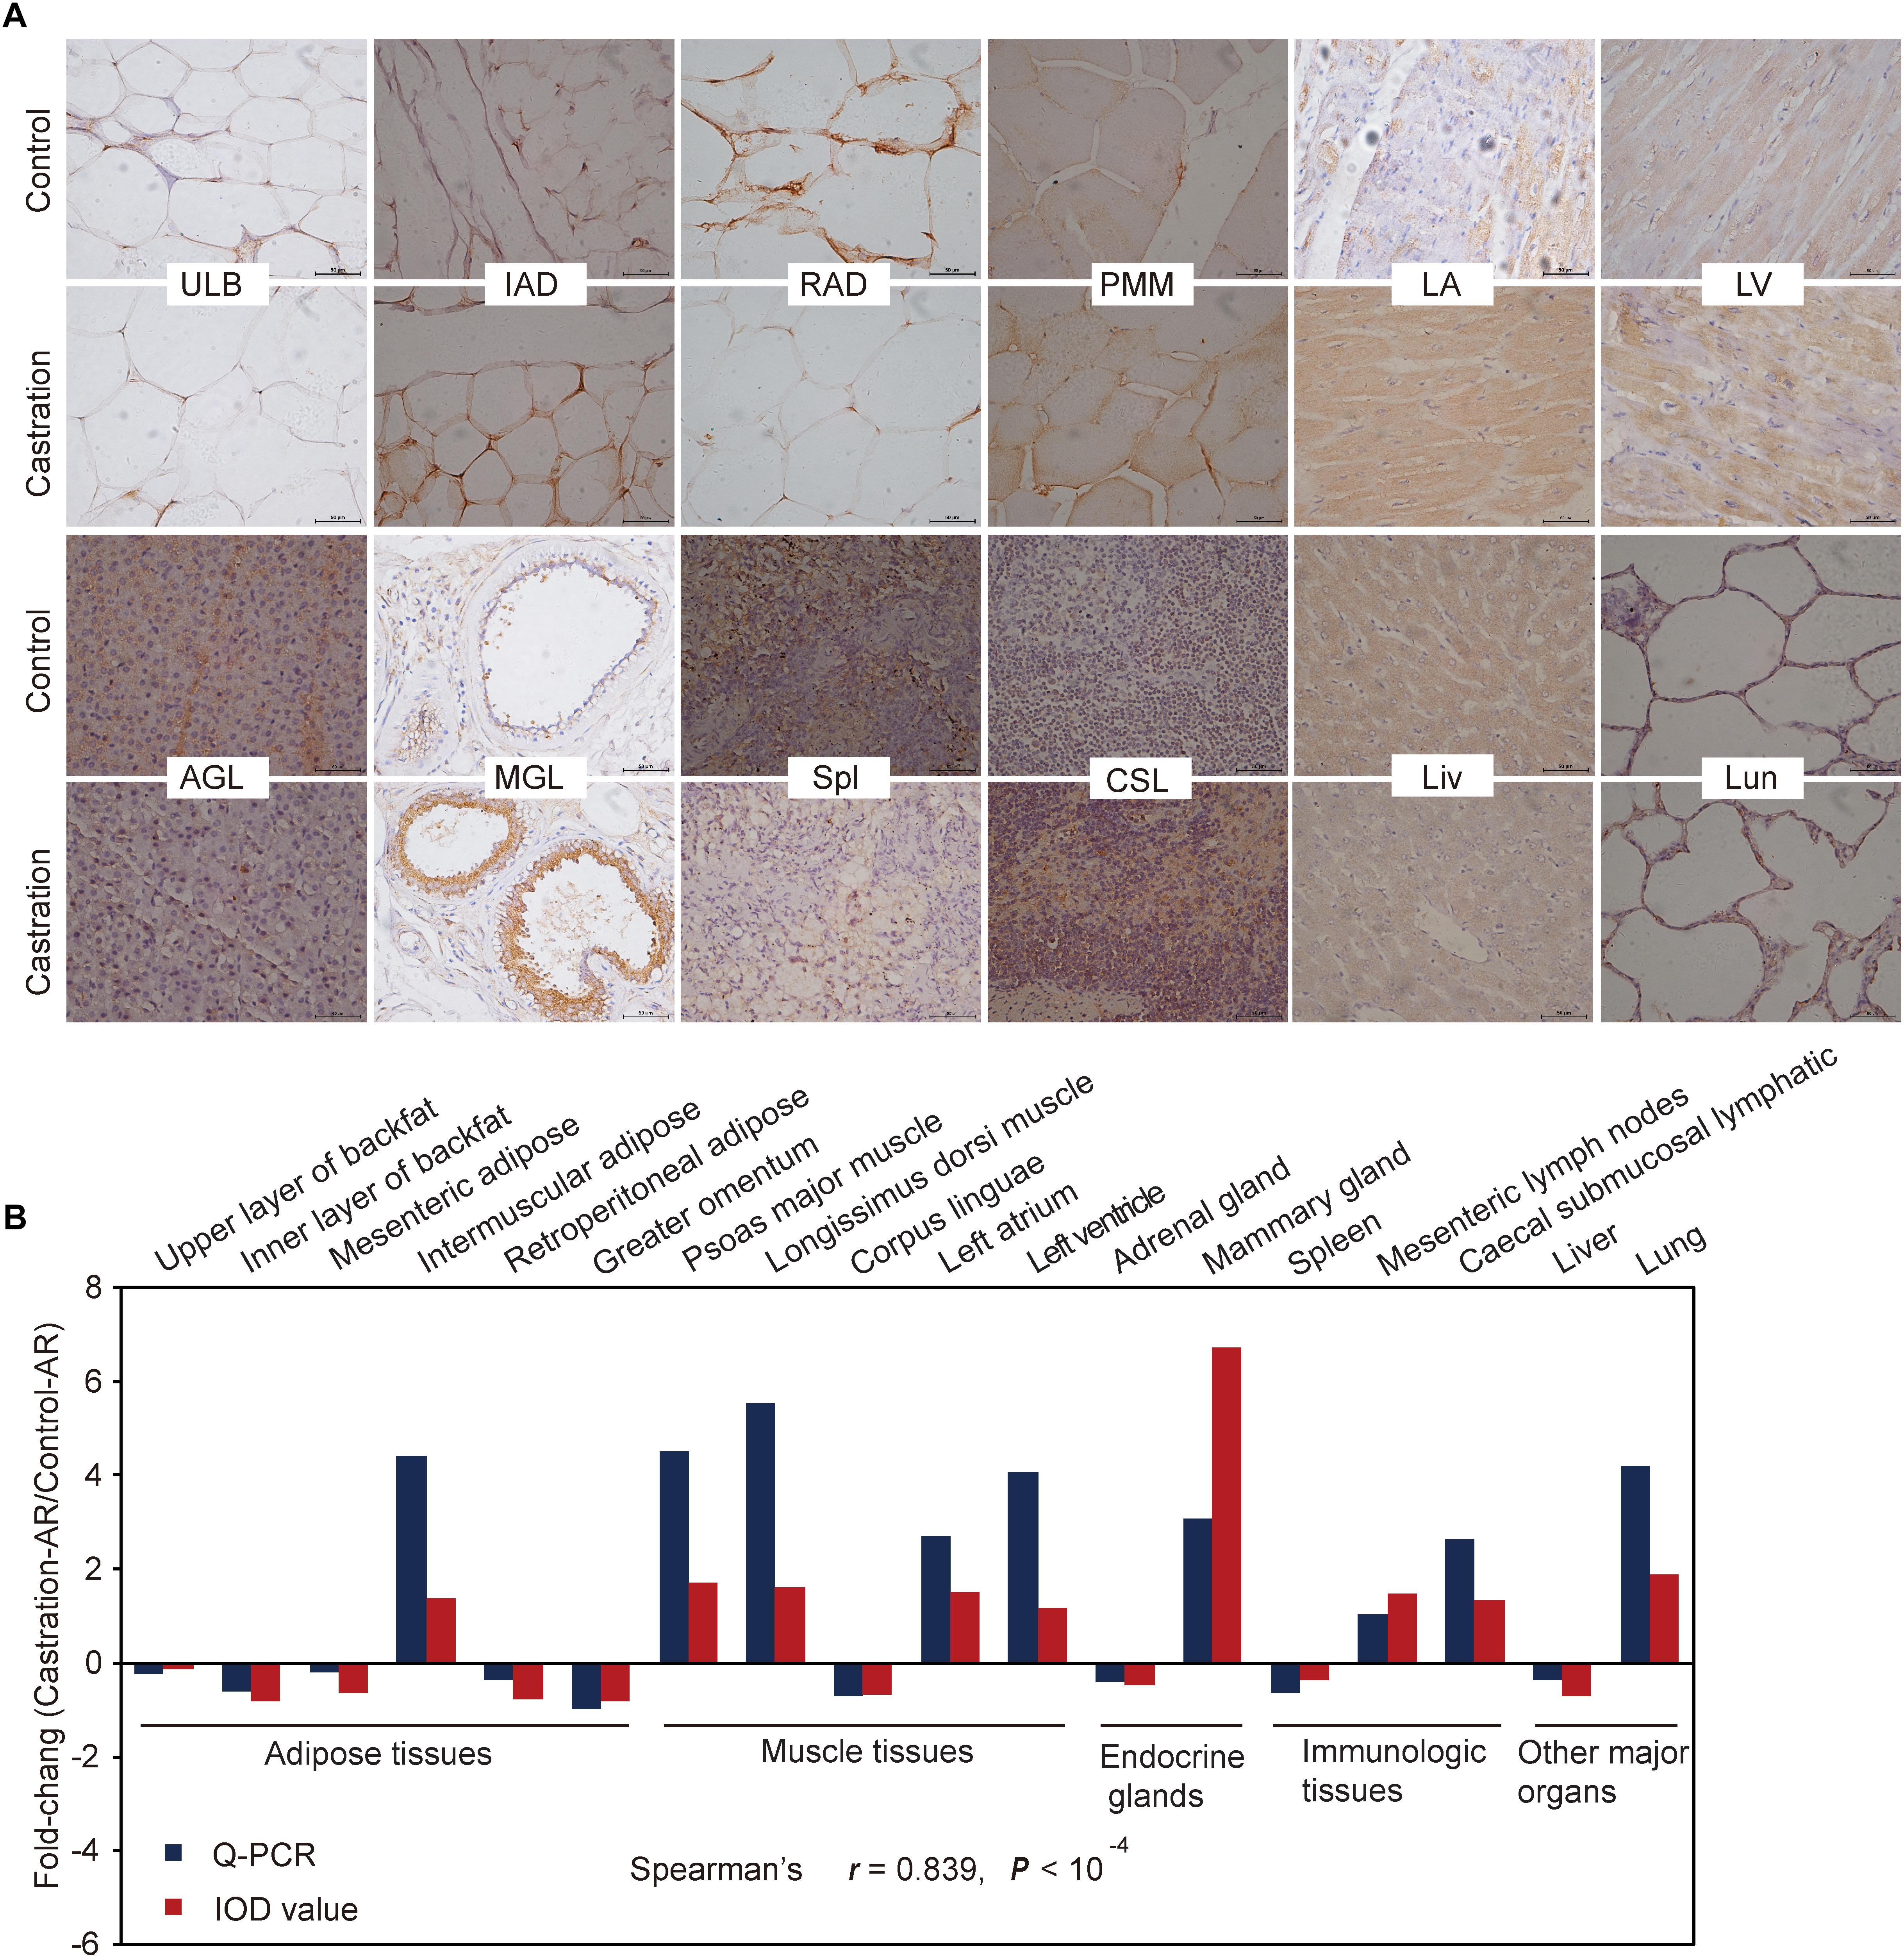
Figure 7. Immunohistochemical and correlation analysis between immunohistochemical staining and qRT-PCR results of AR. (A) Immunohistochemical analysis for 12 representative tissues using an AR (C-19) antibody. Scale bars: 50 μm; 400× magnification. ULB, upper layer of backfat; IAD, intermuscular adipose; RAD, retroperitoneal adipose; PMM, psoas major muscle; LA, left atrium; LV, left ventricle; AGL, adrenal gland; MGL, mammary gland; Spl, spleen; CSL, caecal submucosal lymphatic; Lun, lung; Liv, liver. (B) Fold change of AR mRNA expression in all tissues based on Spearman’s rank correlation. The relative expression levels were measured by qRT-PCR and IOD. n = 4 in each group.
Validation of the Potential Correlation of AR and TFAM
To further verify the correlation of AR and TFAM, pig primary preadipocytes and myoblasts were differentiated and cultured with or without testosterone during the entire differentiation process. EPI-001, as a small molecule, can inhibit transactivation of the AR N-terminal domain (NTD), that is essential for the activity to the ligand-bound AR (Andersen et al., 2010). We examined four treatment groups: control group, testosterone group (10-7 mol/L testosterone), testosterone + EPI group (10-7 mol/L testosterone, 10-4 mol/L EPI-001), and EPI group (10-4 mol/L EPI-001). After fully differentiating primary adipocytes at day 9, there was a significant difference in staining by Oil Red O among these different groups (Figure 8A). Meanwhile, myotubes and nuclear ratio were significantly increased upon treatment with testosterone (Figure 8B). Quantitation by extracting the OD values revealed that testosterone evidently inhibited the differentiation of preadipocytes in testosterone group compared with the control (P < 0.01), followed by testosterone + EPI-001 (P < 0.05) (Figure 8C). Conversely, the testosterone notably enhanced myotubes and nuclear ratio compared with the control (P < 0.01) and EPI-001 group (P < 0.05) (Figure 8D). We also found that testosterone could inhibit the proliferation of mitochondria in adipocytes (testosterone group versus control group, P < 0.01), and increase the mtDNA copy numbers in myotubes (testosterone group versus control group, P < 0.01), which was consistent with previous studies (Figure 8E).
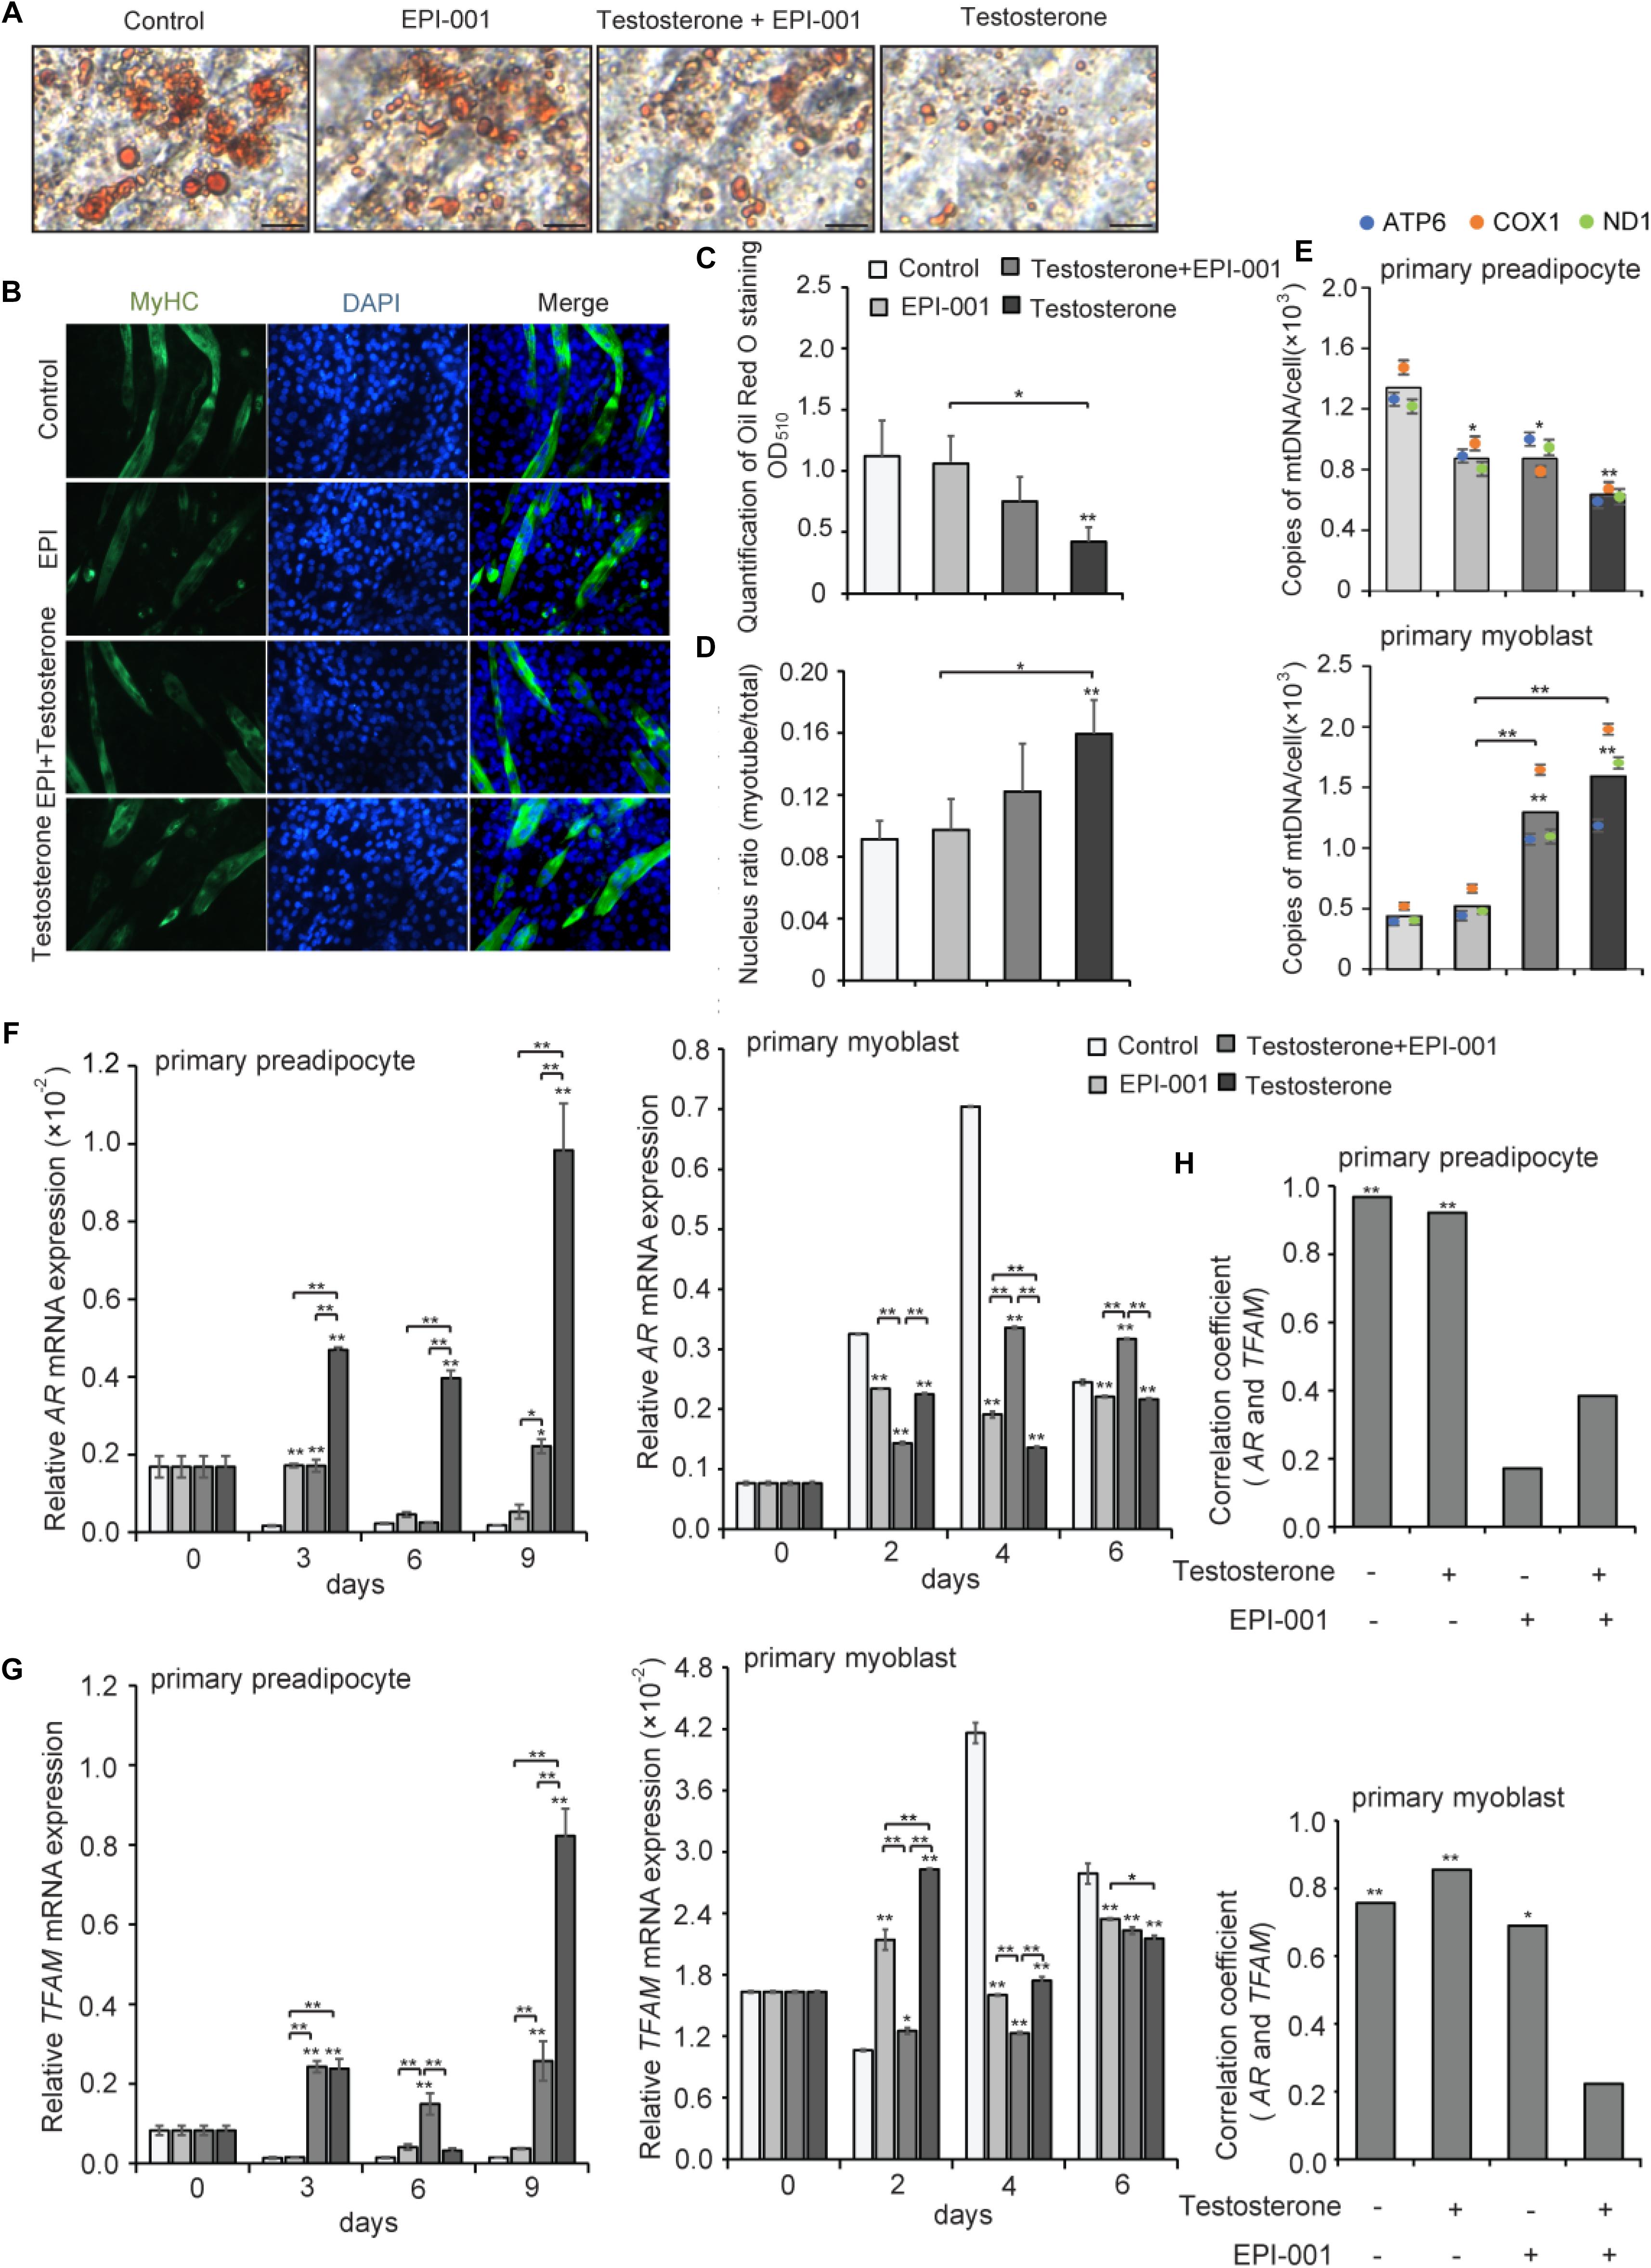
Figure 8. Effect of testosterone on pig primary cells during differentiation. (A) Oil Red O staining of adipocytes after treatment with testosterone (10-7 mol/L) and EPI-001 (10-4 mol/L) after differentiation for 9 day (scale bar = 50 μm). (B) Myotubes were stained with anti-MyHC antibody and the fusion index was calculated. Images were obtained by fluorescence microscopy on the 6th day of myoblast differentiation. (C) Quantification of Oil Red O staining. (D) Fusion index of myotube was calculated. (E) mtDNA copy number analysis of adipogenesis and myogenesis in four treatment groups. Twice the ratio of ATP6/COX1/ND1 to single-copy nuclear gene number reflected the relative mtDNA content, and the solid bars represent mean values of mtDNA contents individually calculated by ATP6, COX1, and ND1. (F) AR and (G) TFAM expression of adipogenesis and myogenesis. (H) Correlation analysis of AR and TFAM based on a Pearson correlation coefficient test during adipogenesis and myogenesis, treated with 10-7 mol/L testosterone (T), 10-4 mol/L EPI-001 (EPI), and 10-7 mol/L testosterone + 10-4 mol/L EPI-001 (T+EPI-001). All data are expressed as means ± SD. Tukey’s post hoc test. ∗P < 0.05, ∗∗P < 0.01 compared with the control (on the bars) or between the indicated groups.
Furthermore, we found that, during differentiation of primary preadipocytes, testosterone treatment enhanced relative expression levels of AR mRNA compared with the control at 3, 6, and 9 days (P < 0.01). Conversely, testosterone significantly reduced the relative AR mRNA expression levels compared with the control during differentiation of primary myoblasts (P < 0.01). These data suggested that testosterone might induce the expression of AR in adipocytes and decrease AR expression in skeletal muscle, which were consistent with the previous in vivo experimental results. However, the trends of AR mRNA expression were broken when EPI-001 was added (P < 0.01), especially in EPI-001 and testosterone+EPI-001 group (Figure 8F). Meanwhile, testosterone treatment induced relative TFAM mRNA expression levels compared with the control during adipogenesis (P < 0.01), accompanied by a decrease in myogenesis at 4 and 6 days (P < 0.01) (Figure 8G). The same trend between AR and TFAM mRNA expression indicated that TFAM may be positively regulated by AR. Furthermore, the correlation analysis of AR and TFAM indicated that both adipogenesis and myogenesis showed a significantly positive correlation between AR and TFAM (r = 0.968, P < 0.01; r = 0.757; P < 0.01) in testosterone (-) and EPI-001 (-), and so did testosterone (+) and EPI-001 (-) (r = 0.922, P < 0.01; r = 0.855; P < 0.01). This correlation decreased in testosterone+EPI-001 treatment (r = 0.384, P > 0.05; r = 0.223, P > 0.05) (Figure 8H).
In silico analysis (JASPAR and PROMO) of the TFAM promoter predicted the presence of AREs in the -1503 to -1517 region (Figure 9A). Thus, we performed luciferase assays using a reporter vector, driven by the TFAM promoter, containing the putative AREs or a mutated AREs. As shown in Figure 9B, where AR was not overexpressed, the activity of the wild-type reporter was approximately 11-fold higher than the PGL3-Basic (P < 0.01). However, the mutant reporter showed a notably lower activity compared with the wild-type, of about 0.80 (P < 0.01). Further, overexpression of AR significantly promoted the activity of the wild-type reporter (P < 0.05), instead of the mutant one. These results indicated that AR drove activation of the TFAM promoter, and this upregulation may require binding through the AREs in the TFAM promoter region.
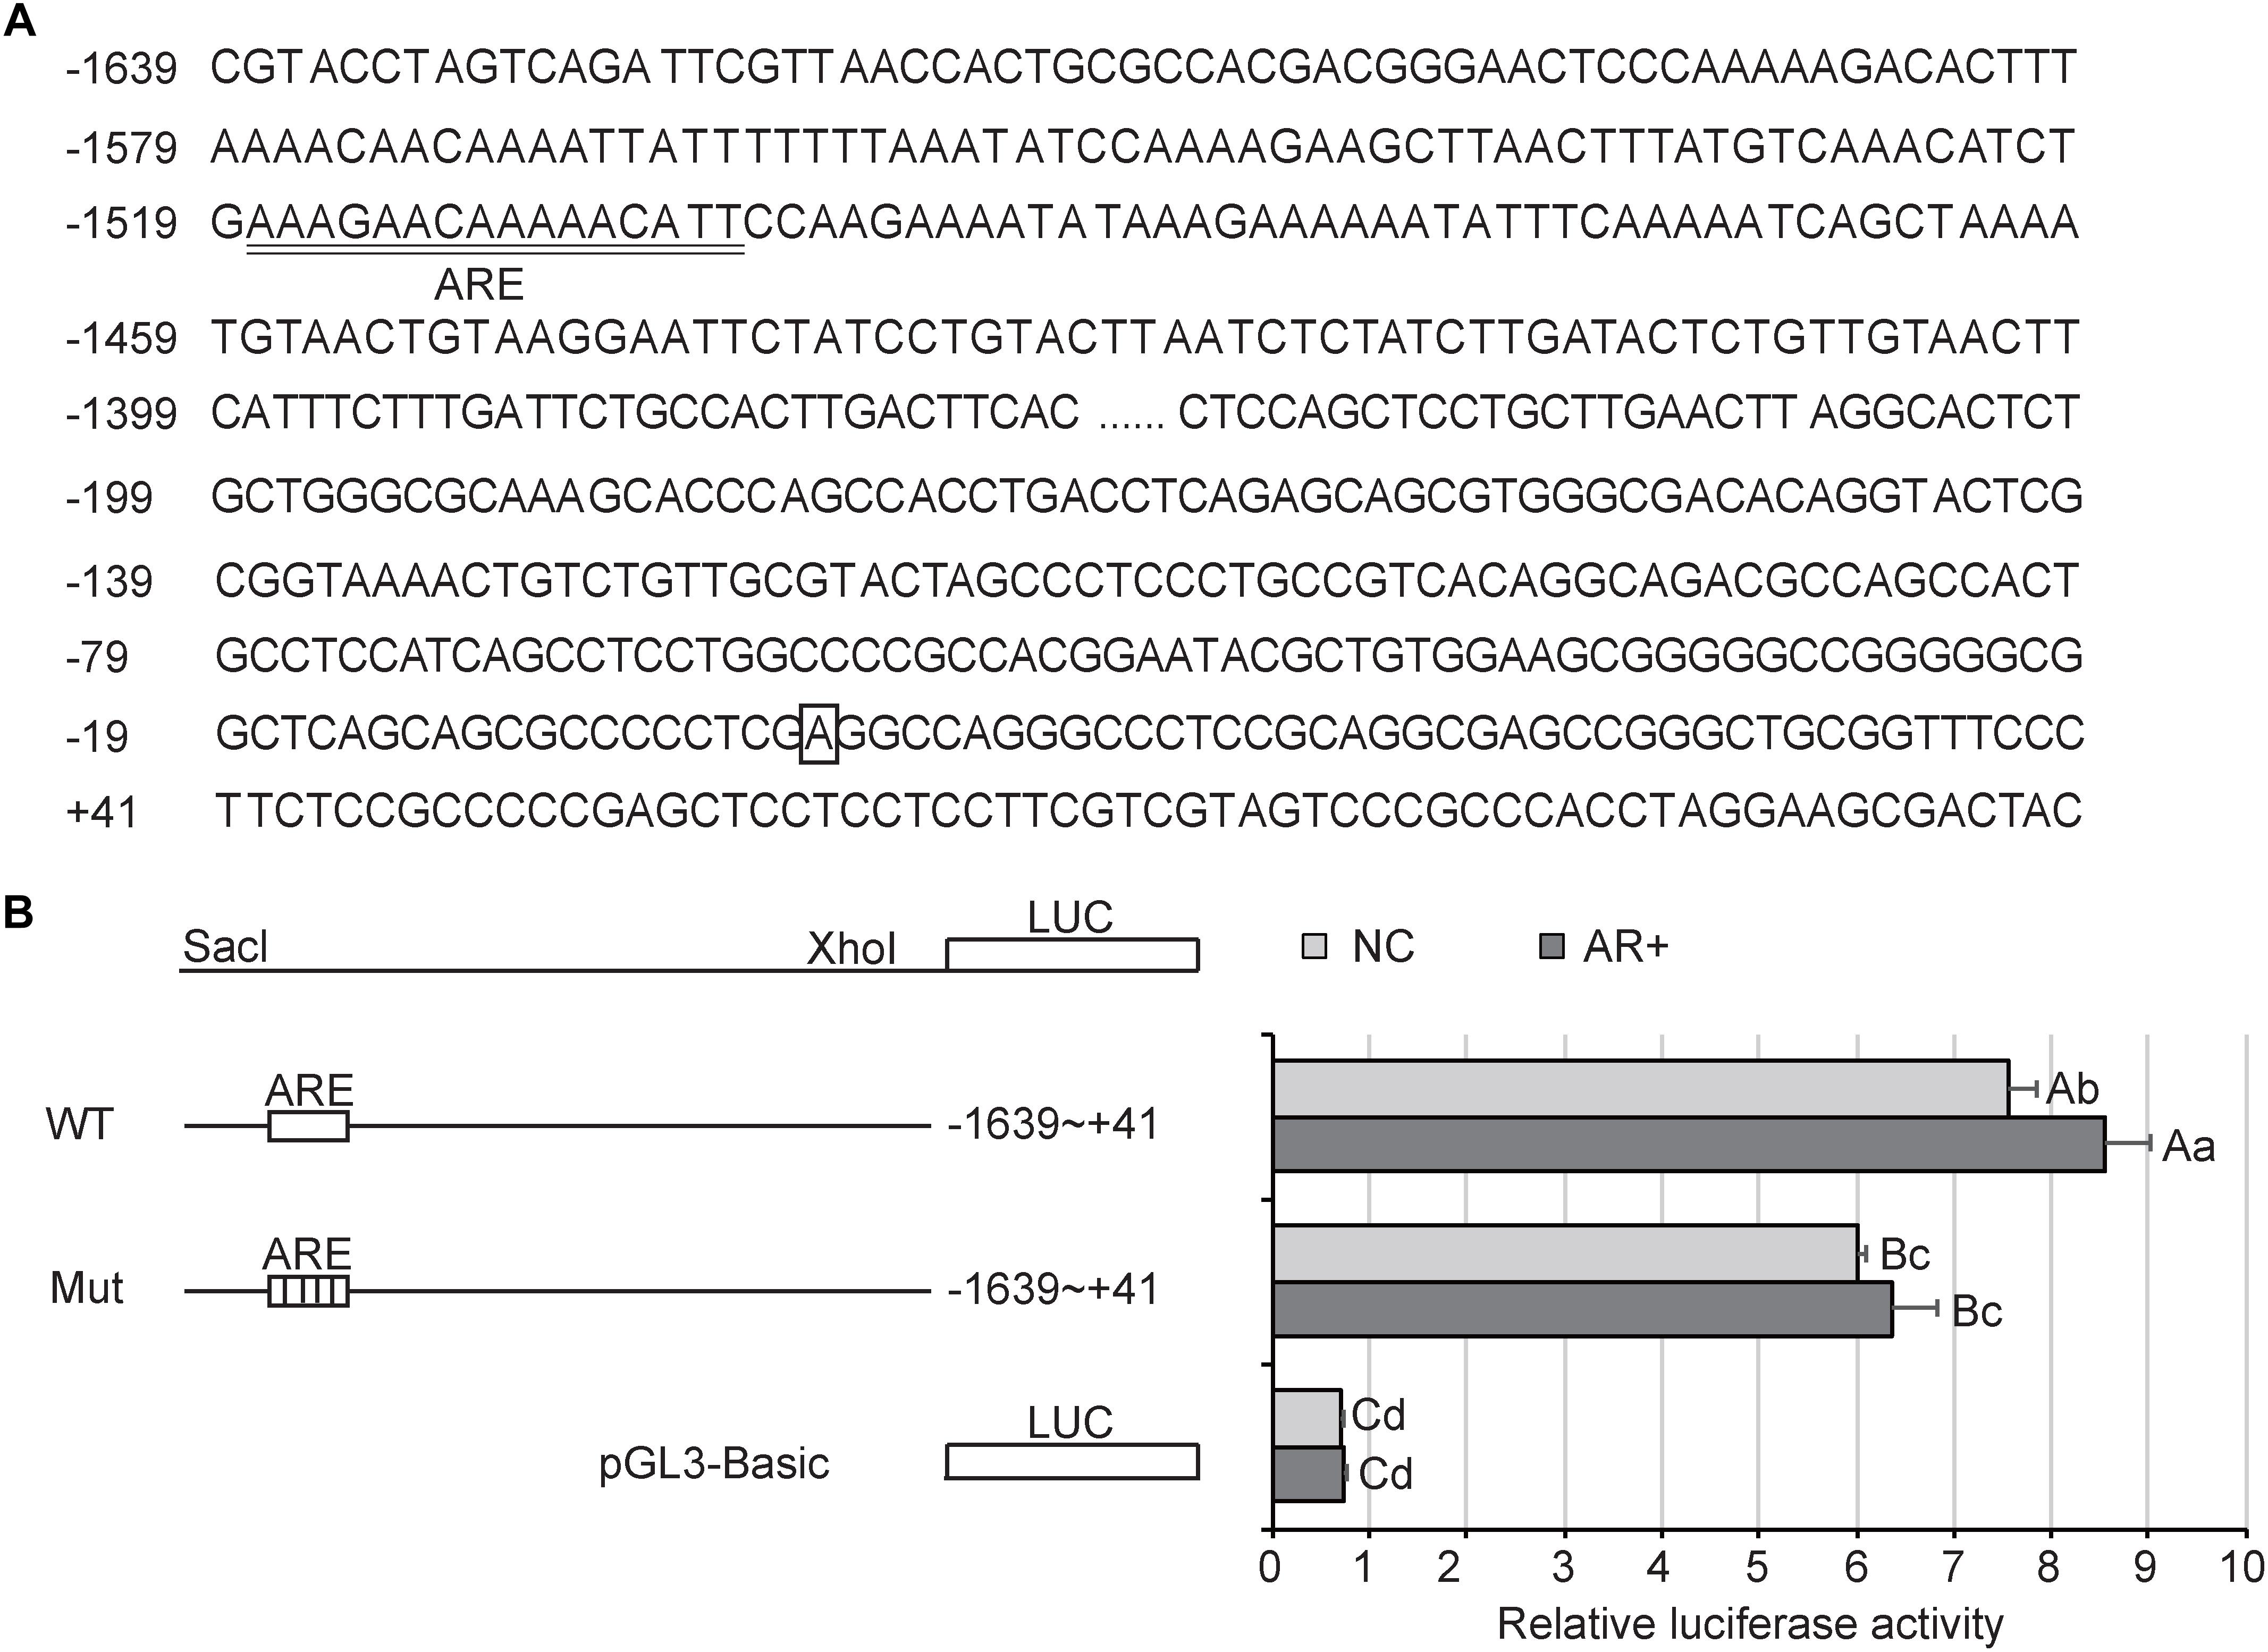
Figure 9. Activity analysis of AR in PK15 cells. (A) Sequence of the TFAM promoter. Nucleotide positions are indicated on the left side, with the transcriptional start site designated +1 and boxed. The putative AR elements (ARE) are underlined. (B) TFAM reporter and luciferase assays in PK15 cells. Left: schematic representations of the luciferase construct driven by the wild-type (WT) TFAM promoter with putative AR binding sites (ARE) or mutant (Mut) reporter with mutated ARE sites. Right: luciferase activity of PK15 cells transfected with the indicated reporter. “NC” represented “negative control” that AR is not overexpressed; “AR+” presented AR is overexpressed. All data are expressed as means ± SD, 4 technical duplication in each group. Statistical comparisons were performed with Student’s t-test with Tukey’s post hoc test. The same letters indicate no significant difference (P > 0.05); the data shown with different lowercase letters indicate a significant difference (P < 0.05); the data shown with different capital letters indicate a significant difference (P < 0.01).
Taken together, these findings demonstrated that testosterone might be involved in the pathway linking PGC1α to mitochondrial biogenesis, through AR interacting with the TFAM promoter.
Conclusion
This study provided a relatively detailed tissue expression profile of mtDNA copy number and AR expression. We found that testosterone deficiency in a castration model modulated mitochondrial biogenesis through the PGC1α/TFAM pathway. We also found that the mRNA expression of AR was significantly correlated with TFAM and our results suggested that AR regulates mitochondrial biogenesis by acting on TFAM. Overall, our data showed that TFAM is an AR target gene and involved in the pathway linking PGC1α to mitochondrial biogenesis. Of course, our study still has some shortcomings, such as the cell heterogeneity in tissue and the corresponding dilution effect on gene expression, but it is difficult to avoid these problems with current technology. We believe that these problems will be solved with the large-scale application of single cell sequencing in the future.
Author Contributions
CL, JM, and JZ designed the experiments and wrote the manuscript. HZ and YZ carried out the experiments data organization and statistical analyses. LZ, YJ, GT, XL, and ML provided the experimental samples. JQ and LL participated in the study design and discussed the manuscript. All authors read and approved the final manuscript.
Funding
This work was supported by grants from the National Key R&D Program of China (Grant Nos. 2018YFD0501204 and 2018YFD0500403), the National Natural Science Foundation of China (Grant Nos. 31601918, 31530073, and 31772576), the Earmarked Fund for China Agriculture Research System (Grant No. CARS-35-01A), and the Science & Technology Support Program of Sichuan (Grant Nos. 2016NYZ0042 and 2017NZDZX0002).
Conflict of Interest Statement
The authors declare that the research was conducted in the absence of any commercial or financial relationships that could be construed as a potential conflict of interest.
Supplementary Material
The Supplementary Material for this article can be found online at: https://www.frontiersin.org/articles/10.3389/fgene.2019.00505/full#supplementary-material
References
Andersen, R. J., Mawji, N. R., Jun, W., Gang, W., Simon, H., Jae-Kyung, M., et al. (2010). Regression of castrate-recurrent prostate cancer by a small-molecule inhibitor of the amino-terminus domain of the androgen receptor. Cancer Cell. 17, 535–546. doi: 10.1016/j.ccr.2010.04.027
Attardi, G., and Schatz, G. (1988). Biogenesis of mitochondria. Annu. Rev. Cell. Dev. B. 4, 289–331.
Aversa, R., Petrescu, R. V. V., Apicella, A., and Petrescu, F. I. T. (2017). Mitochondria are naturally micro robots -a review. Am. J. Eng. Appl. Sci. 9.
Bretschneider, G. (2005). Effects of age and method of castration on performance and stress response of beef male cattle: a review. Livest. Prod. Sci. 97, 89–100. doi: 10.1016/j.livprodsci.2005.04.006
Burek, M., Duda, M., Knapczyk, K., Koziorowski, M., and Słomczyńska, M. (2007). Tissue-specific distribution of the androgen receptor (AR) in the porcine fetus. Acta Histochem. 109, 358–365. doi: 10.1016/j.acthis.2007.03.003
Capllonchamer, G., Lladó, I., Proenza, A. M., Garcíapalmer, F. J., and Gianotti, M. (2014). Opposite effects of 17-β estradiol and testosterone on mitochondrial biogenesis and adiponectin synthesis in white adipocytes. J. Mol. Endocrinol. 52, 203–214. doi: 10.1530/JME-13-0201
Clay Montier, L. L., Deng, J. J., and Bai, Y. (2009). Number matters: control of mammalian mitochondrial DNA copy number. J. Genet. Genomics 36, 125–131. doi: 10.1016/S1673-8527(08)60099-5
Detmer, S. A., and Chan, D. C. (2007). Functions and dysfunctions of mitochondrial dynamics. Nat. Rev. Mol. Cell. Biol. 2007, 870–879. doi: 10.1038/nrm2275
Ekstrand, M. I., Maria, F., Anja, R., Bae, P. C., Martina, G., Kjell, H., et al. (2004). Mitochondrial transcription factor a regulates mtDNA copy number in mammals. Hum. Mol. Genet. 13:935. doi: 10.1093/hmg/ddh109
Eskiocak, U., Ramesh, V., Gill, J. G., Zhao, Z., Yuan, S. W., Wang, M., et al. (2016). Synergistic effects of ion transporter and MAP kinase pathway inhibitors in melanoma. Nat. Commun. 7:12336.
Gaba, A., Mairhofer, M., Zhegu, Z., Leditznig, N., Szabo, L., Tschugguel, W., et al. (2018). Testosterone induced downregulation of migration and proliferation in human umbilical vein endothelial cells by androgen receptor dependent and independent mechanisms. Mol. Cell. Endocrinol. 476, 173–184. doi: 10.1016/j.mce.2018.05.007
García-Rodríguez, L. J. (2007). Appendix 1. basic properties of mitochondria. Method Cell. Biol. 80, 809–812. doi: 10.1016/s0091-679x(06)80040-3
Gaziev, A., Abdullaev, S., and Podlutsky, A. (2014). Mitochondrial function and mitochondrial DNA maintenance with advancing age. Biogerontology 15, 417–438. doi: 10.1007/s10522-014-9515-2
Gondret, F., Guitton, N., Guillermregost, C., and Louveau, I. (2008). Regional differences in porcine adipocytes isolated from skeletal muscle and adipose tissues as identified by a proteomic approach. J. Anim. Sci. 86, 2115–2125. doi: 10.2527/jas.2007-0750
Gustafsson, A. B., and Gottlieb, R. A. (2008). Heart mitochondria: gates of life and death. Cardiovasc. Res. 77:334. doi: 10.1093/cvr/cvm005
Hanna, R. A., Quinsay, M. N., Orogo, A. M., Giang, K., Rikka, S., and Gustafsson, ÅB. (2012). Microtubule-associated protein 1 light chain 3 (LC3) interacts with Bnip3 protein to selectively remove endoplasmic reticulum and mitochondria via autophagy. J. Bio. Chem. 287, 19094–19104. doi: 10.1074/jbc.M111.322933
Isidori, A. M., Giannetta, E., Gianfrilli, D., Greco, E. A., Bonifacio, V., Aversa, A., et al. (2005). Effects of testosterone on sexual function in men: results of a meta-analysis. Clin. Endocrinol. 63, 381–394. doi: 10.1111/j.1365-2265.2005.02350.x
Jin, H. J., Kim, J., and Yu, J. (2013). Androgen receptor genomic regulation. Transl. Androl. Urol. 2:158.
Kamfar, S., Alavian, S. M., Houshmand, M., Yadegarazari, R., Zarei, B. S., Khalaj, A., et al. (2016). Liver mitochondrial DNA copy number and deletion levels may contribute to nonalcoholic fatty liver disease susceptibility. Hepat. Mon. 16:e40774. doi: 10.5812/hepatmon.40774
Kelly, D. M., and Jones, T. H. (2013). Testosterone: a metabolic hormone in health and disease. J. Endocrinol. 217, 25–45. doi: 10.1530/JOE-12-0455
Kershaw, E. E., and Flier, J. S. (2004). Adipose tissue as an endocrine organ. J. Clin. Endocrinol. Metab. 89, 2548–2556.
Lee, Y., Lee, H. Y., Hanna, R. A., and Gustafsson, ÅB. (2011). Mitochondrial autophagy by Bnip3 involves Drp1-mediated mitochondrial fission and recruitment of Parkin in cardiac myocytes. Am. J. Physiol. Heart Circ. Physiol. 301, 1924–1931. doi: 10.1152/ajpheart.00368.2011
Lehman, J. J., Barger, P. M., Kovacs, A., Saffitz, J. E., Medeiros, D. M., and Kelly, D. P. (2000). Peroxisome proliferator–activated receptor γ coactivator-1 promotes cardiac mitochondrial biogenesis. J. Clin. Invest. 106:847. doi: 10.1172/jci10268
Lopes, R. A., Neves, K. B., Carneiro, F. S., and Tostes, R. C. (2012). Testosterone and vascular function in aging. Front. Physiol. 3:89. doi: 10.3389/fphys.2012.00089
Mammi, C., Calanchini, M., Antelmi, A., Cinti, F., Rosano, G. M., Lenzi, A., et al. (2011). Androgens and adipose tissue in males: a complex and reciprocal interplay. Int. J. Endocrinol. 2012:789653. doi: 10.1155/2012/789653
Messeguer, X., Escudero, R., Farré, D., Núñez, O., Martínez, J., and Albà, M. M. (2002). PROMO: detection of known transcription regulatory elements using species-tailored searches. Bioinformatics 18, 333–334. doi: 10.1093/bioinformatics/18.2.333
Miller, F. J., Rosenfeldt, F. L., Zhang, C., Linnane, A. W., and Nagley, P. (2003). Precise determination of mitochondrial DNA copy number in human skeletal and cardiac muscle by a PCR-based assay: lack of change of copy number with age. Nucleic Acids Res. 31:e61.
Mortensen, M., and Simon, A. K. (2010). Nonredundant role of Atg7 in mitochondrial clearance during erythroid development. Autophagy 6:423. doi: 10.4161/auto.6.3.11528
Narendra, D., Tanaka, A., Suen, D. F., and Youle, J. R. (2008). Parkin is recruited selectively to impaired mitochondria and promotes their autophagy. Autophagy 183, 795–803. doi: 10.1083/jcb.200809125
Narendra, D. P., Jin, S. M., Tanaka, A., Suen, D. F., Gautier, C. A., Shen, J., et al. (2010). PINK1 is selectively stabilized on impaired mitochondria to activate parkin. PLoS Biol. 8:e1000298. doi: 10.1371/journal.pbio.1000298
Nheu, L., Nazareth, L., Xu, G. Y., Xiao, F. Y., Luo, R. Z., Komesaroff, P., et al. (2011). Physiological effects of androgens on human vascular endothelial and smooth muscle cells in culture. Steroids 76, 1590–1596. doi: 10.1016/j.steroids.2011.09.015
O’Hara, L., Welsh, M., Saunders, P. T., and Smith, L. B. (2011). Androgen receptor expression in the caput epididymal epithelium is essential for development of the initial segment and epididymal spermatozoa transit. Endocrinology 152, 718–729. doi: 10.1210/en.2010-0928
Pakula, H., Xiang, D., and Li, Z. (2017). A Tale of two signals: AR and WNT in development and tumorigenesis of prostate and mammary gland. Cancers 9:14. doi: 10.3390/cancers9020014
Palikaras, K., and Tavernarakis, N. (2014). Mitochondrial homeostasis: the interplay between mitophagy and mitochondrial biogenesis. Exp. Gerontol. 56, 182–188. doi: 10.1016/j.exger.2014.01.021
Portalescasamar, E., Thongjuea, S., Kwon, A. T., Arenillas, D., Zhao, X., Valen, E., et al. (2010). JASPAR 2010: the greatly expanded open-access database of transcription factor binding profiles. Nucleic Acids Res. 38:D105. doi: 10.1093/nar/gkp950
Reckelhoff, J. F. (2005). Sex steroids, cardiovascular disease, and hypertension: unanswered questions and some speculations. Hypertension 45:170. doi: 10.1161/01.hyp.0000151825.36598.36
Sansone, A., Romanelli, F., Sansone, M., Lenzi, A., and Luigi, L. D. (2017). Gynecomastia and hormones. Endocrine 55, 1–8.
Santander, A., Lopez-Ocejo, O., Casas, O., Agostini, T., Sanchez, L., Lamas-Basulto, E., et al. (2015). Paracrine interactions between adipocytes and tumor cells recruit and modify macrophages to the mammary tumor microenvironment: the role of obesity and inflammation in breast adipose tissue. Cancers 7, 143–178. doi: 10.3390/cancers7010143
Santos, R., Correia, S., Alves, M., Oliveira, P., Cardoso, S., Carvalho, C., et al. (2014). Insulin therapy modulates mitochondrial dynamics and biogenesis, autophagy and tau protein phosphorylation in the brain of type 1 diabetic rats. Biochem. Biophy. Acta 1842, 1154–1166. doi: 10.1016/j.bbadis.2014.04.011
Schaap, L. A., Pluijm, S. M., Smit, J. H., van Schoor, N. M., Visser, M., Gooren, L. J., et al. (2005). The association of sex hormone levels with poor mobility, low muscle strength and incidence of falls among older men and women. Clin. Endocrinol. 63, 152–160. doi: 10.1111/j.1365-2265.2005.02315.x
Shaffer, P. L., Jivan, A., Dollins, D. E., Claessens, F., and Gewirth, D. T. (2004). Structural basis of androgen receptor binding to selective androgen response elements. Proc. Natl. Acad. Sci. U.S.A. 101, 4758–4763. doi: 10.1073/pnas.0401123101
Snyder, P. J., Bhasin, S., Cunningham, G. R., Matsumoto, A. M., Stephensshields, A. J., Cauley, J. A., et al. (2016). Effects of testosterone treatment in older men. N. Engl. J. Med. 374, 611–624.
Taherzadeh-Fard, E., Saft, C., Akkad, D. A., Wieczorek, S., Haghikia, A., Chan, A., et al. (2011). PGC-1alpha downstream transcription factors NRF-1 and TFAM are genetic modifiers of Huntington disease. Mol. Neurodegener. 6:32. doi: 10.1186/1750-1326-6-32
Takase, S., Kurokawa, R., Arai, D., Kanto, K. K., Okino, T., Nakao, Y., et al. (2017). A quantitative shRNA screen identifies ATP1A1 as a gene that regulates cytotoxicity by aurilide B. Sci. Rep. 7:2002. doi: 10.1038/s41598-017-02016-4
Teslaa, T., Setoguchi, K., and Teitell, M. A. (2016). Mitochondria in human pluripotent stem cell apoptosis. Semin. Cell. Dev. Biol. 52, 76–83. doi: 10.1016/j.semcdb.2016.01.027
Theilen, N. T., Kunkel, G. H., and Tyagi, S. C. (2016). The role of exercise and TFAM in preventing skeletal muscle atrophy. J. Cell. Physiol. 232, 2348–2358. doi: 10.1002/jcp.25737
Thyagarajan, B., Wang, R., Barcelo, H., Nelson, H., Koh, W. P., and Yuan, J. M. (2013). Mitochondrial DNA copy number is prospectively associated with breast cancer risk. Cancer Res. 73, 1339–1339. doi: 10.1158/1538-7445.am2013-1339
Torres-Estay, V., Carreño, D. V., Fuenzalida, P., Watts, A., San Francisco, I. F., Montecinos, V. P., et al. (2017). Androgens modulate male-derived endothelial cell homeostasis using androgen receptor-dependent and receptor-independent mechanisms. Angiogenesis 20, 1–14. doi: 10.1007/s10456-016-9525-6
Traish, A. M., Munarriz, R., O’Connell, L., Choi, S., Kim, S. W., Kim, N. N., et al. (2003). Effects of medical or surgical castration on erectile function in an animal model. J. Androl. 24, 381–387. doi: 10.1002/j.1939-4640.2003.tb02686.x
Trigunaite, A., Dimo, J., and Jørgensen, T. N. (2015). Suppressive effects of androgens on the immune system. Cell. Immunol. 294, 87–94. doi: 10.1016/j.cellimm.2015.02.004
Tsutsui, H., Kinugawa, S., and Matsushima, S. (2008). Oxidative stress and mitochondrial DNA damage in heart failure. Circ. J. 72(Suppl. A), A31–A37.
Usui, T., Kajita, K., Kajita, T., Mori, I., Hanamoto, T., Ikeda, T., et al. (2014). Elevated mitochondrial biogenesis in skeletal muscle is associated with testosterone-induced body weight loss in male mice. Febs Lett. 588, 1935–1941. doi: 10.1016/j.febslet.2014.03.051
Waki, H., and Tontonoz, P. (2007). Endocrine functions of adipose tissue. Annu. Rev. Pathol. Mech. Dis. 2, 31–56.
Walker, M. A., Volpi, S., Sims, K. B., Walter, J. E., and Traggiai, E. (2014). Powering the immune system: mitochondria in immune function and deficiency. J. Immunol. Res. 2014:164309. doi: 10.1155/2014/164309
Wang, R. S., Yeh, S., Tzeng, C. R., and Chang, C. (2009). Androgen receptor roles in spermatogenesis and fertility: lessons from testicular cell-specific androgen receptor knockout mice. Endocr. Rev. 30, 119–132. doi: 10.1210/er.2008-0025
Wozniak, S. E., Gee, L. L., Wachtel, M. S., and Frezza, E. E. (2009). Adipose tissue: the new endocrine organ? a review article. Digest Dis. Sci. 54, 1847–1856. doi: 10.1007/s10620-008-0585-3
Wu, H., Kanatous, S. B., Thurmond, F. A., Gallardo, T., Isotani, E., Basselduby, R., et al. (2002). Regulation of mitochondrial biogenesis in skeletal muscle by CaMK. Science 296, 349–352. doi: 10.1126/science.1071163
Zawada, I., Masternak, M. M., List, E. O., Stout, M. B., Berryman, D. E., Lewinski, A., et al. (2015). Gene expression of key regulators of mitochondrial biogenesis is sex dependent in mice with growth hormone receptor deletion in liver. Aging 7, 195–204. doi: 10.18632/aging.100733
Keywords: mitochondrial biogenesis, testosterone, androgen receptor, TFAM, castration
Citation: Liu C, Ma J, Zhang J, Zhao H, Zhu Y, Qi J, Liu L, Zhu L, Jiang Y, Tang G, Li X and Li M (2019) Testosterone Deficiency Caused by Castration Modulates Mitochondrial Biogenesis Through the AR/PGC1α/TFAM Pathway. Front. Genet. 10:505. doi: 10.3389/fgene.2019.00505
Received: 08 February 2019; Accepted: 07 May 2019;
Published: 29 May 2019.
Edited by:
Louise Metherell, Queen Mary University of London, United KingdomReviewed by:
Rodolfo A. Rey, Center for Endocrinology Research “Dr. César Bergadá” (CEDIE), ArgentinaLaura Ellestad, University of Georgia, United States
Copyright © 2019 Liu, Ma, Zhang, Zhao, Zhu, Qi, Liu, Zhu, Jiang, Tang, Li and Li. This is an open-access article distributed under the terms of the Creative Commons Attribution License (CC BY). The use, distribution or reproduction in other forums is permitted, provided the original author(s) and the copyright owner(s) are credited and that the original publication in this journal is cited, in accordance with accepted academic practice. No use, distribution or reproduction is permitted which does not comply with these terms.
*Correspondence: Mingzhou Li, mingzhou.li@163.com; mingzhou.li@sicau.edu.cn
†These authors have contributed equally to this work