 Lukas Schmidt1†
 Stephan Werner1†
 Thomas Kemmer2Stefan Niebler3Marco Kristen1Lilia Ayadi4,5Patrick Johe1Virginie Marchand4Tanja Schirmeister1
 Yuri Motorin4,5Andreas Hildebrandt2*Bertil Schmidt3*
 Mark Helm1*
- 1Institute of Pharmacy and Biochemistry, Johannes Gutenberg-University, Mainz, Germany
- 2Institute of Computer Science, Scientific Computing and Bioinformatics, Johannes Gutenberg-University, Mainz, Germany
- 3Institute of Computer Science, High Performance Computing, Johannes Gutenberg-University, Mainz, Germany
- 4Next-Generation Sequencing Core Facility UMS2008 IBSLor CNRS-UL-INSERM, Biopôle, University of Lorraine, Vandœuvre-lès-Nancy, France
- 5IMoPA UMR7365 CNRS-UL, Biopôle, University of Lorraine, Vandœuvre-lès-Nancy, France
Modification mapping from cDNA data has become a tremendously important approach in epitranscriptomics. So-called reverse transcription signatures in cDNA contain information on the position and nature of their causative RNA modifications. Data mining of, e.g. Illumina-based high-throughput sequencing data, is therefore fast growing in importance, and the field is still lacking effective tools. Here we present a versatile user-friendly graphical workflow system for modification calling based on machine learning. The workflow commences with a principal module for trimming, mapping, and postprocessing. The latter includes a quantification of mismatch and arrest rates with single-nucleotide resolution across the mapped transcriptome. Further downstream modules include tools for visualization, machine learning, and modification calling. From the machine-learning module, quality assessment parameters are provided to gauge the suitability of the initial dataset for effective machine learning and modification calling. This output is useful to improve the experimental parameters for library preparation and sequencing. In summary, the automation of the bioinformatics workflow allows a faster turnaround of the optimization cycles in modification calling.
Introduction
In the rapidly growing field of epitranscriptomics (Saletore et al., 2012), the detection of RNA modifications is typically based on a combination of reagents and tools for wet work on the one hand, and bioinformatics processing of massive amounts of RNA-Seq data, on the other hand. Because of a sequence space that may include up to 107 nucleotides and more, transcriptomes must be scrutinized by computer-assisted detection schemes, resulting in what is called modification calling (Helm and Motorin, 2017).
With the exception of the up-and-coming nanopore direct RNA sequencing technology (Byrne et al., 2017; Garalde et al., 2018; Smith et al., 2019), RNA-Seq data are obtained after reverse transcription of the modified RNA template into DNA, a process during which information about modification type and position may get erased, partially or completely, since the newly synthesized cDNA is composed only of the four canonical deoxynucleotides. Attempts to circumvent this problem included, for example, the use of various chemical reagents, which specifically react with a given modification, to alter cDNA synthesis at sites of RNA modifications. One such reagent is CMCT, a carbodiimide leading to stalling of cDNA synthesis at sites of pseudouridine modification in the RNA template (Ofengand and Bakin, 1997; Carlile et al., 2014; Schwartz et al., 2014). Other modifications do not require chemical derivatization to alter cDNA synthesis. In particular, modifications with chemical alterations on their Watson–Crick face are liable to cause cDNA synthesis differing from that expected of an unmodified RNA template. A case in point is m1A, a modification featuring a methyl group on the Watson–Crick face of adenosine, which interferes with proper base pairing, in RNA structure (Helm et al., 1998) (Helm et al., 1999) (Lempereur et al., 1985; Zhou et al., 2016), as well as during cDNA synthesis by reverse transcription (Motorin et al., 2007). In the particular case of m1A, the resulting cDNA was shown to contain products of transcription arrest, i.e. abortive cDNA fragments, as well as misincorporation, most frequently of dATP being incorporated instead of dTTP at the position corresponding to the modification site. The ensemble of erroneous events in cDNA synthesis has been termed reverse transcription signature and was shown to depend on a number of factors including e.g. the nature of the penultimate base encountered by the RT enzyme before engaging the modified RNA residue (Hauenschild et al., 2015). The RT signature of m1A can be experimentally altered e.g. by enzymatic demethylation with the AlkB enzyme (Zheng et al., 2015; Liu et al., 2016; Li et al., 2017) or at alkaline pH, which induces a Dimroth rearrangement to m6A (Dominissini et al., 2016; Safra et al., 2017). Since these processes are relatively specific to m1A, they can be exploited to increase confidence in modification calling, therein being used as a validation (Helm and Motorin, 2017).
All of the above processes require significant computing efforts to extract information on RNA modifications from RNA-Seq data. Given that the composition of RT signature of a given modification in terms of RT arrest, misincorporation, and even template nucleotide skipping (“jumps”) (Ebhardt et al., 2009; Findeiss et al., 2011; Ryvkin et al., 2013; Hauenschild et al., 2015) is subject to variations caused by factors that are not fully characterized and thus cannot be entirely controlled, an innovative approach to account for a maximum of these features and exploit them for computer-based prediction (“modification calling”) involves machine learning. A particular brand of machine learning, the random forest, was used for the purpose of modification by several groups, including us (Hauenschild et al., 2015).
Optimizing the performance of a modification calling protocol requires multiple rounds, beginning with a wet work part of library preparation and subsequent Illumina sequencing, as illustrated in Figure 1A. Here, a pretreatment (A1) of the samples by using auxiliary reagents such as the demethylase AlkB or changes in the library preparation part (A2), e.g. by employing different reverse transcriptase enzymes or variegated reaction conditions, are implemented experimentally. After sequencing (A3), a fast evaluation of their influence on the RT signature and consequently on RF performance (A4) is necessary to proceed with the next round of optimized library preparation in the wet lab. The associated computational data mining thus represents a bottleneck on the path to optimal modification calling.
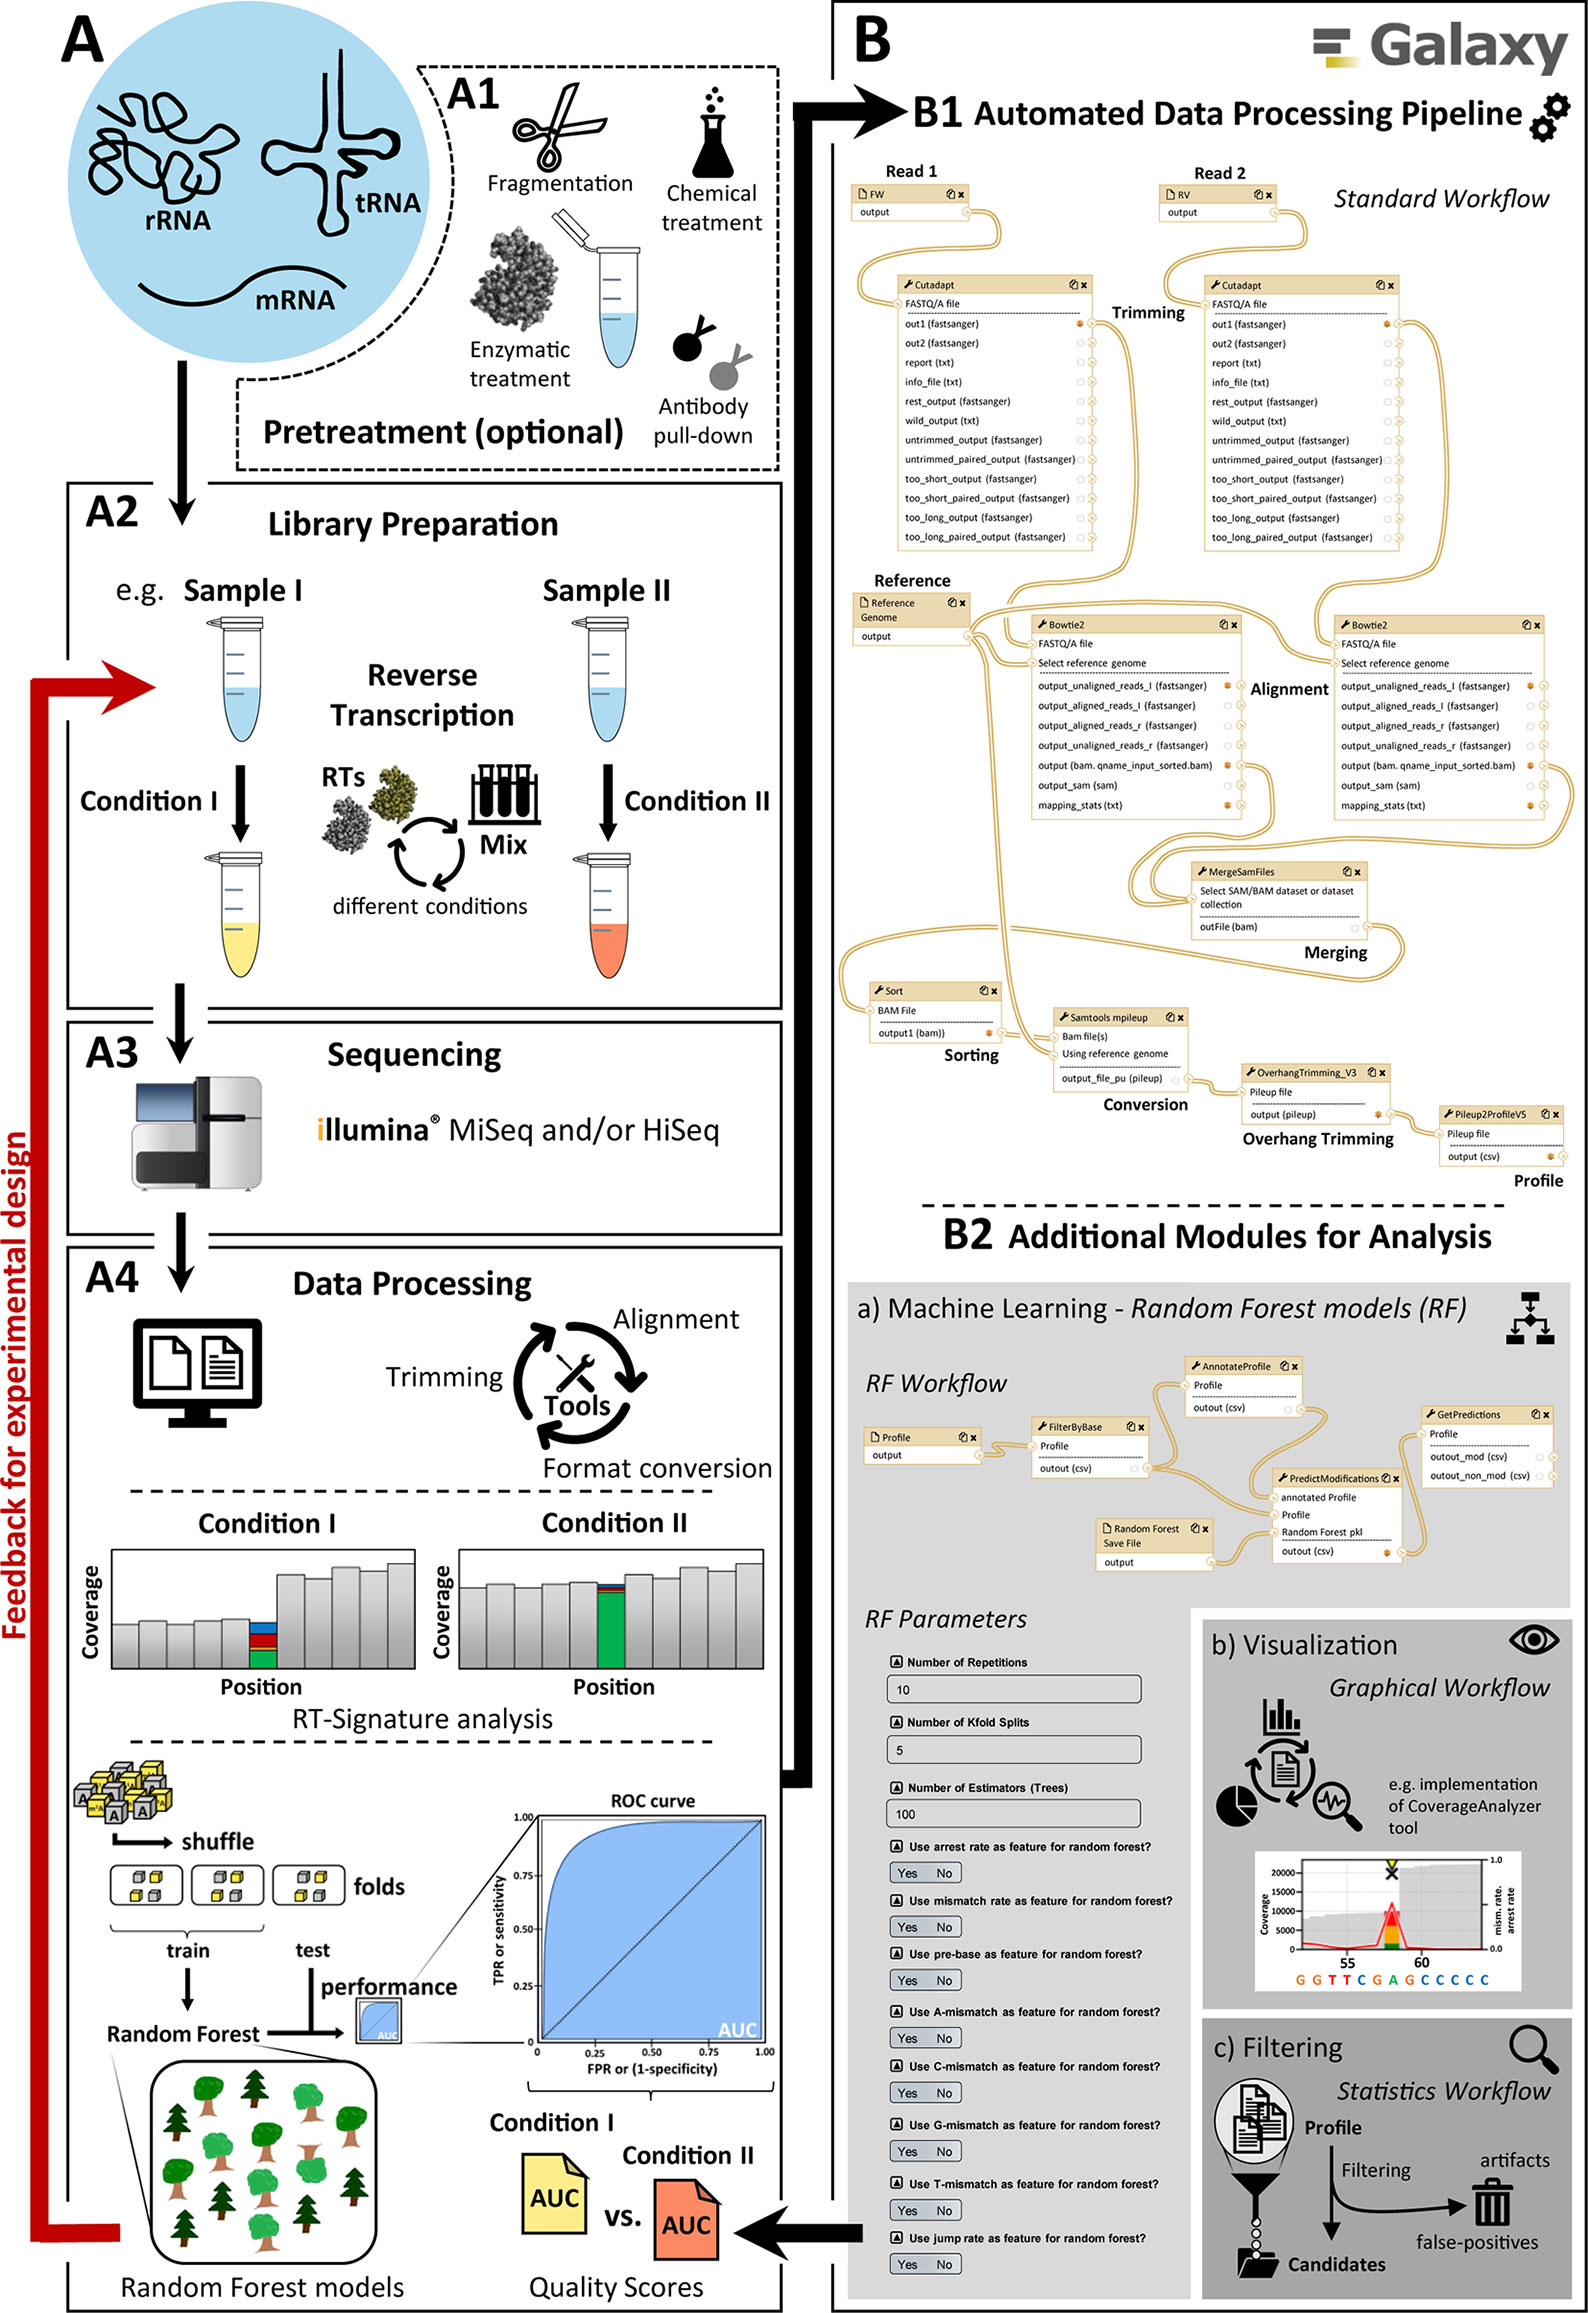
Figure 1 Main overview of the modification calling pipeline. A diagram showing the different steps for creating and analyzing RNA-Seq data. The pipeline has two parts: (A) general workflow for the processing of RNA samples and (B) the implemented automated graphical workflow system with the available modules for bioinformatics data analysis. (A) consists of (A1) possible and partly necessary pretreatments for different RNA species, (A2) library preparation with the possibility of adaptations (e.g. conditions for reverse transcription), (A3) sequencing with Illumina sequencing platforms (e.g. MiSeq/NextSeq and HiSeq), and (A4) data processing including basic data treatment like adapter trimming, alignment, and format conversion, as well as data analysis (e.g. machine learning and RT-signature analysis). The elaborate data processing (A4) was fully automated in (B) by using the open-source Galaxy platform to create and provide a quick and user-friendly feedback mechanism to optimize the experimental design, sample preparation, and data processing. The standard workflow (B1) is supplemented by various additional modules (B2) including workflows for (a) machine learning, (b) visualization, and (c) filtering.
To address this shortcoming, we here present an automated workflow implementation based on Galaxy (Afgan et al., 2018), whose components are depicted in Figure 1B. The Galaxy implementation provides a first module (B1) for the automation of typical and recurrent RNA-Seq–associated operations such as trimming and mapping. While these operations can be customized to accommodate a range of data formats, it allows procedurally stable and reproducible treatment of data package of comparable content, such as RNA-Seq data obtained under variegated conditions for library preparation. This, in turn, allows a comparative evaluation of those experimental conditions, as outlined above. The same holds true for subsequent modules (B2), designed and implemented following the requirement for fast comparison of data packages. The implemented tools allow to quantify mismatch, jump, and arrest rates in the relevant transcriptome, thus compiling RT signatures at single-nucleotide resolution. Still automatized, RT signatures of modified RNA nucleotides can be transferred as positive instances for machine learning, along with negative instances, i.e. signatures of unmodified nucleotides. Positive and negative instances are then used to train a Python-based random forest implementation of machine learning, and the performance of the trained machine in modification calling is evaluated and reported as a feedback in a further round of experimental optimization. Finally, with the implementation of a visualization module, graphics can be displayed and extracted for visual examination and comparison of individual sequence segments as well as the entire RNA fragments in a publishable manner.
Materials and Methods
RNA Sequencing Analysis
The present workflow serves as the main process for the analysis of RNA sequencing data in respect to the detection of several modifications. Its Galaxy distribution comes with a number of adjustable elements for variegated workflows, in which the particular element (Workflow RNA_Seq_Standard_Workflow) serves as basis for the remaining workflows and functionalities. Therefore, it is referred to as “standard workflow.” The overall scheme of the workflow is illustrated in Figure 1 (B1) and consists of the following steps:
Preprocessing of Raw Reads (Trimming)
The raw reads from the sequencing data (stored in fastq-format) are first subjected to removal of auxiliary sequences such as adapters, barcodes, and unique molecular identifiers (UMIs). For this task, the workflow uses the Cutadapt trimming software (Martin, 2011). Due to the necessity to remove multiple sequences from the raw reads, their respective arrangement, and the configuration of Cutadapt, the trimming is separated into multiple steps. In a typical Illumina paired-end sequencing run, the forward and reverse reads are stored in individual fastq files; the reads show slightly different characteristics concerning the auxiliary elements; hence, the trimming for forward and reverse reads is performed separately. The first substep in the trimming process consists of the removal of Illumina adapter sequences. In a second step, terminal barcode sequences and UMIs (Miner et al., 2004; McCloskey et al., 2007; Casbon et al., 2011) are cut from the raw reads.
Alignment
Mapping to a given sequence reference file is performed with Bowtie 2 (Langmead and Salzberg, 2012). Again, this process is performed separately for forward and reverse reads (–nofw/–norc option) and therefore in single-end mode. For the detection of RT-impairing modifications like m1A, it is necessary to allow for mismatches (One mismatch [“N1”] allowed in seed length of 6 [“L6”]). Values are tailored toward tRNAs (e.g. high amounts of RT-impairing modifications). Additionally, if the evaluation is performed on samples containing a large number of modifications (affecting the RT), the amount of allowed mismatch occurrences has to be increased by adjusting the seed-length option (Bowtie standard parameters allow for one mismatch within a given seed; hence, seed length has to be decreased for highly modified samples). The alignment is stored in BAM format.
The two BAM files, one for the forward and one for the reverse reads correspondingly, are merged using the SAMtools (Li et al., 2009) “merge” function, and the aligned reads are sorted according to chromosomal coordinates.
File Conversion and Overhang Trimming
Further analysis steps require information of mapped reads at single base resolution for each position in the reference sequence, as every position is evaluated for mismatch and arrest properties. Accordingly, the BAM-file is converted into Pileup-format using the SAMtools (Li et al., 2009) “mpileup” function. As described in Tserovski et al. (2016), the library preparation includes a step in which C-tailing at the 3′ end of the cDNA strand was performed. Due to this tailing step in the library preparation protocol, despite the previous trimming steps, some tailing bases (overhangs) can remain and were then aligned with the reads. As these overhangs can impede the detection of modified sites, they have to be removed from the alignment. Therefore, a Python-based algorithm for postalignment manipulation was developed. This algorithm finds read-ending bases and compares them to reference base and removes them in case of a mismatch. After the overhang trimming, the data are still stored in Pileup format.
Feature Extraction
Information on each position of the reference is then extracted from the Pileup format and subsequently stored in a format termed “Profile” (example shown in Table 1). The information consists of the following features:
Arrest rate: Drop in coverage in relation to the preceding (N+1) position (arrest).
Mismatch rate: Relative amount of mapped nucleobases not matching the respective base in the reference (mismatch).
Jump rate: Relative amount of deletions (bases left out during reverse transcription) occurring at the given position in the reference (jump). A distinction is made between deletions at the given position in the reference (single jumps direct), deletions at the neighboring position (−1 position) (single jump delayed), and deletions at the given position, as well as the neighboring position (double jump).
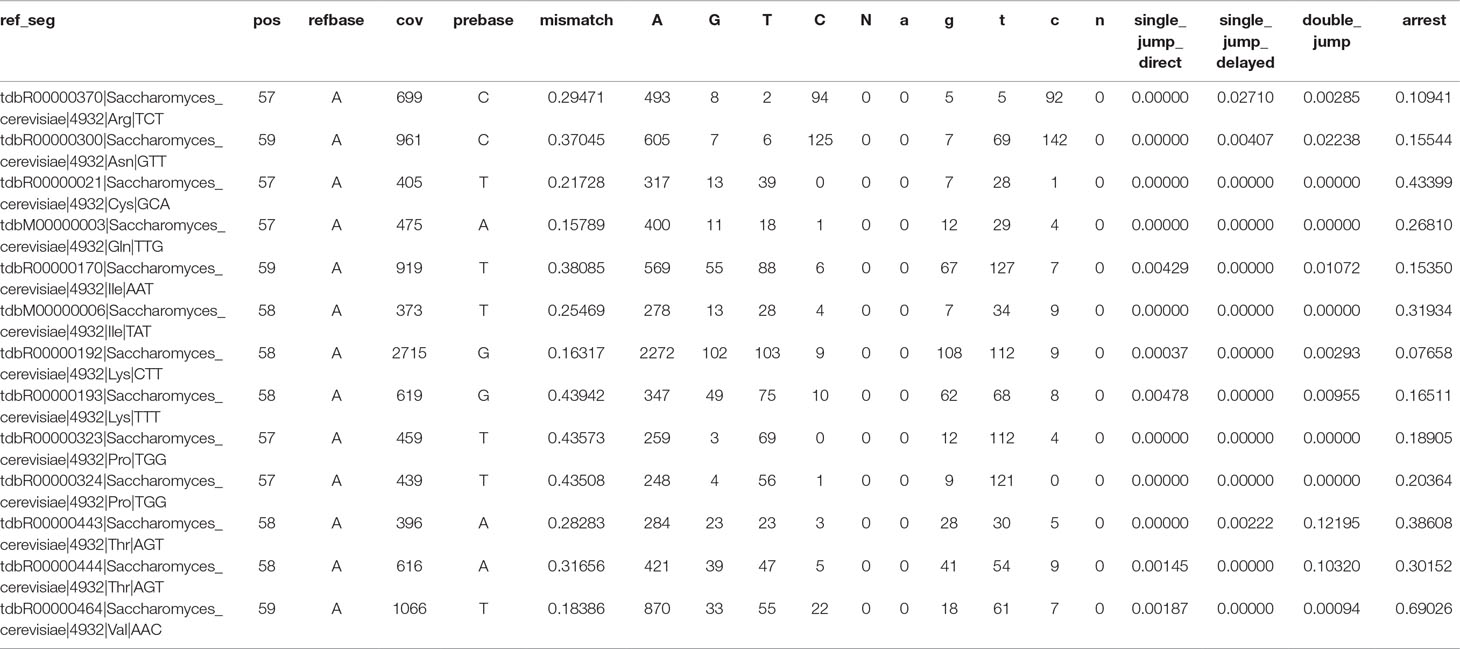
Table 1 Extracted Profile file after filtering with Demethylation_relative_change module with all m1A candidate positions.
In addition, the reference name (ref seg), reference base (refbase), reference position (pos), and coverage at the respective position (cov) are stored in the Profile. Also included is detailed information on the alignment numbers for each type of base (A, C, G, T) and unknown read bases (N), as well as the type of base preceding the position (prebase) in question.
In many cases, modified positions heavily differ from nonmodified positions in these key characteristics. Nonmodified bases are not expected to cause arrest and mismatch signals (at least not at high levels), making these features a main target for differentiation between modified and unmodified sites.
Downstream Analysis
The generation of the Profile file concludes the standard workflow. From this point on, the proceedings heavily vary depending on the question being investigated, with the Profile file serving as the starting point. Options for downstream analysis are shown in Figure 1 (B2) and include the following:
Filtering
An option for further evaluation is a simple filtering process. Here, adenosine instances can be separated into two categories, namely, “likely m1A” and “likely non-m1A.” The selectable filter criteria include threshold values for mismatch and arrest rates, minimum coverage, and the nucleobase of interest. In most cases, the arrest and mismatch rates should be sufficient to separate m1As from non-m1As.
Another filtering option includes the comparison of two samples after different treatment. In our Galaxy pipeline, the sample comparison after enzymatic or chemical treatment is implemented wherein one sample serves as a reference (Figure 2). The algorithm calculates the absolute and relative changes in the mismatch rate between 2 samples for each position and filters by means of adjustable thresholds for changes and coverage. The resulting Profile file contains candidates filtered according to the selected thresholds. This module can be used for verification of modification candidates by e.g. applying enzymatic or chemical treatment to remove the alterations at the Watson–Crick face impeding reverse transcription and therefore decreasing the mismatch rate (exemplary analysis shown in Results section).
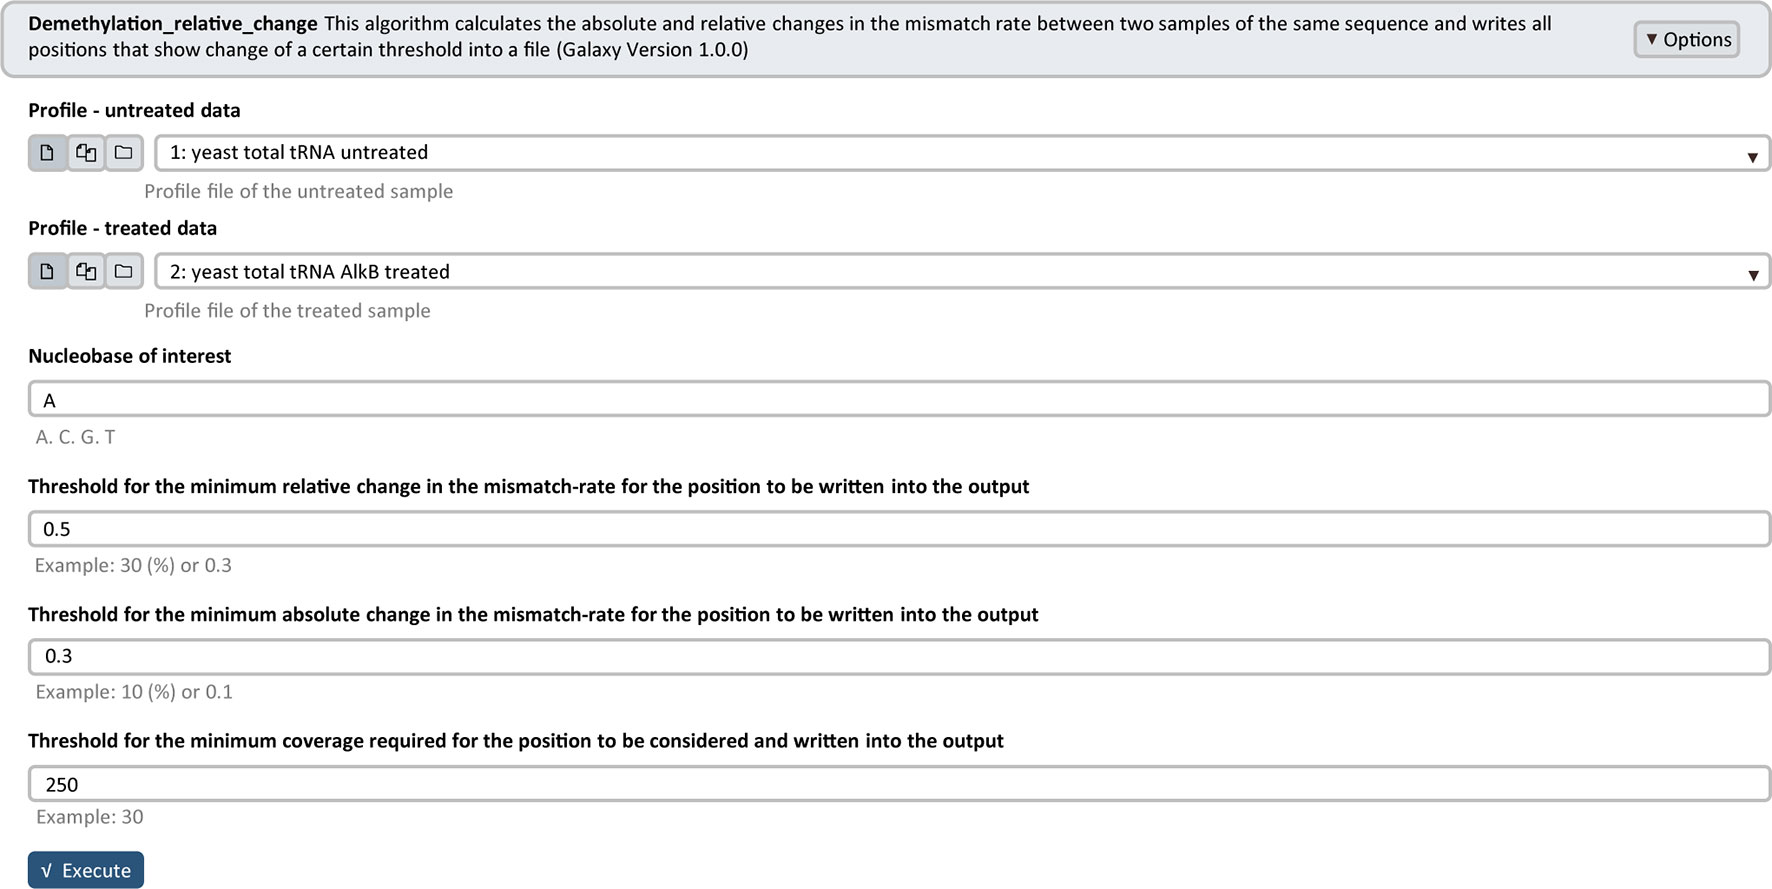
Figure 2 Galaxy Filtering module Demethylation_relative_change interface. As input, two Profile files, yeast total tRNA untreated and yeast total tRNA AlkB treated, are used with the following selected parameters for filtering: adenosine (A) as nucleobase of interest, 0.5 or 50 (%) and 0.3 or 30 (%) as thresholds for the minimum relative and absolute changes in the mismatch rate and 250 as threshold for the minimum coverage required.
Machine Learning
For the prediction of m1A and other modifications, a machine learning model for binary classification is included in the Galaxy distribution (Workflow Workflow_Prediction). The associated workflows for training and prediction are based on a random forest model from the “scikit-learn” Python package (Pedregosa et al., 2011). For the training process, the positive class (modified bases) and negative class (nonmodified bases) are given as input in a 1:1 ratio. This ratio is used in order to counter the tendency of RF models to bias toward the majority class. This RF property frequently leads to false negatives for the positive class (the modifications) when making predictions. Importantly, this bias is not necessarily reflected by the evaluation scores. The random forest performs e.g. 10 repetitions of a 5-fold cross-validation. These parameters can be adjusted as required for different models. The model’s performance is measured by the area under the receiver operating characteristic curve. A detailed description of the concept of the random forest model used for this workflow can be found in Hauenschild et al. (2015). The prediction workflow requires a trained random forest model and a Profile file as input and performs a binary classification.
Visualization
A graphical representation of the position of interest within sequence context can be created using a Python-based script (Workflow Visualize_V3), extracted from the CoverageAnalyzer tool (Hauenschild et al., 2016). The user can plot a sequence containing up to 1000 bases where the leftmost and rightmost bases can be selected by position. In addition, various sizes can be adjusted, including the width and height of the plot, the font size, and the size of markers within the graphic (exemplary plot shown in Figure 3).
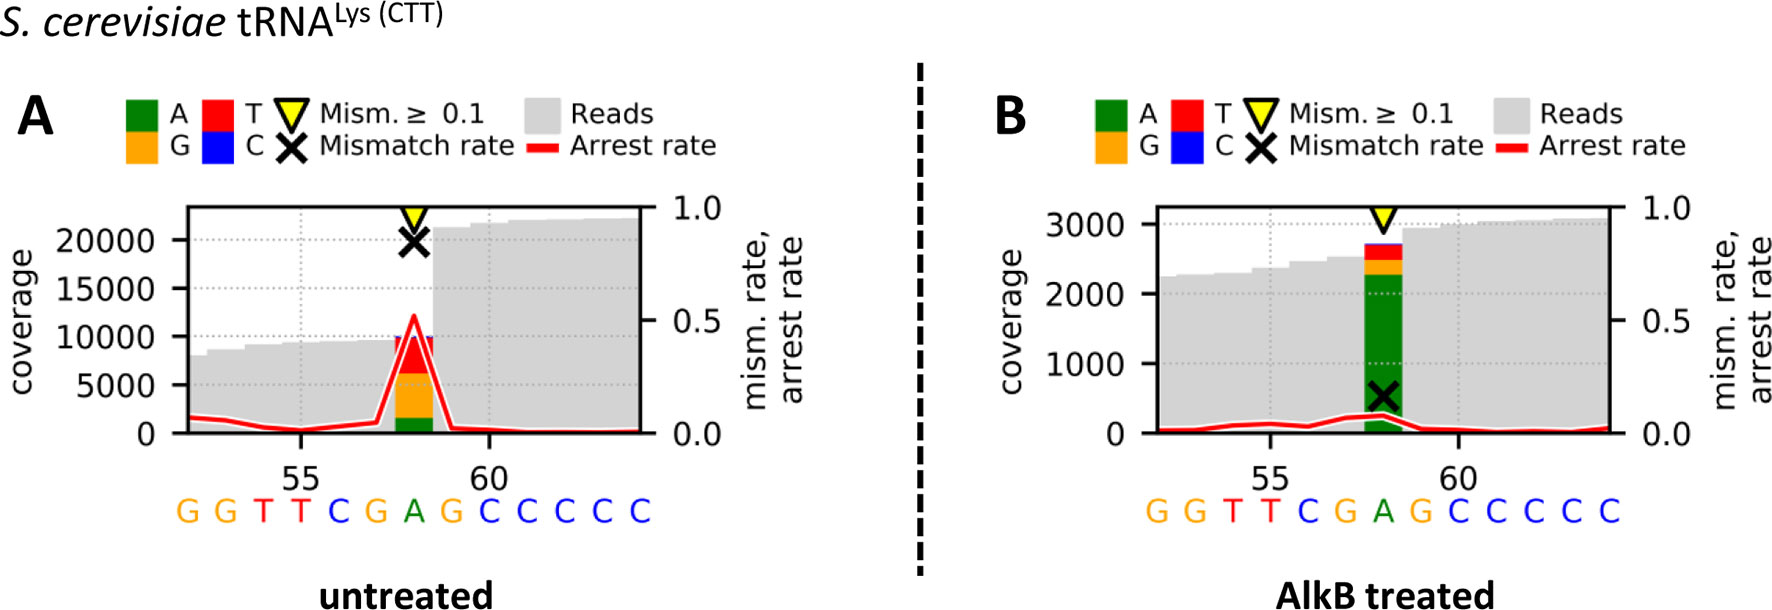
Figure 3 Graphical plots of untreated (A) and AlkB-treated (B) yeast tRNALys (CTT) using the additional module Visualize_V3 for visualization. Sites with error rates of more than 10% are highlighted with yellow arrows, with colored bars indicating the nature of the reads. Mismatch rates are depicted as black crosses, and arrest rates as red lines. The m1A site is located in the middle of the shown sequence segment at position 58.
RNA Sequencing—Sample Preparation
Library Preparation and Sequencing
Sample preparation and sequencing are performed according to a previously published protocol (Hauenschild et al., 2015; Tserovski et al., 2016). This library preparation protocol includes the possibility to catch abortive products during the reverse transcription step, important for the detection of modifications impeding reverse transcription and generating a certain amount of RT stop products. The protocol also allows the adaptation of almost all necessary steps for preparation of RNA-Seq libraries, including adapter ligations, reverse transcription, and polymerase chain reaction. This allows fast screening of different conditions during sample preparation. Special experimental changes (e.g. buffer changes or pretreatment of the RNA) during library preparation for the preparation of our shown exemplary data are mentioned in the Results section.
Results
Enzymatic Demethylation of m1a Sites in Yeast tRNA With AlkB
In an exemplary sample processing, two samples of total tRNA from Saccharomyces cerevisiae were used for sample preparation, sequencing, data processing, and analysis. One of the samples had been subjected to pretreatment (Figure 1 [A1]) with α-ketoglutarate–dependent dioxygenase AlkB that “repairs” alkylated DNA and RNA containing 3-methylcytosine (m3C) or 1-methyladenine (m1A) by oxidative demethylation. Protein preparation and sample treatment were performed according to a previously published protocol (Zheng et al., 2015). The second sample was used as reference. Both samples were then used as starting material for library preparation and subsequent sequencing (Figure 1 [A2, A3]). Library preparation and sequencing were performed as described in our published workflow by Hauenschild et al. (2015) and Tserovski et al. (2016). The sequencing output data packages in FASTQ format were then processed with the standard automated Galaxy workflow RNA_Seq_Standard_Workflow (Figure 1 [B1]) to create Profile files for downstream analysis.
Filtering for Demethylation Candidates
The Profile files were used for statistical analysis. Figure 2 illustrates the Galaxy Filtering module Demethylation_relative_change, which was used to filter and extract all positions that show an absolute and relative change in the mismatch rate of a certain threshold between the untreated and AlkB-treated sample. Table 1 shows the extracted Profile file with all candidate positions after filtering. From our sample comparison, with our selected thresholds, 13 candidate positions fulfilling the requirements were filtered out, with high probability to be m1A sites.
Visualization of Demethylation Candidates
In addition, the Profile files were used in the visualization workflow Visualize_V3 to obtain graphical plots for each sample. The visual comparison of the untreated (A) and AlkB-treated (B) yeast tRNALys (CTT), which includes an m1A at position 58, is shown in Figure 3. The strong decreases of the mismatch and arrest rate from 0.845 and 0.518 to 0.163 and 0.077 after AlkB treatment at position 58 of the shown sequence segment indicate a successful removal of the methylation and therefore enabled valid reverse transcription. Such changes in the reverse transcription signature are considered as effective validation of the actual presence of m1A at the considered position.
Influence of Mn2+ on the RT Signature at m1A Sites in Yeast tRNA
In a second exemplary sample processing, four samples of total tRNA from S. cerevisiae were used for sample preparation, sequencing, data processing, and analysis. The samples were used for library preparation and differed in the reverse transcription step (Figure 1 [A2]). For reverse transcription, we used SuperScript® III Reverse Transcriptase (Thermo Fisher Scientific, Germany) in four different buffer mixtures to investigate the influence of Mn2+ during reverse transcription (Zhou et al., 2018). Sample A served as a reference and was prepared according to the supplier’s manual, using the standard RT buffer with Mg2+. For the other three test samples, custom-made RT buffers, including the standard buffer components, and Mn2+ in different concentrations (0.5 mM [B], 1.0 mM [C] or 3.0 mM [D]) instead of Mg2+, were used. Library preparation and sequencing were performed as described in our published workflow by Hauenschild et al. (2015) and Tserovski et al. (2016). The sequencing output data packages in FASTQ format were then processed with the standard automated Galaxy workflow RNA_Seq_Standard_Workflow (Figure 1 [B1]) to create Profile files for downstream analysis.
Visualization of tRNAAsn (GTT) Using Mg2+ or Mn2+ as Buffer Components for Reverse Transcription During Library Preparation
The Profile files were used in the visualization workflow Visualize_V3 to obtain graphical plots for each sample. The visual comparison of the reference (Figure 4A) and the Mn2+ (0.5 mM [Figure 4B], 1.0 mM [Figure 4C], or 3.0 mM [Figure 4D]) yeast tRNAAsn (GTT) samples, including an m1A at position 59, is shown in Figure 4. The high mismatch rates (≥90%) throughout all samples are driven by the prebase influence (Hauenschild et al., 2015), leading to a consistently high C mismatch. Considering the m1A at position 59, the strong decrease in the arrest rate at position 59 from 0.846 (A) over 0.869 (B) and 0.704 (C) down to 0.070 (D) indicates an increasing read-through capability of the reverse transcriptase due to a stabilizing effect by increased Mn2+ concentrations. In addition, by exchanging Mg2+ through Mn2+, the number of jumps (single_jump_direct, single_jump_delayed, double_jump) increases with higher Mn2+ concentrations, visible in Table 2, as well as in the graphical plots by coverage drops (through deletions/jumps), especially visible in Figure 4D.
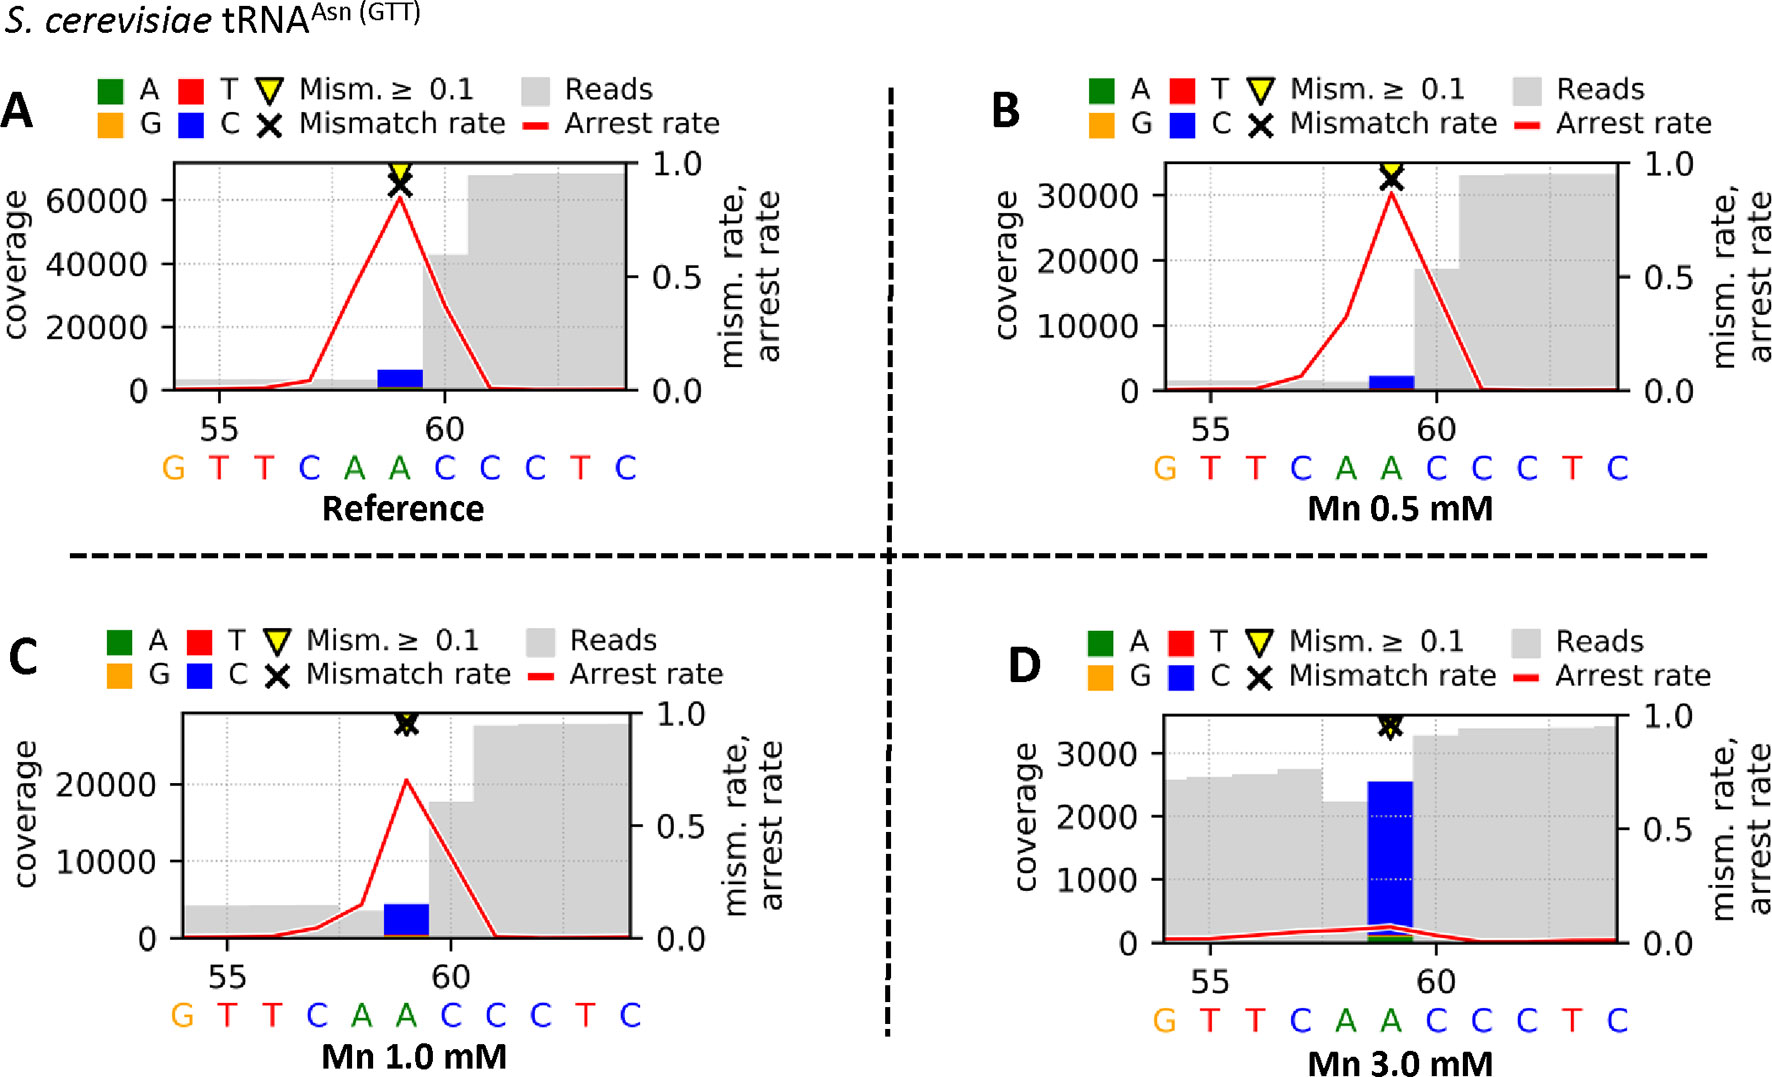
Figure 4 Graphical plots of yeast tRNAAsn (GTT), which was used for library preparation, visualized by using the additional module Visualize_V3. The reverse transcription step was performed by using SuperScript® III Reverse Transcriptase in different reaction buffers. The supplier’s standard reaction buffer (First Strand Synthesis buffer) with Mg2+ serves as reference (A), and the tested buffer mixtures differ by increased concentrations of Mn2+ [0.5 mM (B), 1.0 mM (C), 3.0 mM (D)] as Mg2+ substitute. Sites with error rates of more than 10% are highlighted with yellow arrows, with colored bars indicating the nature of the reads. Mismatch rates are depicted as black crosses, and arrest rates as red lines. The m1A site is located in the middle of the shown sequence segment at position 59.
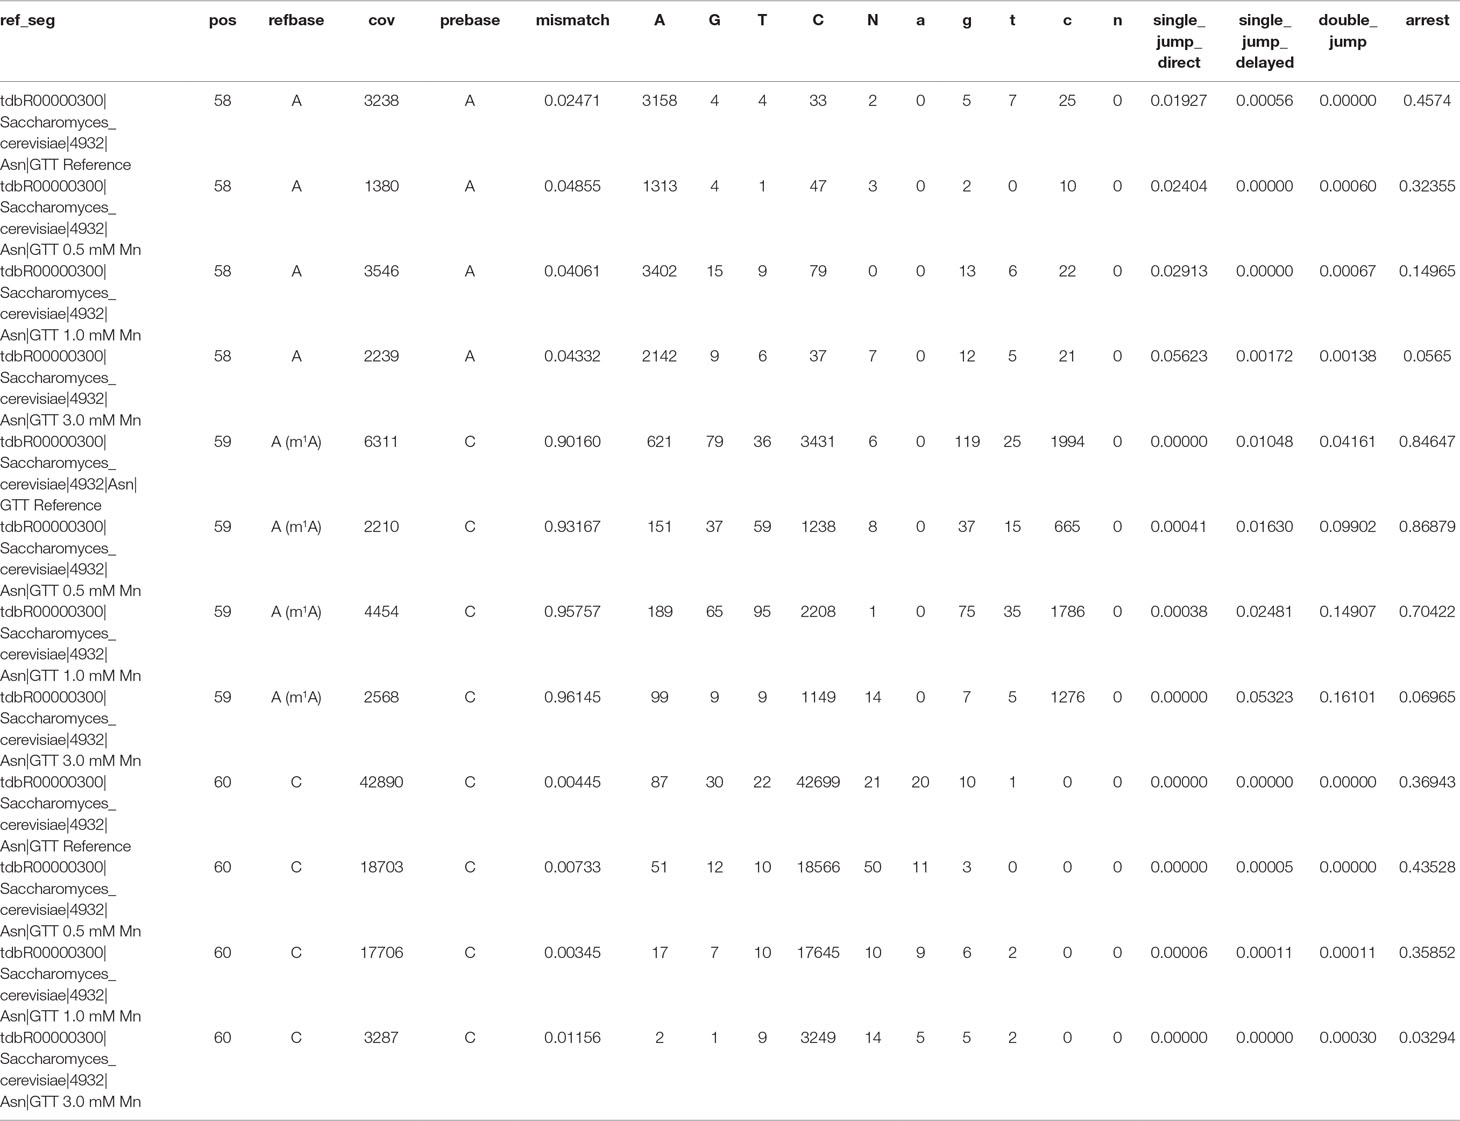
Table 2 Extracted Profile data for yeast tRNAAsn (GTT) after library preparation with 4 different buffer mixtures for the reverse transcription step. Shown are data for positions 58, 59 (m1A), and 60.
Discussion
We here present a versatile, user-friendly graphical workflow system for modification calling to analyze RNA-Seq data. It can also be used to analyze any high-throughput data as long as they follow the formats listed in this technology report. Although this package allows creation and implementation of various workflows for processing and analysis, the application of this pipeline has limitations, which we would like to indicate hereafter and to point out possible solutions for adjustment.
Limitations and Adjustability
The limitations of the workflow pertain mostly to the specific characteristics of the library preparation protocol. The workflow is tailored to the analysis of short RNA sequences, mostly tRNAs, and uses a “splice unaware” alignment because in the examples given, splicing is irrelevant. Accordingly, analysis of transcriptomic data should use an alignment tool that is specifically tailored to mapping of splice variants (“splice aware”).
Furthermore, algorithms such as the overhang trimming are not optimized for parallelization, which can lead to very long runtimes for the analysis, a problem potentially exacerbated by the large size of transcriptomic input data. Of course, as this Galaxy distribution makes use of the local computer’s processing power, large-scale analysis should not be performed on a device with weak computing capabilities. This Galaxy distribution, developed in a Unix environment, has not been tested on Windows platforms.
Detection efficiency of modified ribonucleotides is highly dependent on the dataset. tRNA samples show a high number of RT-impairing modifications, which can negatively affect the RT signals for surrounding positions, making it more difficult to detect modified positions of interest through filtering or machine learning. We also observed that detectability is highly dependent on read coverage. In some cases, modified low-coverage sites could not be detected as the RT signatures were noisy and thus not very pronounced. Moreover, the machine learning and prediction processes require an adequate number of training instances for a given modification. Modifications that are present only in low amounts are not compatible with the available machine learning process. Lastly, the workflow here presented was created and optimized to detect modifications, which naturally impair reverse transcription. However, this does not preclude modifications, which are made accessible for analysis through changes in the structural or chemical characteristics in a pretreatment by generating RT events like increased mismatch and arrest rates. Examples include the generation of RT signatures for N6-methyladenosine (m6A) with an engineered polymerase with reverse transcriptase activity to induce mutations at m6A sites (Aschenbrenner et al., 2018), the enzymatic introduction of a bio-orthogonal propargyl group to trigger RT termination for m6A detection (Hartstock et al., 2018), and the site-specific installation of an allyl group to the N6-position of adenosines, spontaneously inducing the formation of N1,N6-cyclized adenosine by iodination to create mutations to differentiate m6A, which is inert to allyl labeling, from adenosines at individual RNA sites (Shu et al., 2017).
While the available workflows were tailored toward our specific library preparation protocol and were created with the goal of detecting m1A, the workflows are easily adjustable for analysis of other modifications and other protocols. For example, the standard workflow also works without the overhang-trimming step, which allows the user to remove this step when using other library preparation protocols. In addition, the Galaxy interface allows for user-friendly customization of many input parameters. The customization is not limited to the software packages such as Cutadapt (Martin, 2011) and Bowtie (Langmead and Salzberg, 2012), but also includes individual Python scripts for the multiple workflows. Accordingly, adapter and barcode sequences can be replaced to fit the library preparation protocol, and other tasks like quality trimming can be performed. For the Python scripts, the range of adjustable parameters allows the user to change the modification of interest, filter criteria, features, and parameters for the machine learning model as well as several options for the visualization.
Furthermore, existing workflows can be easily rearranged to suit the desired analysis. The associated Galaxy toolshed allows for the installation of additional bioinformatics programs and enables the user to create entirely new workflows. For example, other alignment tools can be implemented that may improve or accelerate data processing or allow transcriptome-wide analysis for other data packages. In the provided tutorial, the installation of new software is described. As an example, we have incorporated the CUSHAW2 tool (Liu et al., 2012), which allows significant acceleration of the alignment speed, as a substitute for Bowtie 2. Our performance assessment showed that the alignment process could be sped up by a factor of up to six of the same datasets and on the same hardware platform. By reducing the time of the rather costly alignment step of the pipeline, it is possible to increase overall throughput. In return, the analysis of larger datasets is feasible within the same time in order to further increase the accuracy of the obtained results.
Conclusion/Summary
Machine learning as an efficient tool for data mining is currently receiving enormous attention, which also extends to high-throughput sequencing data. Based on previous progress in machine learning for modification calling (Hauenschild et al., 2015), we here present a workflow that not only automatizes all steps, but which also, in principle, allows adaptation to “nonnatural” modifications, i.e. bioconjugate derivatives of RNA nucleotides after treatment with a chemical reagent or enzymes (Ofengand and Bakin, 1997; Carlile et al., 2014; Schwartz et al., 2014; Shu et al., 2017; Hartstock et al., 2018). In the course of development of reagent- and enzyme-based mapping procedures, repeated cycles of optimization, e.g. of reaction conditions, are necessary, but an assessment of modification calling performance for a given set of reaction conditions is extremely time consuming. The workflow here presents a solution to this bottleneck; while developed using the naturally occurring modification m1A as an example, it is conceived as such to be easily adaptable to the development of chemical reagents for modification mapping.
Data Availability
The graphical workflow system, an instruction manual, and a tutorial are available at: https://github.com/HelmGroup, Repository: Galaxy_modification_calling.
Operating system(s): Linux, Programming language for custom scripts: Python, Other requirements: Docker (software) needs to be installed.
The AlkB test datasets analyzed and generated for this study can be found in the repository: Galaxy_modification_calling (https://github.com/HelmGroup/Galaxy_modification_calling/tree/master/TestData/AlkB).
Compressed files are provided in PKZIP and ZIP format and were compressed with 7-Zip.
Files: total_tRNA_yeast_untreated_R1.fastq (untreated yeast total tRNA – Read 1)
total_tRNA_yeast_untreated_R2.fastq (untreated yeast total tRNA – Read 2)
total_tRNA_yeast_AlkB_treated_R1.fastq (AlkB-treated yeast total tRNA – Read 1)
total_tRNA_yeast_AlkB_treated_R2.fastq (AlkB-treated yeast total tRNA – Read 2)
total_tRNA_yeast_untreated.profile (untreated yeast total tRNA – Profile)
total_tRNA_yeast_AlkB_treated.profile (AlkB-treated yeast total tRNA – Profile)
total_tRNA_yeast_reference.fasta (Reference total tRNA yeast)
Files for testing of the machine learning workflow can be found in the repository: Galaxy_modification_calling (https://github.com/HelmGroup/Galaxy_modification_calling/tree/master/TestData/Prediction).
Files: Known_m1A_sites_yeast (list of known m1A sites)
total_tRNA_yeast_untreated.profile (untreated yeast total tRNA – Profile)
All other data are available from the corresponding authors upon reasonable request.
Author Contributions
Conception and design: LS, SW, and MH; biomolecular experiments: SW, MK, and PJ; sequencing service: LA, VM, and YM; analysis and interpretation of the data: LS, SW, MK and MH; development and testing of the Galaxy modules: LS, TK, SN, BS, MK and AH; writing of the paper: LS, SW, and MH; proofreading and discussion: TS, BS, and AH.
Funding
This work was supported by DFG grants HE3397/13-2, by DIP Grant RE 4193/1-1/RO 4681/6-1, and by JPND “RNA NEURO”/Bmbf grant FKZ: 01ED1804 and by the EPITRAN COST initiative (CA16120).
Conflict of Interest Statement
The authors declare that the research was conducted in the absence of any commercial or financial relationships that could be construed as a potential conflict of interest.
Acknowledgments
We are grateful to Valérie Igel-Bourguignon (NGS Core Facility, Biopôle, University of Lorraine, Nancy, France) for excellent technical assistance. We further thank the help of Hannah Back, BSc (Biomedical Chemistry, Johannes Gutenberg-University, Mainz, Germany), for experimental assistance, as well as Dr. Lyudmil Tserovski and Dr. Ralf Hauenschild for their contributions during the early stages of this project. The pET30a-AlkB plasmid was a gift from Tao Pan (Addgene plasmid #79050; http://n2t.net/addgene:79050; RRID: Addgene_79050).
References
Afgan, E., Baker, D., Batut, B., van den Beek, M., Bouvier, D., Cech, M., et al. (2018). The Galaxy platform for accessible, reproducible and collaborative biomedical analyses: 2018 update. Nucleic Acids Res. 46, W537–W544. doi: 10.1093/nar/gky379
Aschenbrenner, J., Werner, S., Marchand, V., Adam, M., Motorin, Y., Helm, M., et al. (2018). Engineering of a DNA polymerase for direct m6A sequencing. Angew. Chem. Int. Edit. 57, 417–421. doi: 10.1002/anie.201710209
Byrne, A., Beaudin, A. E., Olsen, H. E., Jain, M., Cole, C., Palmer, T., et al. (2017). Nanopore long-read RNAseq reveals widespread transcriptional variation among the surface receptors of individual B cells. Nat. Commun. 8, 16027. doi: 10.1038/ncomms16027
Carlile, T. M., Rojas-Duran, M. F., Zinshteyn, B., Shin, H., Bartoli, K. M., Gilbert, W. V. (2014). Pseudouridine profiling reveals regulated mRNA pseudouridylation in yeast and human cells. Nature 515, 143–146. doi: 10.1038/nature13802
Casbon, J. A., Osborne, R. J., Brenner, S., Lichtenstein, C. P. (2011). A method for counting PCR template molecules with application to next-generation sequencing. Nucleic Acids Res. 39, e81. doi: 10.1093/nar/gkr217
Dominissini, D., Nachtergaele, S., Moshitch-Moshkovitz, S., Peer, E., Kol, N., Ben-Haim, M. S., et al. (2016). The dynamic N1-methyladenosine methylome in eukaryotic messenger RNA. Nature 530, 441–446. doi: 10.1038/nature16998
Ebhardt, H. A., Tsang, H. H., Dai, D. C., Liu, Y., Bostan, B., Fahlman, R. P. (2009). Meta-analysis of small RNA-sequencing errors reveals ubiquitous post-transcriptional RNA modifications. Nucleic Acids Res. 37, 2461–2470. doi: 10.1093/nar/gkp093
Findeiss, S., Langenberger, D., Stadler, P. F., Hoffmann, S. (2011). Traces of post-transcriptional RNA modifications in deep sequencing data. Biol. Chem. 392, 305–313. doi: 10.1515/bc.2011.043
Garalde, D. R., Snell, E. A., Jachimowicz, D., Sipos, B., Lloyd, J. H., Bruce, M., et al. (2018). Highly parallel direct RNA sequencing on an array of nanopores. Nat. Methods 15, 201–206. doi: 10.1038/nmeth.4577
Hartstock, K., Nilges, B. S., Ovcharenko, A., Cornelissen, N. V., Püllen, N., Lawrence-Dörner, A.-M., et al. (2018). Enzymatic or in vivo installation of propargyl groups in combination with click chemistry for the enrichment and detection of methyltransferase target sites in RNA. Angew. Chem. Int. Edit. 57, 6342–6346. doi: 10.1002/anie.201800188
Hauenschild, R., Tserovski, L., Schmid, K., Thuring, K., Winz, M. L., Sharma, S., et al. (2015). The reverse transcription signature of N-1-methyladenosine in RNA-Seq is sequence dependent. Nucleic Acids Res. 43, 9950–9964. doi: 10.1093/nar/gkv895
Hauenschild, R., Werner, S., Tserovski, L., Hildebrandt, A., Motorin, Y., Helm, M. (2016). CoverageAnalyzer (CAn): a tool for inspection of modification signatures in RNA sequencing profiles. Biomolecules 6, 42. doi: 10.3390/biom6040042
Helm, M., Motorin, Y. (2017). Detecting RNA modifications in the epitranscriptome: predict and validate. Nat. Rev. Genet. 18, 275–291. doi: 10.1038/nrg.2016.169
Helm, M., Brulé, H., Degoul, F., Cepanec, C., Leroux, J. P., Giegé, R., et al. (1998). The presence of modified nucleotides is required for cloverleaf folding of a human mitochondrial tRNA. Nucleic Acids Res. 26, 1636–1643. doi: 10.1093/nar/26.7.1636
Helm, M., Giege, R., Florentz, C. (1999). A Watson–Crick Base-Pair-Disrupting Methyl Group (m′A9′) is sufficient for cloverleaf folding of human mitochondrial tRNA(lys). Biochemistry 38, 13338–133346. doi: 10.1021/bi991061g
Langmead, B., Salzberg, S. L. (2012). Fast gapped-read alignment with Bowtie 2. Nat. Methods 9, 357–359. doi: 10.1038/nmeth.1923
Lempereur, L., Nicoloso, M., Riehl, N., Ehresmann, C., Ehresmann, B., Bachellerie, J. P. (1985). Conformation of yeast 18S rRNA. Direct chemical probing of the 5′ domain in ribosomal subunits and in deproteinized RNA by reverse transcriptase mapping of dimethyl sulfate–accessible. Nucleic Acids Res. 13, 8339–8357. doi: 10.1093/nar/13.23.8339
Li, H., Handsaker, B., Wysoker, A., Fennell, T., Ruan, J., Homer, N., et al. (2009). The Sequence Alignment/Map format and SAMtools. Bioinformatics 25, 2078–2079. doi: 10.1093/bioinformatics/btp352
Li, X., Xiong, X., Zhang, M., Wang, K., Chen, Y., Zhou, J., et al. (2017). Base-resolution mapping reveals distinct m(1)A methylome in nuclear- and mitochondrial-encoded transcripts. Mol. Cell 68, 993–1005, e1009. doi: 10.1016/j.molcel.2017.10.019
Liu, F., Clark, W., Luo, G., Wang, X., Fu, Y., Wei, J., et al. (2016). ALKBH1-mediated tRNA demethylation regulates translation. Cell 167, 1897. doi: 10.1016/j.cell.2016.11.045
Liu, Y., Schmidt, B., Maskell, D. L. (2012). CUSHAW: a CUDA compatible short read aligner to large genomes based on the Burrows–Wheeler transform. Bioinformatics 28, 1830–1837. doi: 10.1093/bioinformatics/bts276
Martin, M. (2011). Cutadapt removes adapter sequences from high-throughput sequencing reads. EMBnet.journal 17, 10. doi: 10.14806/ej.17.1.200
McCloskey, M. L., Stoger, R., Hansen, R. S., Laird, C. D. (2007). Encoding PCR products with batch-stamps and barcodes. Biochem. Genet. 45, 761–767. doi: 10.1007/s10528-007-9114-x
Miner, B. E., Stoger, R. J., Burden, A. F., Laird, C. D., Hansen, R. S. (2004). Molecular barcodes detect redundancy and contamination in hairpin-bisulfite PCR. Nucleic Acids Res. 32, e135. doi: 10.1093/nar/gnh132
Motorin, Y., Muller, S., Behm-Ansmant, I., Branlant, C. (2007). Identification of modified residues in RNAs by reverse transcription–based methods. Methods Enzymol. 425, 21–53. doi: 10.1016/S0076-6879(07)25002-5
Ofengand, J., Bakin, A. (1997). Mapping to nucleotide resolution of pseudouridine residues in large subunit ribosomal RNAs from representative eukaryotes, prokaryotes, archaebacteria, mitochondria and chloroplasts. J. Mol. Biol. 266, 246–268. doi: 10.1006/jmbi.1996.0737
Pedregosa, F., Varoquaux, G., Gramfort, A., Michel, V., Thirion, B., Grisel, O., et al. (2011). Scikit-learn: machine learning in Python. J. Mach. Learn. Res. 12, 2825–2830.
Ryvkin, P., Leung, Y. Y., Silverman, I. M., Childress, M., Valladares, O., Dragomir, I., et al. (2013). HAMR: high-throughput annotation of modified ribonucleotides. RNA (New York, NY) 19, 1684–1692. doi: 10.1261/rna.036806.112
Safra, M., Sas-Chen, A., Nir, R., Winkler, R., Nachshon, A., Bar-Yaacov, D., et al. (2017). The m1A landscape on cytosolic and mitochondrial mRNA at single-base resolution. Nature 551, 251–255. doi: 10.1038/nature24456
Saletore, Y., Meyer, K., Korlach, J., Vilfan, I. D., Jaffrey, S., Mason, C. E. (2012). The birth of the epitranscriptome: deciphering the function of RNA modifications. Genome Biol. 13, 175. doi: 10.1186/gb-2012-13-10-175
Schwartz, S., Bernstein, D. A., Mumbach, M. R., Jovanovic, M., Herbst, R. H., Leon-Ricardo, B. X., et al. (2014). Transcriptome-wide mapping reveals widespread dynamic-regulated pseudouridylation of ncRNA and mRNA. Cell 159, 148–162. doi: 10.1016/j.cell.2014.08.028
Shu, X., Dai, Q., Wu, T., Bothwell, I. R., Yue, Y., Zhang, Z., et al. (2017). N6-allyladenosine: a new small molecule for RNA labeling identified by mutation assay. J. Am. Chem. Soc. 139, 17213–17216. doi: 10.1021/jacs.7b06837
Smith, A. M., Jain, M., Mulroney, L., Garalde, D. R., Akeson, M. (2019). Reading canonical and modified nucleobases in 16S ribosomal RNA using nanopore native RNA sequencing. PLoS One 14, e0216709. doi: 10.1371/journal.pone.0216709
Tserovski, L., Marchand, V., Hauenschild, R., Blanloeil-Oillo, F., Helm, M., Motorin, Y. (2016). High-throughput sequencing for 1-methyladenosine (m(1)A) mapping in RNA. Methods (San Diego, Calif.) 107, 110–121. doi: 10.1016/j.ymeth.2016.02.012
Zheng, G., Qin, Y., Clark, W. C., Dai, Q., Yi, C., He, C., et al. (2015). Efficient and quantitative high-throughput tRNA sequencing. Nat. Methods 12, 835–837. doi: 10.1038/nmeth.3478
Zhou, H., Kimsey, I. J., Nikolova, E. N., Sathyamoorthy, B., Grazioli, G., McSally, J., et al. (2016). m(1)A and m(1)G disrupt A-RNA structure through the intrinsic instability of Hoogsteen base pairs. Nat. Struct. Mol. Biol. 23, 803–810. doi: 10.1038/nsmb.3270
Keywords: RT signature, Watson–Crick face, Galaxy platform, RNA modifications, machine learning, m1A
Citation: Schmidt L, Werner S, Kemmer T, Niebler S, Kristen M, Ayadi L, Johe P, Marchand V, Schirmeister T, Motorin Y, Hildebrandt A, Schmidt B and Helm M (2019) Graphical Workflow System for Modification Calling by Machine Learning of Reverse Transcription Signatures. Front. Genet. 10:876. doi: 10.3389/fgene.2019.00876
Received: 17 June 2019; Accepted: 21 August 2019;
Published: 25 September 2019.
Edited by:
Mattia Pelizzola, Istituto Italiano di Tecnologia, ItalyReviewed by:
Yang Zhao, Vanderbilt University, United StatesTommaso Leonardi, University of Cambridge, United Kingdom
Copyright © 2019 Schmidt, Werner, Kemmer, Niebler, Kristen, Ayadi, Johe, Marchand, Schirmeister, Motorin, Hildebrandt, Schmidt and Helm. This is an open-access article distributed under the terms of the Creative Commons Attribution License (CC BY). The use, distribution or reproduction in other forums is permitted, provided the original author(s) and the copyright owner(s) are credited and that the original publication in this journal is cited, in accordance with accepted academic practice. No use, distribution or reproduction is permitted which does not comply with these terms.
*Correspondence: Andreas Hildebrandt, andreas.hildebrandt@uni-mainz.de; Bertil Schmidt, bertil.schmidt@uni-mainz.de; Mark Helm, mhelm@uni-mainz.de
†These authors share first authorship