 Thais Miranda Silva Freitas1*†
 Juliana Moraes Dias1Ana Carolina Ferreira Veríssimo1Joyce Rodrigues Lobo1
 Gustavo Lage Costa2
 Maria Ivete de Moura2
 Vincenzo Landi3
 Amparo Martínez Martínez4
 Adriana Santana do Carmo5†Maria Clorinda Soares Fioravanti1
- 1Department of Veterinary Medicine, School of Veterinary and Animal Science, Federal University of Goiás, Goiânia, Brazil
- 2Escola de Ciências Médicas e da Vida da Pontifícia Universidade Católica de Goiás, Goiânia, Brazil
- 3Università Degli Studi di Bari Aldo Moro, Bari, Italy
- 4Department of Genetics, Campus of International Agrifood Excellence, Universidad de Córdoba, Cordoba, Spain
- 5Department of Animal Science Medicine, School of Veterinary and Animal Science School, Federal University of Goiás, Goiânia, Brazil
Curraleiro Pé-Duro (CPD) cattle, a Brazilian local breed, are animals that are highly resistant to infectious and parasitic diseases. Strategies for the conservation of the breed and the genetic resistance to diseases should also consider the characteristics of the breed. The objective of this study was to analyze the diversity and population structure of the CPD breed using microsatellite markers and to correlate the serological profiles for causative agents of brucellosis, leptospirosis, neosporosis, leukosis, infectious bovine rhinotracheitis, and bovine viral diarrhea. DNA samples of 608 bovines were amplified and genotyped using 28 microsatellite markers for breed characterization. The genotypes were assigned to three clusters, indicating a substructure population related to the geographic distance. The observed heterozygosity was lower than that expected in most loci, and fixation index (Fst) in the subpopulation values ranged from 0.03073 (ETH3) to 0.402 (INRA63) on cluster 1, from 0.00 (INRA32) to 0.39359 (INRA63) on cluster 2, and from 0.00 (INRA32) to 0.28483 (TGLA53) on cluster 3. The Brucella spp., Neospora caninum, and Bovine Leukemia Virus frequencies were significantly different (p < 0.05) between clusters. The differences between the occurrences of diseases were not sufficient to indicate a genetic subpopulation with increased resistance to infections.
Introduction
Local breeds have become a target of interest owing to their ability to live and reproduce in extreme climatic conditions and their adaptation characteristics to local conditions, characterizing them as resilient breeds. These characteristics mean that these breeds have a genetic heritage that should be preserved, especially considering the need for food production in the face of global climate change (FAO, 2011).
During the colonization period, the first cattle were introduced in Brazil from the Iberian Peninsula, which underwent natural selection. They eventually adapted to local conditions and became rustic cattle, tolerant to heat, water, and food stress, with high prolificacy and resistance to diseases and parasites (Fioravanti et al., 2008; Egito et al., 2016). Such animals were not divided into breeds; with the miscegenation and expansion of herds in Brazilian biomes, which have unique characteristics, local Brazilian breeds became differentiated (Egito et al., 2007), although with similar alleles because of their common origin (Martínez et al., 2012).
To prevent commercial breeds from replacing the naturalized Brazilian breed Curraleiro Pé-Duro (CPD), companies and research institutions had initiated plans for the conservation of animal genetic resources. Such initiatives aim to identify populations at risk, characterize them phenotypically and genetically, and evaluate their productive potential, both at in situ conservation centers in the central-west and northeast regions of the country and ex-situ (Albuquerque et al., 2002; Juliano et al., 2011).
There has been concern about the genetic diversity of local breeds, which could be seriously affected, putting these breeds at risk of extinction. The study of this diversity through geographic genetics aids our understanding of the gene flow and the adaptation of species within heterogeneous and fragmented spaces by understanding the geographical distances and how the transmission of genes occurs, making it possible to detect environmental factors that stimulate the adaptation process (Manel and Holderegger 2013).
Animals separated by geographic distances may present different genetic structures, to the extent of leading to subdivisions between breeds and within the same breed (Souza et al., 2022). Geographic isolation, reduced number of individuals, and adaptation to different environments can generate genetic drift, changing the frequency of alleles accumulated over generations. Therefore, genetic characterization allows the identification of groups that were isolated in the environment for a long time and became genetically distinct groups (Egito et al., 2007; 2016).
Genetic characterization is a criterion used to decide which population should be conserved and is especially important to optimize the choice of samples when resources are scarce, ensuring genetic variability. The selection of breeds and individuals that should participate in the conservation program considers economic interests, adaptability, and the presence of unique alleles (Mariante et al., 2009).
The adaptive characteristics of animal genetic resources can be transmitted to other generations. Therefore, the most adapted genotypes need to be identified and managed. The purpose of identifying genotypes and preserving local breeds is for the possible future use of genetic material as a way to introduce their unique characteristics of adaptability in crossbreeding with commercial breeds, making the offspring more efficient conditions (Egito et al., 2002; McManus et al., 2012). In addition, it conserves and promotes the potential and diversified use of Brazilian breeds, avoiding extinction and maintaining production in adverse climate conditions (Egito et al., 2002; McManus et al., 2012).
Given that drug use and vector controls are difficult strategies to implement, and the environmental and food security impacts of these strategies are negative, one of the most valuable features of disease control is exploiting local breeds that are tolerant to infection. Examples are West African N'Dama cattle, which are tolerant to trypanosomosis, and East African Red Maasai sheep, which are resistant to gastrointestinal worms. Adding to the problem are the lack of resources of low-income cattle breeders, which hamper access to treatment and veterinary services, as well as the resistance of pathogens against the inappropriate use of antimicrobials. In this scenario, genetic management of animals is an alternative to increase resistance to diseases by using the most appropriate breeds for each type of production and improving herds by choosing animals with an increased level of resistance, in addition to crossbreeding to incorporate resistance genes in breeds lacking them (FAO, 2007).
The aim of this study was to analyze the diversity and population structure of CPD cattle by evaluating microsatellite markers (STR) of breed characterization. Additionally, STR were associated to animals serological profile of brucellosis, leptospirosis, leucosis, infectious bovine rhinotracheitis (IBR), bovine viral diarrhea (BVD), and neosporosis.
Material and Methods
Sampling and Serology
A total of 1,100 blood samples collected in 2011 from male and female CPD cattle of different age groups were used. The samples were obtained from the project “Central-West Pro Network—Characterization, Conservation, and Use of Local Brazilian Cattle Races: Curraleiro and Pantaneiro,” which also maintains data on the serological profile of herds in the states of Piauí, Tocantins, and Goiás.
The epidemiological profile data were determined by serological results (positive/negative/suspect) and responses to epidemiological questionnaires applied at the time of sample collection. The serological tests and places where they were performed as follows: serum agglutination test with buffered acidified antigen (AAT Tecpar® Brazil) to detect anti-Brucella abortus antibodies (Brasil. Ministério da Agricultura Pecuária e Abastecimento, 2006), performed in the Graduate Multi-purpose Laboratory of the School of Veterinary and Animal Sciences of the Federal University of Goiás (UFG) (EVZ/UFG); indirect enzyme-linked immunosorbent assay (IDEXX Laboratories, Inc.) to determine antibodies against leukosis, IBR, and BVD viruses according to World Organisation for Animal Health recommendations (OIE. World Health Organization, 2015; OIE. World Health Organization, 2017; OIE. World Health Organization, 2018), performed at the Laboratory of Animal Virology of the Institute of Tropical Pathology and Public Health, UFG; microscopic agglutination test (OIE. World Health Organization, 2014) to detect antibodies against 19 serovars of Leptospira spp., using a cutoff of 1:100, performed in the Leptospirosis Laboratory, EVZ/UFG; indirect immunofluorescence for the detection of antibodies against Neospora caninum tachyzoites of the Nc-1 strain, with a cutoff of 1:100 (Alvarez-García et al., 2002), performed in the Protozoology Laboratory of the Veterinary Parasitology Center (CPV), EVZ/UFG.
Genetic Analysis
Total DNA extraction was performed at the Genetics and Biodiversity Laboratory, UFG, from frozen blood samples. The DNA extraction protocol was adapted from Miller et al. (1988).
The short tandem repeat microsatellites were selected from the list of markers recommended by the Food and Agriculture Organization (FAO) and the International Society for Animal Genetics (ISAG) for studying genetic diversity in cattle. Table 1 shows the 28 microsatellites analyzed with the direct and reverse sequences of the primers, the size range of the amplified fragments in base pairs, and their references.
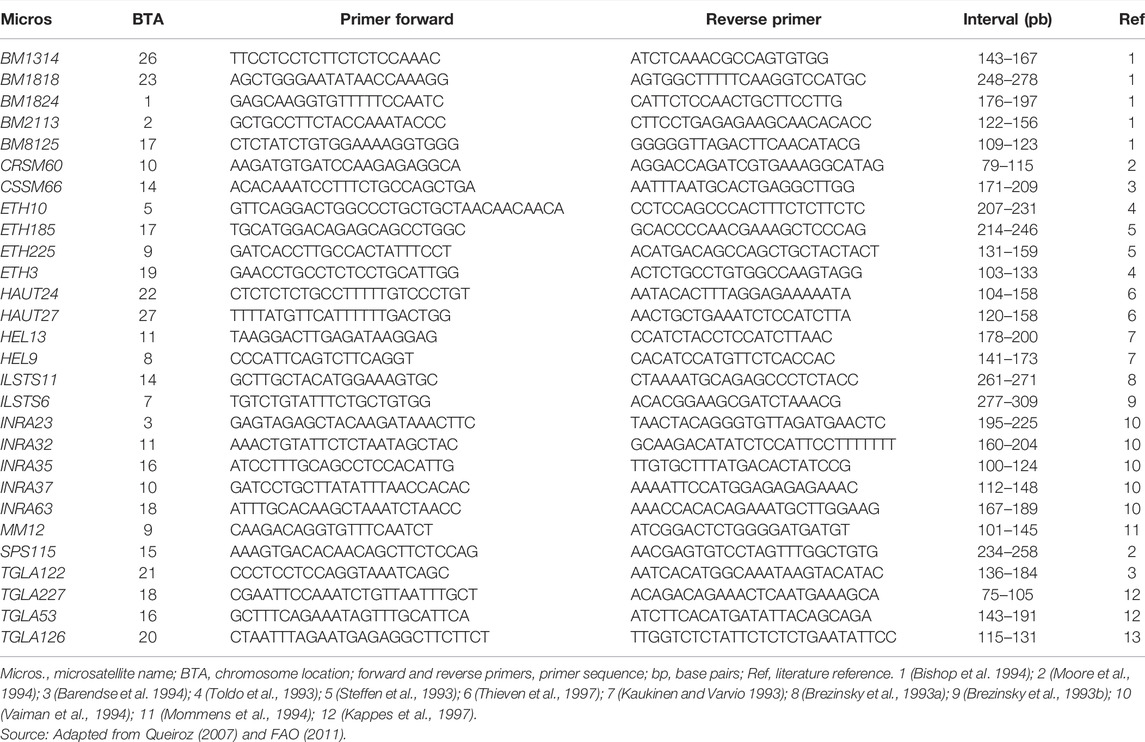
TABLE 1. Microsatellites used in the breed characterization of Curraleiro Pé-Duro.
Polymerase chain reaction (PCR) was prepared and the PCR was performed as recommended with 2 µL of DNA, 3 µL of primer mix (0.2–0.4 µM of each primer), and 5 µL of commercial mix (Taq PCR Master Mix Kit, QIAGEN®, United States).
Primer amplification was optimized in-house by testing the optimal fragment amplification temperatures for multiplex reactions. To standardize the reactions, two positive samples previously genotyped were tested in multiplex PCRs with a temperature gradient between 55 and 62°C. The samples were grouped by amplified fragment size and fluorochrome used to avoid fragment overlapping. The primers from each electropherogram were divided into two multiplex PCRs (M1 and M2), one with an annealing temperature of 55°C and the other with an annealing temperature of 62°C, chosen based on the best amplification signal in each reaction.
The first and second multiplex PCRs of the first electropherogram and the second multiplex PCR of the second electropherogram (Gel1M1, Gel1M2, and Gel2M2) followed the amplification protocol of an initial cycle at 95°C for 5 min; 34 amplification cycles (95°C for 40 s, 55°C for 50 s, and 72°C for 1 min); final extension at 72°C for 30 min, followed by an infinite temperature of 12°C. PCR of the Gel2M1 primers was performed with an initial cycle at 95°C for 5 min; 34 cycles (95°C for 30 s and 62°C for 4 min), final extension at 60°C for 20 min, and infinite temperature of 12°C.
The amplification products of microsatellite loci were genotyped in capillary electrophoresis systems using the ABI3500 automatic sequencer (Applied Biosystems®) at the Replicon/LaGene Research Center of the Pontifical Catholic University of Goiás and the ABI 3130 automatic sequencer (Applied Biosystems®) at the University of Córdoba, Spain. The data were analyzed using the GeneMapper program (v4.0, Applied Biosystems™). The size of the amplified fragments was defined in comparison with the standard Gene Scan LIZ 600® (Life Technologies) and two control samples in each electropherogram. The controls were samples previously genotyped by the company Animal Breeding Consulting, Spain, with known and standardized genotypes.
Filtering of the genotypes was performed to remove samples that failed to amplify half or more of the markers because more genotyping failures mean that more assignment errors can occur. The P6 property was excluded as it had no DNA samples for the genetic analyses. At the end of the quality control, 608 remaining samples were evaluated together, without prior population definition (Table 2). The dataset can be consulted online (https://figshare.com/account/projects/98876/articles/14069039).

TABLE 2. Collection state, sampled properties, city, number of DNA samples processed, and final number of samples analyzed after filtering of genotypic data.
Statistical Analysis
The data obtained were treated in order to eliminate samples with low genotyping quality and monomorphic markers, leaving 608 Curraleiro Pé Duro samples that showed more than 50% of the genotyped loci and, therefore, were selected for the association analyses (Table 2). The dataset can be consulted online (https://figshare.com/account/projects/98876/articles/14069039).
The genotyping data were entered into Structure 2.3.4 software (Pritchard et al., 2000), and the samples were grouped according to the similarity of multilocus genotypes. The program assigned the individuals to the clusters of greatest similarity, determining the k value, that is, the number of populations in which the samples were divided based on Bayesian statistics through the Markov Chains Monte Carlo (MCMC) method (Pritchard et al., 2000).
To estimate population structure in Structure software, runs were conducted using a parameter set of 10,000 burn-in generations followed by 500,000 MCMC iterations. One to 22 populations (k = 1 to k = 22) and five iterations for each k value were assumed in the admixture model (Haikukutu 2018). The results of the cluster determination analyses were processed, and the real k value was determined using the ΔK method proposed by Evanno et al. (2005) using the Structure Harvester software (Earl and vonHoldt, 2012). The k value that best accommodated the allelic diversity, which corresponds to the stabilization point of the curve, was observed in graphical analysis.
The genetic diversity indicators were calculated in the Microsatellite Toolkit for Excel program (Park 2001). The allele frequencies, number of alleles per locus, allele richness, observed and expected heterozygosity, and polymorphic information content (PIC) were obtained (Park 2001). PIC values were used to evaluate the quality of the markers (Botstein et al., 1980) as follows: above 0.5, very informative; from 0.25 to 0.5, moderately informative; below 0.25, poorly informative (McManus et al., 2011).
The deviations in Hardy–Weinberg equilibrium (HWE) were estimated with the software Genepop 4.0.5.3 (Raymond and Rousset 1995) by applying the MCMC method. In the Populations 1.2.28 program (Langella 1999), genetic distance matrices were built using the methodology of Reynolds and Nei’s Da (Nei et al., 1983) and the respective phylogenetic trees. The tree of genetic distances constructed using the neighbor-joining method was graphically plotted using Mega 7.0.26 software (Kumar et al., 2016) to observe associations among populations. Correspondence factor analysis (CFA) was performed in Genetix software (Belkhir et al., 2004) to determine the divergence of the CPD populations.
The F coefficients, namely, Wright’s fixation index (F), which includes Fis (inbreeding coefficient/heterozygosity deficiency coefficient), Fit (inbreeding or fixation index for the total population), and Fst (fixation index in the subpopulation or estimate of genetic differentiation between subpopulations) (McManus et al., 2011) were calculated in Genetix. The method of Weir and Cockerham (1984) was used, estimating a 95% confidence interval with 1,000 bootstraps per locus.
Genetic divergence among populations was assessed based on analysis of molecular variance (AMOVA) (Excoffier et al., 1992) in Arlequin software version 3.5.2.2 (Excoffier and Lischer 2010), using pairwise Fst genetic distances as a method to calculate intra- and inter-group genetic distances.
Association Between Breed Molecular Markers and Disease
Breed characterization markers were associated with the frequency of animals seropositive against infections by pathogens causing brucellosis, leptospirosis, neosporosis, leukosis, IBR, and BVD.
A population study was carried out adopting each genetic cluster as a population. The allele frequencies were observed and compared between groups of sick (positive) and healthy individuals (negative) using Fisher’s exact test. The strength of association was measured using the relative risk (odds ratio), which indicates how frequently a disease occurs in an individual carrying a certain marker.
Results
CPD cattle were assigned to clusters in order to observe subpopulations within the breed, and the results of the first analysis showed that the most appropriate grouping was k = 3.
Figure 1 depicts graphs in which each individual corresponds to a vertical line divided into k genotype segments, according to the number of inferred clusters. Each cluster is represented by a color, and individuals whose genotype is classified in more than one cluster have more than one color, indicating the occurrence of an admixture.

FIGURE 1. Populations of Curraleiro Pé-Duro cattle detected by the method of clusters with genetic similarity using breed characterization markers.
Figure 2 shows threshold of significant difference between CPD populations, that were best clustering in three groups.
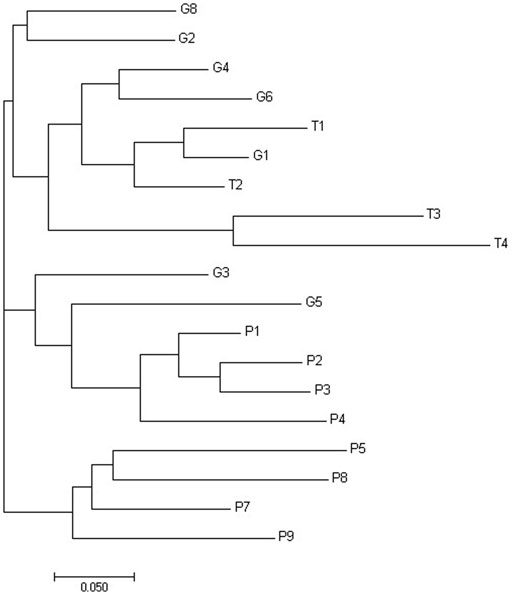
FIGURE 2. Phylogenetic tree of Da distances of Nei built using the neighbor-joining method for the properties of Curraleiro Pé-Duro cattle.
The populations and the number of individuals in each population assigned to clusters are shown in Table 3. Populations of Piauí have most of the genotypes allocated in cluster 1, while populations of Tocantins are mostly grouped in cluster 3. The properties of the state of Goiás had genotypes grouped in all clusters, indicating the absence of clear differentiation between the alleles present in individuals from this state and those of others.

TABLE 3. Locality of cattle assigned to clusters 1, 2, and 3 of breed genetic similarity for the Curraleiro Pé-Duro breed.
The genetic distances between populations were calculated according to Nei’s Da, and the phylogenetic tree was built using the neighbor-joining method (Figure 3). The grouping by genetic distances showed small differences in comparison to the grouping by Structure software. It is possible to observe three clusters, separating the properties of Tocantins from those of Piauí and the properties of Goiás among the properties of other states.

FIGURE 3. Graphical representation of the factor analysis of correspondence of Curraleiro Pé-Duro cattle (A). Representation by clusters of genetic similarity (cluster 1 in yellow, cluster 2 in blue, and cluster 3 in white) (B). Representation by state (Goiás in yellow, Piauí in blue, and Tocantins in white).
The genetic diversity indices, described in Table 4, were measured by estimating the levels of expected and observed heterozygosity and the average number of alleles. The expected heterozygosity was higher than that observed in the three clusters, which, however, had high allele richness.

TABLE 4. Indices of genetic diversity among clusters of breed characterization of Curraleiro Pé-Duro cattle.
Higher presence of alleles was observed in breed clusters 2 and 3 (233 alleles in 124 samples and 303 alleles in 163 samples analyzed, respectively) than in cluster 1 (295 alleles in 321 samples analyzed). The markers used were tested using HWE, and all loci in cluster 3 were in disequilibrium (p < 0.05). In clusters 1 and 2, some markers were in equilibrium, i.e., no decrease in heterozygotes relative to homozygotes was observed at these loci. The PIC values per marker are compiled in Table 5.

TABLE 5. Heterozygosity of microsatellite loci for breed characterization of Curraleiro Pé-Duro cattle.
All microsatellite markers evaluated were highly polymorphic and highly informative as they had PIC values above 0.5, with few markers with PIC values above 0.4. Although highly informative, the heterozygosity observed was lower than expected in most loci, suggesting increased homozygosity. The Fis, Fit, and Fst were calculated per marker and per cluster and are shown in Table 6.

TABLE 6. Results of F statistical analysis by phylogenetic clusters and by loci in the Curraleiro Pé-Duro cattle populations.
The results indicated similar values between clusters but differences for each marker. The Fis (fixation index within population) per marker, considering all animals independently of clusters, was similar for all loci. Fis values ranged between −0.70401 (INRA63) and 0.6136 (TGLA53) in cluster 1; 0.46182 (INRA63) and 0.47398 (HAUT24) in cluster 2; and −0.03575 (BM8125) and 0.51811 (HAUT24) in cluster 3. The negative Fis values in some loci indicated that the observed heterozygosity was greater than expected, with no reduction of heterozygotes in comparison with homozygotes.
Fst values ranged between 0.03073 (ETH3) and 0.402 (INRA63) in cluster 1, between 0.00 (INRA32) and 0.39359 (INRA63) in cluster 2, and between 0.00 (INRA32) and 0.28483 (TGLA53) in cluster 3, indicating varying levels of differentiation from markers with little genetic differentiation (Fst 0.25). Fst levels close to zero indicated less genetic differentiation.
CFA (Figure 3A) graphically represented three genetic groups. The same analysis was performed considering the separation by state to observe how the clusters were formed (Figure 3B). Cluster one consisted of herds from the states of Piauí, cluster two of herds from Goiás, and cluster three of herds from Tocantins and Goiás.
The frequencies of infections in the three genetic clusters were compared to the frequencies of diseases in clusters defined by environmental characteristics, according to a study using the same samples (Lobo 2018). Chi-squared analysis, performed to detect associations between genetic and environmental clusters, showed a significant difference (p < 2.2e-16), with 53.45% (325/608) of concordant samples. Moreover, the properties grouped according to environmental characteristics were also grouped according to genetic characteristics (Table 7).
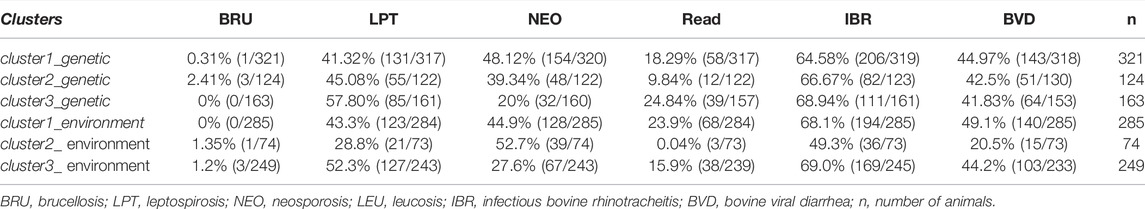
TABLE 7. Frequency distribution of seropositive individuals against infections according to the classification by genetic and environmental clusters.
A significant difference (p < 0.001, Kappa = 0.247) was found between genetic and environmental clusters, with 53.45% of samples in agreement (grouped in genetic and environmental clusters 1, 2, or 3). The percentages of individuals allocated to each cluster in the positive, negative, and suspect groups for each infection were tabulated (Table 8), considering only the genetic clusters.

TABLE 8. Prevalence of antibodies against microorganisms that cause brucellosis, leptospirosis, neosporosis, leukosis, rhinotracheitis, and viral diarrhea in Curraleiro Pé-Duro cattle by genetic clusters.
Cluster 1 had the lowest number of animals positive for Leptospira and IBR. Cluster 3 had a lower frequency of positives against Brucella and Neospora, and cluster 2 had a lower frequency of positives for bovine leukosis, than other clusters. The prevalence by cluster was similar for all infections.
AMOVA considered three groups referring to Goiás, Piauí, and Tocantins states to estimate the amount of total diversity due to variation in populations between and within states (Table 9). The AMOVA provided overall Fit estimate of 0.24491 (p < 0.00001, with 20,000 permutations), meaning that the total variation found among populations was 24.49%. Of this, 5.91% corresponded to the variation in populations between states and 18.57% to the variation between populations of the same state.

TABLE 9. Results of the analysis of molecular variance for populations of Curraleiro Pé-Duro from three Brazilian states based on microsatellite data.
The 19 herds were tested as independent groups by AMOVA. This test indicated that 24.72% of the total variation (Fit) was between herds and 75.51% within individuals. The variation between herds was lower than the variation between individuals of the same herd (Table 10).

TABLE 10. Results of the analysis of molecular variance for 19 herds of Curraleiro Pé-Duro based on microsatellite data.
Discussion
The differentiation of the same breed into three clusters may be explained by the role of the environment in selection. The physical separation of the populations of Goiás, Tocantins, and Piauí caused reproductive isolation, and adaptation to local environmental conditions may have affected the emergence of new phenotypes (Lofeu and Kohlsdorf 2015). The genetic clusters resembled the clusters defined by environmental characteristics (Lobo 2018), corroborating the association of genotype and environment in the formation of the phenotype, which was expressed by the occurrence of antibodies against diseases.
Expected heterozygosity was higher than observed except for loci BM8125 and INRA63 (cluster 1), which may indicate increased inbreeding and reduced genetic variability. The loss of diversity in breed characteristics may also indicate an increase in inbreeding coefficient.
All loci were polymorphic, with a total of 295 alleles in cluster 1, 233 in cluster 2, and 303 in cluster 3. Mean values of 10.54, 8.32, and 10.82 alleles per locus were observed in clusters 1, 2, and 3, respectively, a value lower than the average of 13 alleles per loci previously described in the breed. Although polymorphic, the loci were in HWE imbalance, which was in agreement with the results of Oliveira (2008) n which HWE deviations were observed in nine of 10 loci analyzed in CPD breed.
The increase in the number of homozygotes, observed by the deviation in the HWE, can be explained by the high level of inbreeding due to the small effective number of animals in reproductive age and mating between related individuals. Other factors that can also explain the deviation in the HWE are subdivisions within the population, natural selection, migration, and null alleles (Quiroz 2007).
The Fst values were lower than 0.15, indicating that the two subpopulations share alleles and, therefore, the genetic differentiation is low to moderate. Owing to the geographical isolation of the populations of the states of Piauí, Tocantins, and Goiás, high differentiation between the populations of the states and increased of inbreeding within each state would be expected because the populations do not mate at random (Oliveira 2008; McManus et al., 2011). However, we estimate that exchanging sires between properties to decrease the effect of inbreeding causes different properties to share alleles, reducing the differentiation between properties. The exchange or purchase of animals of the breed is limited by the number of farms, and the replacement of the herd is conditioned to the availability of sires among the properties studied.
Fis ranged from 0.16441 (TGLA53) to 0.19427 (INRA63) and Fit from 0.27191 (TGLA53) to 0.29383 (BM8125). Fis values indicated inbreeding. The loss of genetic variability in CPD herds is a consequence of inbreeding due to the replacement of sires with animals from their own herd. The CPD breed showed higher F indices than other native Brazilian breeds such as Caracu, Pantaneiro, and Mocho Nacional (Egito 2007; Fioravanti et al., 2011).
The number of positive animals was lower than that of negative animals, except for IBR virus infection in all clusters and for Leptospira infection, in cluster 3. The high rate of seropositivity for viral infections in CPD was reported by Juliano (2006) and Amaral (2013), concluding that the viruses are endemically present in the evaluated populations.
It is possible to infer that past environmental changes have triggered phenotypic diversification events that fixed or eliminated alleles (Lofeu and Kohlsdorf 2015) in populations from different geographic regions, influenced by physical distance, causing the three gene clusters to express different disease susceptibility/resistance phenotypes.
In CPD animals, the most advantageous alleles for adaptation to the environmental conditions of Piauí and Tocantins showed increased frequency in each environment and were fixed in the populations, subdividing the breed into three distinct populations. AMOVA findings showed that most of the total genetic variance was due to the difference between alleles within individuals (75.28%), which is a similar result to that described for the local Brazilian breed Crioulo Lageano (Spritze et al., 2003; Carvalho et al., 2012). CPD herds were similarly divided into breed characterization clusters and geographic clusters due to herd isolation. However, since the variation of genotypes was greater among individuals of the same group than between herds or states, individuals from the same property were grouped into different clusters.
Conclusion
Diversity and a high number of alleles were detected in the three genetic clusters; however, the deviation from the HWE and the inbreeding coefficient indicated the occurrence of inbreeding in the populations. The difference in antibody detection was significant for Brucella spp., N. caninum, and BLV between clusters. The greatest variation in genotypes related to the BoLA genes occurred at the individual level, and has a high number of alleles that provide varied phenotypes to CPD.
We conclude that the populations are in the process of genetic differentiation. However, this differentiation is more pronounced in the Piauí herds compared to Tocantins and Goias. The results were not sufficient to indicate a genetic subpopulation with increased resistance or susceptibility to infection.
Data Availability Statement
The datasets analysed during the current study are available in https://doi.org/10.6084/m9.figshare.14069039.
Ethics Statement
Ethical review and approval was not required for the animal study because the present study was exempt of the local ethical committee evaluation as genomic DNA was extracted from stored hair of animals from commercial herds. Written informed consent was obtained from the owners for the participation of their animals in this study.
Author Contributions
MF and VL conceived the idea, designed the study, and acquired the funding. VL, MF, and AM conducted the supervision and data curation. TF, JD, AV, JL, GC, and VL performed the experiments. TF, VL, AC, and MF conduced data analysis. TF wrote the manuscript. VL, AC, and MF reviewed and edited formal analysis. All authors contributed to the article and approved the submitted version.
Funding
This research was supported by the Conselho Nacional de Desenvolvimento Científico e Tecnológico—CNPq, No. 79/2013. Coordenação de Aperfeiçoamento de Pessoal de Nível Superior—CAPES provided grants to support researchers.
Conflict of Interest
The authors declare that the research was conducted in the absence of any commercial or financial relationships that could be construed as a potential conflict of interest.
Publisher’s Note
All claims expressed in this article are solely those of the authors and do not necessarily represent those of their affiliated organizations, or those of the publisher, the editors and the reviewers. Any product that may be evaluated in this article, or claim that may be made by its manufacturer, is not guaranteed or endorsed by the publisher.
Acknowledgments
The authors thank CNPq and CAPES for the financial support, the Núcleo de Pesquisas Replicon for granting the use of laboratories and equipment, and the Animal Breeding Consulting for the professional training of analysis and interpretation of results.
References
Albuquerque, M. S. M., Egito, A. A., and Mariante, A. S. (2002). Programa brasileiro de conservação de recursos genéticos animais. Arch. Zootec. 51 (193-194), 39–52.
Alvarez-García, G., Pereira-Bueno, J., Gómez-Bautista, M., and Ortega-Mora, L. M. (2002). Pattern of Recognition of Neospora Caninum Tachyzoite Antigens by Naturally Infected Pregnant Cattle and Aborted Foetuses. Vet. Parasitol. 107 (1-2), 15–27. doi:10.1016/s0304-4017(02)00091-2
Amaral, H. R. D. (2013). Frequência de anticorpos para BVDV, BoHV-1 e BLV em gado Curraleiro Pé-Duro e Pantaneiro no Brasil. [Goiânia (GO)]: Universidade Federal de Goiás. [dissertation].
Barendse, W., Armitage, S. M., Kossarek, L. M., Shalom, A., Kirkpatrick, B. W., Ryan, A. M., et al. (1994). A Genetic Linkage Map of the Bovine Genome. Nat. Genet. 6, 227–235. doi:10.1038/ng0394-227
Belkhir, K., Borsa, P., Chikhi, L., Raufaste, N., and Bonhomme, F. (2004). Genetix: 4.05 Logiciel sous WindowsTM pour la genetique des populations, Université de Montpellier II, France. Available at: https://kimura.univ-montp2.fr/genetix/(Accessed Jan 30, 2021).
Bishop, M. D., Kappes, S. M., Keele, J. W., Stone, R. T., Sunden, S. L., Hawkins, G. A., et al. (1994). A Genetic Linkage Map for Cattle. Genetics 136 (2), 619–639. doi:10.1093/genetics/136.2.619
Botstein, D., White, R. L., Skolnick, M., and Davis, R. W. (1980). Construction of a Genetic Linkage Map in Man Using Restriction Fragment Length Polymorphisms. Am. J. Hum. Genet. 32 (3), 314–331. Available in https://www.ncbi.nlm.nih.gov/pmc/articles/PMC1686077/(Accessed Jan 30, 2021).
Brasil. Ministério da Agricultura Pecuária e Abastecimento (2006). Programa nacional de controle e erradicação da brucelose e da tuberculose animal-PNCEBT. Brasília. Available in: http://www.adepara.pa.gov.br/sites/default/files/Manual%20do%20PNCEBT%20-%20Original.pdf (Accessed Fev 10, 2021).
Brezinsky, L., Kemp, S. J., and Teale, A. J. (1993a). Five Polymorphic Bovine Microsatellites (ILSTS010-014). Anim. Genet. 24, 75–76. doi:10.1111/j.1365-2052.1993.tb00936.x
Brezinsky, L., Kemp, S. J., and Teale, A. J. (1993b). ILSTS006: a Polymorphic Bovine Microsatellite. Anim. Genet. 24, 73. doi:10.1111/j.1365-2052.1993.tb00933.x
Carvalho, G. M. C., Lima Neto, A. F., Azevedo, D. M. R. R., Nascimento, H. T. S., Mariante, A. S., Paiva, S. R., et al. (2012). “Estrutura genética de raças bovinas locais e exóticas criadas no Brasil e nos Estados Unidos,” in Congresso Brasileiro De Recursos Genéticos, 2. 2012, Belém, PA. Anais. Brasília, DF: Sociedade Brasileira de Recursos Genéticos. Available in: http://ainfo.cnptia.embrapa.br/digital/bitstream/item/77539/1/131.pdf (Accessed Fev 10, 2021).
Earl, D. A., and vonHoldt, B. M. (2012). STRUCTURE HARVESTER: a Website and Program for Visualizing STRUCTURE Output and Implementing the Evanno Method. Conservation Genet. Resour. 4 (2), 359–361. doi:10.1007/s12686-011-9548-7
Egito, A. A. (2007). Diversidade genética, ancestrabilidade individual e miscigenação das raças bovinas no Brasil com base em microssatélites e haplótipos de DNA mitocondrial: subsídios para conservação. [Brasília (DF)]: Universidade de Brasília. [thesis]. Available at: https://repositorio.unb.br/handle/10482/1136 (Accessed Jan 30, 2021).
Egito, A. A., Mariante, A. S., and Albuquerque, M. S. M. (2002). Programa brasileiro de conservação de recursos genéticos animais. Arch. Zootec 51, 39–52. Available at: https://www.embrapa.br/busca-de-publicacoes/-/publicacao/1109840/programa-brasileiro-de-conservacao-de-recursos-geneticos-animais (Accessed Jan 30, 2021).
Egito, A. A., Martínez, A. M., Juliano, R. S., Landi, V., Moura, M. I., Silva, M. C., et al. (2016). Estudo populacional de rebanhos de bovinos Pantaneiros visando a gestão e o manejo genético da raça. AICA 7, 59–63. Avaliable at: https://www.cpap.embrapa.br/redeco12/docs/artigos/Artigo_Andrea.Egito_2016%20.pdf (Accessed Jan 30, 2021).
Egito, A. A., Paiva, S. R., Albuquerque, M. d. S. M., Mariante, A. S., Almeida, L. D., Castro, S. R., et al. (2007). Microsatellite Based Genetic Diversity and Relationships Among Ten Creole and Commercial Cattle Breeds Raised in Brazil. BMC Genet. 8 (1), 83. doi:10.1186/1471-2156-8-83
Evanno, G., Regnaut, S., and Goudet, J. (2005). Detecting the Number of Clusters of Individuals Using the Software STRUCTURE: a Simulation Study. Mol. Ecol. 14 (8), 2611–2620. doi:10.1111/j.1365-294X.2005.02553.x
Excoffier, L., and Lischer, H. E. L. (2010). Arlequin Suite Ver 3.5: A New Series of Programs to Perform Population Genetics Analyses under Linux and Windows. Mol. Ecol. Resour. 10 (3), 564–567. doi:10.1111/j.1755-0998.2010.02847.x
Excoffier, L., Smouse, P. E., and Quattro, J. M. (1992). Analysis of Molecular Variance Inferred from Metric Distances Among DNA Haplotypes: Application to Human Mitochondrial DNA Restriction Data. Genetics 131, 479–491. doi:10.1093/genetics/131.2.479
FAO (2011). Molecular Genetic Characterization of Animal Genetic Resources. Rome. Available at: http://www.fao.org/3/i2413e/i2413e00.pdf (Accessed Jan 30, 2021).
FAO (2007). The State of the World’s Animal Genetic Resources for Food and Agriculture– in Brief. Rome. Avaliable in http://www.fao.org/3/a-a1260e.pdf (Accessed Jan 30, 2021).
Fioravanti, M. C. S., Juliano, R. S., Costa, G. L., Abud, L. J., Cardoso, V. S., Carpio, M. G., et al. (2011). Conservación del bovino Curraleiro: cuantificación del censo y caracterización de los criadores. Anim. Genet. Resour. 48, 109–116. doi:10.1017/s2078633610001244
Fioravanti, M. C. S., Sereno, J. R. B., Neiva, A. C. G. R., Abud, L. J., Lôbo, J. R., Francescatônio, D. D., et al. (2008). Reintrodução do gado curraleiro na comunidade quilombola Kalunga de Cavalcante, Goiás, Brasil: Resultados parciais. II Simpósio Internacional de Savanas Tropicais. Available at: http://simposio.cpac.embrapa.br/simposio_pc210/trabalhos_pdf/00515_trab2_ap.pdf (Accessed Jan 10, 2021).
Haikukutu, L. (2018). Genetic Diversity of the Bovine Leukocyte Antigen (BoLA) and its Association with Resistance to Ticks and Tick-Borne Diseases in Selected Beef Cattle Breeds in Namibia. [Namibia]: University of Namibia. [master’s thesis]. Available at: http://hdl.handle.net/11070/2243 (Accessed Jan 8, 2021).
Juliano, R. S. (2006). Aspectos sanitários e do sistema de fagócitos de bovinos da raça Curraleiro. [Goiânia (GO)]. Universidade Federal de Goiás. [thesis].
Juliano, R. S., Fioravanti, M. C. S., Sereno, J. R. B., Abreu, U. G. P., Jayme, V. S., Silva, A. C., et al. (2011). Aspectos sanitários dos núcleos de conservação In Situ de bovinos pantaneiros. Corumbá: Embrapa Pantanal-Boletim de Pesquisa e Desenvolvimento 103.
Kappes, S. M., Keele, J. W., Stone, R. T., McGraw, R. A., Sonstegard, T. S., Smith, T. P., et al. (1997). A Second-Generation Linkage Map of the Bovine Genome. Genome Res. 7, 235–249. doi:10.1101/gr.7.3.235
Kaukinen, J., and Varvio, S.-L. (1993). Eight Polymorphic Bovine Microsatellites. Anim. Genet. 24, 148. doi:10.1111/j.1365-2052.1993.tb00274.x
Kumar, S., Stecher, G., and Tamura, K. (2016). MEGA7: Molecular Evolutionary Genetics Analysis Version 7.0 for Bigger Datasets. Mol. Biol. Evol. 33 (7), 1870–1874. doi:10.1093/molbev/msw054
Langella, O. (1999). Populations. Available at: http://bioinformatics.org/∼tryphon/populations/index.html#pubdas (Accessed Jan 10, 2021).
Lobo, J. R. (2018). Geografia de Paisagem e perfil sanitário de bovinos Curraleiro Pé-Duro criados nos biomas Cerrado e Caatinga. [Goiânia (GO)]: Universidade Federal de Goiás. [thesis].
Lofeu, L., and Kohlsdorf, T. (2015). Mais que seleção: o papel Do ambiente na origem e evolução da diversidade fenotípica. Genética na Escola 10 (1), 10–19.
Manel, S., and Holderegger, R. (2013). Ten Years of Landscape Genetics. Trends Ecol. Evol. 28 (10), 614–621. doi:10.1016/j.tree.2013.05.012
Mariante, A. d. S., Albuquerque, M. d. S. M., Egito, A. A., McManus, C., Lopes, M. A., and Paiva, S. R. (2009). Present Status of the Conservation of Livestock Genetic Resources in Brazil. Livestock Sci. 120 (3), 204–212. doi:10.1016/j.livsci.2008.07.007
Martínez, A. M., Gama, L. T., Cañón, J., Ginja, C., Delgado, J. V., Dunner, S., et al. (2012). Genetic Footprints of Iberian Cattle in America 500 Years after the Arrival of Columbus. PLOS ONE 7 (11), e49066. doi:10.1371/journal.pone.0049066
McManus, C., Canozzi, M. E., Bracellos, J., and Paiva, S. R. (2012). Pecuária e mudanças climáticas. Revista UFG 13 (13), 73–82. Available at: https://www.revistas.ufg.br/revistaufg/article/view/48455/23783 (Accessed Jan 30, 2021).
McManus, C., Paiva, S. R., Corrêa, P. S., Seixas, L., and Melo, C. B. (2011). Estatísticas para descrever genética de populações. Embrapa.
Miller, S. A., Dykes, D. D., and Polesky, H. F. (1988). A Simple Salting Out Procedure for Extracting DNA from Human Nucleated Cells. Nucl. Acids Res. 16 (3), 1215. doi:10.1093/nar/16.3.1215
Mommens, G., Coppieterst, W., Weghe, A., Zeveren, A., and Bouquet, Y. (1994). Dinucleotide Repeat Polymorphism at the Bovine MM12E6 and MM8D3 Loci. Anim. Genet. 25, 368. doi:10.1111/j.1365-2052.1994.tb00381.x
Moore, S. S., Byrne, K., Berger, K. T., Barendse, W., Mccarthy, F., Womack, J. E., et al. (1994). Characterization of 65 Bovine Microsatellites. Mamm. Genome 5, 84–90. doi:10.1007/BF00292333
Nei, M., Tajima, F., and Tateno, Y. (1983). Accuracy of Estimated Phylogenetic Trees from Molecular Data. J. Mol. Evol. 19 (2), 153–170. doi:10.1007/BF02300753
OIE. World Health Organization (2018). Chapter 2.4.10. Enzootic Bovine Leukosis. Available at: https://www.oie.int/fileadmin/Home/eng/Health_standards/tahm/2.04.10_EBL.pdf (Accessed Apr 10, 2017).
OIE. World Health Organization (2014). Chapter 3.1.12 Leptospirosis. Available at: https://www.oie.int/fileadmin/Home/eng/Health_standards/tahm/3.01.12_LEPTO.pdf (Accessed Feb 3, 2017).
OIE. World Health Organization (2015). Chapter 3.4.07. Bovine Viral Diarrhoea. Available at: https://www.oie.int/fileadmin/Home/eng/Health_standards/tahm/3.04.07_BVD.pdf (Accessed March 25, 2017).
OIE. World Health Organization (2017). Infectious Bovine Rhinotracheitis/infectious Pustular Vulvovaginitis. Available at: https://www.oie.int/fileadmin/Home/eng/Health_standards/tahm/3.04.11_IBR_IPV.pdf (Accessed Feb 15, 2017).
Oliveira, A. P. F. (2008). Caracterização genética de uma população do gado crioulo Pé-duro do Piauí, através de marcadores microssatélites. [Ribeirão Preto (SP)]: Universidade de São Paulo. [thesis].
Park, S. D. E. (2001). The Excel Microsatellite Toolkit, Version 3.1. , Ireland: Animal Genomics Laboratory, University College Dublin.
Pritchard, J. K., Stephens, M., and Donnelly, P. (2000). Inference of Population Structure Using Multilocus Genotype Data. Genetics 155 (2), 945–959. doi:10.1093/genetics/155.2.945
Quiroz, J. (2007). Caracterización genética de los bovinos criollos mexicanos y su relación con otras poblaciones bovinas. [Córdoba]: Universidad de Córdoba. [thesis].
Raymond, M., and Rousset, F. (1995). GENEPOP (Version 1.2): Population Genetics Software for Exact Tests and Ecumenicism. J. Hered. 86 (3), 248–249. doi:10.1093/oxfordjournals.jhered.a111573
Souza, A. C. B. d., Egito, A. A. d., Peripolli, V., and McManus, C. M. (2022). Bovine Landscape Genetics in Brazil. Sci. Agric. (Piracicaba, Braz. 79 (1), e20200142. doi:10.1590/1678-992x-2020-0142
Spritze, Á., Egito, A. A. d., Mariante, A. d. S., and McManus, C. (2003). Caracterização genética da raça bovina Crioulo Lageano por marcadores moleculares RAPD. Pesq. Agropec. Bras. 38 (10), 1157–1164. doi:10.1590/S0100-204X2003001000004
Steffen, P., Eggen, A., Stranzinger, G., Fries, R., Dietz, A. B., and Womack, J. E. (1993). Isolation and Mapping of Polymorphic Microsatellites in Cattle. Anim. Genet. 24, 121–124. doi:10.1111/j.1365-2052.1993.tb00252.x
Thieven, U., Solinas-Toldo, S., Friedl, R., Masabanda, J., Fries, R., Barendse, W., et al. (1997). Polymorphic CA-microsatellites for the Integration of the Bovine Genetic and Physical Map. Mamm. Genome 8, 52–55. doi:10.1007/s003359900348
Toldo, S. S., Fries, R., Steffen, P., Neiberg, H. L., Barendse, W., Womack, J. E., et al. (1993). Physically Mapped, Cosmid-Derived Microsatellite Markers as Anchor Loci on Bovine Chromosomes. Mamm. Genome 4, 720–727. doi:10.1007/BF00357796
Vaiman, D., Mercier, D., Moazami-Goudarzi, K., Eggen, A., Ciampolini, R., Lepingle, A., et al. (1994). A Set of 99 Cattle Microsatellites: Characterization, Synteny Mapping, and Polymorphism. Mamm. Genome 5, 288–297. doi:10.1007/BF00389543
Keywords: conservation genetics, infectious diseases, microsatellite, breed characterization, bovine
Citation: Freitas TMS, Dias JM, Veríssimo ACF, Lobo JR, Costa GL, Moura MId, Landi V, Martínez AM, Carmo ASd and Fioravanti MCS (2022) Population Structure of Curraleiro Pé-Duro Cattle and its Relationship With the Serological Profile Against Pathogens of Economic and Zoonotic Interest. Front. Genet. 13:872660. doi: 10.3389/fgene.2022.872660
Received: 09 February 2022; Accepted: 04 April 2022;
Published: 13 May 2022.
Edited by:
Albano Beja-Pereira, University of Porto, PortugalReviewed by:
Jose Bento Sterman Ferraz, University of São Paulo, BrazilGuillermo Giovambattista, CONICET Institute of Veterinary Genetics (IGEVET), Argentina
Copyright © 2022 Freitas, Dias, Veríssimo, Lobo, Costa, Moura, Landi, Martínez, Carmo and Fioravanti. This is an open-access article distributed under the terms of the Creative Commons Attribution License (CC BY). The use, distribution or reproduction in other forums is permitted, provided the original author(s) and the copyright owner(s) are credited and that the original publication in this journal is cited, in accordance with accepted academic practice. No use, distribution or reproduction is permitted which does not comply with these terms.
*Correspondence: Thais Miranda Silva Freitas, thais.freitas@fmb.edu.br
†These authors have contributed equally to this work and share first authorship