 Minjun Kim1
 Yoonji Chung1Prabuddha Manjula2Dongwon Seo3,4Sunghyun Cho1Eunjin Cho4Thisarani Kalhari Ediriweera4
 Myunghwan Yu1Sunju Nam1
 Jun Heon Lee1,4*
- 1Division of Animal and Dairy Science, Chungnam National University, Daejeon, Korea
- 2Department of Animal Science, Uva Wellassa University, Badulla, Sri Lanka
- 3Research Institute TNT Research Company, Jeonju, Korea
- 4Department of Bio AI Convergence, Chungnam National University, Daejeon, Korea
Coccidiosis caused by the Eimeria species is a highly problematic disease in the chicken industry. Here, we used RNA sequencing to observe the time-dependent host responses of Eimeria-infected chickens to examine the genes and biological functions associated with immunity to the parasite. Transcriptome analysis was performed at three time points: 4, 7, and 21 days post-infection (dpi). Based on the changes in gene expression patterns, we defined three groups of genes that showed differential expression. This enabled us to capture evidence of endoplasmic reticulum stress at the initial stage of Eimeria infection. Furthermore, we found that innate immune responses against the parasite were activated at the first exposure; they then showed gradual normalization. Although the cytokine-cytokine receptor interaction pathway was significantly operative at 4 dpi, its downregulation led to an anti-inflammatory effect. Additionally, the construction of gene co-expression networks enabled identification of immunoregulation hub genes and critical pattern recognition receptors after Eimeria infection. Our results provide a detailed understanding of the host-pathogen interaction between chicken and Eimeria. The clusters of genes defined in this study can be utilized to improve chickens for coccidiosis control.
Introduction
Chicken coccidiosis is a disease caused by protozoan parasites of the genus Eimeria (Blake and Tomley, 2014). These parasites invade the small or large intestine of chickens and cause tissue damage, leading to malnutrition, diarrhea, bloody stools, and (in severe cases) death (Lillehoj et al., 2007). Chicken coccidiosis is thus an important livestock disease that causes great economic loss to the poultry industry; anticoccidial drugs and vaccines are continuously used for prevention (Chapman et al., 2010). The establishment of a coccidiosis-resistant chicken variety would be an effective strategy for overcoming coccidiosis because it is consistent with the recent trend of reducing antibiotics; it would also reduce the cost of disease prevention (Jeffers, 1981). To achieve this goal, there is a need to identify physiological functions in chickens that are important under coccidial conditions. Eimeria infection promotes cell-mediated immunity in chickens; several immune cells (e.g., T lymphocytes and macrophages) have major roles in such immunity (Lillehoj and Trout, 1996). Previous studies have used a quantitative reverse transcription polymerase chain reaction (qRT-PCR) to identify differentially expressed genes (DEGs) during Eimeria infection by observing the immune response or using RNA sequencing (RNA-Seq) technology (Laurent et al., 2001; Wang et al., 2019).
The host response to coccidiosis parasites appears to differ over time (Bremner et al., 2021; Choi et al., 2021; Yu et al., 2021). For a more detailed understanding of the host response, there is a need to understand the biological functions performed in the body at different stages of infection. In this study, chronological DEGs in the cecum of chickens infected with multiple Eimeria species were identified via RNA-Seq. Clustering analysis was performed and gene co-expression networks were constructed to observe the main functions using enrichment analyses.
Materials and methods
Sample preparation and RNA-Seq
Thirty-nine 1-day-old (Indian River; Aviagen™) male broiler chickens were randomly allocated to 13 oocyst-free cages. After 14 days, 21 chickens (PC) were orally administrated with 1 ml of Livacox® T™ (Biopharm Co., Prague, Czech Republic) as positive control chickens (PC). A 10-fold dosage containing 3–5 × 10³ active oocysts of each of Eimeria acervulina, Eimeria tenella, and Eimeria maxima were used for infection. Eighteen non-challenged negative control (NC) birds were equally inoculated with distilled water to simulate inoculation stress. All PC and NC chickens were humanely euthanized at 4, 7, and 21 days post-infection (dpi), respectively. Cecum tissue samples of all chickens were collected in tubes with RNA-later and stored at −80°C for RNA extraction. Finally, 3 samples of NC and 5 samples of PC were randomly selected for sequencing at each time point. The overall experimental design is shown in Figure 1.
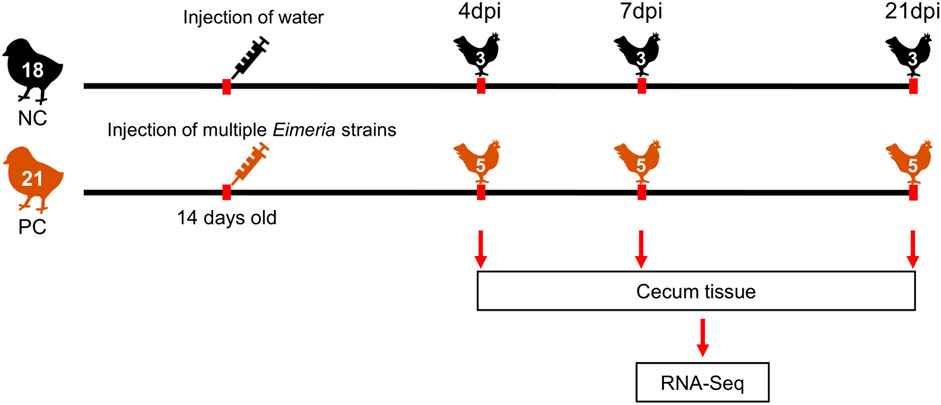
FIGURE 1. Overview of the experimental design. NC, Negative control; PC, Positive control; dpi, days post-infection.
Total RNA was isolated from tissue samples using TRIzol reagent (Invitrogen, Carlsbad, CA, United States) and processed with an RNeasy MinElute Cleanup Kit (Qiagen, Hilden, Germany). Total RNA integrity was determined using a 2,100 Bioanalyzer (Agilent Technologies, Palo Alto, CA, United States). All samples with RNA integrity numbers ≥ 7 were used for cDNA library construction, which was performed using a TruSeq stranded mRNA sample preparation kit (Illumina, San Diego, CA, United States) in accordance with the manufacturer’s guidelines. After library construction, all samples were sequenced using the Illumina NovaSeq 6,000 platform and 101 bp paired-end reads were generated.
Sequencing data processing and quantification of differentially expressed genes
Raw sequence read quality control was performed using the FastQC software v0.11.9. Sequencing adaptors and low-quality reads were trimmed using Cutadapt software v1.15 and Trimmomatic software v0.39. Before analysis, pre-processed reads were re-checked with FastQC, then mapped to the chicken reference genome (GRCg6a, GCA_000002315.5) using STAR software v2.7.7a. The reference genome was downloaded from the Ensemble genome browser FTP site (ftp.ensembl.org/pub/release-104/fasta/gallus_gallus/dna/); the index file of the reference genome was built using bowtie2 software v2.4.2 and samtools software v1.11. STAR software was used to count reads matching the genes, based on the exons in Gallus gallus GRCg6a v102 GTF (Ensembl) as a genomic annotation reference file. The EdgeR package v3.30.3 in Bioconductor software was used to quantify the reads mapped to each gene. Genes with a total read count ≤ 8 for all genes were excluded to avoid statistical bias in the identification of DEGs. Read count normalization was conducted with the trimmed mean of M-value (TMM) method. Differential expression analysis of two treatments (PC versus NC) at three time points (4, 7, and 21 dpi) was performed; the resulting p-values were corrected using the Benjamini-Hochberg procedure. The DEGs were determined with a level of absolute log2 fold-change (FC) ≥ 1 on an adjusted false discovery rate (FDR) corrected p-value of < 0.05.
Gene clustering analysis and gene co-expression network construction
After DEGs had been identified, their expression changes over time were analyzed via gene clustering. Genes were classified with the k-means clustering algorithm using each normalized TMM count. The k value that best distinguished the features of the gene expression pattern was used for subsequent analysis. MeV v4.9.0 software was used for the analysis and visualization of the results.
GCNs were established to enable analysis of the functional associations of genes. DEGs identified at least once at each time point were collected; instances of significant co-expression between genes were determined using the partial correlation coefficient with information theory (PCIT) algorithm. Associations with an absolute co-expression correlation ≥0.90 between DEGs were used to construct GCNs. After construction, GCNs containing at least 10 genes were considered meaningful. Cytoscape v3.8.2 software was used for network visualization.
Functional enrichment analysis
Annotations of gene ontology (GO) terms and a Kyoto Encyclopedia of Genes and Genomes (KEGG) pathway were performed for the enrichment analysis of genes clustered in gene groups. The biological process (BP) and molecular function (MF) databases were used for GO analysis. ClusterProfiler (Yu et al., 2012) R packages in Bioconductor were used for GO and KEGG analysis, and with a significant cut-off of p < 0.05. All annotation procedures were performed in Gallus gallus.
To identify significantly different enrichment terms between the PC and NC treatments at each time point, gene set enrichment analysis (GSEA) was performed via GSEA v4.1.0 software (Subramanian et al., 2005; Luo and Brouwer, 2013) using log2-normalized TMM counts of genes at each time point. Gene sets in the BP, cellular component, MF, and KEGG databases were used for the analysis; significant pathways (FDR-corrected p < 0.05) in the gene sets were listed as results.
Validation of RNA-Seq analysis via qRT-PCR
RNA isolation and cDNA synthesis were performed using cecum tissue samples from each individual of the treatment at each of the three time points. A Qiagen RNeasy kit was used for isolation; mRNA was converted into cDNA in the presence of Oligo d(T) primer (SuperScript IV, Invitrogen). Nine DEGs from each expression type were selected for validation; primers for qRT-PCR were designed using Primer-BLAST (https://www.ncbi.nlm.nih.gov/-tools/primer-blast/) and are listed (Supplementary Table S1 of Supplementary Material S1). qRT-PCR was carried out on a CFX Connect Real-Time System (Bio-Rad, Hercules, CA, United States) using SYBR green master mix (GeNetBio, Daejeon, Korea), in accordance with the manufacturer’s instructions. Relative gene expression was calculated using the delta-delta-Ct method. Finally, correlations of gene expression between the qRT-PCR and RNA-Seq analyses were estimated using R2 value.
Results
Gene expression analysis
In total, 983 million paired-end reads were generated using cecum tissue samples from 24 chickens. Read data were processed (processing overview is shown in Supplementary Materials S2) and mapped to the chicken reference genome (GRCg6a). Based on the calculated FC, 511 and 615 significant DEGs were detected at 4 and 7 dpi, respectively, whereas only 2 DEGs were found at 21 dpi; these results indicated a stark contrast, as demonstrated in volcano plots and a Venn diagram (Figure 2). Over time, the trends in gene regulation changed. At 4 dpi, 53% of the DEGs were upregulated, while this value was only 41% at 7 dpi. The number of DEGs indicates that the difference in gene expression between the NC and PC treatments was small at 21 dpi. Analysis of genes from all time points together revealed 999 unique DEGs in Eimeria-infected chickens.
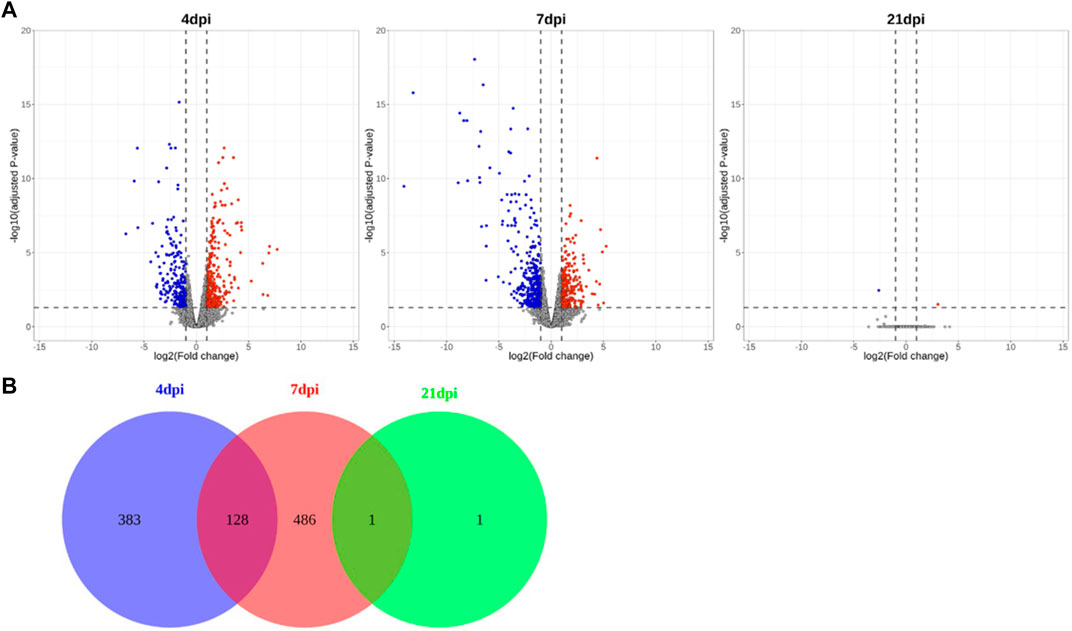
FIGURE 2. Volcano plots and Venn diagram showing significant DEGs obtained via time-series comparison between PC and NC treatments. (A) Volcano plots showing different time points, (B) Venn diagram indicating numbers of DEGs.
Clustering genes and gene co-expression network analysis
To analyze the biological regulation of the host response to Eimeria infection, DEGs were classified based on their expression patterns at each of the three time points. Overall, 999 genes were clustered into three groups, which comprised 436, 414, and 149 genes, respectively. The groups were referred to as Types 1 to 3 because of their distinct expression patterns, as shown in Figure 3A. The mean log2FC values of Type I genes over time were 0.87, −1.87, and −0.07, respectively; thus, expression level tended to sharply decrease after an initially high level in the initial stage of infection. In contrast, Type 2 genes were not active in the early stage of infection, then rebounded at 7 dpi and gradually normalized; the mean log2FC values over time were -1.13, 1.06, and 0.08, respectively. The mean log2FC values of Type 3 genes were 1.65, 0.65, and -0.31, respectively; these values tended to be high at 4 dpi, then decreased over time. Notably, 106 Type 1 genes were significantly upregulated at 4 dpi, then significantly downregulated at 7 dpi. Among Type 2 genes, 66 exhibited inverted regulation from 4 to 7 dpi.
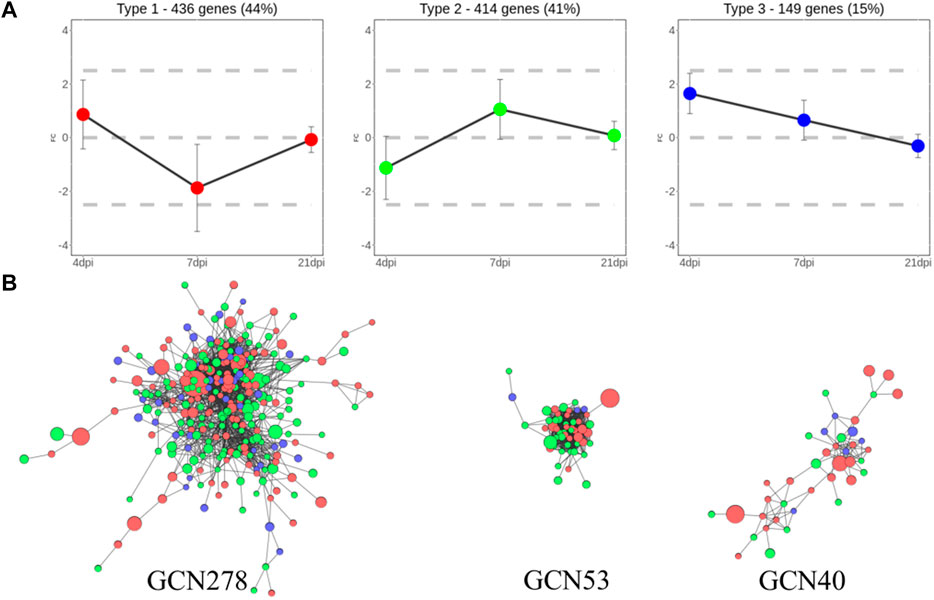
FIGURE 3. Clustered DEGs using two different grouping methods (A) Three types of clusters separated based on their gene expression patterns. In total, 436, 414, and 149 genes were assigned to Types 1, 2, and 3, respectively. (B) GCNs clustered using gene co-expression values. Each node is a gene colored with its expression type. Node size reflects absolute log2FC. Edges between nodes represent significant co-expression of genes. Network names reflect the number of genes they contain.
For additional clustering, GCNs were constructed using 371 genes with 2,656 connections after data had been passed through the PCIT algorithm. Three meaningful networks were formed; they were named GCN278, GCN53, and GCN40, based on the number of genes included in each network. Co-expression findings did not match the expression pattern clusters, as shown in Figure 3B. GCN278 comprised 111 Type 1 genes, 126 Type 2 genes, and 41 Type 3 genes. GCN53 comprised 22 Type 1 genes, 28 Type 2 genes, and three Type 3 genes (i.e., only a small number of Type 3 genes). GCN40 consisted of 21 Type 1 genes, 13 Type 2 genes, and six Type 3 genes; thus, it was characterized by a high proportion of Type 1 genes. All expression values, expression type group, and GCNs assigned to each DEGs are summarized in Supplementary Materials S3.
Functional enrichment analyses
GO and KEGG enrichment analyses were performed on the three types of expression pattern clusters and three GCNs. The results of the analyses are presented in Figures 4, 5, and Supplementary Materials S4. The top eight BP terms for the GO analysis of Type 1 genes involved lipid production and utilization processes; other functions were also observed (e.g., organic anion transport, homeostatic process, regulation of biological quality, and antibiotic metabolic process). Among Type 3 genes, BP terms related to the innate immune response (e.g., regulation of defense response, cytokine secretion, and inflammatory response) exhibited high significance; tissue regeneration and circulatory system development terms were also observed. No significant (p < 0.05) terms were found among Type 2 genes (Figure 4D,ED).
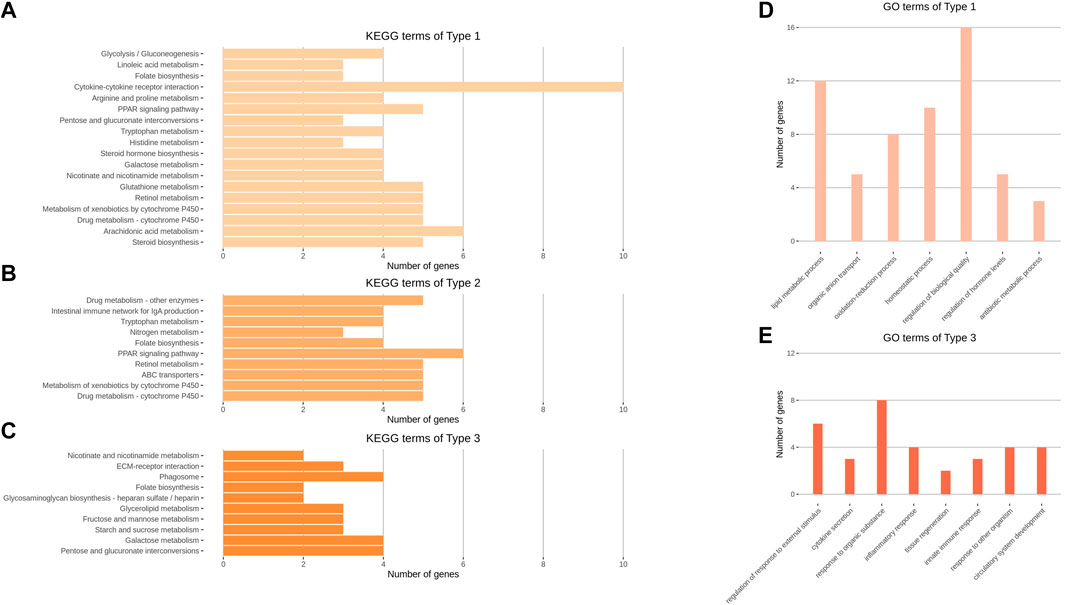
FIGURE 4. KEGG and GO analysis results of Type 1, 2, and 3 gene clusters. (A–C) Enriched KEGG pathways of Type 1, 2, and 3 genes clustered using the k-means clustering method. (D–E) Enriched GO terms of the biological process category of Types 1 and 3 gene clusters. Representative GO terms were selected from 53 to 188 significant terms of Types 1 and 3, respectively. GO analysis of Type 2 genes did not show any significant terms. (A–E) All enrichment terms passed a significance cut-off (p < 0.05) and were sorted in the order of largest significance levels.
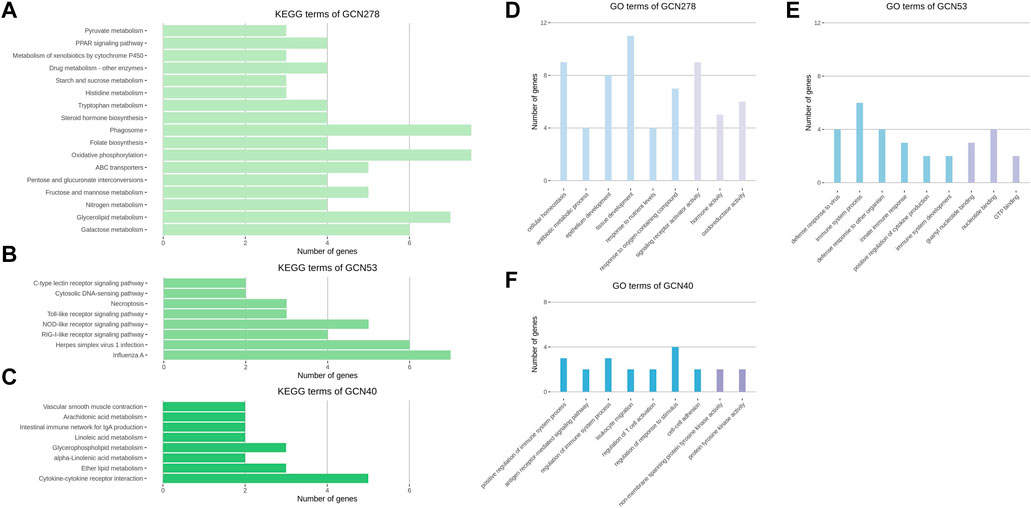
FIGURE 5. KEGG and GO analysis results of three GCNs. (A–C) Enriched KEGG pathways of the GCN278, GCN53, and GCN40 networks. (D–F) Enriched GO terms of the GCN278, GCN53, and GCN40 networks. GO terms were categorized as a biological process and molecular functions (colored blue and purple, respectively). Representative GO terms were selected from 26, 42, and 70 significant biological process terms and 12, 15, and 6 significant molecular functions terms for GCN278, GCN53, and GCN40, respectively. (A–F) All enrichment terms passed a significance cut-off (p < 0.05) and were sorted in the order of largest significance levels.
Characteristic results of KEGG analysis were identified in expression pattern clusters. Type 1 terms included steroid biosynthesis and cytokine-cytokine receptor interaction, while Type 2 terms included ABC transporters, nitrogen metabolism, and intestinal immune network for IgA production. Type 3 terms included nutrient metabolism, such as starch and sucrose metabolism, and phagosome and extracellular matrix–receptor interaction functions (Figure 4A–C).
The results of GCN functional analysis were as follows. The BP terms for GCN278 were cellular homeostasis, antibiotic metabolic process, and epithelium development; the MF terms were signaling receptor activator activity, hormone activity, and oxidoreductase activity. The top BP terms for GCN53 were innate immune response-related functions; nucleotide binding-related terms were identified in the MF database. In the GO analysis of GCN40, positive regulation of immune system process was the most significant BP term, together with leukocyte migration and cell-cell adhesion. Among the MF terms, functions related to protein tyrosine kinase activity were identified (Figure 5D–FD).
KEGG analysis of GCNs revealed distinct biological functions. In GCN278, there were oxidative phosphorylation and PPAR signaling pathway terms; in GCN53, influenza A and several types of receptor signaling pathways were enriched. Finally, in GCN40, the cytokine-cytokine receptor interaction, lipid metabolism, and intestinal immune network for IgA production terms were identified (Figure 5A–C).
Gene set enrichment analysis results associated with the time-series host response to Eimeria infection
GSEA was performed on the GO and KEGG databases to focus on the functions performed over time during Eimeria infection (Supplementary Material S5). At 21 dpi, genes with a small differential expression level were excluded from the analysis. Among the KEGG gene sets upregulated at 4 dpi after Eimeria infection, the most enriched term was steroid biosynthesis, consistent with the KEGG analysis results for Type 1 DEGs. There were 12 core enrichment genes in steroid biosynthesis; seven were DEGs. In addition, inflammatory response-related signaling pathways were upregulated terms. In terms of the normalized enrichment score, six of the top 10 GO terms were related to lipid or sterol synthesis and metabolic functions. In addition, the keratinization function had a high significance, such that 19 core enriched genes (including four DEGs) constituted the gene set.
Nutrient metabolic function terms such as glutathione, tyrosine, nitrogen, and phenylalanine were found in the KEGG terms upregulated at 7 dpi, consistent with the KEGG analysis results for Type 2 and Type 3 clusters. In addition, epithelial cell signaling in the Helicobacter pylori infection KEGG term was upregulated at 7 dpi, with 12 core enriched genes containing nine DEGs. GO analysis revealed many oxidative phosphorylation-related terms with a high normalized enrichment score; among the terms belonging to BP, the phagosome acidification term contained 10 core enrichment genes (including six DEGs) in the gene set. GSEA confirmed the functions downregulated during Eimeria infection. KEGG analysis at 7 dpi showed that the natural killer cell-mediated cytotoxicity pathway had 40 core genes, including three DEGs. GO analysis identified the phosphotyrosine residue binding term in the MF database, with 22 core-enriched genes including two DEGs.
qRT-PCR
To validate the differential expression indicated in RNA-Seq analysis, qRT-PCR was conducted using nine genes that were selected according to their gene expression types. The target genes were FABP2 (fatty acid binding protein 2), IFI6 (interferon alpha inducible protein 6), INSIG1 (insulin induced gene 1), KRT40 (keratin 40), IL13RA2 (interleukin 13 receptor subunit alpha 2), ART7B (GPI-anchored ADP-ribosyltransferase), IRF9 (interferon regulatory factor 9), CCKAR (cholecystokinin A receptor), and XKR9 (XK related 9). Relative quantification of gene expression was performed with ACTB (actin, beta) and YWHAZ (tyrosine 3-monooxygenase-/tryptophan 5-monooxygenase activation protein zeta) as control genes. Experimental samples were selected among the same treatment accordant with those used in RNA-Seq analysis. Throughout the three time points, expression values were calculated (Supplementary Table S2 in Supplementary Material S1) and the mean correlation of the expression patterns of the genes between RNA-Seq and qRT-PCR reached 0.811 (R2 = 0.658). Therefore, statistical analysis showed good correspondence between the qRT-PCR and RNA-Seq results.
Discussion
Coccidiosis is a critical parasitic disease in the chicken industry. To overcome the situation, recent studies indicated that chages from traditional methods to develop more effective anticoccidial vaccine (Venkatas and Adeleke, 2019). As another approach to the promising strategies to prevent the disease, this study aimed to characterize the host immune response that occurs in chickens under coccidiosis infection.
Blended effects on gene expression of cecum by multiple Eimeria species infection
Eimeria species is known as habitat-specific (Li et al., 2020). Accordingly, Eimeria acervulina, Eimeria tenella, and Eimeria maxima inhabit basically in duodenum, cecum, and jejunum respectively (Raman et al., 2011; Quiroz-Castañeda and Dantán-González, 2015). As the mRNA derived from the cecum tissue has been studied here, most of the effects on the identified responses are attributed to E. tenella. However, Li et al. (2019) observed that E. maxima-infection also affected the differential gene expression in the cecum tissue of chicken. Nonetheless, DEGs and the corresponding functions tended to be similar to those of chickens infected with E. tenella. Further, in the cecum, the transcriptome levels of genes responsive to E. tenella is known to be higher (Li et al., 2019). Hence, it manifests that the major effects described in this study are due to E. tenella and while some minor effects are shared with the other two strains.
Changes in number of differentially expressed genes over time
Whole serial transcriptomes for three time points (4, 7, and 21 dpi) after mixed strains of Eimeria infection were compared and integrated. The number of DEGs increased from 4 to 7 dpi, but DEGs almost disappeared at 21 dpi. According to Morris et al. (2007) and Long et al. (1981), coccidiosis-damaged cecal mucosa expresses inflammatory symptoms before 8 to 10 dpi; the mucosal surface then becomes normal. After 7 dpi, the degree of damage is alleviated and the host response decreases; thus, fewer significant differences were observed at 21 dpi.
An increase in the number of downregulated genes was observed at 7 dpi, consistent with the previous finding that strong downregulation occurred in chicken immune cells after infection (Sandholt et al., 2021); the effect of self-regulation was evident at 7 dpi. Self-regulation may be an immune mechanism to alleviate inflammation; alternatively, Eimeria may induce downregulation of host pathways as an immune evasion mechanism (Sandholt et al., 2021).
Functional analysis of endoplasmic reticulum stress response under Eimeria infection
GO, KEGG, and GSEA assessments of the Type 1 expression pattern cluster in this study suggested that lipid and sterol synthesis and metabolism are highly active at 4 dpi during Eimeria infection. Furthermore, some studies have shown that host cells can undergo ER stress because of intestinal parasite infection (e.g., coccidiosis), leading to an unfolded protein response (Galluzzi et al., 2017). A previous microarray analysis of intraepithelial lymphocytes from Eimeria-infected chickens revealed activation of the ER stress response mechanism (Liu et al., 2021). The ER is an organelle that synthesizes lipids; when homeostasis is disrupted because of continuous ER stress and excessive unfolded protein response, lipid synthesis regulation fails, eventually leading to metabolic disorders and apoptosis (Han and Kaufman, 2016). Therefore, the rapid increases in lipid synthesis and metabolism in the chickens at 4 dpi in this study were caused by Eimeria infection-related ER stress. To overcome the risk of ER homeostasis disruption, cells reduce the ribosome and protein synthesis pathways by downregulating the transcription of rRNA; this reduces the overall burden on the ER (Hotamisligil, 2010; Han and Kaufman, 2016). Thus, the GSEA results in this study indicated that downregulation of the ribosome term at 4 dpi occurred in response to ER stress. Furthermore, GSEA of the data from 7 dpi indicated upregulation of intracellular ribosome function, suggesting that ER homeostasis had been restored by that time. Key Type 1 genes for lipid biosynthesis (e.g., FDPS, BC O 1, and EXFABP) showed significant downregulation at 7 dpi; this presumably aided in ER homeostasis.
Innate immune response after Eimeria infection
The findings in GO analysis of Type 3 genes could be explained by the innate immune response to Eimeria infection, including both the direct defense mechanisms and cytokines released via leukocyte activity and inflammatory responses. Innate immune responses were initially active and relieved afterward, following the chronological expression of Type 3 genes. In addition, functional enrichment analysis indicated that genes in the GCN53 network were mainly responsible for the innate immune mechanism. In the KEGG analysis of GCN53, DEGs included in influenza A and herpes simplex virus 1 infection-related terms showed high significance; these genes also have a protective function during coccidiosis. The activation of necroptosis and pattern recognition receptor (RIG-I-like receptor, NOD-like receptor, and Toll-like receptor) signaling pathways leads to the release of pathogen-associated molecular patterns or danger-associated molecular patterns through the death of infected cells. This release is likely to promote innate immune system activation and the upregulation of inflammatory responses (Franchi et al., 2009; Haunshi et al., 2017). In addition, among the terms upregulated at 4 dpi in the GSEA results, the virus defense response, MDA5 signaling, interferon I, response to cytokine stimulus, and adipocytokine signaling pathway terms supported the results of the analysis described above. Because the keratinization, cornification, epidermis development, and cornified envelope terms exhibited concomitant upregulation at 4 dpi, the development and differentiation of intestinal epithelial cells were presumed to defend against parasitic stimuli. Furthermore, the formation of a physical barrier through keratinization, such as the response of gizzard epithelial cells to parasitic infection in waterfowl (Padilla-Aguilar et al., 2020) provided a potential defense against Eimeria invasion. For the same purpose, bicellular tight junction assembly, a GO term upregulated at 7 dpi according to GSEA, forms a gut barrier through cell proliferation, differentiation, and organization (von Buchholz et al., 2021).
Cytokine-cytokine receptor interaction and the anti-inflammatory process in response to Eimeria infection
The cytokine-cytokine receptor interaction term had the largest number of genes (10 genes) among the KEGG enrichment analysis results of the Type 1 cluster. Genes related to the cytokine-cytokine receptor interaction term belonged to the Type 1 cluster; these included IL13RA2 (interleukin 13 receptor subunit alpha 2), CXCL13 (CXC motif chemokine ligand 13), CXCR5 (CXC motif chemokine receptor 5), GDF15 (growth differentiation factor 15), IL7R (interleukin 7 receptor), IL12RB2 (interleukin 12 receptor subunit beta 2), BMP7 (bone morphogenetic protein 7), TNFRSF11B (TNF receptor superfamily member 11b), IL22 (interleukin 22), and IFNGR1 (interferon-gamma receptor 1). These genes were involved in the inflammatory pathway; they were also responsible for activating the immune response through the migration of T and B lymphocytes. Importantly, growth differentiation factor 15 levels have been shown to increase in injured tissues; this gene has a role in inflammatory processes (Wischhusen et al., 2020). Moreover, interleukin 12 receptor subunit beta 2 contributes to the inflammatory response and host defense (Zou et al., 1997). All genes except IFNGR1 were upregulated at 4 dpi during Eimeria infection, although they were significantly downregulated at 7 dpi. The IFNGR1 gene codes interferon-gamma receptor 1; it interacts with interferon-gamma molecules. Interferon-gamma, a cytokine produced by macrophages, has an important role in cell-mediated acquired immunity; it functions in a synergistic manner with major histocompatibility complex (MHC) class II molecules (Yun et al., 2000). There have also been reports of the protective immune functions of interferon-gamma against Eimeria (Shah et al., 2010). However, in this study, significant downregulation of the IFNGR1 gene continued at 4 and 7 dpi. The interferon-gamma-related function may have been activated in chickens immediately after infection (i.e., before the first sampling), and the downregulation began prior to 4 dpi. Similar to the immune systems described by Sandholt et al. (2021), the cytokine-cytokine receptor interaction pathway exhibits continuous downregulation to suppress the Eimeria-induced inflammatory response and autoimmunity after the initial stage of innate immune activity.
KEGG analyses of GCN40 revealed that the cytokine-cytokine receptor interaction pathway exhibited the highest enrichment score; BP terms related to the regulation of the immune system process were identified in the GO analysis of GCN40. The BTK, SYK, and FAM65B genes were the enriched core genes for the BP terms. BTK and SYK together have critical roles in the immune response that involve the activation of PLC-gamma, which is necessary for the activity and migration of B and T lymphocytes (Kurosaki and Tsukada, 2000). In the present study, BYK and SYK genes were significantly downregulated at 4 and 7 dpi, respectively. In contrast, the FAM65B gene was significantly upregulated at 7 dpi, in association with negative regulation of the leukocyte activation GO term. Therefore, while an active innate immune response was underway against Eimeria invasion, opposing mechanisms to inhibit lymphocyte activity were activated for anti-inflammatory effects, as described above.
Conclusion
In this study, time-series host response pathways in Eimeria-infected broiler chicken were observed via RNA-Seq. From 4dpi to 21dpi, Eimeria-infected chickens experienced dynamic changes; a total of three types of gene expression patterns, which are characterized by fluctuant up and down regulation and the different number of DEGs. These transitions reflected the real-time state of immune and homeostasis mechanisms against parasitic invasion. Upon closer inspection, organelle malfunction and activated innate immune response occurred at 4 dpi, and the next, recovery from the impairment and inflammation control were dominant at 7 dpi. Eventually, there were few significant DEGs between infected and uninfected birds at 21dpi. In other words, we summarized that the main host responses were related to ER stress-induced functional changes and the signaling systems responsible for the innate immune response. Additionally, gene clustering analysis and GCN analysis revealed networks of genes that play important roles during Eimeria infection. For example, the Type 3 cluster and GCN53 genes are mostly involved with innate immune response functions, and the part of Type 1 cluster and GCN40 genes mainly work for inflammation and anti-inflammation respectively. The identification of significant DEGs and the results of the gene grouping analysis in this study will help to improve disease control by aiding in the selection of chickens.
Data availability statement
The datasets presented in this study can be found in online repositories. The names of the repository/repositories and accession number(s) can be found below: NCBI SRA BioProject, accession no: PRJNA844579.
Ethics statement
The animal study was reviewed and approved by the Animal Ethics Committee of Chungnam National University.
Author contributions
JL provided experimental conception and journal selection. MK carried out data analysis and manuscript writing. PM and MY contributed to the experimental design and sample preparation. YC and DS contributed to supervision of data analysis and preparation of figures. SC and EC involved in interpretation of the analysis results. TE participated in manuscript preparation. SN assisted with qRT-PCR experiment. All authors contributed to the article and approved the submitted version.
Funding
This work was supported by a grant from the National Research Foundation, Republic of Korea (grant number MHC-2019R1F1A1061670), and an Institute of Information & Communications Technology Planning & Evaluation (IITP) grant funded by the Korea government (MSIT) (grant number 2020-0-01441, Artificial Intelligence Convergence Research Center, Chungnam National University).
Acknowledgments
We would like to thank Byeonghwi Lim, Chiwoong Lim, and Jun-Mo Kim of Department of Animal Science and Technology in Chung-Ang University for consultations and help with analyses.
Conflict of interest
Author DS was employed by the company Research Institute TNT Research Company.
The remaining authors declare that the research was conducted in the absence of any commercial or financial relationships that could be construed as a potential conflict of interest.
Publisher’s note
All claims expressed in this article are solely those of the authors and do not necessarily represent those of their affiliated organizations, or those of the publisher, the editors and the reviewers. Any product that may be evaluated in this article, or claim that may be made by its manufacturer, is not guaranteed or endorsed by the publisher.
Supplementary material
The Supplementary Material for this article can be found online at: https://www.frontiersin.org/articles/10.3389/fgene.2022.886781/full#supplementary-material
References
Blake, D. P., and Tomley, F. M. (2014). Securing poultry production from the ever-present Eimeria challenge. Trends Parasitol. 30 (1), 12–19. doi:10.1016/j.pt.2013.10.003
Bremner, A., Kim, S., Morris, K. M., Nolan, M. J., Borowska, D., Wu, Z., et al. (2021). Kinetics of the cellular and transcriptomic response to Eimeria maxima in relatively resistant and susceptible chicken lines. Front. Immunol. 12, 653085. doi:10.3389/fimmu.2021.653085
Chapman, H., Jeffers, T., and Williams, R. (2010). Forty years of monensin for the control of coccidiosis in poultry. Poult. Sci. 89 (9), 1788–1801. doi:10.3382/ps.2010-00931
Choi, J., Ko, H., Tompkins, Y. H., Teng, P.-Y., Lourenco, J. M., Callaway, T. R., et al. (2021). Effects of Eimeria tenella infection on key parameters for feed efficiency in broiler chickens. Animals. 11 (12), 3428. doi:10.3390/ani11123428
Franchi, L., Warner, N., Viani, K., and Nuñez, G. (2009). Function of Nod-like receptors in microbial recognition and host defense. Immunol. Rev. 227 (1), 106–128. doi:10.1111/j.1600-065X.2008.00734.x
Galluzzi, L., Diotallevi, A., and Magnani, M. (2017). Endoplasmic reticulum stress and unfolded protein response in infection by intracellular parasites. Future Sci. OA 3 (3), FSO198. doi:10.4155/fsoa-2017-0020
Han, J., and Kaufman, R. J. (2016). The role of ER stress in lipid metabolism and lipotoxicity. J. Lipid Res. 57 (8), 1329–1338. doi:10.1194/jlr.R067595
Haunshi, S., Burramsetty, A. K., Kannaki, T., Ravindra, K. R., and Chatterjee, R. (2017). Pattern recognition receptor genes expression profiling in indigenous chickens of India and White Leghorn. Poult. Sci. 96 (9), 3052–3057. doi:10.3382/ps/pex113
Hotamisligil, G. S. (2010). Endoplasmic reticulum stress and the inflammatory basis of metabolic disease. Cell 140 (6), 900–917. doi:10.1016/j.cell.2010.02.034
Jeffers, T. (1981). Resistance and cross-resistance studies with narasin, a new polyether antibiotic anticoccidial drug. Avian Dis. 25, 395–403.
Kurosaki, T., and Tsukada, S. (2000). Blnk: connecting syk and btk to calcium signals. Immunity 12 (1), 1–5. doi:10.1016/s1074-7613(00)80153-3
Laurent, F., Mancassola, R., Lacroix, S., Menezes, R., and Naciri, M. (2001). Analysis of chicken mucosal immune response to Eimeria tenella and Eimeria maxima infection by quantitative reverse transcription-PCR. Infect. Immun. 69 (4), 2527–2534. doi:10.1128/IAI.69.4.2527-2534.2001
Li, C., Yan, X., Lillehoj, H. S., Oh, S., Liu, L., Sun, Z., et al. (2019). Eimeria maxima-induced transcriptional changes in the cecal mucosa of broiler chickens. Parasit. Vectors 12 (1), 285. doi:10.1186/s13071-019-3534-4
Li, W., Wang, M., Chen, Y., Chen, C., Liu, X., Sun, X., et al. (2020). EtMIC3 and its receptors BAG1 and ENDOUL are essential for site-specific invasion of Eimeria tenella in chickens. Vet. Res. 51 (1), 90. doi:10.1186/s13567-020-00809-6
Lillehoj, H., Kim, C.-H., Keeler, C., and Zhang, S. (2007). Immunogenomic approaches to study host immunity to enteric pathogens. Poult. Sci. 86 (7), 1491–1500. doi:10.1093/ps/86.7.1491
Lillehoj, H. S., and Trout, J. M. (1996). Avian gut-associated lymphoid tissues and intestinal immune responses to Eimeria parasites. Clin. Microbiol. Rev. 9 (3), 349–360. doi:10.1128/CMR.9.3.349-360.1996
Liu, B., Ma, X., and Cai, J. (2021). Construction and analysis of coexpression network to understand biological responses in Chickens infected by Eimeria tenella. Front. Vet. Sci. 8, 688684. doi:10.3389/fvets.2021.688684
Long, P., Johnson, J., and Wyatt, R. (1981). Pathological and clinical effects of Eimeria tenella in partially immune chickens. J. Comp. Pathol. 91 (4), 581–587. doi:10.1016/0021-9975(81)90087-6
Luo, W., and Brouwer, C. (2013). Pathview: an R/bioconductor package for pathway-based data integration and visualization. Bioinformatics 29 (14), 1830–1831. doi:10.1093/bioinformatics/btt285
Morris, G. M., Woods, W. G., Richards, D. G., and Gasser, R. B. (2007). Investigating a persistent coccidiosis problem on a commercial broiler–breeder farm utilising PCR-coupled capillary electrophoresis. Parasitol. Res. 101 (3), 583–589. doi:10.1007/s00436-007-0516-9
Padilla-Aguilar, P., Romero-Callejas, E., Ramírez-Lezama, J., Osorio-Sarabia, D., García-Prieto, L., Manterola, C., et al. (2020). Gastrointestinal helminths of waterfowl (Anatidae: Anatinae) in the Lerma marshes of central Mexico: Some pathological aspects. Int. J. Parasitol. Parasites Wildl. 13, 72–79. doi:10.1016/j.ijppaw.2020.07.008
Quiroz-Castañeda, R. E., and Dantán-González, E. (2015). Control of avian coccidiosis: Future and present natural alternatives. Biomed. Res. Int. 2015, 430610. doi:10.1155/2015/430610
Raman, M., Banu, S. S., Gomathinayagam, S., and Raj, G. D. (2011). Lesion scoring technique for assessing the virulence and pathogenicity of Indian field isolates of avian Eimeria species. Veterinarski arh. 81 (2), 259–271.
Sandholt, A. K., Xu, F., Söderlund, R., Lundén, A., Troell, K., Svärd, S. G., et al. (2021). Dual RNA-Seq transcriptome analysis of chicken macrophage-like cells (HD11) infected in vitro with Eimeria tenella. Parasitology 148 (6), 712–725. doi:10.1017/S0031182021000111
Shah, M. A. A., Song, X., Xu, L., Yan, R., Song, H., Ruirui, Z., et al. (2010). The DNA-induced protective immunity with chicken interferon gamma against poultry coccidiosis. Parasitol. Res. 107 (3), 747–750. doi:10.1007/s00436-010-1940-9
Subramanian, A., Tamayo, P., Mootha, V. K., Mukherjee, S., Ebert, B. L., Gillette, M. A., et al. (2005). Gene set enrichment analysis: a knowledge-based approach for interpreting genome-wide expression profiles. Proc. Natl. Acad. Sci. U. S. A. 102 (43), 15545–15550. doi:10.1073/pnas.0506580102
Venkatas, J., and Adeleke, M. (2019). A review of Eimeria antigen identification for the development of novel anticoccidial vaccines. Parasitol. Res. 118 (6), 1701–1710. doi:10.1007/s00436-019-06338-2
von Buchholz, J. S., Bilic, I., Aschenbach, J. R., Hess, M., Mitra, T., Awad, W. A., et al. (2021). Establishment of a novel probe-based RT-qPCR approach for detection and quantification of tight junctions reveals age-related changes in the gut barriers of broiler chickens. Plos one 16 (3), e0248165. doi:10.1371/journal.pone.0248165
Wang, X., Zou, W., Yu, H., Lin, Y., Dai, G., Zhang, T., et al. (2019). RNA sequencing analysis of chicken cecum tissues following Eimeria tenella infection in vivo. Genes 10 (6), 420. doi:10.3390/genes10060420
Wischhusen, J., Melero, I., and Fridman, W. H. (2020). Growth/differentiation factor-15 (GDF-15): from biomarker to novel targetable immune checkpoint. Front. Immunol. 11, 951. doi:10.3389/fimmu.2020.00951
Yu, G., Wang, L.-G., Han, Y., and He, Q.-Y. (2012). clusterProfiler: an R package for comparing biological themes among gene clusters. Omics a J. Integr. Biol. 16 (5), 284–287. doi:10.1089/omi.2011.0118
Yu, H., Zou, W., Mi, C., Wang, Q., Dai, G., Zhang, T., et al. (2021). Research Note: Expression of T cell-related cytokines in chicken cecal and spleen tissues following Eimeria tenella infection in vivo. Poult. Sci. 100 (7), 101161. doi:10.1016/j.psj.2021.101161
Yun, C., Lillehoj, H., and Lillehoj, E. (2000). Intestinal immune responses to coccidiosis. Dev. Comp. Immunol. 24 (2-3), 303–324. doi:10.1016/s0145-305x(99)00080-4
Keywords: chicken, host-pathogen interaction, innate immunity, anti-inflammation, transcriptome analysis, gene co-expression network, Eimeria
Citation: Kim M, Chung Y, Manjula P, Seo D, Cho S, Cho E, Ediriweera TK, Yu M, Nam S and Lee JH (2022) Time-series transcriptome analysis identified differentially expressed genes in broiler chicken infected with mixed Eimeria species. Front. Genet. 13:886781. doi: 10.3389/fgene.2022.886781
Received: 28 February 2022; Accepted: 12 July 2022;
Published: 08 August 2022.
Edited by:
Klaus Wimmers, Leibniz Institute for Farm Animal Biology (FBN), GermanyReviewed by:
Abiodun Joseph Fatoba, University of KwaZulu-Natal, South AfricaMahmoud Kandeel, Kafrelsheikh University, Egypt
Xiaokai Song, Nanjing Agricultural University, China
Copyright © 2022 Kim, Chung, Manjula, Seo, Cho, Cho, Ediriweera, Yu, Nam and Lee. This is an open-access article distributed under the terms of the Creative Commons Attribution License (CC BY). The use, distribution or reproduction in other forums is permitted, provided the original author(s) and the copyright owner(s) are credited and that the original publication in this journal is cited, in accordance with accepted academic practice. No use, distribution or reproduction is permitted which does not comply with these terms.
*Correspondence: Jun Heon Lee, junheon@cnu.ac.kr