Remote detection of fungal pathogens in viticulture using laser-induced fluorescence: an experimental study on infected potted vines
 Christoph Kölbl1*†
  Manu Diedrich1†
  Elias Ellingen1
  Frank Duschek1
  Moustafa Selim2 Beate Berkelmann-Löhnertz2
- 1Institute of Technical Physics, German Aerospace Center (DLR), Hardthausen, Germany
- 2Department of Crop Protection, Hochschule Geisenheim University, Geisenheim, Germany
Introduction: Pathogenic fungi, such as Plasmopara viticola and Erysiphe necator, severely threaten the annual yield of grapes in both quantity and quality. In contrast to other crop production systems, fungicides are intensively applied in viticulture as a countermeasure. The goal of precision viticulture is to optimize vineyard performance as well as the environmental impact by reducing fungicides and applying different techniques and combined strategies. Therefore, new emerging technologies are required, including non-invasive detection, as well as monitoring and tools for the early and in-field detection of fungal development.
Methods: In this study, we investigated leaves of potted vines (Vitis vinifera cv. ‘Riesling’) and traced the development of the inoculated leaves using our new remote detection system vinoLAS®, which is based on laser-induced fluorescence spectroscopy. We ran a measurement campaign over a period of 17 days.
Results: We were able to detect a leaf infection with P. viticola, the causal agent of downy mildew, between 5 and 7 days after inoculation. Our results provide evidence for a successful application of laser-based standoff detection in vineyard management in the future. Thus, the vinoLAS system can serve as a model technology for the detection of pathogenic disease symptoms and thus monitoring complete vineyard sites. This allows for early countermeasures with suitable crop protection approaches and selected hot-spot treatments.
Discussion: As P. viticola is considered one of the most damaging fungi in European viticulture, disease mapping via this monitoring tool will help to reduce fungicide applications, and will, therefore, support the implementation of the European Green Deal claims.
1 Introduction
Fungal diseases threaten the annual yield of grape harvests. In Europe, most cultivars of the widely planted grapevine species Vitis vinifera are susceptible to Plasmopara viticola, the causal agent of downy mildew. Downy mildew is one of the most destructive diseases affecting viticulture as it is able to attack the leaves and grapes in different ways, especially in temperate–humid climates (Latouche et al., 2015; Buonassisi et al., 2017; Koledenkova et al., 2022). Currently, grapevine yields are bolstered by the massive use of fungicides to protect the vines against fungal infections. These measures have a huge environmental impact (Roßberg, 2013). For this reason, combined strategies have to be applied in viticulture, including the early detection of pathogens and the optimization of pesticide application, as well as additional approaches on canopy architecture (Klärner et al., 2015; Berkelmann-Löhnertz et al., 2017).
The current grapevine protection strategy in Germany is aiming for qualitatively and quantitatively high-quality primary products. It is based on a combination of measures in accordance with Integrated Crop Management (IPM) programs and best practice approaches (Gute Fachliche Praxis). However, viticulture is missing a comprehensive and fast disease/pathogen assessment and a fast monitoring tool to get an overview of the epidemiological status of each grape disease at a single site. Conventional approaches are laboratory-intensive methods and always cover a random sample only, not the complete vineyard. Unlike manually based approaches, optical spectroscopy is a rapid, cost-effective, and non-destructive method, which does not require any sample preparation (Kumar et al., 2021). In addition, remote detection (Ammoniaci et al., 2021) in combination with deep learning (Tardaguila et al., 2021) has the potential for early disease detection or pre-symptomatic diagnosis of abiotic stress. Nowadays, thermal (Stoll et al., 2008) and hyperspectral (Nguyen et al., 2021) imaging are quite common techniques, but both are passive optical methods with signatures that are influenced by environmental conditions. In contrast to that, active technologies, such as laser-induced fluorescence (LIF) spectroscopy, offer two major advantages. First, active illumination with a pulsed laser enables gated data acquisition, which makes efficient background suppression possible. Hence, the system can be used regardless of weather conditions (day- and nighttime operation). Second, the laser enhances the sensitivity and selectivity, making such a system a promising diagnostic and monitoring technique in vineyards.
However, all available LIF systems need close contact with the sample surface (Belasque et al., 2008). To tackle this disadvantage and other requirements needed for operational use, we developed the so-called vinoLAS® system. vinoLAS is a new, innovative LIF system that is especially tailored for fast, non-invasive remote detection of pathogens in viticulture. To confirm the operational readiness of our vinoLAS system for usage in relevant target environments, we address the following objectives:
Objective A: is the vinoLAS system able to reliably remote detect specific pathogen symptoms in vineyards? Which system performance can be achieved, and which assessment can be developed to compare the key figures with published, usually close-contact, systems?
Objective B: to what extent does the pathogenesis affect the remote sensing and the fluorescence signals over time? After what time can the first latent, asymptomatic infections within the incubation period be detected with the vinoLAS system?
Objective C: does the orientation of the leaf surface (upper vs. lower) have an influence on the structure and strength of the fluorescence signal or on the detectability of the pathogen, as sporangiophores and sporangia of downy mildew grow on the lower leaf surface?
To address these objectives, extensive LIF spectroscopic measurements have been performed with the vinoLAS research model for characterization and validation. We took P. viticola, the causal agent of downy mildew, as a model pathogen. Within this framework of our performed measurements, we investigated the fluorescence signatures of healthy and infected leaves of potted vines cv. ‘Riesling’. On this basis, an assessment is developed to determine whether in general or at which time after inoculation detection of the fungus itself or downy mildew disease development are possible. These results contribute to the ongoing efforts to achieve sustainable viticulture using fungicides in a reduced but optimized way as outlined in the European Green Deal (Commission, 2022). Furthermore, they provide the basis for improving the vinoLAS system to create a remote detection system for other pathogens in viticulture with operational readiness.
2 Materials and methods
2.1 The vinoLAS system
Our vinoLAS research model is based on LIF spectroscopy, which is a highly sensitive measurement technique. It allows us to distinguish between different biomolecules by tuning the laser to a particular excitation wavelength, which is not shared by other species, or by time-resolved investigations (Weiss, 1999; Johnson and Landers, 2004; Corcoran, 2014). In addition, LIF spectroscopy allows for remote detection (Duschek et al., 2017), building in this case the basis of the vinoLAS system. The vinoLAS system is unique as it is capable of multiwavelength excitation, which is especially optimized for non-invasive optical remote detection in viticulture. The simplified setup is depicted in Figure 1.
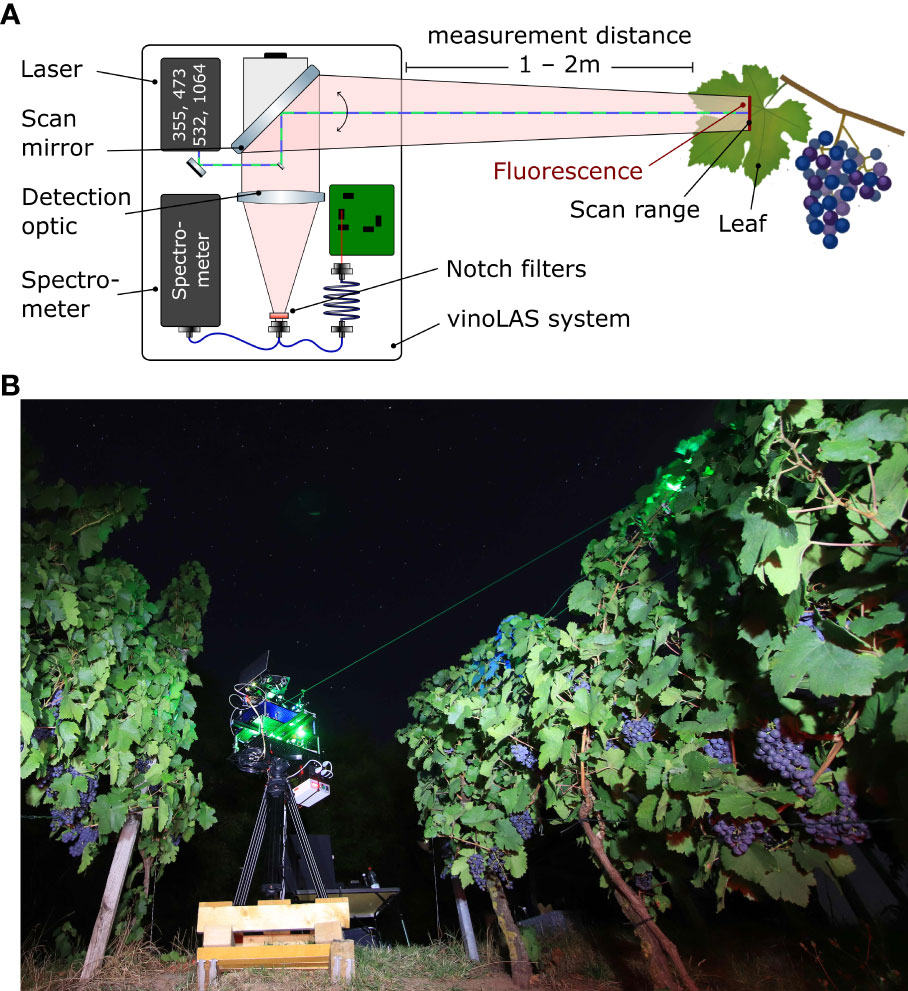
Figure 1 (A) Schematic illustration of the experimental measurement configuration of the vinoLAS research model. The laser beams are guided through a scan mirror to the sample surface, where the LIF is excited. The fluorescence light is collected with a detection optic and coupled via optical fibers to a spectrometer and a four-channel data acquisition device. (B) Picture of the vinoLAS research model during a test measurement campaign in a vineyard.
The system consists of two passive q-switched nanosecond laser modules, emitting at wavelengths of 236 nm and 473 nm, as well as 355 nm, 532 nm, and 1,064 nm. Here, vinoLAS used the wavelengths of 355 nm, 473 nm, and 532 nm for fluorescence excitation and 1,064 nm for reflection measurements and calibration purposes, whereas the 236-nm wavelength was not used. The high laser repetition rate of 5 kHz makes it possible to use a movable scan mirror in the system for scanning over the sample surfaces during fluorescence excitation with a high level of spatial resolution. All laser beams are colinearly aligned to the optical axis of the scan mirror and the detection optics. After LIF excitation of the sample, the generated light is collected through the scan mirror and detection optics. Before coupling to an optical fiber, notch filters at 355 nm, 475 nm, and 532 nm are used for suppression of the Rayleigh-scattered laser light. A bifurcated fiber is used to send the light to either a spectrometer or a four-channel data acquisition device. The spectrometer can acquire a fluorescence spectrum with high levels of spectral resolution but with limited temporal resolution, and hence averages over consecutive pulses. In contrast, the four-channel data acquisition device has only four individual spectral channels, but with a high level of temporal resolution.
These cover exactly the spectral bands for detecting chlorophyll fluorescence (ChlF; 675 nm and 735 nm) and blue-green fluorescence (BGF; 450 nm and 530 nm). The detection optics and data acquisition are currently optimized for a typical detection distance of between 1 m and 2 m due to the time-of-flight delay of the laser pulses. The field of view of the scan range is between −5° and 80° toward the horizontal. Both conditions fit the requirements of viticulture for using the system later on in vineyards between the rows of vines. Herein, we used the vinoLAS system under laboratory conditions as a research model.
2.2 Potted vines
In this study, we used 20 potted vines (Vitis vinifera L. cv. ‘Riesling’) grown in a greenhouse at Geisenheim University in standard potting medium in pots with a 15-cm diameter. With the exception of the non-watered plants (two plants), the general treatment for watering and illumination were the same for all plants. Watering was managed by hose supply and was done 2 days before inoculation and on the day of inoculation, as well as 3, 7, and 11 days after inoculation. Furthermore, to ensure reproducible illumination conditions, the plants were stored under greenhouse conditions in the dark and automatically illuminated every day from 10 p.m. to 6 a.m. by plant lamps [PAR38 light-emitting diode (LED); Megaman].
The potted vines were divided into two groups, imposing different treatments: (a) an inoculated group (10 potted vines; positive control) treated with a sporangia suspension of P. viticola at a concentration of 1 × 10⁵ ml−1; and (b) a non-inoculated group (10 potted vines; negative control) treated with demineralized water. From both groups, one individual potted vine was not watered.
2.3 Sample preparation
The inoculation of the potted vines was done in the chemical laboratory facilities of the German Aerospace Center Institute of Technical Physics, in collaboration with staff from Geisenheim University. The inoculation process consists of several steps. First, a suspension of sporangia of P. viticola was produced in demineralized water (Arium® Mini, Sartorius) by rinsing already infected leaves from greenhouse plants with demineralized water. Then, the suspension was filtered and homogenized at room temperature with a magnetic stirrer. Using a Thoma cell counting chamber, we determined the concentration of the suspension. Subsequently, we diluted the suspension with demineralized water and adjusted the sporangia concentration to approximately 1 × 10⁵ ml−1. In the next step, plants in the inoculated group were inoculated by spraying the sporangial suspension on the lower leaf surfaces until run-off to ensure a high and uniform infection with P. viticola. The vines of the non-inoculated group were sprayed with demineralized water only. Immediately after inoculation, all potted vines were covered with wet polyethylene bags overnight to maintain a high relative humidity, to allow the zoospores to find the stomata before the water film dried, and to ensure the viability of the pathogen. The day of inoculation was defined as 0 dpi (days post inoculation).
2.4 Experimental design and measurement procedure
All presented measurements were taken using the vinoLAS research model in a laboratory configuration. Thus, for each measurement, the distance between the vinoLAS system and the leaf was adjusted to 1.6 m. In addition, the scan range was reduced to approximately 2°, corresponding to a scan profile length of 5.5 cm. This ensured that the scan range did not exceed the size of the measured leaf.
To enhance practicality, experiments in Sections 3.1 and 3.3, as well as for the long-term measurements in Section 3.2 from each plant group, all potted vines were measured once and daily, respectively. For each potted vine, an arbitrary leaf was selected and used as a representative sample. An adequate reproducible measurement was ensured by drawing small markings on the upper leaf side with a commercially available marker pen, which defined the limits of the scan range. These markings had no negative influence on the leaf itself, but ensured that we could always measure the same leaf area in the course of the campaign, even if potted vines were exchanged. To ensure high reproducibility, we developed a measurement protocol that was applied during the whole campaign. The measurements were performed every day from 9 a.m. until 5 p.m. For hardware control, as well as for data acquisition, a self-written, terminal-based measurement Python script was used. Initially, a standardized calibration procedure of the scan mirror was carried out. Correct alignment ensured that the laser beams of the vinoLAS system precisely hit a fluorescence calibration target for reference purposes. This guaranteed that the marked scan range on the leaf was precisely measured during acquisition. Subsequently, current room temperature and humidity data were saved before the actual LIF measurement started. Hence, the software toggled each individual excitation laser beam and started, or rather stopped, the acquisition of the laser-induced fluorescence spectra, whereas for reference measurements (dark) all lasers were always blocked by optical shutters. The acquisition time for a scan was set to 20 s to achieve an appropriate signal-to-noise ratio.
During the whole measurement campaign, this procedure was repeated. Altogether, the experiment lasted a period of 17 days. We started with our first measurements 3 days before inoculation. This makes a direct comparison between the two groups of vines—inoculated and non-inoculated—easier.
Because in the field operation the orientation of foliage can be arbitrarily oriented in reference to the optical axis of the vinoLAS system, we also investigated the influence of the orientation on LIF signals on arbitrarily selected potted vines. For the case of downy mildew, the upper leaf surface is mainly influenced by the first disease symptoms at the end of the incubation period, with the appearance of oil spots (Kennelly et al., 2007). The subsequent growth of sporangiophores with sporangia only occurs on the lower leaf surface. Based on the research from Zhang and Dickinson (2001) and Zhang et al. (2020), we characterized the impact of leaf orientation on the detectability of both oil spots and sporangiophores. Herein, we focus on differences between the upper and the lower leaf surface.
In addition, all measured plants were assessed daily for downy mildew development and specific symptoms by visual rating and RGB photographs from different angles. In total, we gathered over 22 GB of data, including 5,760 LIF spectra and 1,080 images for characterization and assessment of the vines, the fungal development on inoculated vines, and the vinoLAS system.
2.5 Data management
Due to the amount of collected data, good data management was essential for proper data handling and analysis. Therefore, we developed a simple sample management tool in Python based on SQLite, which was integrated into the measurement script. This simplified the handling and identification of the potted vines in daily use.
2.6 Statistical data analysis
For simplicity, we focused on the data acquired with the spectrometer. To enable a better comparison between the individual spectra, the data needed to be processed further. First, the reference spectra (dark) were subtracted from the LIF spectra. Then, outliers due to artifacts of the charged-coupled device (CCD) sensor were removed from the datasets. To increase the speed of the analysis, spectral bands that contained no relevant spectral information were removed. In addition, the background-corrected spectra were smoothed out by a Savitzky–Golay filter of the second polynomial order and a 31-data-point broad sliding window. The spectra were normalized to their maximum intensity of the ChlF band before we calculated the integrated signal intensities for the four spectral bands corresponding to the following equations and spectral band limits (Lichtenthaler et al., 1996):
By means of the integrated fluorescence bands Fblue, Fgreen, Fred1, and Fred2, it was possible to calculate the BFRR (blue-to-far red ratio) UV index and the ChlF ratio. From Equation 4, it follows for both:
The BFRR UV index requires for its calculation a fluorescence excitation in the UV range. That is why the index could be calculated for excitation only at 355 nm, whereas for 473 nm and 532 nm, we calculated the ChlF ratio. Both indices are well known in the literature and indicate physiological changes of plant tissue of the potted vines, in particular the change of chlorophyll concentration in plant cells (Kautz et al., 2014).
3 Results
3.1 Differentiation between healthy and infected leaves by LIF
To address objective A, we performed LIF scan measurements on healthy and inoculated leaves from group (a) and group (b), respectively, (Section 2.2) after 14 dpi. At this time, oil spots and a discoloration of the lamina were clearly visible on the inoculated leaves, whereas healthy leaves showed no signs of infection. The results of the LIF measurements on the upper leaf surface are depicted in Figure 2. For fluorescence excitation at 355 nm, the spectra showed two prominent fluorescence contributions: the BGF around 450 nm and the ChlF around 700 nm. The BGF could be separated again into two emission bands from 380 nm to 470 nm and from 490 nm to 500 nm. Both contributions were primarily emitted by ferulic acid, which was covalently bonded to the cell walls of the foliage (Buschmann et al., 2000). The dips in the spectral bands were caused by the notch filters (Section 2.1). The ChlF can be attributed to two overlapping and distinctive bands ranging from 650 nm to 800 nm (Chaerle et al., 2004). The aromatic α-amino acids tyrosine (300–320 nm) and tryptophan (320–350 nm) did not contribute to the LIF spectrum, as the excitation wavelength was 355 nm, which is too far in the UV-A region (Gabor et al., 2014).
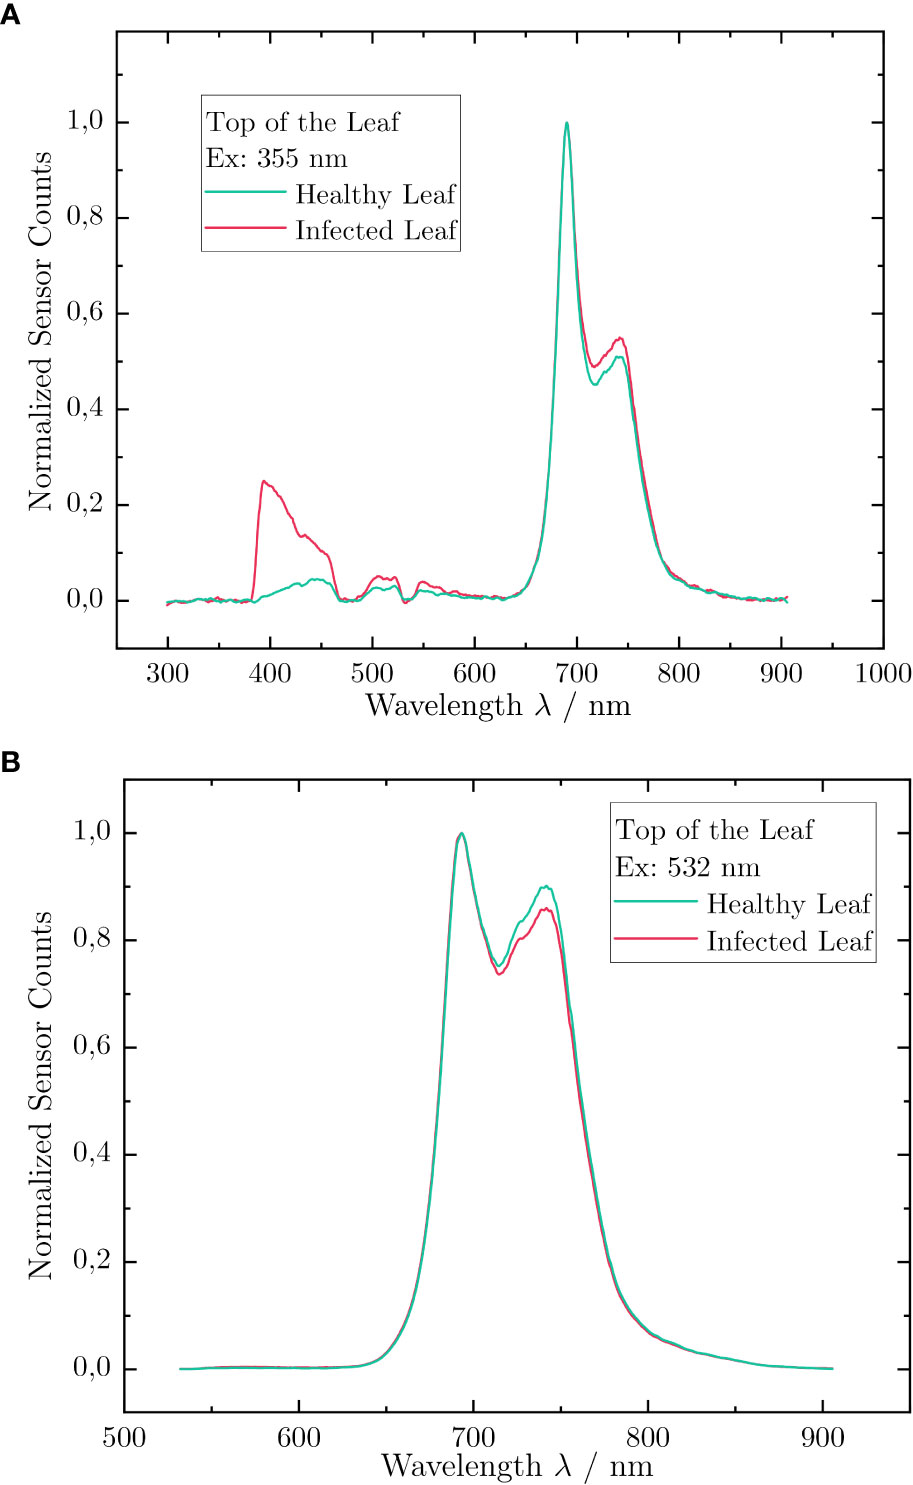
Figure 2 Laser-induced fluorescence spectra acquired during a scan over the upper leaf surface of ‘Riesling’ leaves, measured at excitation wavelengths of (A) 355 nm and (B) 532 nm. The red spectrum corresponds to a sample with a strong infection and the green one to a healthy one. The intensity is normalized.
Comparing the fluorescence spectra of the healthy and infected leaf, distinct differences were visible in both the intensity as well as in the spectral shifts of the intensity. In the normalized depiction of Figure 2, a significantly higher emission was measured for the inoculated leaf in fluorescence band Fblue. Even in the ChlF band Fred2, a deviation was measurable. This behavior also appeared in the emission spectra of the excitation at 532 nm. In contrast to 355 nm excitation, the intensity for the healthy leaf was higher than for the inoculated leaf.
For further analysis, we considered the BFRR UV index (Equation 5) and the ChlF ratio (Equation 6). A BFRR UV index of 0.07 was determined for the healthy ‘Riesling’ leaf, whereas for the inoculated leaf, the index increased by a factor of 5.4 to 0.39. This was due to the higher BGF, which resulted in an increase of the signal in the Fblue band. This signal was likely induced by stilbenes, which are an important candidate for phytoalexins. These compounds are known to be produced by grapevines as a molecular host reaction on infection with P. viticola, and it was assumed that the increased BGF signal was due to increased synthesis of these phytoalexins. Our results are in line with the values reported for the typical fluorescence intensity maximum of stilbenes (i.e., around 400 nm), after excitation by UV radiation (Poutaraud et al., 2007; Bellow et al., 2021). Moreover, it is conceivable that the fungal material, which is distributed in the leaf after inoculation, fluoresced in the wavelength region of the BGF (Zhang and Dickinson, 2001).
In comparison, the LIF measurements at an excitation wavelength of 532 nm showed reduced emission in the fluorescence band Fred2 for the inoculated leaf. This resulted in a slight increase in the ChlF ratio by approximately 4.9%, from 60.1 × 10⁻² for the healthy leaf to 65.2 × 10⁻² for the inoculated one. The increase was caused by a reduction of the chlorophyll concentration due to fungal infection (Gitelson et al., 1998). In particular, the ChlF ratio is linearly dependent on the chlorophyll concentration because 90% of the emitted fluorescence in Fred1 is re-absorbed by the existing chlorophyll in the plant cells. Hence, a reduced chlorophyll concentration results in less fluorescence light in the band Fred1, which can be re-absorbed by chlorophyll, thus resulting in a higher ChlF ratio (Gitelson et al., 1999).
3.2 Temporal development of LIF during long-term measurements
To determine the temporal development of the downy mildew infection (objective B), we acquired daily LIF spectra of all potted vines and observed the changes of the LIF signal over the course of the measurement campaign, as described in Section 2.4.
For a better understanding, Figure 3 shows microscopic images of the upper and lower surface of the leaf taken during the course of the campaign.
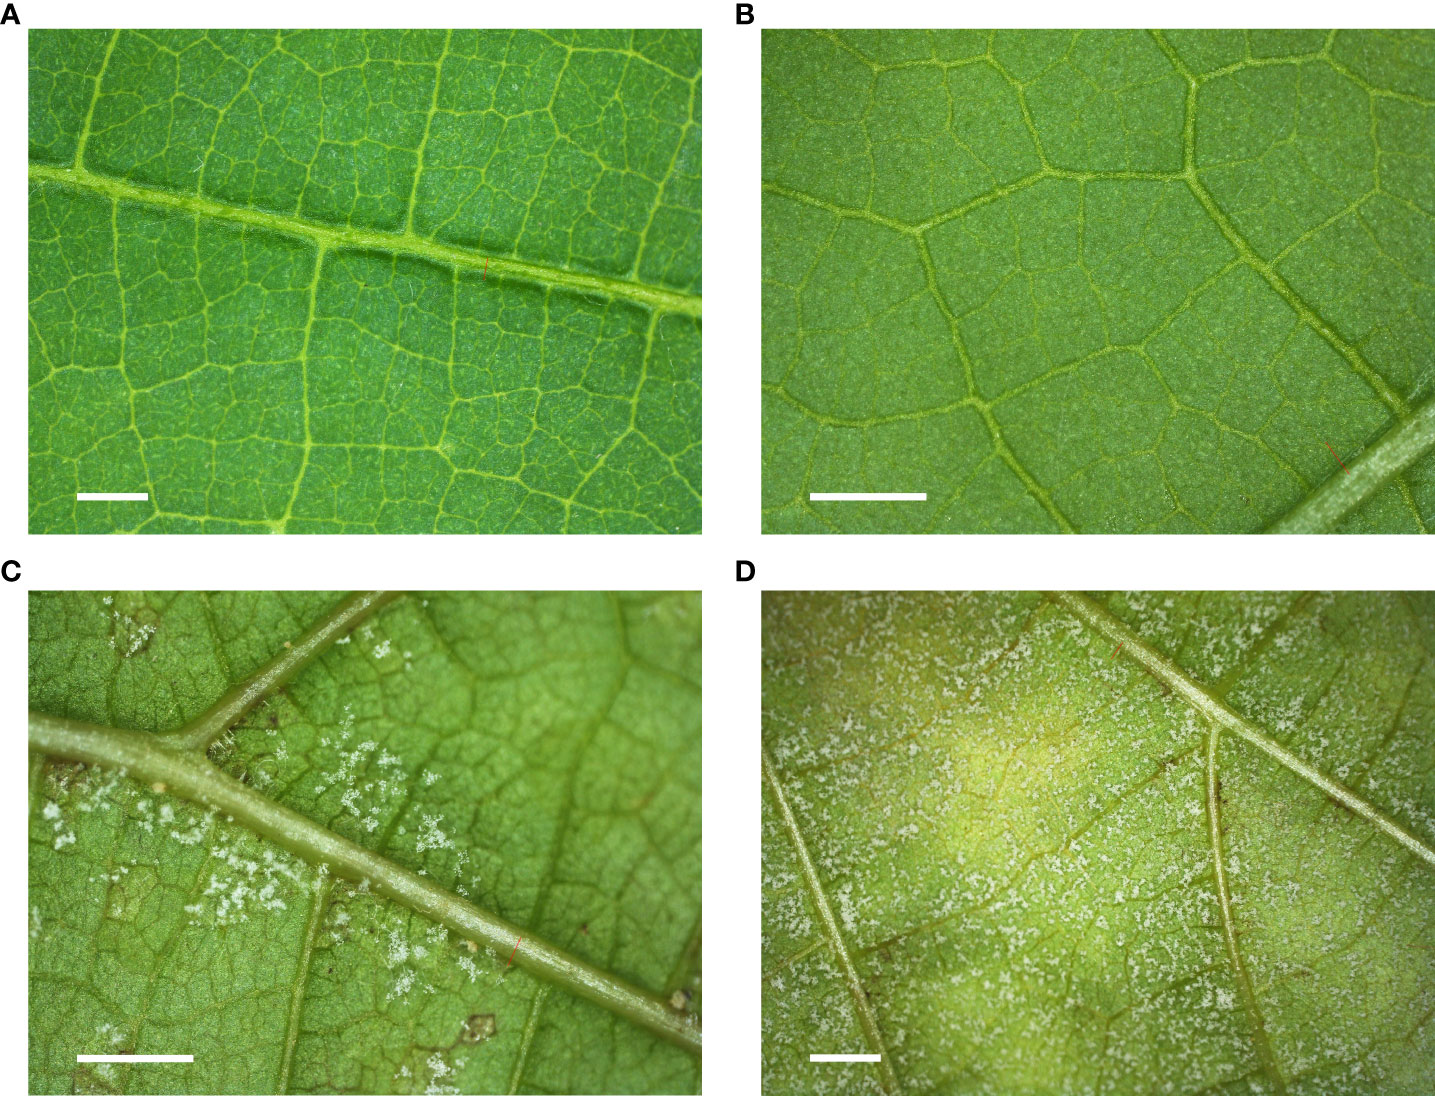
Figure 3 Microscopic images of different ‘Riesling’ leaves. (A) Upper surface of a healthy leaf. (B) Upper surface of an inoculated leaf with downy mildew. (C) Lower surface of an inoculated leaf with few sporangiophores and sporangia. (D) Lower surface of an inoculated leaf with a high density of sporangiophores and sporangia. Scale bar: 1 mm.
Figure 3A shows a healthy leaf, whereas the other figures show the development of downy mildew pathogenesis. In Figure 3B, the symptoms are hardly visible. As time progresses, a visual change in color can be observed, which results from the formation of the first oil spots (Figure 3C) and the growth of sporangiophores with sporangia from the stomates of the leaf (Figure 3D).
As an example, in Figure 4, the temporal development of LIF for an arbitrary potted vine of group (a) is shown for the three excitation wavelengths (355 nm, 473 nm, and 532 nm) and for the calibration wavelength (1,064 nm). Considering the LIF spectra in Figure 4A, a trend of an increasing BGF with increasing dpi was recognizable. Again, the reason for this increase is the synthesis of stilbenes due to downy mildew infection (Bavaresco and Fregoni, 2001) and spreading of mycelium within the host tissue (see also Section 3.1). Likewise, the used notch filters at 355 nm, 475 nm, and 532 nm resulted in corresponding dips of the LIF signal. The ChlF band showed a decreasing fluorescence signal over time. This decrease was discernible in the spectra of Figure 4B also, if exciting at a wavelength of 473 nm. In both cases, there was no visual evidence that the ChlF ratio changes over time. Conversely, for fluorescence excitation at 532 nm, there was a change in both the absolute intensity and ChlF ratio (Figure 4C). The 1,064-nm channel, which was used in this case as a reference, confirmed the quality of the acquired spectra. Neither a change in wavelength nor a change in intensity were measured throughout the whole 17 days, even though the measurements shown here were absolute ones, without any offset correction.
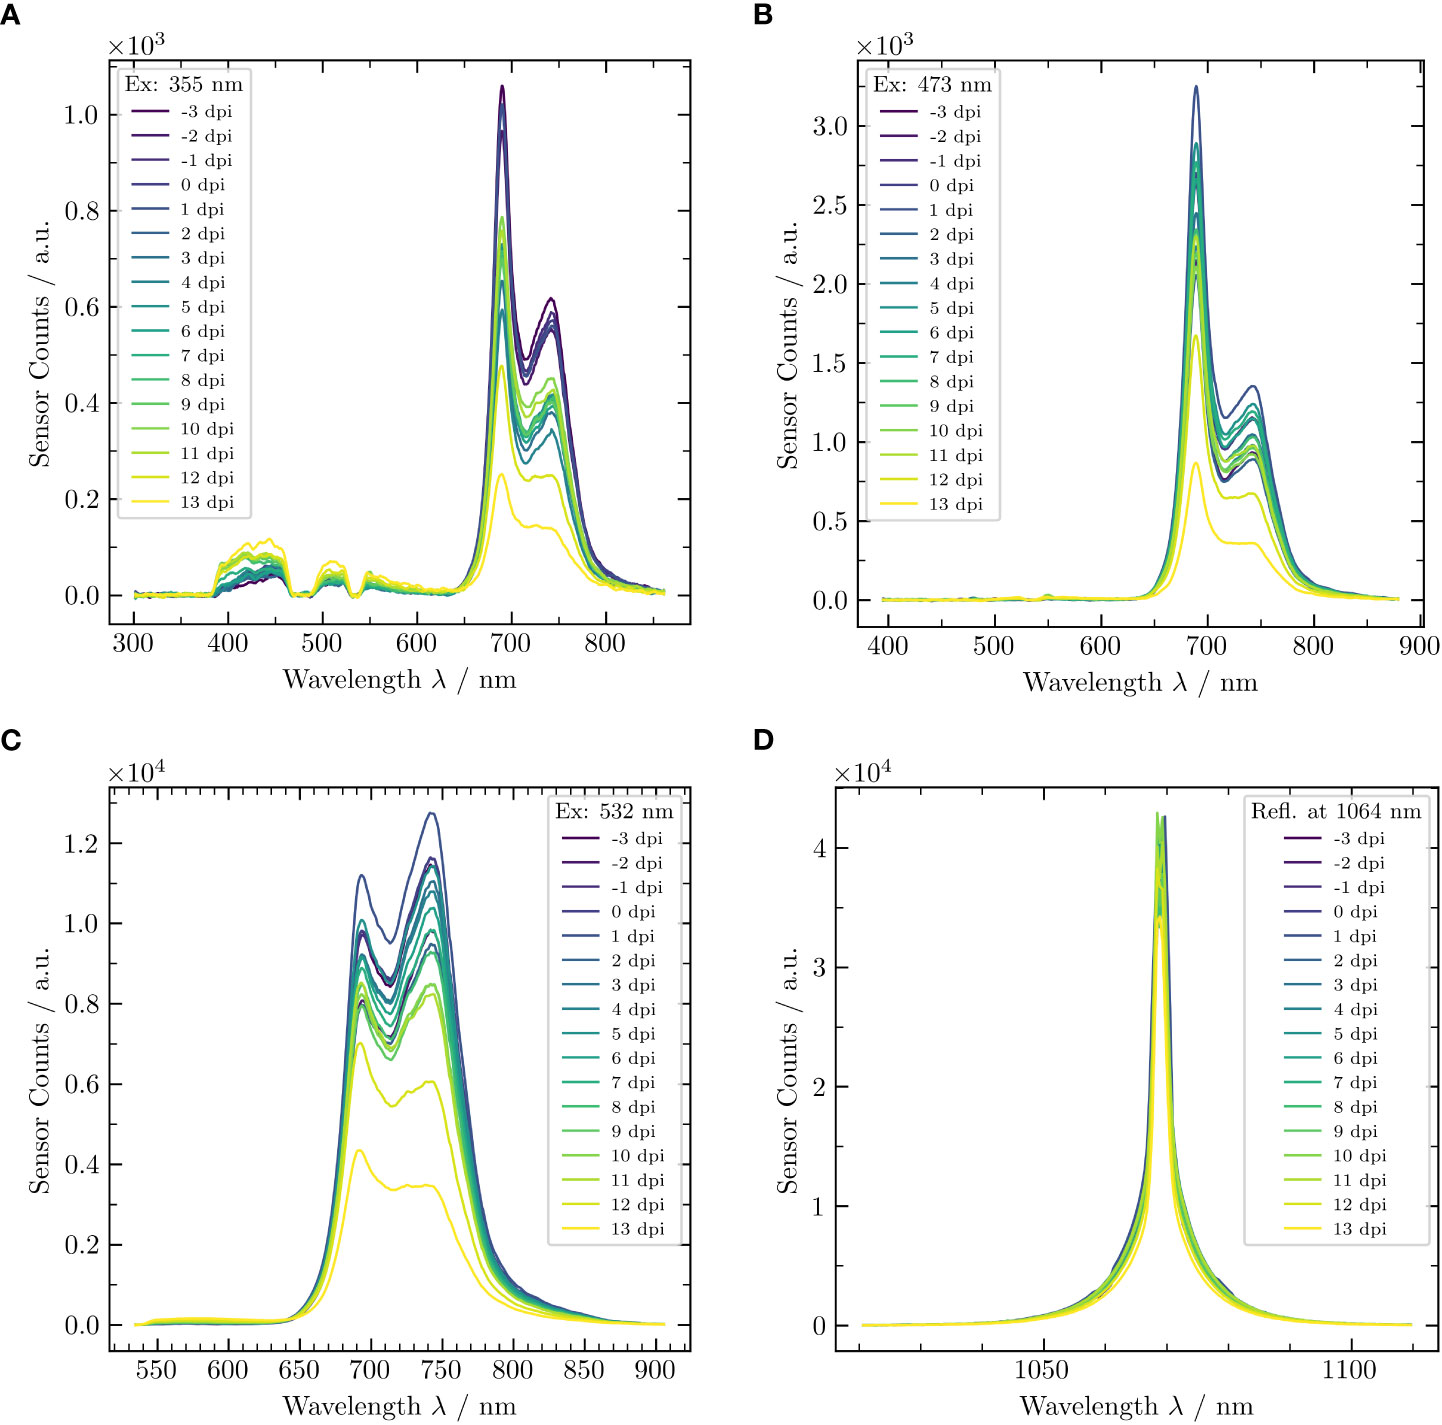
Figure 4 Laser-induced fluorescence spectra of an inoculated potted vine (cv. ‘Riesling’) (with downy mildew) for three different excitation wavelengths, that is, (A) 355 nm, (B) 473 nm, and (C) 532 nm, and (D) reflection spectra at 1,064 nm. The different colors indicate the temporal development over the measurement campaign of 17 dpi.
For further considerations, for each plant and measurement, the BFRR UV index and ChlF ratio were calculated corresponding to Equations 5 and 6. Subsequently, we calculated the mean indices, as well as the standard deviations, of each index for group (a) and (b). The resulting temporal development of the BFRR UV index and the ChlF ratio over the time course of the experiment are shown in Figure 5. Before the inoculation was carried out on 0 dpi, the BFRR UV index and the ChlF ratios remained the same within their respective standard deviations. Starting at 8 dpi, a difference in the BFRR UV index was measurable and the value for the inoculated group increased continuously, whereas it remained constant for the non-inoculated group. According to Figure 4, the BGF increased or rather the ChlF decreased. This could be attributed to the growth of the mycelium in the aerenchyma of the leaf, serving as a signal for stilbene synthesis on the one hand and causing an oil spot on the other hand. In addition, an increase in the standard deviation for the inoculated group was measurable, especially for the excitation wavelengths of 355 nm and 532 nm. One reason could be heterogeneous development of the disease. The results of the 473-nm excitation showed no obvious differences in the ChlF ratio between the two groups. The LIF measurements at an excitation wavelength of 532 nm showed a similar behavior to excitation at 355 nm. Starting at 5 dpi, with a slight increase in the ChlF ratio, it resulted in an obvious difference between the inoculated and the healthy group from 9 dpi onward. Again, the temporal development of the reference intensities at 1,064 nm showed a strong coincidence between the two groups.
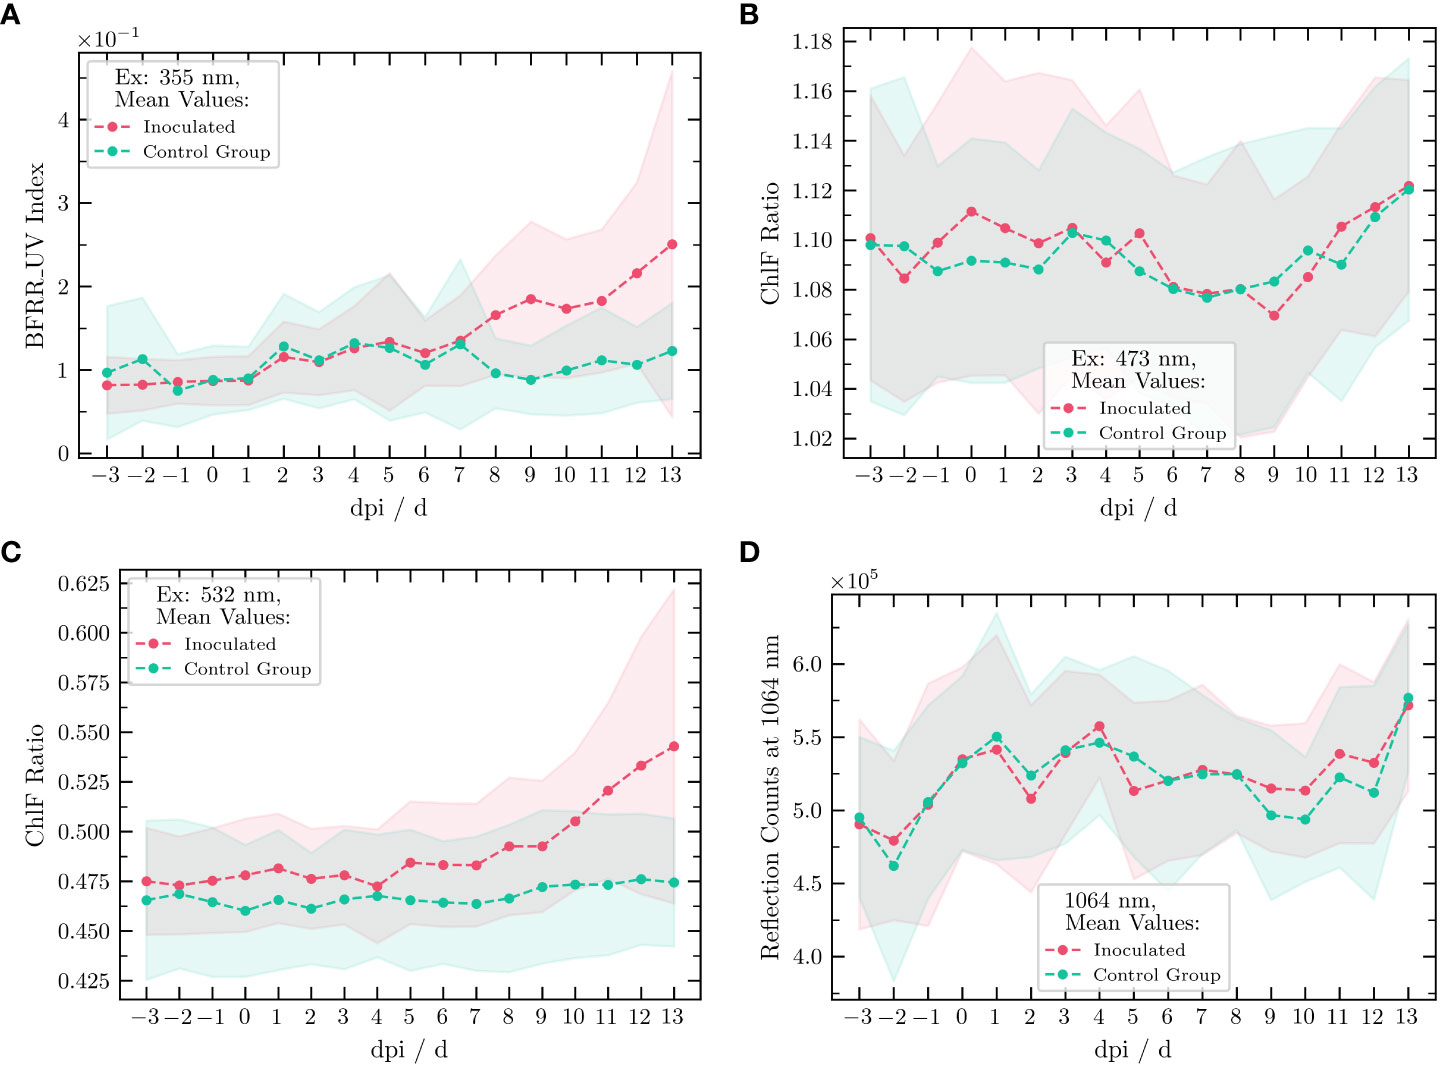
Figure 5 Temporal development of the BFRR UV index and the ChlF ratios measured for all available excitation wavelengths of the vinoLAS research model. Excitation wavelength at (A) 355 nm, (B) 473 nm, and (C) 532 nm, and for the reflection measurement (D) at 1,064 nm. The data for the group inoculated with downy mildew are marked in red, whereas data for the non-the inoculated (healthy) group are marked in green (dashed line: mean, shaded area: standard deviation with reference to the mean value).
3.3 Influence of leaf orientation on LIF
To address objective C, we investigated the influence of the leaf orientation on the LIF measurements taken from the upper and lower leaf surface. The results of the LIF measurements acquired from the lower leaf surface are depicted in Figure 6. Similar to the measurements presented in Section 3.1, the emission in the fluorescence band Fblue was higher for an inoculated leaf than for a healthy one. Furthermore, a small change in the band Fred2 was measurable for 355 nm as well as for 532 nm. Again, the BFRR UV index and ChlF ratio can be calculated for both healthy and inoculated leaves (see also Section 3.1). For a healthy leaf, a BFRR UV index of 56.6 × 10⁻³ could be determined. This was slightly lower than the value measured on the upper leaf surface. In contrast, the BFRR UV index of an inoculated leaf increased distinctly to 1,042.3 × 10−3. Therefore, the contribution to the LIF signal of the band Fblue was now larger than of the band Fred2. Comparing the signal strength between the upper and lower leaf surface for the inoculated leaf, an increase of the BGF by a factor of 2.7 could be measured. Examining the ChlF ratio for 532 nm excitation, one yields a ratio of 80.9 × 10⁻² for the inoculated leaf. Compared with the healthy leaf (75.4 × 10⁻²), the ChlF ratio increased by a factor of 7.3%.
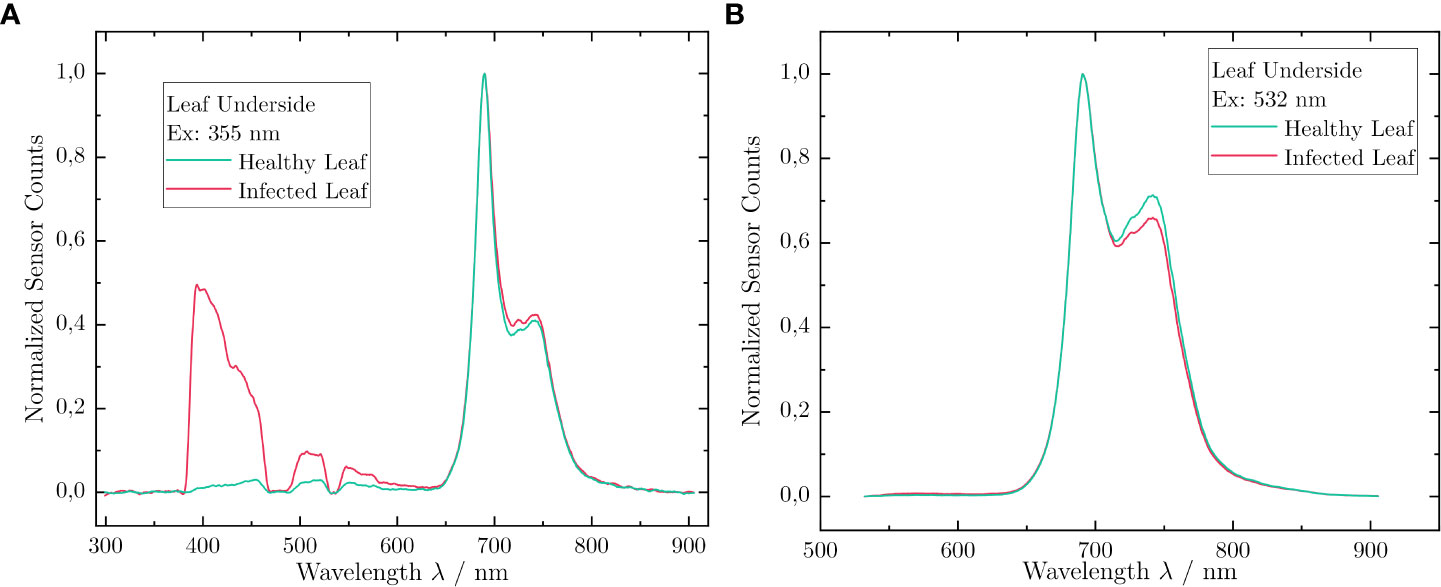
Figure 6 Comparison of LIF spectra acquired with the vinoLAS research model for an inoculated and a healthy leaf excited at the lower leaf surface. (A) Excitation at 355nm. (B) Excitation at 532nm. The intensity is normalized.
4 Discussion
This study aimed to characterize and validate our vinoLAS research model. We focused on the pathosystem Vitis vinifera/P. viticola. The studies were carried out on potted vines. In the following sections, we summarize our findings, discuss them in the light of our objectives from section 1, compare them with other systems, and point out how the vinoLAS system can be improved.
4.1 Characterization and validation of the vinoLAS system
4.1.1 Objective A: reliable remote detection
The LIF measurements on the potted vines (cv. ‘Riesling’) on the upper and lower leaf surface of healthy and inoculated leaves in sections 3.1 and 3.3 have confirmed that inoculated leaf tissue results in a measurable change of the BGF and hence in a change of the BFRR UV index as well as the ChlF ratio. First, an increase of the measured ChlF ratio was obvious, primarily because of the gradual appearance of yellow circular oil spots on foliage, which led to a change in the chlorophyll concentration. In addition, a strong increase of the BFRR UV index can be detected due to the synthesis of phytoalexines by the host. It is noteworthy that no leaf showed any radiation damage due to laser excitation during all measurements.
Examining the used excitation wavelength in greater detail, our results show that the excitation wavelengths of 355 nm and 532 nm contain all necessary information for a LIF measurement because both BGF and ChlF can be measured. For the 355-nm wavelength, the change of BGF dominated, whereas for 532 nm the change of the ChlF ratio was larger than for 355 nm. The 473-nm channel does not contain additional information. Two reasons can be discussed. Either the same fluorophores are excited at 355 nm and 532 nm and hence the channel does not contain any additional information, or the current data analysis based on the BFRR UV index and ChlF ratio is not sufficient and has to be improved. Our results do not allow us to tease these two explanations apart.
The temporal development of the 1,064-nm channel confirmed good system calibration and ensured high reproducibility of the measurements during the whole campaign. Otherwise, a significant change in intensity would be expected because changes in the surface structure directly influence the reflection properties of leaves. Whether this is the reason for the slight increase of the overall reflection during the course of the experiment or it is due to other external influences, that is, the water content of the leaves, will have to be investigated in further experiments.
In summary, the vinoLAS system is able to differentiate between a healthy and an inoculated (infected) leaf. Thus, BGF and ChlF give a first reliable indication of the condition of the leaf (healthy vs. infected). However, we did not consider other influences, such as drought stress conditions, which can also lead to a change in the ChlF (Li et al., 2018).
4.1.2 Objective B: temporal change of the LIF signal and early detection capabilities
The results of the long-term measurements show that a temporal change in the LIF signal can be measured easily with the vinoLAS system. For operational use, the time after which a significant change in the BFRR UV index and ChlF ratio can be measured is quite important. With the current analysis method, a differentiation between the inoculated and healthy group is possible 5–7 days after the inoculation. For comparison, the first visual symptoms of downy mildew can usually be seen on leaves approximately 7 days after inoculation (greenhouse experiment) or infection (under natural circumstances in the vineyard). This strongly depends on individual temperature conditions. Consequently, to date, no proper early remote detection with the vinoLAS system is possible; however, the system can be used as a monitoring tool for downy mildew, as there is a lack of quick and easy disease monitoring systems in viticulture at present. The vinoLAS system could be very helpful in practice to obtain information on the start of an epidemic on the one hand and the effectiveness of fungicide application within the course of the growing period on the other hand. Potentially, this tool will enable vine growers to visualize the downy mildew disease status of their vineyards in the future. The implementation of deep learning algorithms can enhance the detection sensitivity by using complementary information from the different excitation wavelengths. This has great potential and will be evaluated in future experiments.
4.1.3 Objective C: influence of leaf orientation
Disease development between upper and lower leaf surfaces gives rise to the supposition that fluorescence can be excited only with a privileged direction. The measurement characterizing the influence of leaf orientation showed that the fluorescence signal strength indeed varied for the BFRR UV index by a factor of 2.7 between the upper and lower leaf surfaces due to the appearance of sporangiophores on the lower leaf surface. The ChlF ratio was, for both healthy and inoculated leaves, larger for the leaf surface because the chlorophyll α concentration was higher due to the higher rate of photosynthesis.
Although we focused here only on measurements from the upper and lower leaf surface and not on angle-dependent measurements, the results of both extreme cases showed that a sufficient LIF signal can be acquired, independent of leaf orientation. Based on the calculated BFRR UV indices and ChlF ratios, the presence of downy mildew symptoms could be determined in both cases. However, due to the overlapping BFRR UV and ChlF indices of a healthy and an inoculated leaf, an improvement of the data analysis is necessary for obtaining all available orthogonal information.
4.2 Detection capabilities
4.2.1 External environmental influences
Herein, we treated external environmental influences as fixed-effect factors. During the complete period of measurement, the environmental conditions were kept constant. The impact of external factors, such as sunlight or other weather-related influences, have to be investigated in further studies. On this basis, the detection capabilities for operational use can be elaborated so that, for example, measurement settings can directly be considered in future data analyses. Furthermore, the measurements were performed exclusively on ‘Riesling’ vines; different grape varieties might result in distinctive LIF signatures. Although this makes pathogen remote detection more complicated, it is possible to tease even more information out of a vinoLAS measurement, which can be used for scoring. Initial investigations on ‘Müller–Thurgau’ vines confirmed the presented results and, therefore, give a hint that pathogen detection using LIF is almost independent of the variety. In future, large-scale and long-term measurements in vineyards are necessary to characterize the significance of the mentioned external impacts.
4.2.2 Comparison with other systems
Despite some weaknesses, as discussed above, the vinoLAS system has advantages over other current common non-destructive detection techniques, such as ChlF systems and hyperspectral or thermal imaging. Similar to the vinoLAS system, ChlF systems are based on measuring the chlorophyll fluorescence (Moustakas et al., 2021; Vlaović et al., 2023). However, these instruments can measure the chlorophyll fluorescence parameter only under close-contact and dark illumination conditions, i.e., in closed measurement chambers (Takayama et al., 2011; Arief et al., 2023). In addition, most of these techniques require time-consuming single-point measurements. We proved that these limitations can be overcome with the vinoLAS system. The vinoLAS system can measure the spatial variability of the plant canopy by raster scanning and can perform mid-distance sensing of ChlF under daylight conditions. Nevertheless, optimization of the optical geometry of the vinoLAS detection path is necessary to further enhance system sensitivity. This offers the possibility for early disease detection, as reported for sun-induced ChlF systems in the literature (Hernández-Clemente et al., 2017).
In contrast to ChlF systems and the vinoLAS system, passive hyperspectral and thermal sensors can achieve reliable results only if the environmental conditions are closely controlled. In theory, sunlight is an excellent light source; however, during operation, sunlight poses some challenges for hyperspectral measurements. In particular, variable illumination conditions, caused by clouds covering the sun to varying degrees and/or the position of the sun during the course of the day, lead to measurement inaccuracies, especially for long acquisition times (Pinto et al., 2016). Using laser sources for illumination, the vinoLAS system is not subject to variable illumination conditions. In addition, hyperspectral techniques require a reference measurement for normalization of the images (Thomas et al., 2018). This is not necessarily required for the vinoLAS system.
For all mentioned techniques, an accurate identification of different pathogens and the discrimination of biotic and abiotic stresses are difficult and remain a great challenge in disease research (Zhang et al., 2020). The vinoLAS system provides a research model for further investigation of laser-based stand-off pathogen detection.
4.3 Technical improvements of the vinoLAS system
All presented measurements confirm that remote monitoring of downy mildew is possible with the vinoLAS system. However, the results reveal several technical aspects of the current system that have to be improved in the future.
First, as discussed in Section 4.1, the informational content of the 473-nm channel should be further analyzed. Instead of using the BFRR UV index and ChlF ratio, a first step would be the introduction of new indices. These can take other spectral bands or absolute intensities into account. Based on this, machine learning algorithms (convolutional neuronal networks or principal component analysis) can be applied to gather even more information out of the acquired data, that is, by considering complementary information from all excitation wavelengths. However, a large data set is necessary for the successful realization of such methodologies. This can be combined with a study on different grape varieties.
Second, the 1,064-nm channel, which is currently used only as a control, should be implemented for automatic calibration. This can be especially helpful if different grape varieties are measured or the measurement distance changes. This approach enables us to calculate a normalization within a data set or a calibration between the different measurements.
Third, the additional acquired data from peripheral components (i.e., temperature, humidity) can be integrated in the data analysis procedure for further enhancing the reliability of the vinoLAS system.
Fourth, in this study, we have considered only the data that were acquired with the spectrometer. The data acquired with the four-channel boxcar integrator system were not considered here since it lacks high levels of spectral resolution. A high level of temporal resolution, which can be achieved with the four-channel system, is especially useful for field operation because the contribution of sunlight during daylight measurements can be effectively suppressed during acquisition. In addition, the high read-out frequency results in a high level of temporal resolution. Consequently, differences in fluorescence intensity within the foliage can be easily measured during a scan with a high level of spatial resolution.
Fifth, from the previously discussed aspects, one can discern that the goal for further improvements is to run the vinoLAS system under field conditions. Therefore, the technological readiness level of the vinoLAS system has to be improved for the targeted environment: vineyards under cultivation with different trellising systems, canopy structures, and/or varieties. Irrespective of the environment, the design should be optimized for easy transportation. Supplementary safety installations must be integrated.
5 Conclusion
The results of this work have shown that remote detection of downy mildew on grapevine leaves using a stand-off LIF measurement system is generally possible. Leaves from inoculated potted vines (cv. ‘Riesling’) could be distinguished from healthy ones 5–7 days after inoculation with P. viticola. The BFRR UV index and the ChlF ratio gave the first evidence of whether or not an infestation on a plant occurs. In particular, the excitation wavelength of 355 nm is suitable for pathogen detection as it is capable of exciting both BGF and ChlF. Together with the excitation wavelength of 532 nm, it allows a reliable distinction between healthy and inoculated vines, independent of leaf orientation.
Thus, the vinoLAS system could indeed serve as an important tool for the fast and easy monitoring and non-invasive detection of fungal infestations in vineyards in the near future. At present, neither early pathogen detection nor fast monitoring of the epidemiological status of a complete vineyard is possible. Therefore, improvements to the laser spectroscopic system itself and the ensuing data analysis have to be implemented. Within this context, differences between different grape varieties and environmental impacts, that is, weather-related influences (sunlight, wetness, dust), have to be considered during data acquisition as well as later in the data analysis, since such features can have a direct influence on the reliability of this novel detection method. Nonetheless, the vinoLAS system can serve as a model technology for practical use in vineyards. In combination with existing methods, such as hyperspectral imaging (Adão et al., 2017), it can meet unsatisfied demands, such as 24/7 operation, and it can provide complementary information on pathogen detection as a sensitive technique. On this basis, the application of fungicides can be optimized by the use of the vinoLAS system in the future, and, therefore, the ecological impact and economic costs can be reduced significantly according to the demands of the EU Green Deal. Finally, the vinoLAS technology might also be useful for other pathosystems, for example, in apple cultivation or potato production as “appleLAS” or “potatoLAS”.
Data availability statement
The raw data supporting the conclusions of this article will be made available by the authors, without undue reservation.
Author contributions
CK worked out the principal concept of the vinoLAS system. MD set up the optical system and coded the algorithms for data analysis. EE developed the data acquisition device. MS and BB-L gave the DLR team an extensive introduction to crop protection and supported them by providing the potted vines for free. All authors participated in team discussions, designing and planning the spectroscopic system, and reviewing the manuscript. All authors contributed to the article and approved the submitted version.
Funding
This work was funded by the Department of Technology Transfer of the German Aerospace Center. Furthermore, this work was supported by the Hochschule Geisenheim University Department of Crop Protection, who provided the potted vines for the measurements. The funders of the German Aerospace Center Department of Technology Transfer were not involved in the study design, collection, analysis, interpretation of data, the writing of this article, or the decision to submit it for publication.
Conflict of interest
The authors declare that the research was conducted in the absence of any commercial or financial relationships that could be construed as a potential conflict of interest.
Publisher’s note
All claims expressed in this article are solely those of the authors and do not necessarily represent those of their affiliated organizations, or those of the publisher, the editors and the reviewers. Any product that may be evaluated in this article, or claim that may be made by its manufacturer, is not guaranteed or endorsed by the publisher.
Supplementary material
The Supplementary Material for this article can be found online at: https://www.frontiersin.org/articles/10.3389/fhort.2023.1185468/full#supplementary-material
References
Adão T., Hruška J., Pádua L., Bessa J., Peres E., Morais R., et al. (2017). Hyperspectral imaging: A review on uav-based sensors, data processing and applications for agriculture and forestry. Remote Sens. 9, 1110. doi: 10.3390/rs9111110
Ammoniaci M., Kartsiotis S.-P., Perria R., Storchi P. (2021). State of the art of monitoring technologies and data processing for precision viticulture. Agriculture 11, 201. doi: 10.3390/agriculture11030201
Arief M. A. A., Kim H., Kurniawan H., Nugroho A. P., Kim T., Cho B.-K. (2023). Chlorophyll fluorescence imaging for early detection of drought and heat stress in strawberry plants. Plants 12, 1387. doi: 10.3390/plants12061387
Bavaresco L., Fregoni C. (2001). Physiological role and molecular aspects of grapevine stilbenic compounds (Dordrecht: Springer Netherlands), 153–182. doi: 10.1007/978-94-017-2308-46
Belasque J. Jr., Gasparoto M. C. G., Marcassa L. G. (2008). Detection of mechanical and disease stresses in citrus plants by fluorescence spectroscopy. Tech. Rep. excita. 47, 11. doi: 10.1364/ao.47.001922
Bellow S., Latouche G., Brown S. C., Poutaraud A., Cerovic Z. G. (2021). Optical detection of downy mildew in grapevine leaves: daily kinetics of autofluorescence upon infection. J. Exp. Bot. 64, 333–341. doi: 10.1093/jxb/ers338
Berkelmann-Löhnertz B., für Landwirtschaft und Ernährung B., Landwirtschaft B., Wetterdienst D. (Eds.) (2017). Agrarmeteorologie, (Bonn: Bundesanstalt für Landwirtschaft und Ernährung (BLE)). Available at: https://katalog.ub.tu-braunschweig.de/vufind/Search2Record/1638095914.
Buonassisi D., Colombo M., Migliaro D., Dolzani C., Peressotti E., Mizzotti C., et al. (2017). Breeding for grapevine downy mildew resistance: a review of “omics“ approaches. Euphytica 213, 1573–5060. doi: 10.1007/s10681-017-1882-8
Buschmann C., Langsdorf G., Lichtenthaler H. K. (2000). Imaging of the blue, green, and red fluorescence emission of plants: An overview. Photosynthetica 38, 483–491. doi: 10.1023/A:1012440903014
Chaerle L., Hagenbeek D., De Bruyne E., Valcke R., van der Straeten D. (2004). Thermal and chlorophyll-fluorescence imaging distinguish plant-pathogen interactions at an early stage. Plant Cell Physiol. 45, 887–896. doi: 10.1093/pcp/pch097
Commission E. (2022). Proposal for a regulation of the European parliament and the council on the sustainable use of plant protection products and amending regulation (eu) 2021/2115. 2022. Available at: https://eur-lex.europa.eu/legal-content/EN/TXT/?uri=CELEX:52022PC0305.
Corcoran T. (2014). “8 - laser-induced fluorescence spectroscopy (lif),” in Laser spectroscopy for sensing. Ed. Baudelet M. (Woodhead Publishing), 235–257. doi: 10.1533/9780857098733.2.235
Duschek F., Fellner L., Gebert F., Grünewald K., Köhntopp A., Kraus M., et al. (2017). Standoff detection and classification of bacteria by multispectral laser-induced fluorescence. Advanced Optical Technol. 6, 75–83. doi: 10.1515/aot-2016-0066
Gabor R. S., Baker A., Mcknight D. M., Miller M. (2014). Fluorescence indices and their interpretation (Cambridge: Cambridge University).
Gitelson A. A., Buschmann C., Lichtenthaler H. K. (1998). Leaf chlorophyll fluorescence corrected for reabsorption by means of absorption and reflectance measurements. J. Plant Physiol. 152, 283–296. doi: 10.1016/S0176-1617(98)80143-0
Gitelson A. A., Buschmann C., Lichtenthaler H. K. (1999). The chlorophyll fluorescence ratio f735/f700 as an accurate measure of the chlorophyll content in plants. Remote Sens. Environ. 69, 296–302. doi: 10.1016/S0034-4257(99)00023-1
Hernández-Clemente R., North P., Hornero A., Zarco-Tejada P. (2017). Assessing the effects of forest health on sun-induced chlorophyll fluorescence using the FluorFLIGHT 3-d radiative transfer model to account for forest structure. Remote Sens. Environ. 193, 165–179. doi: 10.1016/j.rse.2017.02.012
Johnson M. E., Landers J. P. (2004). ).Fundamentals and practice for ultrasensitive laser-induced fluorescence detection in microanalytical systems. ELECTROPHORESIS 25, 3513–3527. doi: 10.1002/elps.200406086
Kautz B., Hunsche M., Noga G. (2014). Salinity-induced changes of multiparametric fluorescence indices of tomato leaves. Agriculture 4, 132–146. doi: 10.3390/agriculture4020132
Kennelly M. M., Gadoury D. M., Wilcox W. F., Magarey P. A., Seem R. C. (2007). Primary infection, lesion productivity, and survival of sporangia in the grapevine downy mildew pathogen iplasmopara viticola/i. Phytopathology® 97, 512–522. doi: 10.1094/phyto-97-4-0512
Klärner S., Flemming B., Berkelmann Löhnertz B. (2015). deUntersuchungenzur fäulnispräventionim weinbau durch uvc-bestrahlung der rebe (vitis vinifera l.). LANDTECHNIK 70, 4. doi: 10.15150/LT.2015.2669
Koledenkova K., Esmaeel Q., Jacquard C., Nowak J., lément C., Barka E. A. (2022). Plasmopara viticola the causal agent of downy mildew of grapevine: From its taxonomy to disease management. Frontiers in Microbiology 13. doi: 10.3389/fmicb.2022.889472
Kumar R., Pathak S., Prakash N., Priya U., Ghatak A. (2021). Application of spectroscopic techniques in early detection of fungal plant pathogens (Rijeka). doi: 10.5772/intechopen.97535
Latouche G., Debord C., Raynal M., Milhade C., Cerovic Z. G. (2015). First detection of the presence of naturally occurring grapevine downy mildew in the field by a fluorescence-based method. Photochemical & Photobiological Sci. 14, 1807–1813. doi: 10.1039/c5pp00121h
Li Y., He N., Hou J., Xu L., Liu C., Zhang J., et al. (2018). Factors influencing leaf chlorophyll content in natural forests at the biome scale. Frontiers in Ecology and Evolution 6. doi: 10.3389/fevo.2018.00064
Lichtenthaler H., Lang M., Sowinska M., Heisel F., Miehé J. (1996). Detection of vegetation stress via a new high resolution fluorescence imaging system. J. Plant Physiol. 148, 599–612. doi: 10.1016/S0176-1617(96)80081-2
Moustakas M., Calatayud Ángeles, Guidi L. (2021). Editorial: Chlorophyll fluorescence imaging analysis in biotic and abiotic stress. Front. Plant Sci. 12. doi: 10.3389/fpls.2021.658500
Nguyen C., Sagan V., Maimaitiyiming M., Maimaitijiang M., Bhadra S., Kwasniewski M. T. (2021). Early detection of plant viral disease using hyperspectral imaging and deep learning. Sensors 21, 742. doi: 10.3390/s21030742
Pinto F., Damm A., Schickling A., Panigada C., Cogliati S., Müller-Linow M., et al. (2016). Sun-induced chlorophyll fluorescence from high-resolution imaging spectroscopy data to quantify spatio-temporal patterns of photosynthetic function in crop canopies. Plant Cell Environ. 39, 1500–1512. doi: 10.1111/pce.12710
Poutaraud A., Latouche G., Martins S., Meyer S., Merdinoglu D., Cerovic Z. G. (2007). Fast and local assessment of stilbene content in grapevine leaf by in vivo fluorometry. J. Agric. Food Chem. 55, 4913–4920. doi: 10.1021/jf070348e
Roßberg D. (2013). deErhebungen zur anwendung von pflanzenschutzmitteln in der praxis im jahr 2011. J. für Kulturpflanzen 65. doi: 10.5073/JFK.2013.04.02. Bd. 65 Nr. 4 (2013).
Stoll M., Schultz H. R., Baecker G., Berkelmann-Loehnertz B. (2008). Early pathogen detection under different water status and the assessment of spray application in vineyards through the use of thermal imagery. Precis. Agric. 9, 407–417. doi: 10.1007/s11119-008-9084-y
Takayama K., Nishina H., Iyoki S., Arima S., Hatou K., Ueka Y., et al. (2011). Early detection of drought stress in tomato plants with chlorophyll fluorescence imaging–practical application of the speaking plant approach in a greenhouse–. IFAC Proc. Volumes 44, 1785–1790. doi: 10.3182/20110828-6-it-1002.01490
Tardaguila J., Stoll M., Gutiérrez S., Proffitt T., Diago M. P. (2021). Smart applications and digital technologies in viticulture: A review. Smart Agric. Technol. 1, 100005. doi: 10.1016/j.atech.2021.100005
Thomas S., Kuska M. T., Bohnenkamp D., Brugger A., Alisaac E., Wahabzada M., et al. (2018). Benefits of hyperspectral imaging for plant disease detection and plant protection: a technical perspective. J. Plant Dis. Prot. 125, 5–20. doi: 10.1007/s41348-017-0124-6
Vlaović J., Balen J., Grgić K., Žagar D., Galić V., Šimić D., et al. (2023). An overview of chlorophyll fluorescence measurement process, meters and methods. (IEEE). 245–250.
Weiss S. (1999). Fluorescence spectroscopy of single biomolecules. Science 283, 1676–1683. doi: 10.1126/science.283.5408.1676
Zhang L., Dickinson M. (2001). Fluorescence from rust fungi: a simple and effective method to monitor the dynamics of fungal growth in planta. Physiol. Mol. Plant Pathol. 59, 137–141. doi: 10.1006/pmpp.2001.0349
Keywords: vinoLAS, laser-induced fluorescence, remote detection, disease monitoring, downy mildew, Vitis vinifera, pathogen, viticulture
Citation: Kölbl C, Diedrich M, Ellingen E, Duschek F, Selim M and Berkelmann-Löhnertz B (2023) Remote detection of fungal pathogens in viticulture using laser-induced fluorescence: an experimental study on infected potted vines. Front. Hortic. 2:1185468. doi: 10.3389/fhort.2023.1185468
Received: 13 March 2023; Accepted: 10 August 2023;
Published: 15 September 2023.
Edited by:
Carlos Poblete-Echeverría, Stellenbosch University, South AfricaReviewed by:
Loukas I. Kanetis, Cyprus University of Technology, CyprusLuisa C. Carvalho, University of Lisbon, Portugal
Copyright © 2023 Kölbl, Diedrich, Ellingen, Duschek, Selim and Berkelmann-Löhnertz. This is an open-access article distributed under the terms of the Creative Commons Attribution License (CC BY). The use, distribution or reproduction in other forums is permitted, provided the original author(s) and the copyright owner(s) are credited and that the original publication in this journal is cited, in accordance with accepted academic practice. No use, distribution or reproduction is permitted which does not comply with these terms.
*Correspondence: Christoph Kölbl, christoph.koelbl@dlr.de
†These authors share first authorship