Identifying Potential Clusters of Future Migration Associated With Water Stress in Africa: A Vulnerability Approach
 Sophie Pieternel de Bruin
 Joost Knoop1
  Hester Biemans
- 1PBL Netherlands Environmental Assessment Agency, The Hague, Netherlands
- 2Instituut Voor Milieuvraagstukken (IVM), Vrije Universiteit (VU) Amsterdam, Amsterdam, Netherlands
- 3Wageningen University and Research, Wageningen, Netherlands
Decreasing yields due to water stress form a threat to rural livelihoods and can affect migration dynamics, especially in vulnerable regions that lack the capacity to adapt agriculture to water stress. But since migration is complex, non-linear and context-dependent, it is not feasible to predict the precise number of people that will migrate due to water stress. It is possible to map the different conditions that shape regional vulnerabilities and the number of people affected. This study presents a vulnerability approach to identify areas on the African continent where emigration associated with water stress is expected to be relatively high by 2050 under a middle-of-the-road scenario (SSP2) and compares the results with the 2010 situation. By utilizing among other indicators the water yield gap, the impact of water stress on rainfed agricultural crop yields is included, reflecting the impact of water stress on rural livelihoods depending on crop farming. The analysis was done on a water-province level, 393 in total. Clusters of potential emigration associated with the impacts of water stress on agriculture are projected for parts of the Sahel, the Horn of Africa and regions of Angola. The regions where migration associated with water stress is expected to be relatively high by 2050 are approximately the same as those of 2010, although more people are projected to be living in these water-stressed regions. By developing this vulnerability approach, this manuscript enlarges the current insights regarding future clusters of water stress-related migration.
Introduction
The impact of environmental change on migration dynamics has received increasing attention in academia and beyond since slow-onset processes such as droughts and land degradation increasingly affect people's mobility (IOM, 2021). Consequently, “environmental migration” is more and more discussed in international scientific and policy discussions as a cross-cutting and complex issue. The processes that determine migration are diverse and depend on the place where people live, their gender, age and their perceived opportunities (Neumann and Hermans, 2017). Therefore, the identification of a causal link between environmental change and migration is complex; there are many interconnected drivers of migration, including political, social, economic, and environmental causes (Black et al., 2011a). In addition to having a direct impact via fast-onset events, for example due to flooding, environmental change can have indirect slow-onset effects on migration decisions, as it also affects economic drivers, in terms of income and employment (Black et al., 2011a; Afifi et al., 2016; Cattaneo et al., 2019).
Migration associated with slow-onset environmental degradation is primarily observed in rural regions of low-income countries where a major share of the population depends on their natural environment for their livelihoods (Warner et al., 2010; Mortreux et al., 2018). In these natural resource-depended areas, economic factors are the mechanism through which environmental factors affect migration (Afifi, 2011; Neumann and Hermans, 2017). Temporary, cyclical or permanent migration can be a strategy to improve individual or household security, to spread economic risks or to avoid livelihood degradation when in situ adaptation to water stress or land degradation is not possible (Black et al., 2011a; Scheffran et al., 2012). In those cases, migration is mostly taking place internally since people have limited resources to move abroad.
Different types of research have been performed in order to better understand the complex dynamics of migration linked to environmental change (Borderon et al., 2019; Cattaneo et al., 2019). Empirical studies based on interview, survey or census data provide an overview of the common drivers of migration related to environmental change, as reviewed by Neumann and Hermans (2017) and Borderon et al. (2019), but not of the relative importance per driver. Some case studies in these reviews are qualitative analyses that allow for detailed narratives considering migrants perceptions and experiences (Carr, 2005; Abu et al., 2014). But qualitative case studies cannot provide conclusions on macro scale dynamics. The quantitative studies try to correlate observed or estimated patterns of migration with drivers, what yields an ambiguous picture on the order of magnitude and causal linkages (Van der Geest et al., 2010; Neumann et al., 2015; IRP, 2022). Because both qualitative and quantitative case studies use different methods and categories, a precise quantitative comparison between the reviewed studies was neither possible in Neumann and Hermans (2017) nor in Borderon et al. (2019).
Another type of research on migration linked to environmental change is simulation modeling. Few studies estimate the future number of migrants who are expected to move as a result of climate change and/or environmental degradation (Westing, 1994; Myers, 2002; Rigaud et al., 2018; Clement et al., 2021). These estimations, however, are debated for four reasons. First, critics say the numbers are based on “common sense rather than insight from theories or evidence” (Black et al., 2011a). Second, these studies do not use a commonly accepted methodology but they use rather specific scenarios and related assumptions (Gemenne, 2011; Cattaneo et al., 2019). Third, these studies may be influenced by social and political agendas (Kolmannskog, 2008). Fourth, defining migrants as environmental migrants is blurry, because of the intertwined drivers of migration. The limitations of empirical studies and simulation models in specifying causal mechanisms implicate that uncertainty about the complex and context-specific processes that drive migration affected by environmental degradation will persist (McLeman, 2013; Neumann and Hilderink, 2015). This affects how future developments regarding migration related with environmental degradation can be assessed. In line with Warner et al. (2010) we reason that in the absence of full knowledge on how all theoretical components interact, and the absence of sufficient data to measure the relevant variables, making precise migration predictions is therefore not feasible. From our perspective, stating exact numbers such as in Rigaud et al. (2018) and Clement et al. (2021) provides a false sense of precision, since migration dynamics are complex, non-linear, and hardly ever driven by environmental conditions alone.
Although making precise predictions is not feasible, it is possible to explore how various important macro drivers of migration linked to environmental degradation will develop and, by combining these drivers, to identify regions where migration associated with environmental degradation may be relatively more likely compared to other regions. These more vulnerable regions are also the regions where people may become “trapped” (Black et al., 2011a; Adger et al., 2015). Trapped populations are those who have too little means or capabilities to migrate, due to a lack of economic capital and relocation options. This emphasizes the fact that environmental change primarily decreases livelihood circumstances, and influences migration only in some cases (Borderon et al., 2019). Since actual migration is determined by the hard to predict balance between the incentive to migrate and the means and willingness to do so, indicating livelihood vulnerability toward environmental change is a more appropriate approach. The approach applied in this study is a form of vulnerability mapping (see for example Busby et al., 2014 and Thornton et al., 2008). In this study, we focus on water stress as the environmental driver since water availability is an important determinant for income and employment opportunities of rural farming households (Namara et al., 2010; Balasubramanya and Stifel, 2020). Several studies have showed that decreasing access to or absolute water scarcity can contribute to decreasing livelihood conditions, and contribute to emigration (van der Geest, 2011; Afifi et al., 2016; IRP, 2022). We select the most obvious and suitable vulnerability drivers in the context of migration associated with water stress by drawing upon the findings in two review studies of Neumann and Hermans (2017) and Borderon et al. (2019). Our study focusses on the African continent since it is one of the most vulnerable continents when it comes to water stress due to its on average high exposure and relatively low levels of state capacities to implement effective adaptation measures (Adger et al., 2014). Large parts of the African continent are projected to face yield gaps as a result of water stress of over 40% as a result of water stress in rain-fed agriculture under the middle-of-the-road scenario shared-socioeconomic pathway (SSP2) scenario (Biemans, 2018).
The main objective of this study is to project where migration associated with water yield gaps in rainfed agriculture is relatively likely on the African continent by 2050 under a middle-of-the-road scenario, and to project how many people will be living in these areas by 2050. To our knowledge, this is the first attempt to map clusters of potential migration associated with water stress. The results from this study can aid by setting priorities in policymaking processes and can help to identify locations for case study research.
The subsequent section presents the methodology of the study followed by a section presenting the main results. After the results, a comprehensive discussion section follows. The paper ends with concluding remarks.
Materials and Methods
This section consists of four subsections to substantiate the methodology. In the first subsection, the choice of the indicators for the model are substantiated based on existing research and data. In the second subsection, the scenario and scale are presented. The third subsection explains what data has been used. In the last subsection the model approach is explained.
Identifying the Indicators
To assess future geographical clusters of potential migration associated with water stress, four indicators are identified that are of importance to identify levels regions vulnerable to emigration associated with water stress. These indicators have been selected based on the inventory and categorization of drivers by Neumann and Hermans (2017) and the case study review by Borderon et al. (2019), in combination with arguments derived from existing studies on migration. Since discussion exists upon the main drivers of migration in the context of environmental change, we provide the arguments for including specific drivers in the methodology section to provide a justification for the choices made. Thereby was the availability of projections a boundary condition to include indicators.
The Economic Indicator
The first indicator to include is gross domestic product (GDP) per capita, expressed in purchasing power parity (PPP). GDP PPP is more useful for this study than nominal GDP, since it takes the relative cost of living in the country into account, rather than just using international market exchange rates. GDP per capita PPP provides information on which regions are projected to face relatively high levels of migration associated with water stress for three reasons. First, the lower a country's average GDP per capita, the larger the rural population share is on average (De Brauw et al., 2014). The rural population is in general more dependent on the environment for their livelihoods than their urban counterparts. Second, and in line with the first reason, in countries with a low GDP per capita PPP, employment and income are more dependent on agriculture, as substantiated in Figure 1. In 2019, agriculture was the primary employment sector in sub-Saharan Africa, with around 53% of its population estimated to work in agriculture (World Bank, 2020). Therefore, a large share of the population in sub-Saharan Africa is vulnerable to decreasing precipitation or increasing variability, as compared to countries where people are predominantly employed in other sectors. Third, in countries with a low GDP PPP per capita, a relatively large share of the population lives in an economically marginalized position, which reduces their adaptive capacity to cope with potential losses (Chen et al., 2014).
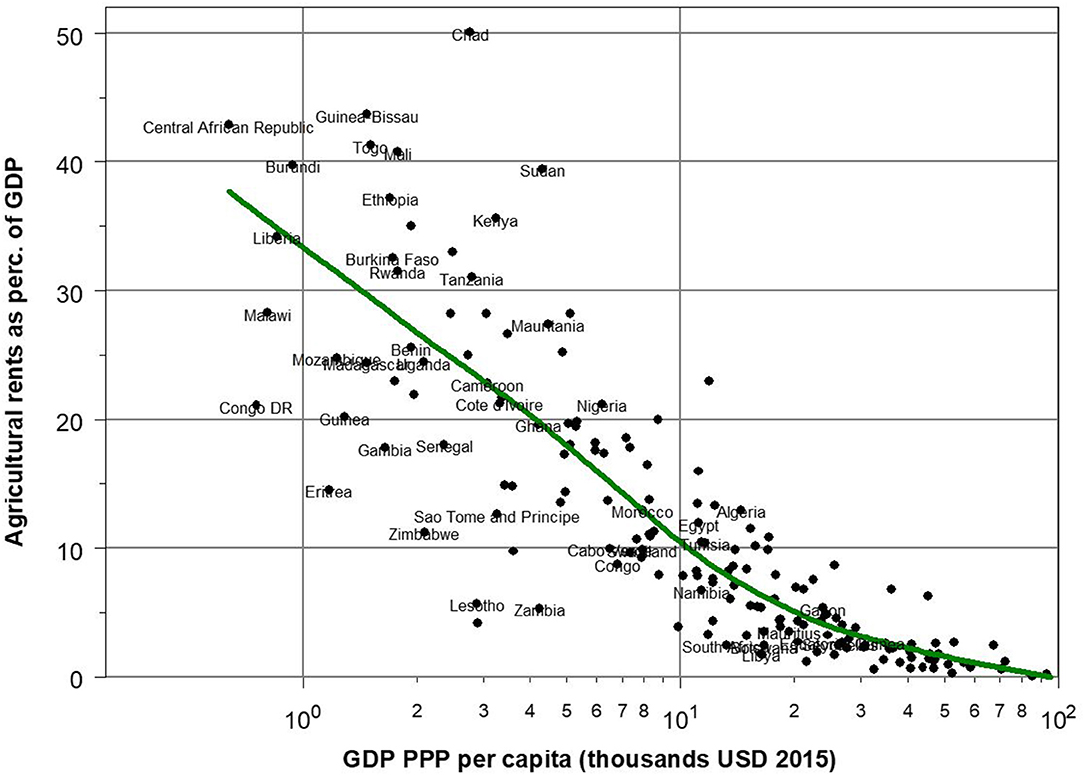
Figure 1. Illustration of the correlation between agricultural rents as percentage of GDP PPP and GDP PPP (data received from: World Bank, 2020). The green line represents the LOESS trend.
The Demographic Indicators
Two demographic indicators are included to cover different aspects of regional vulnerability to migration associated with water stress: the youth share and population growth. Youth share is included since the greatest mobility is found among younger adults (Hugo, 2011; Abu et al., 2014; Borderon et al., 2019). Hence, a large percentage of young people can influence the level of mobility of a population. Population growth is included to represent pressure on resources, often in terms of land availability, as a result of high population density due to high population growth has often been found as a driver of migration (Afifi, 2011; Bezu and Holden, 2014; Hermans-Neumann et al., 2017). We include population growth to account for pressure, since population density is not adequate. Population density fails to consider the carrying capacity of the environment. Drylands, for example, can be distinguished into different categories based on environmental features (Sietz et al., 2017), these different types provide a livelihood for a differing number of people, depending on the natural resource base and the governance of these resources. An increase in migration could be expected when the number of local inhabitants reaches the point of saturation with respect to livelihood opportunities related to the natural resource base, rather than just based on local differences in population density. The increase in rural population density gives especially younger people the push to look for opportunities elsewhere (Hugo, 2011). However, since population increase and share of young people do not correlate too well,1 we use both population growth and composition as two separate variables in our model. While population growth in parts of the “global north” is expected to decline, various parts of Asian and especially sub-Saharan African drylands are projected to continue to see high levels of population growth toward 2050 as shown in Figure 2.
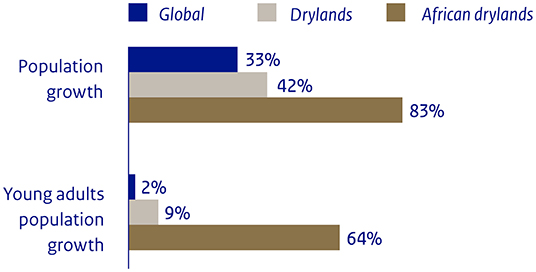
Figure 2. Population growth and growth of the share of young adults in %, by 2050 compared to 2010, globally, in drylands and in the African Drylands (Figure taken with permission from Ligtvoet et al., 2018, data from Samir and Lutz, 2017).
The Water Indicator
The water yield gap (WYG) was included to represent the impact of water stress on rainfed agricultural crop yields, and therefore reflects the impact of water stress on rural livelihoods depending on farming. We included the WYG rather than another water stress indicator for two reasons. First, most water stress indicators combine “green water” and “blue water”. Green water is water available to plants in soils, while blue water refers to the runoff in streams and rivers plus the annual recharge to aquifers (Rijsberman, 2006). To access blue water, irrigation schemes are needed, and since most of the African agriculture is rain-fed (Biemans, 2018), the use of these types of indicators tends to overestimate water availability for agriculture. Second, most water stress indicators are presented in relative severeness of water shortage but are not coupled to impact on livelihoods. To avoid this, we use the WYG since this indicator quantifies and isolates the effect of water stress on crop yields. This leaves other rural livelihoods depending on water out, although the indicator provides a proxy for limited grass growth due to water stress, which is relevant for pastoralists. The WYG estimates are derived from the dynamic global vegetation model IMAGE-LPJmL (Lund-Potsdam-Jena managed Land) (Bondeau et al., 2007) and described in more detail in Biemans (2018). In this model water availability as well as extension of the cropland area, climate change and a continuation of ongoing improvements in agricultural management practices are used to make projections of future crop yields both for rain-fed as well as for irrigated crops (Stehfest et al., 2014). The WYG for rain-fed agriculture represents the differences between actual yield and potential yield without water limitation (see Biemans, 2018 for more detail), as visualized in Figure 3.
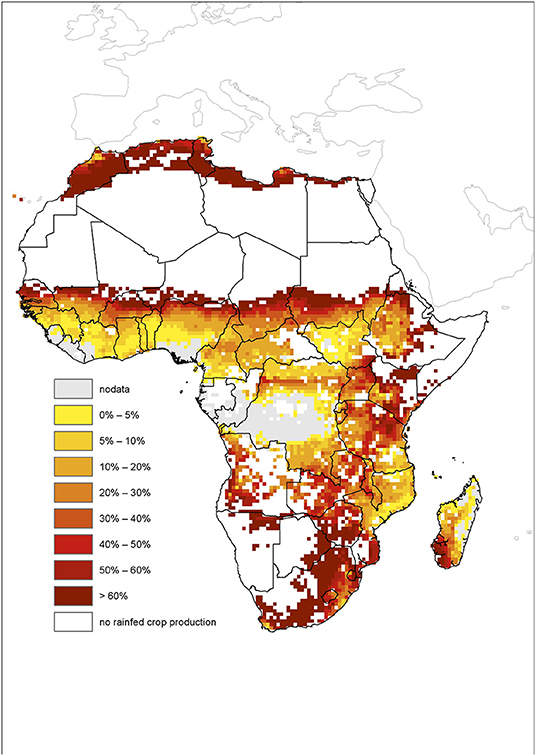
Figure 3. Gap in rain-fed crop yields in Africa by 2050 as a result of water stress.
Scenario and Scale
Projections for all four indicators were derived from the Shared Socioeconomic Pathway 2 (SSP2) storyline “the middle-of-the-road scenario” which reflects a continuation of current trends (Fricko et al., 2017; O'Neill et al., 2017). This scenario was combined with Representative Concentration Pathway (RCP) 6.0 for the WYG, representing a medium baseline emission scenario in combination with a high level of mitigation (van Vuuren et al., 2011).
As spatial aggregation level we made use of water provinces (Straatsma et al., 2020); a balanced sub-national representation of topographic, hydro-climatic, and administrative properties, with a minimal size of 20,000 km2 (Straatsma et al., 2020). We use national data for population growth, demographic composition and GDP per capita PPP, whereas water yield gap and population distribution are grid-based data with a resolution of 30 arc-seconds (~1 × 1 km near the earth's equator). The African continent features 393 water provinces, as illustrated in Figures 4, 5. National data are inherited by the water provinces within countries. Thirty arc-second data on the water yield gap are aggregated to the level of water provinces using an area weighted calculation method. Thirty arc-second grid data on the distribution of the population are summed over water provinces, to obtain the number of people living per water province.
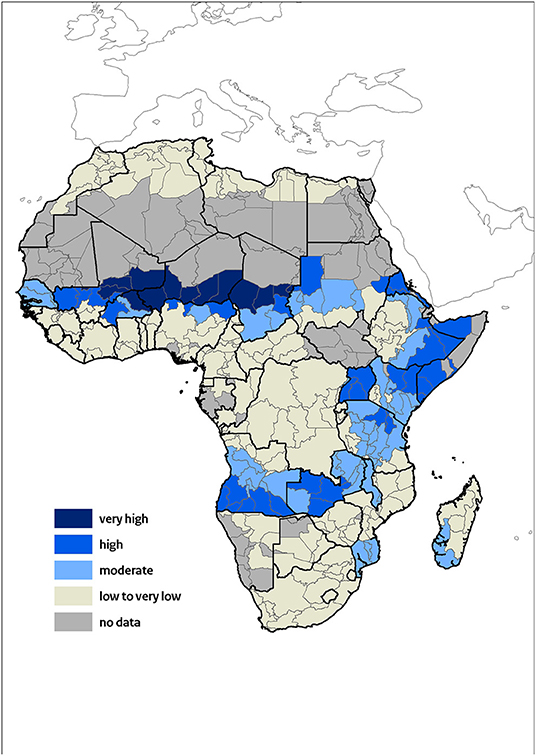
Figure 4. Probability map of regions facing migration associated with water stress by 2050 under the Shared Socioeconomic Pathway 2 scenario.
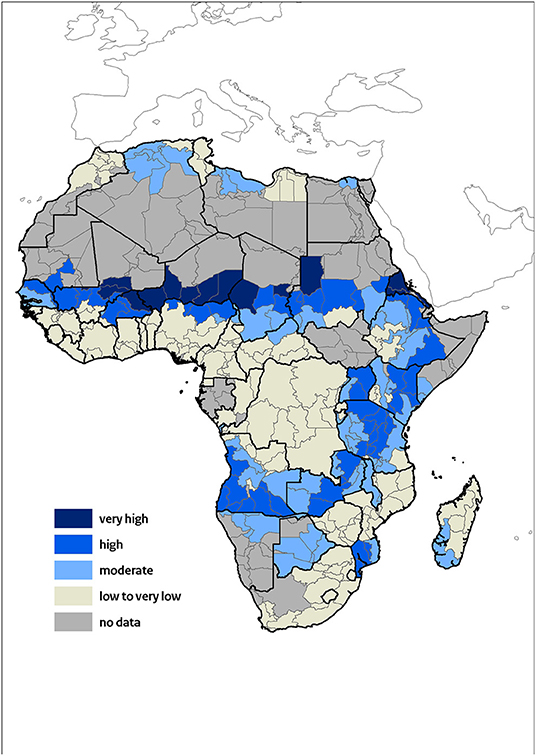
Figure 5. Probability map of emigration associated with water stress in 2010.
Data Sources
GDP per Capita PPP
GDP projections (converted to 2005 USD in PPP) for 2050 were derived from the SPSS2 scenario outlined by the International Institute for Applied Systems Analysis (IIASA) (Dellink et al., 2017). On the country level these data were divided by population projections to gain GDP per capita PPP.
Population Growth
Population growth projections on the country level for 2050 were derived from the SSP2 scenario outlined by the IIASA (Samir and Lutz, 2017). Results from the future urban growth model 2UP (Van Huijstee et al., 2018) were used to calculate the urban-rural distribution on the water province level to calculate the number of rural people per water province.
Share of Youth
The 15–29 year fraction was used to classify this indicator. Population projections on the country level were derived from the SSP2 scenario outlined by the IIASA (Samir and Lutz, 2017).
Water Yield Gap
Projections of the WYG for 2050 were derived from the LPJmL model using the SSP2 scenario making use of RCP 6.0 (Biemans, 2018). Actual yields were calculated by forcing the model with gridded precipitation data (CRU), whereas potential yields were calculated by supplying supplemental irrigation water in case of soil moisture deficits. These numbers, available at the level of 30 arc minutes, were aggregated to the water province level by calculating the average value for all cells containing data, hence cells with no data, mostly desert areas, were excluded.
Methodological Approach
To identify future potential clusters of migration we used a composite indicator technique (Nardo et al., 2005), by following a five-step procedure on the level of water provinces:
(1) all four indicators were normalized to values between 0 and 1 with the use of the lowest and highest values of all values for 2010 and 2050. Comparing results for both years is only possible when data for both years are normalized using the same under and upper boundaries;
(2) the four indicators were multiplied with equal weight, which is more discriminating toward the extreme values than an additive method;
(3) the results were taken to the power of ¼ to avoid skewness;
(4) the outcome values were multiplied by 10 and rounded up to gain discrete results between 0 and 10;
(5) the results were classified in probability categories. Water provinces with value 9 or 10: very high. Value 8: high. Value 7: moderate. Values 0 to 6: low to very low. The category “no data” consist of all water provinces without crops and water provinces without up-to-date data or projections available.
Results
By using projections of future WYGs, economic and demographic indicators, we compiled a map of potential emigration clusters associated with water stress by 2050. Figure 4 presents the spatial results. It illustrates that potential clusters of emigration may be relatively rare in northern Africa. Although the WYG is projected to be between 40 and 60% (Figure 3) here, vulnerability of rural communities is projected to be relatively lower due to the economic and demographic conditions compared to other regions. In sub-Saharan Africa several regions are projected to face larger levels of migration associated with water stress due to an accumulation of vulnerabilities. In the northern drylands of the Sahel, especially in Mali, Niger and Chad, migration associated with water stress is projected be high toward 2050 under the SSP2 scenario. Countries in the horn of Africa, Kenya, Ethiopia and northern Tanzania are also projected to be vulnerable. In addition, several regions of Angola and Zambia are projected to face relatively high levels of rural emigration due to an accumulation of economic and demographic factors in combination with agricultural water stress.
Figure 4 indicates areas where future potential emigration associated with water stress may be more likely than in other areas. The map does not provide information on the number of actual migrants nor on the distance these people may migrate. We can calculate the number of people projected to live in the rural areas in the different classes though, which is given in Table 1. Although less water provinces are indicated as highly vulnerable by 2050 compared to 2010 (Figure 5), the number of people living in these most vulnerable regions is projected to increase by 63 million, or 86% (Table 1).
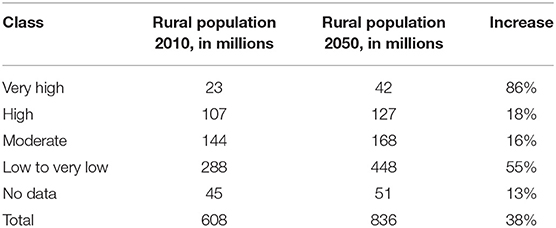
Table 1. Projected increase in rural population living in emigration cluster areas associated with water stress from 2010 to 2050 in millions (population data from: Samir and Lutz, 2017, rural-urban distinction by the 2UP model described in Van Huijstee et al., 2018).
Figure 6 shows that the indicators we considered most influential for this study, are projected to diminish in most classes in the SSP2 scenario. Only water stress slightly increases on average. The share of young people remains high in comparison to other regions in the world, although in absolute terms a small decrease is projected. For the level of income there is also an increase toward 2050, but since this indicator is scaled the other way around, the value decreases. In all classes the average income increases, though only slightly for the class “very high”. This development mostly concerns areas in Mali, Chad and Niger and one water province in northern Burkina Faso. These are the only areas where the share of young people is projected to increase toward 2050, opposed to other regions.
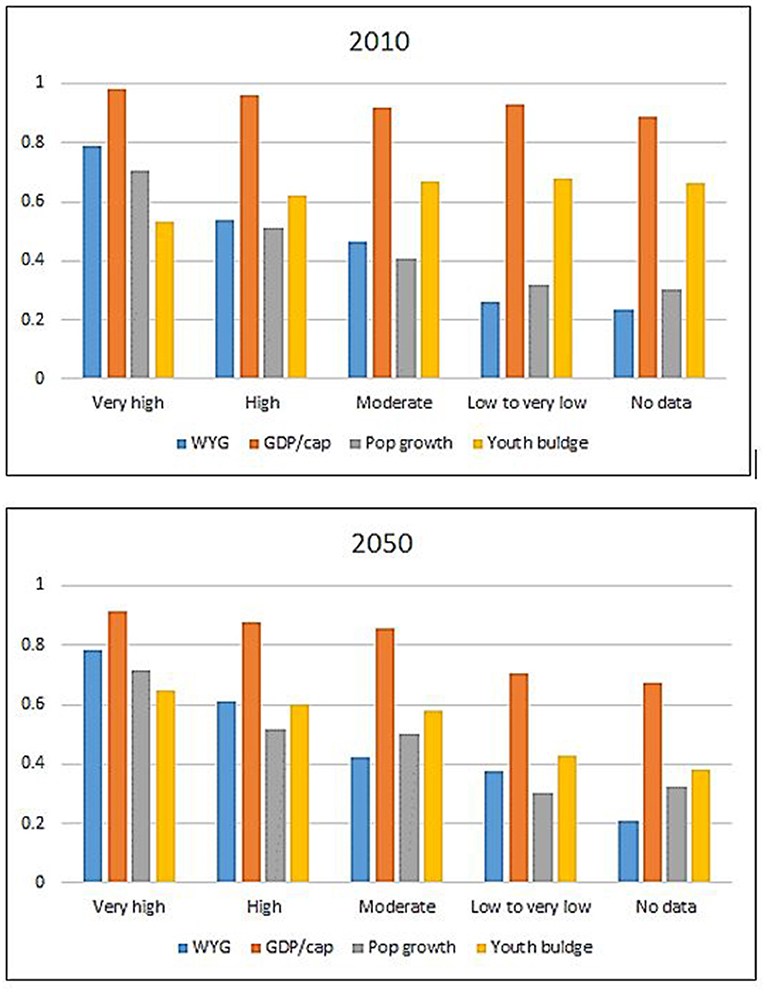
Figure 6. Average value of the four normalized indicators of the migration model for every legend class for 2010 and 2050. Gross domestic product per capita is depicted inversely: 1 being very low and 0 being very high, the other indicators are depicted in the same direction as their value: 1 meaning either a very high water yield gap, a very high share of youth, or a rapid increase of population.
Discussion
Scientific Contributions
The contribution of this study to the evolving research field on the link between human migration and environmental change is 2-fold. The first contribution is theoretical and is derived from insights in existing literature. This first contribution features the understanding that projecting precise numbers of “environmental migrants” is not possible, since migration is hardly, if ever, solely driven by environmental degradation. Additionally, migration associated with environmental degradation is highly context dependent. Following these insights, mapping vulnerabilities is the best way forward if we want to inform policymakers and practitioners about future migration linked to environmental conditions. The second, more explicit, contribution results from the first contribution. The second contribution is the development of an approach to provide information on regions where emigration associated with water stress is expected to be more likely than in others.
The first contribution of this study was the starting point of the mapping exercise. Since migration dynamics are affected by a diverse set of small- and large-scale conditions, push and pull factors, the goal of the study was not to project the exact number of future migrants affected by water stress by 2050. This exact number, even in a specific scenario with specific assumptions, would have provided a false sense of precision. Additionally, we do not provide information on the distance these migrants will travel, although the expectation is that people affected by water stress will mostly move within countries or to neighboring countries where livelihood opportunities are perceived to be better (de Bruijn and van Dijk, 2003; Henry et al., 2004). Contrary to our conviction, a 2018 study by The World Bank Group (Rigaud et al., 2018) did provide exact projections on the number of “internal climate migrants” by 2050. According to this study, in South Asia, Sub-Saharan Africa and Latin America, a total of 143 million people will be forced to move within their own countries, due to the impacts of slow-onset climate change. From our perspective, stating these exact numbers provides a false sense of precision, since migration dynamics are too complex, highly non-linear, and hardly ever only driven by climatic conditions. Although the 2018 World Bank study provides valuable insights on migrant decisions and destinations and combining multi-risk scenarios, providing projections on the exact number of “internal climate migrants” is too precise when compared to the current insights. Consequently, the strength of our study lies in the indication of vulnerable areas given projected future developments, rather than providing the estimated exact numbers of migrants itself.
The second contribution is the actual the methodology of this study. The approach is conceptually consistent with a growing body of research on environmental degradation, climate change and human security that seeks to incorporate national and sub-national variation in vulnerability levels. Existing work includes climate change vulnerability in Africa (Busby et al., 2014), food—cereal—production vulnerability to climate change (Fraser et al., 2013), poverty, vulnerability and climate change (Thornton et al., 2008) and population and climate change hotspots in Africa and parts of Asia (Hugo, 2011). While the precise methodology differs per study, all aim to provide insight in future climate- and environmentally induced impacts on human security, with our study being the first that specifically addresses migration.
The results show that the regions where emigration associated with water stress is relatively likely compared to other regions will not increase compared to 2010, although the number of people living in the more vulnerable regions is projected to almost double. This implies that the challenges in these areas increase. Consequently, more efforts will be needed to support sustainable and inclusive development. Many of these areas coincide with areas with high erosion sensitivity as indicated by Sietz et al. (2017) and areas where low resilience to climate change and high population growth coincide (Hugo, 2011). Thereby are these areas situated in countries presently having low institutional capacities (Kaufman and Kraay, 2019), what could severely limit adaptive capacities locally (Adger et al., 2014).
Limitations
The study has multiple limitations, as a result of the indicators used and their spatial scale, and the weighing of the indicators.
Indicators
The indicators used in this study reflect conditions of importance to migration associated with water stress, taking the spatial scale of this study into account. However, additional indicators can be thought of as of importance too. Governance structures and policies to assist or halt migration could affect where people are going, although there is evidence that restricting policies do not lower the number of migrant (Tacoli, 2010). A governance-related indicator would have not been included because the link with environmentally linked migration was found to be too fuzzy.
Another condition that has not been included is infrastructure and accessibility. Several studies have showed that the better connected a community is to decent roads, the more likely it is that seasonal and permanent migration occur (Henry et al., 2004; Afifi et al., 2014). Access to good infrastructure is an important characteristic for regional or national migration dynamics analyses. Although road infrastructure projections on the country level are available (Meijer et al., 2018), we did not include this indicator since it would discriminate against countries with relatively low levels of GDP per capita, since income is a major driver of infrastructure expansion in the scenario study by Meijer et al. (2018). And because GDP per capita was applied as the proxy for several important dimensions to indicate vulnerability to water stress (agricultural dependency, rural share, adaptive capacity), including road infrastructure would contradict this.
Education is an additional indicator which has not been included. High education levels have been found to increase migration levels since it creates opportunities to work in other regions or even abroad (de Haas, 2010; Neumann and Hermans, 2017). Generally, the higher a person is educated, the higher the probability of migration (Browne, 2017). However, education is excluded from the analysis since this study focusses on the people most vulnerable to environmental degradation, and well-educated people are not considered to be part of this group.
Lastly, solely one water indicator was operationalized. The WYG provides information on the impact of water stress on crop yield, grasping the reduction in production related to water use. However, the rain-fed module of the LPJmL model assumes that no additional water resources will become available in the future. This might not be representative, as autonomous adaptation will take place. Water efficiency and water conservation, such as with water harvesting techniques or small private wells, could potentially partly fill the future water yield gaps (Jägermeyr et al., 2017). Furthermore, it is highly uncertain where irrigation systems will be developed, especially in areas with lacking, incomplete or even unreliable data (Döll and Siebert, 2002; Wisser et al., 2008). Additionally, the indicator addresses solely crops, while livestock plays a significant role in many rural livelihoods (Herrero et al., 2013). Although (managed) grasslands are not included in the water yield gap, the relative decrease in the growth of grass due to water stress will be like crops.
Additional Environmental Pressures
There are multi other environmental and climate-related drivers that affect migration dynamics in rural areas (Black et al., 2011a; Borderon et al., 2019). Two important slow-onset drivers are overall temperature and land degradation. When temperatures rise above a mean annual temperature of 29°C, it becomes too hot to sustain agricultural livelihoods (Xu et al., 2020). In an extreme climate change scenario, large parts of the African continent reach this conditions toward the end of the century (Xu et al., 2020). Depleted soils and land degradation, both human and climate induced, can severely diminish agricultural production, and decrease rural livelihoods conditions (van der Esch et al., 2017; Olsson et al., 2019). Although we aimed to focus specifically on the impact of water stress, combining the risks of various environmental conditions for emigration could be a valuable next step in this field.
Income Levels
Another limitation of the study is the use of mean income levels, since this does not reflect reality. The incomes of small farmers and day laborer's will undoubtedly be lower than the average national per capita income. Additionally, since the increase of GDP is largely caused by non-agricultural rents, as suggested by Figure 2 and supported by Rodrik (2018), the effect of overall income increases on farmer income might be minimal. The economic SSP projections are based on a rather general model, which does not distinguish between economic sectors (Dellink et al., 2017). Besides these limitations, the overall GDP projections have been criticized as too optimistic (Buhaug and Vestby, 2019). To get an impression of the potential bandwidth we did a model run for 2050 using 2010 GDP, which shows a shift of around 40 million people living in areas classified as moderately probable moving to the highly probable class. This implies an increase of people living in areas classified as “high” of 58% instead of 18%.
Weighing the Indicators
A last important limitation to this study is the weighing of the indicators. As showed by Chowdhury and Squire (2006) and Visser et al. (2020) the choice of weighing composite indicators has huge impacts on the results. The level of agreement found in the literature is not convincing enough to weight the impact of the four identified variables that affect migration in our model other than evenly. The implication of this choice is that the WYG, has a minor impact on potential changes in migration compared to the socio-economic factors. This choice has rather big consequences. If the WYG was modeled as being evenly important as all three socio-economic factors together, the number of rural people living in areas classified as “very high” would increase from 23 million in 2010 to 53 million in 2050. This increase of 134% is substantially larger than the 89% estimated if all four indicators are weighted evenly. At the same time, the number of rural people living in areas classified as “low to very low” doubles in comparison with the original model, whereas the increase in the original model is estimated at 55%. All together this weighing would imply less people living in areas classified with at least a moderate probability of migration linked to water stress, even a decrease in comparison to 2010, but far more living in the very high probability class.
Neo-Malthusian vs. Boserup
This study has implicitly applied a neo-Malthusian approach by taking population growth as an indicator which can enhance migration. Including this indicator assumes that increasing pressure on resources can increase the number of migrants. This assumption is in line with neo-Malthusianism (Reuveny and Moore, 2009). Yet, this theory is not universally applicable and often criticized (McLeman and Gemenne, 2018). For example, a case study in northern Ghana observed that when critical levels of available food were reached, improvement of agricultural practices was an often applied adaptation option, rather than emigration (van der Geest, 2011). This is observation is in line with the theory of Boserup (1965). She stated that the exhaustion of natural resources leads to intensification and innovation. Innovation of agricultural practices is incorporated in the projections of agricultural developments used to calculate the water yield gap, although not linked to degrading environmental conditions, but linked to increasing GDP per capita.
The distinction between in situ adaptation to agricultural water stress—innovations to raise crops yields, or livelihood diversification outside of agriculture when possible—and ex situ adaptation—emigration—is important to make. However, empirical research shows that both strategies are applied, often in the same communities (Black et al., 2011b; Mortreux et al., 2018).
Conclusions
In this study we have developed a method to map in which African water provinces migration associated with water yield gaps is projected to be relatively high by 2050 following the SSP2/RCP6.0 scenario. The results are based on vulnerability mapping, regarded as the most appropriate way to project in which regions migration associated with water stress is more likely than in other regions. Vulnerability mapping is the most appropriate approach because of the complex, non-linear and context-dependent dimensions that shape migration dynamics.
Some sub-Saharan African drylands are projected to face relatively high levels of emigration associated with water stress by 2050 under a SSP2 scenario. These regions include the northern Sahel, the Horn of Africa and regions in and around Angola. In comparison with the result of a model run with data from 2010, fewer areas are qualified as having a “moderate,” “high,” or “very high” probability of facing emigration associated with water stress. Yet, the number of people living in those areas increases toward 2050, especially in the most prone areas. The rural livelihood prospects in the regions identified as having a “high” or “very high” probability of migration will be most certainly limited without substantial investments in adaptation measures such as water infrastructure. The findings of this study can support policymakers in setting priorities or help to identify locations for more detailed case study research.
Data Availability Statement
Water yield gap data: https://figshare.com/s/eb1810995e8f390b4d5b. The original contributions presented in the study are included in the article/supplementary material, further inquiries can be directed to the corresponding author/s.
Author Contributions
SdB and JK developed the study design. HB developed the Water Yield Gap. The manuscript was written by SdB and all authors commented on previous versions. Material preparation, data collection and analysis were performed by all authors. All authors read and approved the final manuscript.
Funding
This research is made possible by the Dutch Ministry of Foreign Affairs. Funding made public in the state courant nr 41074, 2018.
Conflict of Interest
The authors declare that the research was conducted in the absence of any commercial or financial relationships that could be construed as a potential conflict of interest.
Publisher's Note
All claims expressed in this article are solely those of the authors and do not necessarily represent those of their affiliated organizations, or those of the publisher, the editors and the reviewers. Any product that may be evaluated in this article, or claim that may be made by its manufacturer, is not guaranteed or endorsed by the publisher.
Acknowledgments
We thank Arno Bouwman, Willem Ligtvoet (both PBL Netherlands Assessment Agency) and Kees van der Geest (Institute for Environment and Human Security, United Nations University) for their efforts to optimize the research.
Footnotes
1. ^Correlation coefficient = 0.55 (calculation based on population data used in this study derived from Samir and Lutz, 2017).
References
Abu, M., Codjoe, S. N. A., and Sward, J. (2014). Climate change and internal migration intentions in the forest-savannah transition zone of Ghana. Popul. Environ. 35, 341–364. doi: 10.1007/s11111-013-0191-y
Adger, W., Pulhin, J., Barnett, J., Hovelsrud, G., Levy, M., Oswald Spring, U., et al. (2014). “Human Security,” in Climate Change 2014: Impacts, Adaptation, and Vulnerability. Part A: Global and Sectoral Aspects. Contribution of Working Group II to the Fifth Assessment Report of the Intergovernmental Panel on Climate Change, eds C. B. Field, V. R. Barros, D. Jon Dokken, K. J. Mach, and M. D. Mastrandrea (New York, NY: Cambridge University Press), 755–791.
Adger, W. N., Arnell, N. W., Black, R., Dercon, S., Geddes, A., and Thomas, D. S. G. (2015). Focus on environmental risks and migration: causes and consequences. Environ. Res. Lett. 10, 060201. doi: 10.1088/1748-9326/10/6/060201
Afifi, T. (2011). Economic or environmental migration? The push factors in Niger. Int. Migr. 49, e95–e124. doi: 10.1111/j.1468-2435.2010.00644.x
Afifi, T., Liwenga, E., and Kwezi, L. (2014). Rainfall-induced crop failure, food insecurity and out-migration in Same-Kilimanjaro, Tanzania. Clim. Dev. 6, 53–60. doi: 10.1080/17565529.2013.826128
Afifi, T., Milan, A., Etzold, B., Schraven, B., Rademacher-Schulz, C., Sakdapolrak, P., et al. (2016). Human mobility in response to rainfall variability: opportunities for migration as a successful adaptation strategy in eight case studies. Migr. Dev. 5, 254–274. doi: 10.1080/21632324.2015.1022974
Balasubramanya, S., and Stifel, D. (2020). Viewpoint: water, agriculture & poverty in an era of climate change: why do we know so little? Food Policy 93, 101905. doi: 10.1016/j.foodpol.2020.101905
Bezu, S., and Holden, S. (2014). Are rural youth in Ethiopia abandoning agriculture? World Dev. 64, 259–272. doi: 10.1016/j.worlddev.2014.06.013
Biemans, H. (2018). Water, Climate and Food Production. Scientific Justification of the Information Produced for ‘The Geography of Future Water Challenges’. Wageningen University and Research. Available online at: https://www.pbl.nl/sites/default/files/downloads/pbl-2019-the-geography-of-future-water-challenges-water-climate-and-food-production_3147.pdf (accessed July 20, 2021).
Black, R., Adger, W. N., Arnell, N. W., Dercon, S., Geddes, A., and Thomas, D. (2011a). The effect of environmental change on human migration. Global Environ. Change 21, S3–S11. doi: 10.1016/j.gloenvcha.2011.10.001
Black, R., Bennett, S. R., Thomas, S. M., and Beddington, J. R. (2011b). Climate change: migration as adaptation. Nature 478, 447. doi: 10.1038/478477a
Bondeau, A., Smith, P. C., Zaehle, S., Schaphoff, S., Lucht, W., Cramer, W., et al. (2007). Modelling the role of agriculture for the 20th century global terrestrial carbon balance. Glob. Chang. Biol. 13, 679–706. doi: 10.1111/j.1365-2486.2006.01305.x
Borderon, M., Sakdapolrak, P., Muttarak, R., Kebede, E., Pagogna, R., and Sporer, E. (2019). Migration influenced by environmental change in Africa A systematic review of empirical evidence. Demogr. Res. 41, 491–544. doi: 10.4054/DemRes.2019.41.18
Boserup, E. (1965). The Conditions of Agricultural Growth: The Economics of Agrarian Change Under Population Pressure. London: George Allen & Unwin LTD.
Browne, E. (2017). “Evidence on education as a driver for migration,” in K4D Helpdesk Report (Brighton: Institute of Development Studies).
Buhaug, H., and Vestby, J. (2019). On growth projections in the shared socioeconomic pathways. Global Environ. Polit. 19, 118–132. doi: 10.1162/glep_a_00525
Busby, J. W., Smith, T. G., and Krishnan, N. (2014). Climate security vulnerability in Africa mapping 3.0. Polit. Geogr. 43, 51–67. doi: 10.1016/j.polgeo.2014.10.005
Carr, E. R. (2005). Placing the environment in migration: environment, economy, and power in Ghana's central region. Environ. Plann. A Econ. Space 37, 925–946. doi: 10.1068/a3754
Cattaneo, C., Beine, M., Fröhlich, C. J., Kniveton, D., Martinez-Zarzoso, I., Mastrorillo, M., et al. (2019). Human migration in the era of climate change. Rev. Environ. Econ. Policy 13, 189–206. doi: 10.1093/reep/rez008
Chen, M., Zhang, H., Liu, W., and Zhang, W. (2014). The global pattern of urbanization and economic growth: evidence from the last three decades. PLoS ONE 9, e103799–e103799. doi: 10.1371/journal.pone.0103799
Chowdhury, S., and Squire, L. (2006). Setting weights for aggregate indices: An application to the commitment to development index and human development index. J. Dev. Stud. 42, 761–771. doi: 10.1080/00220380600741904
Clement, V., Rigaud, K. K., de Sherbinin, A., Jones, B., Adamo, S., Schewe, J., et al. (2021). Groundswell Part 2 : Acting on Internal Climate Migration. Washington DC: World Bank.
De Brauw, A., Mueller, V., and Lee, H. L. (2014). The role of rural–urban migration in the structural transformation of Sub-Saharan Africa. World Dev. 63, 33–42. doi: 10.1016/j.worlddev.2013.10.013
de Bruijn, M., and van Dijk, H. (2003). Changing population mobility in West Africa: Fulbe pastoralists in Central and South Mali. Afr. Aff. 102, 285–307. doi: 10.1093/afraf/adg005
de Haas, H. (2010). Migration Transitions: A Theoretical and Empirical Inquiry Into the Developmental Drivers of International Migration. Oxford: International Migration Institute, University of Oxford.
Dellink, R., Chateau, J., Lanzi, E., and Magné, B. (2017). Long-term economic growth projections in the shared socioeconomic pathways. Global Environ. Change 42, 200–214. doi: 10.1016/j.gloenvcha.2015.06.004
Döll, P., and Siebert, S. (2002). Global modeling of irrigation water requirements. Water Resour. Res. 38, 8-1-8-10. doi: 10.1029/2001WR000355
Fraser, E. D., Simelton, E., Termansen, M., Gosling, S. N., and South, A. (2013). “Vulnerability hotspots”: integrating socio-economic and hydrological models to identify where cereal production may decline in the future due to climate change induced drought. Agric. For. Meteorol. 170, 195–205. doi: 10.1016/j.agrformet.2012.04.008
Fricko, O., Havlik, P., Rogelj, J., Klimont, Z., Gusti, M., Johnson, N., et al. (2017). The marker quantification of the Shared Socioeconomic Pathway 2: a middle-of-the-road scenario for the 21st century. Global Environ. Change 42, 251–267. doi: 10.1016/j.gloenvcha.2016.06.004
Gemenne, F. (2011). Why the numbers don't add up: A review of estimates and predictions of people displaced by environmental changes. Global Environ. Change 21, S41–S49. doi: 10.1016/j.gloenvcha.2011.09.005
Henry, S., Schoumaker, B., and Beauchemin, C. (2004). The impact of rainfall on the first out-migration: a multi-level event-history analysis in Burkina Faso. Popul. Environ. 25, 423–460. doi: 10.1023/B:POEN.0000036928.17696.e8
Hermans-Neumann, K., Priess, J., and Herold, M. (2017). Human migration, climate variability, and land degradation: hotspots of socio-ecological pressure in Ethiopia. Regional Environ. Change 17, 1479–1492. doi: 10.1007/s10113-017-1108-6
Herrero, M., Grace, D., Njuki, J., Johnson, N., Enahoro, D., Silvestri, S., et al. (2013). The roles of livestock in developing countries. Animal 7, 3–18. doi: 10.1017/S1751731112001954
Hugo, G. (2011). Future demographic change and its interactions with migration and climate change. Global Environ. Change 21, S21–S33. doi: 10.1016/j.gloenvcha.2011.09.008
IOM (2021). Migration Data Portal. International Organisation for Migration's Global Migration Data Portal. Available online at: https://migrationdataportal.org/themes/environmental_migration_and_statistics (accessed June 29, 2021).
IRP (2022). “Global Assessment of the nexus between natural resources, migration and immobility”, in Resource Implications of Human Mobility and Migration, eds S. H. Ali, R. Djalante, and D. Kniveton (Paris: International Resource Panel).
Jägermeyr, J., Pastor, A., Biemans, H., and Gerten, D. (2017). Reconciling irrigated food production with environmental flows for Sustainable Development Goals implementation. Nat. Commun. 8, 15900. doi: 10.1038/ncomms15900
Kaufman, D., and Kraay, A. (2019). Worldwide Governance Indicators. Available online at: https://info.worldbank.org/governance/wgi/Home/Reports (accessed August 11, 2019).
Kolmannskog, V. O. (2008). Future Floods of Refugees: A Comment on Climate Change, Conflict and Forced Migration. Oslo: Norwegian Refugee Council.
Ligtvoet, W., Bouwman, A., Knoop, J., de Bruin, S. P., Nabielek, K., Huitzing, H., et al. (2018). The Geography of Future Water Challenges. The Hague: PBL Netherlands Environmental Assessment Agency.
McLeman, R. (2013). Developments in modelling of climate change-related migration. Clim. Change 117, 599–611. doi: 10.1007/s10584-012-0578-2
McLeman, R., and Gemenne, F. (2018). “Environmental migration research: Evolution and current state of the science,” in Routledge Handbook of Environmental Displacement and Migration, eds R. McLeman, and F. Gemenne (New York, NY: Routledge), 3–16.
Meijer, J. R., Huijbregts, M. A., Schotten, K. C., and Schipper, A. M. (2018). Global patterns of current and future road infrastructure. Environ. Res. Lett. 13, 064006. doi: 10.1088/1748-9326/aabd42
Mortreux, C., de Campos, R. S., and Adger, W. N. (2018). “Mobility, displacement and migration, and their interactions with vulnerability and adaptation to environmental risks,” in Routledge Handbook of Environmental Displacement and Migration, eds R. McLeman, and F. Gemenne (New York, NY: Routledge), 29–41.
Myers, N. (2002). Environmental Refugees: a growing phenomenon of the 21st century. Philos. Trans. R. Soc. Lond,. B,. Biol. Sci. 357, 609–613. doi: 10.1098/rstb.2001.0953
Namara, R. E., Hanjra, M. A., Castillo, G. E., Ravnborg, H. M., Smith, L., and Van Koppen, B. (2010). Agricultural water management and poverty linkages. Agric. Water Manag. 97, 520–527. doi: 10.1016/j.agwat.2009.05.007
Nardo, M., Saisana, M., Saltelli, A., and Tarantola, S. (2005). Tools for Composite Indicator Building. Ispra: JRC.
Neumann, K., and Hermans, F. (2017). What drives human migration in sahelian countries? A Meta-analysis. Popul. Space Place 23, e1962. doi: 10.1002/psp.1962
Neumann, K., and Hilderink, H. (2015). Opportunities and challenges for investigating the environment-migration nexus. Hum. Ecol. 43, 309–322. doi: 10.1007/s10745-015-9733-5
Neumann, K., Sietz, D., Hilderink, H., Janssen, P., Kok, M., and van Dijk, H. (2015). Environmental drivers of human migration in drylands–A spatial picture. Appl. Geograp. 56, 116–126. doi: 10.1016/j.apgeog.2014.11.021
Olsson, L. H., Barbosa, S., Bhadwal, A., Cowie, K., Delusca, D., Flores-Renteria, K., et al. (2019). “Land degradation,” in Climate Change and Land: an IPCC Special Report on Climate Change, Desertification, Land Degradation, Sustainable Land Management, Food Security, and Greenhouse Gas Fluxes in Terrestrial Ecosystems, eds P.R. Shukla, E. Calvo Buendia, V. Masson-Delmotte, H.-O. Pörtner, D. C. Roberts, P. Zhai, et al. (Intergovernmental Panel on Climate Change).
O'Neill, B. C., Kriegler, E., Ebi, K. L., Kemp-Benedict, E., Riahi, K., Rothman, D. S., et al. (2017). The roads ahead: narratives for shared socioeconomic pathways describing world futures in the 21st century. Clim. Change. 42, 169–180. doi: 10.1016/j.gloenvcha.2015.01.004
Reuveny, R., and Moore, W. H. (2009). Does environmental degradation influence migration? Emigration to developed countries in the late 1980s and 1990s*. Soc. Sci. Q. 90, 461–479. doi: 10.1111/j.1540-6237.2009.00569.x
Rigaud, K. K., de Sherbinin, A., Jones, B., Bergmann, J., Clement, V., Ober, K., et al. (2018). Groundswell: Preparing for Internal Climate Migration. Washington DC: World Bank.
Rijsberman, F. R. (2006). Water scarcity: fact or fiction? Agric. Water Manag. 80, 5–22. doi: 10.1016/j.agwat.2005.07.001
Samir, K., and Lutz, W. (2017). The human core of the shared socioeconomic pathways: population scenarios by age, sex and level of education for all countries to 2100. Global Environ. Change 42, 181–192. doi: 10.1016/j.gloenvcha.2014.06.004
Scheffran, J., Marmer, E., and Sow, P. (2012). Migration as a contribution to resilience and innovation in climate adaptation: Social networks and co-development in Northwest Africa. Appl. Geograp. 33, 119–127. doi: 10.1016/j.apgeog.2011.10.002
Sietz, D., Ordoñez, J., Kok, M., Janssen, P., Hilderink, H. B., Tittonell, P., et al. (2017). Nested archetypes of vulnerability in African drylands: where lies potential for sustainable agricultural intensification? Environ. Res. Lett. 12, 095006. doi: 10.1088/1748-9326/aa768b
Stehfest, E., Van Vuuren, D., Kram, T., Bouwman, L., Alkemade, R., Bakkenes, M., et al. (2014). Integrated Assessment of Global Environmental Change With IMAGE 3.0. Model Description and Policy Applications. The Hague: PBL Netherlands Environmental Assessment Agency.
Straatsma, M., Droogers, P., Hunink, J., Berendrecht, W., Buitink, J., Buytaert, W., et al. (2020). Global to regional scale evaluation of adaptation measures to reduce the future water gap. Environ. Model. Softw. 124, 104578. doi: 10.1016/j.envsoft.2019.104578
Tacoli, C. (2010). Governance, migration and local development. Environ. Urban. 5, 5–11. doi: 10.1177/0956247810364111
Thornton, P., Jones, P., Owiyo, T., Kruska, R., Herrero, M., Orindi, V., et al. (2008). Climate change and poverty in Africa: mapping hotspots of vulnerability. Afr. J. Agric. 2, 24. doi: 10.22004/ag.econ.56966
van der Esch, S., ten Brink, B., Stehfest, E., Bakkenes, M., Sewell, A., Bouwman, A., et al. (2017). Exploring Future Changes in Land Use and Land Condition and the Impacts on Food, Water, Climate Change and Biodiversity: Scenarios for the UNCCD Global Land Outlook. The Hague: PBL Netherlands Environmental Assessment Agency.
van der Geest, K. (2011). North-South migration in Ghana: what role for the environment? Int. Migr. 49, e69–e94. doi: 10.1111/j.1468-2435.2010.00645.x
Van der Geest, K., Vrieling, A., and Dietz, T. (2010). Migration and environment in Ghana: a cross-district analysis of human mobility and vegetation dynamics. Environ. Urban. 22, 107–123. doi: 10.1177/0956247809362842
Van Huijstee, J, Van Bemmel, B, Bouwman, A, and Van Rijn, F. (2018). Towards an Urban Preview: Modelling Future Urban Growth With 2UP. The Hague: PBL Netherlands Environmental Assessment Agency.
van Vuuren, D. P., Edmonds, J., Kainuma, M., Riahi, K., Thomson, A., Hibbard, K., et al. (2011). The representative concentration pathways: an overview. Clim. Change 109, 5. doi: 10.1007/s10584-011-0148-z
Visser, H., de Bruin, S. P., Martens, A., Knoop, J., and Ligtvoet, W. (2020). What users of global risk indicators should know. Global Environ. Change 62, 102068. doi: 10.1016/j.gloenvcha.2020.102068
Warner, K., Hamza, M., Oliver-Smith, A., Renaud, F., and Julca, A. (2010). Climate change, environmental degradation and migration. Nat. Hazards 55, 689–715. doi: 10.1007/s11069-009-9419-7
Westing, A. H. (1994). Population, desertification, and migration. Environ. Conserv. 21, 110–114. doi: 10.1017/S0376892900024528
Wisser, D., Frolking, S., Douglas, E. M., Fekete, B. M., Vörösmarty, C. J., and Schumann, A. H. (2008). Global irrigation water demand: variability and uncertainties arising from agricultural and climate data sets. Geophys. Res. Lett. 35. doi: 10.1029/2008GL035296
World Bank (2020). World Bank Open Data. Available online at: https://data.worldbank.org/ (accessed December 12, 2020).
Keywords: migration, water yield gap, rural livelihoods, vulnerability mapping, scenario analysis
Citation: de Bruin SP, Knoop J, Visser H and Biemans H (2022) Identifying Potential Clusters of Future Migration Associated With Water Stress in Africa: A Vulnerability Approach. Front. Hum. Dyn. 4:754354. doi: 10.3389/fhumd.2022.754354
Received: 06 August 2021; Accepted: 12 April 2022;
Published: 02 May 2022.
Edited by:
Alexandre Gori Maia, State University of Campinas, BrazilReviewed by:
David Craig Griffith, East Carolina University, United StatesJouni Paavola, University of Leeds, United Kingdom
Copyright © 2022 de Bruin, Knoop, Visser and Biemans. This is an open-access article distributed under the terms of the Creative Commons Attribution License (CC BY). The use, distribution or reproduction in other forums is permitted, provided the original author(s) and the copyright owner(s) are credited and that the original publication in this journal is cited, in accordance with accepted academic practice. No use, distribution or reproduction is permitted which does not comply with these terms.
*Correspondence: Sophie Pieternel de Bruin, s.p.de.bruin@vu.nl