Obstacle Detection Display for Visually Impaired: Coding of Direction, Distance, and Height on a Vibrotactile Waist Band
 Jan B. F. van Erp
 Liselotte C. M. Kroon1
 Tina Mioch
 Katja I. Paul
- 1Perceptual and Cognitive Systems, TNO, Soesterberg, Netherlands
- 2Computer Science, University of Twente, Enschede, Netherlands
- 3University of Groningen, Groningen, Netherlands
Electronic travel aids (ETAs) can potentially increase the safety and comfort of blind users by detecting and displaying obstacles outside the range of the white cane. In a series of experiments, we aim to balance the amount of information displayed and the comprehensibility of the information taking into account the risk of information overload. In Experiment 1, we investigate perception of compound signals displayed on a tactile vest while walking. The results confirm that the threat of information overload is clear and present. Tactile coding parameters that are sufficiently discriminable in isolation may not be so in compound signals and while walking and using the white cane. Horizontal tactor location is a strong coding parameter, and temporal pattern is the preferred secondary coding parameter. Vertical location is also possible as coding parameter but it requires additional tactors and makes the display hardware more complex and expensive and less user friendly. In Experiment 2, we investigate how we can off-load the tactile modality by mitigating part of the information to an auditory display. Off-loading the tactile modality through auditory presentation is possible, but this off-loading is limited and may result in a new threat of auditory overload. In addition, taxing the auditory channel may in turn interfere with other auditory cues from the environment. In Experiment 3, we off-load the tactile sense by reducing the amount of displayed information using several filter rules. The resulting design was evaluated in Experiment 4 with visually impaired users. Although they acknowledge the potential of the display, the added of the ETA as a whole also depends on its sensor and object recognition capabilities. We recommend to use not more than two coding parameters in a tactile compound message and apply filter rules to reduce the amount of obstacles to be displayed in an obstacle avoidance ETA.
Introduction
According to the World Health Organization (2014), 285 million people are estimated to be visually impaired worldwide: 39 million are blind and 246 million have low vision. Electronic travel aids (ETAs) have the potential to increase the mobility and with that the quality of life of the visually impaired. ETAs have two main components: (1) sensors to determine location and orientation and to detect and possibly identify objects in the environment and (2) displays to present information about for instance waypoints and obstacles. Since visual displays are of little or no use to this user population, work has been focused on displaying information through the sense of hearing and/or touch. In this paper, we focus on the design of a multisensory display for an ETA and not on its sensors. Sensor technology that is able to detect and identify obstacles beyond the range of the white cane is developing rapidly although it certainly is not perfect yet (Zeng et al., 2017a,b). Through a series of experiments, we aim to formulate recommendations that balance the information availability (provided by the ETA) and the information processing capabilities of the user. This balance is important because the temptation to present all information generated by the ETA may result in an increased threat of information overload of the user and reduce the potential of the ETA system.
Levels of Navigation
Electronic travel aids support navigation tasks. Wickens (Wickens, 1992; Prevett and Wickens, 1994) distinguished two levels of navigation: global awareness and local guidance. Global awareness is mainly concerned with routes to a target location and understanding the spatial layout of points of interest and landmarks. A GPS navigation system that takes you from location A to B supports this global awareness level of navigation. Local guidance is concerned with understanding the spatial structure of the immediate environment, maneuvering along a route, and interacting with objects alongside it. A lane departure warning system typically supports this local guidance level of navigation. Both navigation subtasks require a different display design (Roscoe, 1968; Wickens, 1992; Wickens and Prevett, 1995; Van Erp, 2007). Global awareness requires a world-referenced or north-up display with a 360° field of regard while local guidance requires an ego-referenced or heading-up display, a forward cone of regard and a high information update rate. Failing to pick up local guidance information correctly and timely may have serious consequences for tasks, such as keeping course, circumventing obstacles, and avoiding collisions with stationary and moving objects.
Tactile Navigation Displays
Potential bottlenecks to perceive and process local guidance information are visual and cognitive overload (Van Erp and Werkhoven, 2006; Elliott et al., 2010). This led researchers and developers to explore display approaches, for instance based on the sense of touch (i.e., haptic and tactile displays) to reduce the risk of visual or auditory overload. Our sense of touch continuously processes local guidance information, and starting in the 1990s, vibrotactile displays (e.g., vests or belts containing actuators that produce a localized vibration) were developed for a range of local guidance tasks. At that time, the potential for visually impaired users was also acknowledged. For instance by Ertan et al. (1998) who developed a system consisting of a 4 × 4 tactor array on the back displaying the four cardinal directions and a stop signal for navigation.
Successful tests and implementations are reported for soldiers (Elliott et al., 2010), pilots (Eriksson et al., 2006), and drivers (Van Erp and Van Veen, 2004). Apart from reducing the risk of visual and auditory information overload, these vibration belts and vests have the inherent advantage of being ego-referenced since the trunk may be considered as “the physical anchor of the internal representation of body orientation in space” (Karnath et al., 1991, 1993) and is critical in bodily self-consciousness (Blanke et al., 2015; Serino et al., 2015). Belts and vests can also easily implement a forward cone of regard thereby meeting important requirements for local guidance displays (Van Erp, 2005a).
Tactile ETAs for Visually Impaired Users
Tactile displays have also been employed for ETAs for the visually impaired, but not always in the form of a belt. Many follow the approach of sensory substitution, in this case converting visual information (camera images) to a “tactile picture.” First explorations by Bach-Y-Rita date back to the late 1960s (Bach-y-Rita et al., 1969). Experiments show that users are indeed able to learn to recognize simple, isolated objects but that the principle is of limited use for (fast) local guidance tasks and cluttered environments (Johnson and Higgins, 2006). Next to sensory substitution, local information can be displayed in an abstract or symbolic manner. Tang and Beebe (2006) used an electrotactile display implemented as a mouthpiece to present directional cues of a navigation system to the roof of the mouth in the form of arrow patterns. Pielot et al. (2012) developed and tested a pocket-based, single-actuator tactile navigation application that mapped navigation information to vibration patterns. Information on use was gathered from anonymous and presumably sighted users. The pocket-based approach was adopted in one-third of the trips and the authors mention its positive effects on reducing distraction (i.e., the threat of visual and/or cognitive overload). Zelek (2005) describes a glove with vibrating elements to present objects and the ground plane distilled from stereo camera images. Vibration intensity was used to provide distance cues. Shah et al. (2006), Bouzit et al. (2004), Kim et al. (2015), and Amemiya and Sugiyama (2009) also used the hands as display location. These hand-mounted displays can successfully support blind users to safely walk along a predefined route at their usual walking pace but also have several inherent disadvantages: the hands are not ego-referenced and information presentation may also interfere with other tasks, including simply holding objects and using the white cane (Pawluk et al., 2015). Also, displays for the hands are difficult to hide while users prefer a discreet system (Conradie et al., 2014). The same argument holds for displays mounted on the head or neck like the haptic radar system that provides localized haptic cues based on multiple sensors that can detect obstacles developed by Cassinelli et al. (2007).
Velazquez and Bazan (2010) developed an on-shoe tactile display and suggest that it may be useful for visually impaired users to present navigation information (see also Meier et al. (2015) for a recent discussion on foot-based displays). Palleja et al. (2010) used a tactile belt coupled to a “simulated white cane”: a LIDAR and accelerometers mounted on the forearm. A similar approach was taken by Kim et al. (2014) but based on stereo cameras and users pointing their finger. Bousbia-Salah and colleagues (Bousbia-Salah and Fezari, 2007; Bousbia-Salah et al., 2011) developed a system that combines different sensors and tactile and synthetic speech output. The tactile display consisted of only two actuators to warn for over-hanging objects. Flores et al. (2015) made an explicit comparison between a tactile display in the form of a belt and an auditory display evaluated by 10 blind participants and conclude that the belt results in closer path following but lower walking speeds. The directional information provided by the belt was rated very positive. In addition to providing directional information, Cosgun et al. (2014) added rotational information. They reasoned that directional information sec may not be sufficient in cluttered environments requiring fine maneuvers. So far, they tested different ways of displaying rotational information, but their approach has not been evaluated in a real maneuver task. Related to the presentation of navigation information is the use of a haptic belt to convey non-verbal communication cues. McDaniel et al. (2008) developed such a system and showed that the direction and distance of a conversation partner can be presented on a tactile belt using vibration location and duration. More at the level of global awareness, Karcher et al. (2012) tested a belt that continuously displayed the direction of north and tested this with a single blind participant after extended training. They concluded that the belt improved performance in several orientation tasks and increased the mobility and feelings of security of the participant. Heuten et al. (2008) tested a tactile belt for wayfinding presenting waypoint directions and deviations from the path.
In addition to the systems using tactile display technology, many ETAs implemented an auditory representation either through speech or through non-speech sonification (see Dakopoulos and Bourbakis, 2010, for a survey). Examples include the NavBelt based on binaural feedback to indicate the direction of travel (Borenstein, 1990; Shoval et al., 1998), seeing with sound based on frequency and amplitude variations (Meijer, 1992), the NAVI system based on stereo acoustic patterns (Sainarayanan et al., 2007), and a system based on 3D specialized sounds to represent obstacle distance and direction (Aguerrevere et al., 2004).
Commercial ETAs for Visually Impaired Users
The above-mentioned studies show the diversity in display approach for ETAs for visually impaired users. However, the research systems have not reached a level of technical maturity beyond their use in a laboratory environment. There are several commercially available ETA systems that implement auditory and/or tactile display technology, be it with restricted functionality. Stand-alone ETAs (i.e., that do not depend on for instance tags, markings, or beacons in the environment) include the UltraCane, the iGlasses, the K-Sonar Cane, and the Miniguide. The UltraCane has two ultrasonic sensors and two vibrating buttons located on the handle of the white cane. The iGlasses Ultrasonic Mobility Aid focuses on detecting obstacles above waist height but cannot detect drop-offs, e.g., stairs and holes. The K-Sonar Cane uses ultrasound sensors and can be attached on a common white cane and displays obstacles through sounds. Finally, the Miniguide is a hand-held ultrasonic obstacle detector that vibrates when an obstacle is detected withinin its range. Generally, ultrasonic sensors are low cost but may fail to detect small obstacles and holes, steps, and curbs. This may potentially be solved by infrared sensors, but they have a restricted field of view.
Challenges for ETAs for Visually Impaired Users
Generally, ETAs for visually impaired users face four challenges: to display more than one obstacle at a time, to increase the range substantially beyond that of the white cane (i.e., to 5 m or more), to provide a wide field of regard, and to detect and present ground-based as well as hanging objects. Focusing on the display module of the ETA, most relevant research questions are:
1. how can multiple objects be displayed with minimal risk of perceptual and cognitive overload?
2. how can the display present multiple information features of an object such as direction, distance, height, and object identity (ID) with minimal risk of perceptual and cognitive overload?
3. how can auditory and tactile presentation be combined?
We will approach these research questions from a user perspective and taking into account important user requirements for ETAs. These user requirements are presented in-depth elsewhere (Miao et al., 2011; Conradie et al., 2014; Lewis et al., 2015). Based on these documents, the critical user requirements for an ETA’s display module are the following:
• users are reluctant to rely heavily on audio for information presentation,
• users prefer to use audio for vital information only,
• users are worried about the risk of tactile overload,
• users do not like a continuous tactile signal and indicate that a filter is needed,
• users expect an ETA to be able to provide the direction and distance of an obstacle and preferably its height (especially hanging objects since these are difficult to detect using the white cane). Displaying object ID is not an explicitly user requirement, but may become relevant now sensor systems become available that go beyond obstacle detection and enable object recognition.
Although the overview above indicates that several body parts, including hands, feet and torso, may be feasible as location for a tactile ETA display, we adapt a tactile belt approach. The main reasons are the proven effectiveness in navigation applications, and the trunk’s unique role in spatial awareness as “the physical anchor of the internal representation of body orientation in space” (Karnath et al., 1991). Belt-like displays have also been employed before but often as a proof of concept only without going through a systematic display design process, and without addressing the threat of information overload. We describe the iterative development and tests of an ETA display involving naive participants, display design experts, and visually impaired end users. Point of departure is that the ETA is used by a visually impaired user in combination with the white cane. We start with designing the compound tactile signals to present all four parameters of interest (object direction, distance, height, and ID). The design is tested in Experiment 1. The results of Experiment 1 show that the compound tactile signals used in Experiment 1 carry in them a high risk of information overload. We test two approaches to off-load the tactile channel: by presenting part of the compound signal through the auditory channel (Experiment 2) and to reduce the amount of information presented by designing a minimalistic tactile signal (Experiment 3). The result of the minimalistic design of Experiment 3 is evaluated in the final experiment (Experiment 4) with end users.
Design of the Compound Tactile Coding
Information Chunks to Be Displayed and Display Parameters
Based on user requirements, best practices, and local navigation requirements, we set the boundary conditions for the design, operationalized as follows:
• refresh rate of the information display: 1 Hz or better
• direction: three levels (left, middle, right to cover the forward cone of regard)
• distance: four levels
• secondary parameter object height: three levels (e.g., below ground, ground-based, hanging)
• secondary parameter object ID: four levels (users were primarily interested in stairs, doors, unknown object, and sensor noise).
Tactile Display Parameters Available in Vibrator Motor Based Displays Worn on the Torso and Their Usefulness
Over the past decade, guidelines have become available, among others in ETSI (2002) guidelines and ISO (2009) norms (Van Erp and Kern, 2008; Sinclair et al., 2012). Below is a concise summary.
• Vibration intensity and frequency. These are generally of limited use because both are affected by actuator differences, attachment method, etc. ISO (2009) recommends that the number of levels should be limited to three.
• Actuator location. Useful parameter; the spatial acuity of the torso is high enough to distinguish at least 12 different locations horizontally (i.e. columns like clock hours) and at least 5 locations vertically (i.e., rings around the torso).
• Temporal pattern or on–off rhythm (resembling Morse-code like patterns). Very useful parameter because of the high temporal acuity of the tactile sense. According to ETSI (2002) and ISO (2009) guidelines, temporal parameters have a clear relation to for instance perceived urgency (Van Erp et al., 2015).
• Higher order spatial/temporal/intensity patterns. Potentially useful are, for instance, spatio-temporal patterns to elicit apparent motion and intensity-temporal patterns to create sweeps of increasing or decreasing intensity.
Mapping Information to Display Parameters
Point of departure is to map the primary ETA information (direction and distance) to the display parameters that are recommended as best perceived (actuator location and temporal pattern) and map the secondary ETA information (height and object ID) to the remaining display parameters. To allow multiple levels in both horizontal and vertical location, we use a 3 × 3 tactor display worn on the frontal side of the torso and with a 5-cm center-to-center distance between the tactors (Figure 1).
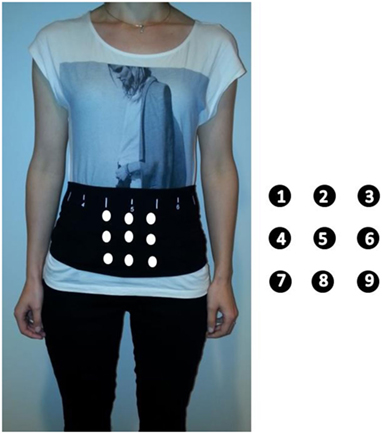
Figure 1. Placement of the tactile belt. White dots indicate the location of the tactors. The top row (1, 2, 3) represent hanging obstacles, the middle row (4, 5, 6) grounded obstacles, and the bottom row (7, 8, 9) gaps. The left column (1, 4, 7) represent obstacle to the right, the middle column (2, 5, 8) obstacle in front, and the right column (3, 6, 9) obstacles to the left.
The direction of the object is indicated by the horizontal position of the activated tactor (Figure 2). The height of the object is mapped to the different rows of the display, indicating a gap (bottom ring), ground-based object (middle ring), or hanging object (top ring).
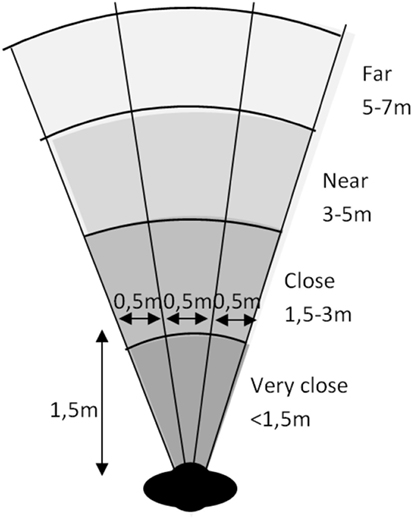
Figure 2. The cone of regard of a possible electronic travel aid and with different object direction and distance categories.
Object ID is coded in the signal pattern resembling Morse-code, i.e., combinations of three short (100 ms) and/or long (300 ms) pulses. This study distinguishes 4 object ID’s which are selected by our focus group consisting of visually impaired users: stairs, doors, unknown object, and sensor noise. Of course, object ID can be given any meaning a system or users prefers (see Figure 3).
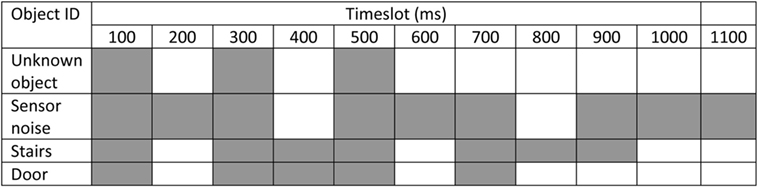
Figure 3. Design of the pattern for object identity.
Object distance is coded in the rate of repetition. Each object ID pattern is always repeated three times. The interval in between the repetitions depends on the distance, comparable to the auditory beeps of a parking assist. Four distance levels were implemented with intervals of 400 ms (“far”), 300 ms (“near”), 200 ms (“close”), and 100 ms (“very close”). See Figure 2 for a possible representation.
Experiment 1: Perceiving Tactile Compound Signals While Walking
In this experiment, we test the compound tactile signals that present all four parameters of interest (object direction, distance, height, and ID).
Methods
Participants
A total of 18 non-visually impaired volunteers participated (7 males, mean age 43.7 years SD 13.0). The following inclusion and exclusion criteria applied: age between 20 and 60 years old; no physical restrains with regard to walking; no difficulties with keeping balance; no known auditory or tactile deficits. All volunteers were also invited to participate in Experiment 2 to be run on the same day. Before engaging in the experiment, participants read and signed an informed consent. The experiment was approved by the Institutional Review Board (TNO TCPE, Soesterberg). Participants received a monetary reward according to the IRB norms, and their travel costs were reimbursed.
Apparatus
The evaluation was conducted in a room with a 5 m × 5 m free floor space, lined with a guiding strip. This strip could be detected with a white cane such that participants could walk in circles. Participants’ vision was completely blocked by goggles that were easy to put on and to take off to ensure safety and comfort during the evaluation. Participants had a standard white cane (also known as a “Hoover” cane, as used by visually impaired people) to detect the guiding strip on the floor.
The tactile patterns were presented on a 3 × 3 tactile display (Elitac Science Suit®, Amsterdam, The Netherlands). The display consists of a strip of flexible and stretchy material that can be adjusted to fit each body and applies equal pressure to all tactors that are mounted on the inside. The tactors are circular shaped pancake motors with a diameter of 10 mm, housed in a casing of 39 mm × 13 mm × 6 mm. Vibration frequency was 128 Hz. The tactors were wired to a control unit of 80 mm × 50 mm × 21 mm that was mounted on the outside of the strip on the back of the participant. The control unit was connected via Bluetooth to the control laptop operated by the test leader. The tactors were ordered in a 3 × 3 grid with 5 cm distance center-to-center. Participants wore the belt over their first layer of clothes resulting in a vibration intensity that was easy to feel. The center tactor of the 3 × 3 grid was located just above the belly button.
Tactile Patterns
The design of the tactile pattern is described in the previous section. All possible combinations of object direction (3 levels), object height (3 levels), and object distance (4 levels) were tested (i.e., 36 cases). Object ID (4 levels) was randomly varied over these 36 cases to restrict the total number of cases because pilot studies showed that the duration using a full factorial design (with 144 cases) would be too long for participants to stay alert and concentrated. The order of the 36 cases was randomized for each participant.
Procedure
Participants first read a written instruction about the goal of the evaluation, the working of the tactile belt and the test procedures. Next, the test leader showed the participant all materials used in the evaluation and their functioning, and answered any remaining questions of the participant. Before donning the tactile display, a brief equilibrium test was conducted: the participant was asked to position his or her feet next to each other with a shoulder wide gap in between and stand still with closed eyes for 1 min.
Training of the Tactile Signals Separately
Under supervision of the test leader the participant was asked to put on the tactile belt over his/her first layer of clothes. The center tactor (tactor 5) was always placed right above the participant’s belly button, to ensure a similar tactor position between participants.
Next, the training for identifying object direction, height, distance, and ID was conducted. The levels of a signal dimension (for instance tactor location) were presented in logic order, than twice randomly, while the other signal variables (in this example signal interval and signal pattern) remained constant. The participant was asked to give a response after each signal by telling which object information he/she could identify, after which the test leader gave feedback. During this training, the participant stood still, without the vision blocking goggles and the white cane. The test leader also ensured with this test whether the participant was able to feel all tactors and whether the system was comfortable to the participant. In case the participant yield low correct response rates after training one signal dimension or if a participant was still unsure about his/her performance, the test leader could repeat the training once more. If the participant could not distinguish object information correctly in at least 75% of all cases after the training or could not feel a particular tactor at all, the participant would be asked to stop with the test at this point in time. However, this did not occur during the experiment.
Testing and Experiencing the Vision Blocking Goggles and the White Cane
The test leader asked the participant to walk around by using the white cane to detect the guiding strip on the floor; first without vision blocking goggles, then with. Only when the participant was comfortable walking around blinded the test leader proceeded with the last training step.
Training Tactile Signals Combined
During the last training all signals were presented in random order to the participants, such that the participant could train in recognizing object direction, distance, and ID at the same time, though, for the purpose of the training, still with feedback and without walking around blinded. Participants were presented with two randomly ordered sets of 18 signals.
Experiment
Participants walked around blinded with a white cane, while they were given all 36 compound signals. After 18 signals, a 5-min brake was given. The signals were started by the test leader one by one. Only after the participant indicated what he/she felt, by calling out loud object direction, height, distance, and ID (in any chosen order), the next signal was started by the test leader. There was a minimal interval of 5 s between signals. There was no time limit for the participant to respond. Each answer was registered by the test leader on the computer. If a participant could not identify an object feature “no response” was entered for that specific feature. The test leader also noted general observations of the participant’s behavior and remarks and comments made by the participant.
Results
One participant could not feel tactor 7 (object direction: right, object height: gap) during the test; these four cases [four object distances randomly combined with four object IDs: object (2×), noise (1×), stairs (1×)] where removed from the data set. We will present the results along the features of the compound signals: object direction and height (coded by tactor location), object distance, and object ID.
Tactor Identification (Coding Object Direction and Height)
Table 1 shows the confusion matrix for the individual tactors. The left column indicates the stimulus presented to the participants (tactor 1–9, see also Figure 1), the other columns the participants’ response (tactor 1–9, or “no response” in case the participant did not give an answer). Please note that this is the confusion matrix for the nine tactors, i.e., the combination of the information features object direction and object height.
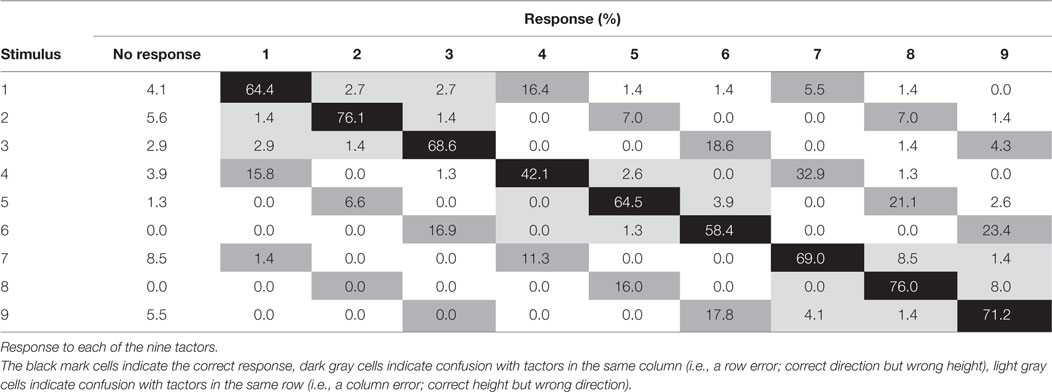
Table 1. Confusion matrix for tactor location (object direction and object height).
It can be seen that the percentages correct responses were between 42.1 and 76.1%, ample above chance performance (11%). An inter-rater reliability analysis using the Kappa statistic was performed to determine consistency among raters. Cohen’s Kappa shows a moderate to substantial consensus with a value of 0.61 (p = 0.00). In addition, the table shows which confusions were common. Participants mainly confused the tactors with those that are above or below the presented stimulus (marked dark gray in the table) but hardly with tactors to the left or the right (marked light gray). This means that the confusion was primarily between rows and not columns, or in other words: it seems more difficult to participants to determine the height of a tactor than the horizontal direction when the tactors are located at 5 cm distances on the belly. Furthermore, tactors in the middle column (tactor 2, 5, and 8) yielded better response rates than tactors in the outer columns. This effect is reversed for the rows: tactors in the outer rows (tactor 1–2–3, 7–8–9) yielded better response rates than tactors in the middle row (tactor 4–5–6). This may be due to the fact that the middle row simply had more neighboring tactors than the top and bottom rows (end of scale effect).
Object Distance Identification
Table 2 shows the confusion matrix for object distance. The results indicate that determining distance was difficult for the participants. The percentages correct responses were between 12.8 and 47.0% with chance performance at 25%. Cohen’s Kappa was 0.13 (p = 0.00), indicating only a slight agreement between the given stimulus and participants’ response.
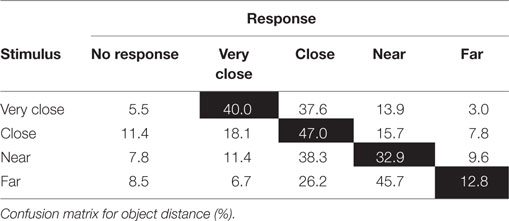
Table 2. Confusion matrix for object distance (coded through duration between signal repetitions).
It can be seen that the confusion between distance categories became less when the mutual differences in signal frequency became greater, i.e., “very close” got more confused with “close” (difference of 100 ms brakes between signals) than with “near” or “far” (difference of, respectively, 200 and 300 ms brakes between signals). The table shows that particularly the distance level “far” yielded bad response rates: in less than 13% of the cases participants correctly identified the “far” level. The results indicate that four distance categories with the current coding is too much. Based on the data and the observations, the use of two categories seems a better choice.
Object ID Identification
Table 3 shows the confusion matrix for object ID. It shows that the percentages correct responses were between 51.4 and 72.2% (with change level at 25%). Cohen’s Kappa provides insight in the consistency among raters and turned out to be 0.51 (p = 0.00), indicating a moderate agreement. IDs “Object,” “Noise,” and “door” which were all either homogenous signals or symmetric ones were understood best by participants.
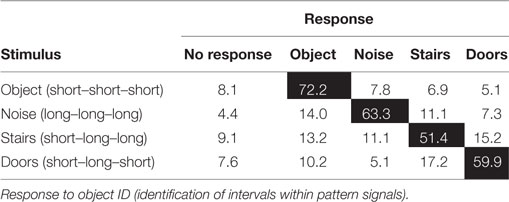
Table 3. Confusion matrix for object identity (ID) (signal pattern).
Observations by Test Leader
During the experiment, the test leader took notes of the participant behavior and remarks and registered additional instructions that had to be given. Most participants stopped walking before they could indicate the object features they felt. It seemed that identifying all four object features took a lot of mental processing.
Discussion
The scores for the tactor identification (65.6%) are ample above chance (11.1%). Since the rows and columns code different features of the object (direction and height, respectively), it is useful to look at the errors made along these two dimensions separately. This closer inspection shows that the majority of the incorrect replies are “within column” errors, i.e., errors with the correct direction but the wrong height. On average, object direction was correct for 90.3% of the responses and object height for 70.5% of the responses (for both, change level is 33.3%). The fact that tactors in the middle column (tactor 2–5–8) yield better response rates than tactors in the outer columns (tactor 1–4–7, 3–6–9), may suggest that one is more sensitive to vibrations given at the middle of the belly. This is in line with findings on spatial resolution (which is higher on the midsagittal plane than a few centimeters away from it, Van Erp, 2005b) and on direction perception which is substantially better for vibrations on the body midline because the body midline is an important anchor point in direction perception and spatial cognition (Van Erp, 2005a). There is no such anchor point on the torso for the vertical localization.
The average score for distance is low (33.2%) and only just above chance (25%). There appears to be a large bias in the responses because a number of participants did not make the distinction between “near” and “far,” as a result of which “near” was excessively mentioned and “far” was underrepresented in the data set. The fact that participants identified “far” poorly may be related to an interaction effect between distance coding (signal interval or speed of repetition) and object ID coding (signal pattern). The signal for “object” (3 ms × 100 ms) was often experienced as (very) “close,” even when given with long brakes in between the signals, i.e., it was experienced as a fast signal, even with a low speed of repetition. With the longer brakes, the whole duration of the three signals was still short in comparison to signals with a longer burst duration and shorter intervals. With the current test setup it was not possible to test for interaction effects to prove the existence of this relationship. The data leads to the recommendation that distinguishing two distance categories is feasible, but more signals may lead to categorizing the signals into two groups when presented as a compound message in combination with coding object ID by signal pattern.
The scores for object ID are all above chance (mean 61.7% correct, chance 25%). Inspection of the data does not reveal specific biases or confusions: the errors made seem to be relatively evenly distributed along the response categories. Albeit the average score of only about 60% correct, the scores are much higher than those for distance indicating that for the current compound message, the coding parameter temporal pattern is preferred over speed of repetition.
Cohen’s Kappa for object direction (tactor position) and object ID (signal pattern) yield moderate to substantial agreements indicating generalizability of the results over participants. The percentages correct indicate that there may still be room for improvement. It seems that the complex task of identifying all four types of information (object direction, height, distance, and ID) based on one compound signal and while walking blinded and using a white cane severely taxes the perceptual and cognitive resources and may carry the potential threat of information overload.
Conclusion
The objective of Experiment 1 was to investigate whether a compound signal presenting the core ETA information was usable, and if not what the boundary conditions are. Based on the performance and the observations made by the experimenter, we may conclude that the current compound signals may lead to substantial perceptual and/or cognitive processing demands. Users may have to slow down or even stop walking while processing the information and performance for specific dimensions may be too low to be usable. The results also confirm that performance may differ along coding dimensions: horizontal tactor location leads to best performance, while vertical location scores are substantially lower. With respect to temporal coding, the data show that on–off pattern is a solid coding principle but speed of repetition is not and the combination of both may introduce confusion. Slowing down the pattern and rate of presentation may increase identification performance but is not an option in the time-critical task of walking and avoiding obstacles. With an average walking speed of 1–1.5 m/s, an information refresh rate below one per second increases the risk that users cover the distance to an obstacle before it is presented. For example, a refresh rate of one per 2 s means that the user covers 2–3 m in between obstacle presentations.
A first solution to reduce the risk of overload is to off-load the tactile modality by presenting one or two of the four object features through the auditory modality. However, as visually impaired users already rely heavily on audition for communication and to pick up environmental cues, using the auditory channel to present ETA information may result in a new threat of (auditory) overload. The auditory signals should at the least not interfere with the main use of audition or the user should be able to switch the auditory presentation off without losing critical ETA information. The effect of coding distance and/or object ID through auditory signals is investigated in Experiment 2.
A second solution is to use the tactile channel only, but reduce the amount of displayed information, for instance by filtering out less relevant objects or by reducing the number of object features presented from the current four to two or three in a minimalistic tactile compound signal. Further optimization of this filter and the tactile compound signal is described in Experiment 3 (reporting the iterative design process with experts) and evaluated in Experiment 4 with visually impaired participants.
Experiment 2: Off-Loading the Tactile Channel Using Multimodal Presentation
The results of Experiment 1 show that the compound tactile signals carry in them a high risk of perceptual overload. In Experiment 2, we test the effect of off-loading the tactile channel by presenting part of the compound signal through the auditory modality.
Methods
Participants
Of the 18 participants of Experiment 1, 16 also participated in Experiment 2 (7 males, mean age 42.1, SD 13.0) that was run on the same day.
Apparatus
The apparatus was the same as used in Experiment 1 with the addition of a set of loudspeakers to present auditory information.
Tactile and Auditory Signals
The tactile signals are the same as those used in Experiment 1: tactor location for horizontal direction (left, front, right columns) and height (bottom, middle, and upper ring), tactile pattern (four on–off rhythms) for object ID and speed of repetition (four pause lengths between pattern repetitions) for distance. Object distance and object ID were presented either through a tactile signal or through an auditory signal. Auditory signals for object distance and object ID were designed by TU Dresden and successfully applied in previous studies (Spindler et al., 2012; Prescher et al., 2013). The signals are presented by speakers that were positioned on a table close to the walking area. Auditory Distance was coded by volume. That is, a loud sound indicated close by and a softer sound indicates far away. Please note that when distance was indicated via tactile signals there were four distance categories, while there were only two when distance was indicated via auditory signals. The reason to maintain the four tactile levels the same as in Experiment 1 was that the participants were trained on these. To make it possible to compare the four conditions, the four tactile distance indications were fused into two distance categories before analysis. Auditory Object ID was coded in symbolic sounds: a door was represented by a piano sound, stairs with a gogo sound, an object with guitar sound and noise with a very low guitar tone. Auditory object distance and object ID were coded by using the sounds described above with different volumes.
Experimental Conditions and Design
Three conditions were run in fixed order. The object’s horizontal direction and height were exclusively displayed through the tactile display in all conditions (as in Experiment 1), object distance and object ID could be presented on the tactile or on the auditory display. In the first condition, object distance was presented auditorily (denoted as Adist|TID); in the second, object ID was presented auditorily (Tdist|AID); and in the third, object distance and object ID were both presented auditorily (Adist|AID). Please note that in Experiment 1 object distance and object ID were both presented tactily (Tdist|TID). In each condition, nine signals were given: one for each tactor location and with a subset of the 16 possible combinations of distance and ID. Combinations of nine tactor locations and the 16 distance/ID combinations were balanced over participants. In addition to measuring task performance (percentage correct), subjective ratings were taken. See the results section for details.
Procedures
The procedures were similar to those of Experiment 1. Prior to the experiment, participants were trained in interpreting the signals by presenting them while standing still, without using the white cane and with eyes open. The stimulus dimensions were trained separately.
Results and Discussion
As in Experiment 1, we will present the results per information feature. Because participants, stimuli, and procedures are similar to those of Experiment 1, we include Experiment 1 results in our comparisons. For the percentage correct scores, we look at differences between the conditions and whether the results are below or above the average performance over conditions. Because the dependent variables were not normally distributed, Friedman analysis of variance was conducted, with Wilcoxon signed ranks follow-up tests. A Bonferroni correction was applied to account for chance capitalization, so all effects are reported with α set at 0.0125.
The percentage correct for each information feature per condition are shown in Figures 3–5, including the results of Experiment 1.
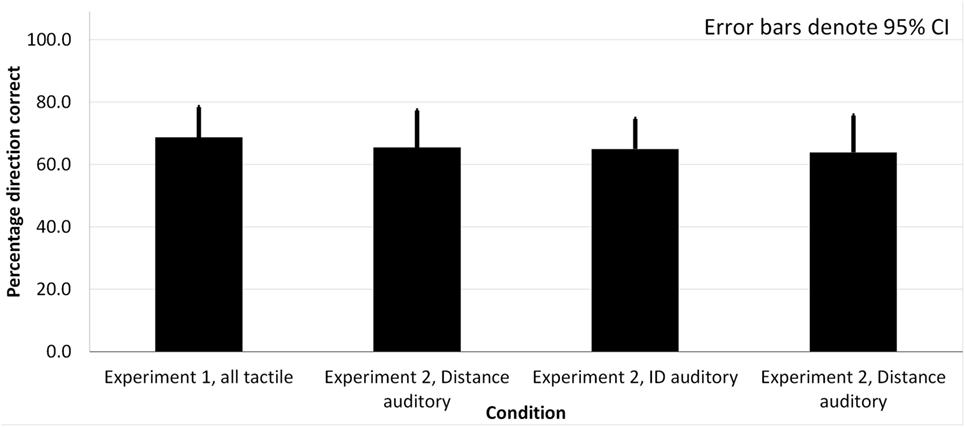
Figure 4. The percentage of trials in which the feature direction was correctly identified as function of condition.
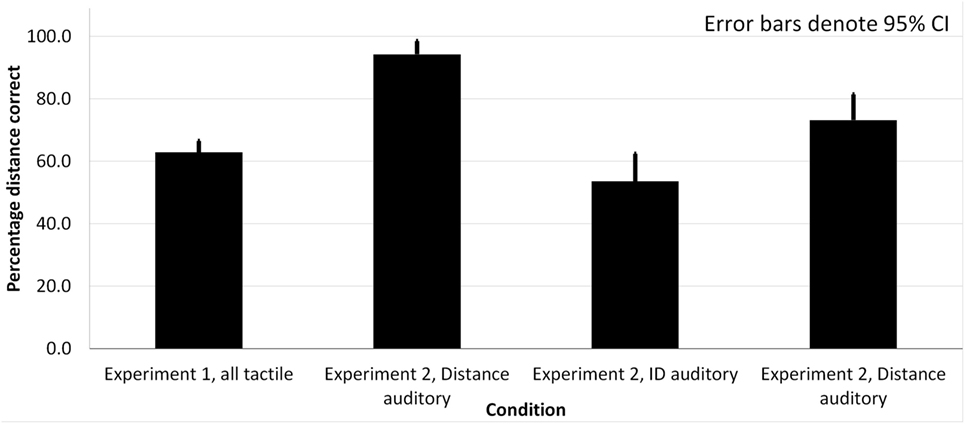
Figure 5. The percentage of trials in which the feature distance was correctly identified as function of condition.
Object Direction and Height (i.e., Tactor Identification)
As can be seen in Figure 4, the percentage of correctly understood directions did not differ significantly between the conditions, χ2(3) = 2.22, p = 0.529.
Object Distance
A Friedman ANOVA indicated that the percentage of correctly decoded distance indications differed significantly between the four conditions, χ2(3) = 35.98, p = 0.000, see also Figure 5. To follow up this finding, the average percentage of correctly identified distance indications for all conditions was contrasted with the average percentage correct of all conditions. It appeared that Adist|TID yielded significantly better performance outcomes than average, z = −3.62, p = 0.000, Tdist|AID and Tdist|TID rendered significantly worse performance than average, z = −3.21, p = 0.001 and z = −3.42, p = 0.001, respectively. There was no significant difference between Adist|AID and the average performance of all conditions, z = −1.47, p = 0.143.
Object ID
The percentage of correctly identified object IDs differed significantly as well, χ2(3) = 26.26, p = 0.000, see Figure 6. Wilcoxon signed rank tests revealed that performance in Tdist|TID and Adist|TID were significantly lower than the average, z = −2.90, p = 0.004 and z = −2.82, p = 0.005, respectively, while it was significantly higher for Tdist|AID and Adist|AID: z = −2.73, p = 0.006, z = −3.01, p = 0.002, respectively. This shows that off-loading the tactile channel by presenting object ID through audition increases performance and that this increase remains present if audition is used to present both object ID and distance. Combined with the previous results when distance and object ID were both coded auditorily, it seems that employing the auditory channel with two object features (distance and ID) compared to one feature primarily increases performance on object ID coded through semantic sound but not object distance coded through volume.
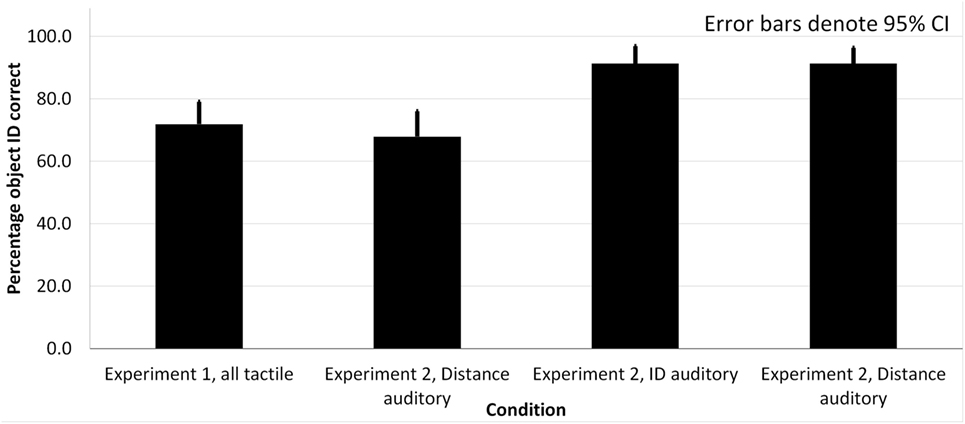
Figure 6. The percentage of trials in which the feature object ID was correctly identified as function of condition.
Subjective Ratings
Participants were first asked to rate general aspects of the tactile information on a 5-point Likert scale (see Table 4) and then to compare the coding of the four object features and their perceived own performance in the different display conditions.
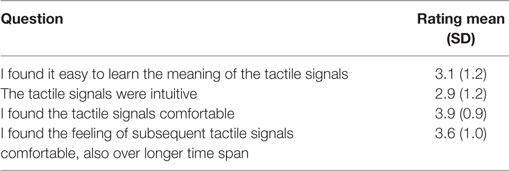
Table 4. General evaluation of the tactile display on a 5-point Likert scale.
As the table shows, the learnability and intuitiveness of the compound tactile signals are rated as “neutral” and the comfort is rated above neutral, also over longer usage. The results of the ratings of the different object features provide more details. Ratings of comprehensibility of direction did not differ across the four conditions: F(3, 45) = 1.33, p = 0.28, means 3.1–3.3. Please note that, in all conditions, direction was always displayed using the tactile modality. There is no effect of off-loading the tactile channel, which indicates that comprehensibility of direction is not affected when the tactile channel is heavily taxed.
Comprehensibility of distance did differ across conditions: F(3, 45) = 16.96, p = 0.000. Contrasting the ratings of each condition to the average scores showed that Experiment 1 (M = 1.9, SD = 0,74) and condition 2 (i.e., tactile coding of distance; M = 2.1, SD = 0,83) were rated significantly lower than the average, t(15) = −5.06, p = 0.000, and t(15) = −3.27, p = 0.005, respectively. Condition 1 (only distance coded through audition; M = 3.5; SD = 1.6) was not rated significantly different than average, t(14) = 1.87, p = 0.082, while the distance indication used in condition 3 (combined distance and ID coded through audition; 3.6, SD = 0.7) was rated significantly better than average, t(15) = 3.51, p = 0.003. This indicates that an auditory coding through volume (condition 1) without semantic sounds (as in condition 3) has a limited effect on perceived comprehensibility.
Comprehensibility of object ID also differed significantly between conditions: F(2.354, 45) = 23.85, p = 0.000. Follow-up contrasts revealed that only with distance coded auditorily, comprehensibility was rated significantly different, in fact below the average rating t(14) = −3.49, p = 0.004. There is no clear relation of this result with the coding modality of object ID: with auditory coding, comprehensibility is rated on average (M = 3.9, SD = 1.1 and M = 3.9, SD = 0.9), with tactile coding [experiment 1 (M = 2.5, SD = 1.9)] and with only distance coded auditorily, (M = 2.3, SD = 1.0), comprehensibility is rated on and below average.
Perceived performance was rated on both speed and accuracy. Appraisal of performance speed differed across conditions,F(2.43, 45) = 4.57, p = 0.013. However, follow-up contrasts revealed that none of the conditions were rated differently from the average rating (means differ between 2.9 and 3.7). Finally, appraisal of performance accuracy differed significantly between the conditions: F(2.95, 45) = 8.077 p = 0.000. Contrasts with the average rating indicated that with both object ID and distance presented auditorily, ratings were significantly higher (M = 3.1, SD = 0.8) than the average: t(15) = 3.35, p = 0.004. All other ratings did not differ from the overall average, showing that off-loading by both presenting both object distance and object ID auditory increases one’s appraisal of own performance (mean rating range between 1.9 and 2.4).
Discussion
The aim of Experiment 2 was to investigate whether off-loading information of the compound tactile signal to the auditory channel improves performance and/or subjective ratings. Below, we first discuss the results per information feature, and then interpret our results in relation to theories on multiple resources.
Object Direction and Height
Object direction and height are coded through tactor locations in all conditions. Off-loading other features to the auditory channel has no effect on performance which indicates that localizing vibration is relatively independent of coding additional information in the vibration pattern. As described by Van Erp (2007), vibration location and (horizontal) direction may be considered a tactile invariant.
Object Distance
The results indicate that performance that is just above chance when using tactile distance coding (58% correct) can be improved by using the auditory channel to exclusively present distance information (94% correct) but that this performance improvement is reduced as soon as the auditory channel is also used to present object ID (74% correct). In other words, off-loading the tactile channel improves performance, but the threat of auditory overload may in turn reduce the favorable effect.
However, it has to be noted that fusing the four tactile distance categories into two categories post hoc is not the same as if there had been only two categories coded in the signal. That is, in the conditions that indicated distance via tactile signals, participants at first had to learn more information categories. This decreases the chance that participants decoded the distance categories correctly. Furthermore, having only two signals to indicate the distance makes the signals more distinguishable from each other in comparison to having four. This is also apparent when looking at the confusion matrix for of Experiment 1 (Table 2). Similar difficulties with distinguishing multiple distance categories in tactile patterns were encountered in a study by Dakopoulos and Bourbakis (2010) using three categories coded by vibration frequency. They found that participants responded accurately for their categories 1 and 3, while the performance was low for their distance level 2. They attributed this result to the fact that the frequencies of level 1 and 2 and 2 and 3 were very similar, while the difference between distance 1 and 3 was greater. This is in line with the results from the current study and is supported by the fact that most participants ended up reporting only “far away” and “close-by.”
The subjective ratings partly mirrored performance. When audition was used to code for distance only (i.e., coded by the volume of a beep sound), ratings were not significantly different from average. However, when audition was used to code both object distance and ID (coded through the volume of instrumental sounds), the ratings were significantly above average.
Object ID
The results of object ID confirm the findings that off-loading the tactile channel by using audition improves performance. When object ID was indicated with tactile signals, participant’s performance was 53% correct and this improved to above 85% correct when object ID was indicated by auditory signals. Off-loading here results in both reducing the amount of information presented through the tactile sense and in reducing the risk of confusion due to the compound coding of distance and ID both using a temporal base. The subjective ratings show little results and do not indicate that off-loading object ID results in a higher perceived comprehensibility.
Multiple Resource Theories
Several theories based on multiple, independent sensory resources like Prenav (Van Erp and Werkhoven, 2006) and the Multiple Resource Theory (MRT: Wickens, 2002; Prewett et al., 2012) have proven their relevance for the current application domain and help to interpret the experimental results. The bottom line of these theories is that competition for the same resource can produce interference and that in high load situations the threat of overload can be reduced by presenting information through different sensory channels.
The results of Experiment 2 show that off-loading the tactile channel improves performance for object distance and ID from about 60% correct for tactile presentation to about 80% correct when both are presented auditorily and about 90% correct when only one of them is presented auditorily. In general, MRT would predict this outcome in situations where the bottleneck is the sensory information channel. Our results indicate that off-loading distance and/or object ID information from the tactile channel to the auditory channel results in improvement of performance and increased subjective ratings. However, MRT would also predict performance improvement for the remaining tactile information (in our case, tactor location coding for object direction and height), but this is not the case: tactor identification is independent of the condition. There is no clear explanation for this lack of predicted improvement. It could be a ceiling effect: although the overall performance of 65% correct seems to show room for improvement, one should keep in mind that correct here means that both horizontal direction and object height are correct. Results of Experiment 1 showed that after separating the scores, percentage correct for horizontal direction is above 90% and that for vertical direction above 70%. Compared to the condition in which the tactile modality is tasked with tactor localization only, performance does not drop when additional information coded through temporal pattern and speed of repetition has to be processed. Apparently, this processing demand does not interfere with the localization task, confirming the statement that tactile location is a perceptual invariant (Van Erp, 2007) and an intuitive signal requiring low or even no processing.
Experiment 3: Iterative Design of Minimalistic Tactile Coding to Off-Load the Tactile Channel
A second alternative to off-load the tactile channel is to reduce the amount of information presented in the tactile compound signal. In Experiment 1, the compound tactile signal contained four information features, each with multiple levels. In this experiment, we follow an iterative design process using three experts (two sighted coauthors with extensive experience in tactile torso displays and tactile information processing, and one visually impaired ETA expert). Specific software allowed to adjust the tactile patterns from trial to trial. The general procedure during the evaluation was as follows: the signals were played several times on the tactile display worn by the expert observer while standing still. The expert described the patterns as accurately as possible and any specific observations on strong and weak aspects of the particular pattern. On request of the expert, feedback on the correct pattern was provided which could lead to additional comments. Patterns were repeated several times, and several alternative patterns complying to the same design were presented whenever possible. Finally, the patterns were played while the expert walked in a hallway. The sighted experts did this with eyes open and with eyes closed.
We start with a basic design and expand this step-by-step. The resulting design is evaluated with six naïve participants and consecutively validated with visually impaired users in Experiment 4. We used the following starting points for the minimalistic design as discussed earlier:
• the primary information dimensions for obstacle avoidance are (horizontal) direction and distance. Update rate of the information presentation should be 1 Hz or higher, i.e., presentation time of a single obstacle scene must be 1,000 ms or below.
• horizontal direction requires at least three levels: front (eminent threat of collision) and to the left and to the right of the walking path (no eminent threat when walking straight). We implemented this by locating tactors around the torso at 9, 12, and 3’o clock.
• Distance requires at least two levels, e.g., near (in reach of the cane within 1 s, i.e., before the next update) and far, but a finer granularity may be useful. Preferred coding parameters are temporal pattern and vertical location.
Iteration 1: Sequential versus Parallel Presentation
The information presentation should be completed within 1,000 ms. Even if we restrict the information to a maximum of one object for each of the three directions, e.g., only the closest object (filter rule 1), this means that three vibration patterns should be presented in 1,000 ms or less. A parallel presentation may have advantages when presentation time is restricted but may also lead to undesirable spatio-temporal interactions (Van Erp, 2002). Therefore, we designed several temporal patterns: fully sequential, fully parallel, and a combination of serial and parallel presentation, see Figure 7.
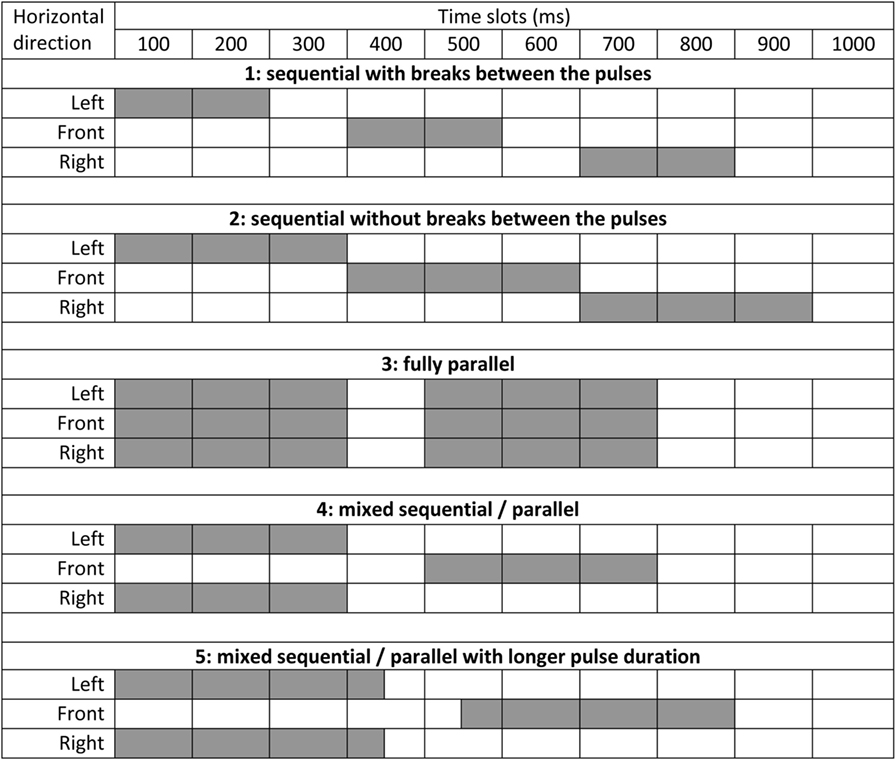
Figure 7. Temporal patterns (numbered 1 through 5) tested in the first iteration. Time (in 100 ms slots) is depicted horizontally for the left, front, and right direction (i.e., left, front, and right tactor). A filled slot means tactor on, a blank slot means tactor off.
Expert Observations
• Variants 1 and 2 allowed easy identification of the individual tactors. Variant 2 was preferred over Variant 1 because there are more options to implement different patterns in a 300 ms timeslot than in a 200 ms timeslot.
• Variant 3 (fully parallel) resulted in near complete spatial integration: the three tactors were integrated into a single object over the frontal side of the torso making it difficult to separate the individual tactors. Variant 3 was, therefore, discarded.
• Variants 4 and 5 resulted in distinguishable left and right signals despite their parallel presentation. Both variants resulted in a percept of apparent motion from the sides to the front which is not necessary a disadvantage. Variant 4 had a slight preference over 5 because of the larger pause at the end of the presentation before the start of the next sequence. This larger pause breaks the spatio-temporal integration with the next signal.
Based on these expert observations, we concluded that variant 2 (preferred) and 4 are viable options.
Iteration 2: Temporal Pattern
Next step is to introduce different temporal patterns. Both preferred presentations were based on 300 ms slots. We tested the following four patterns: base (300 ms on), short (100 ms on—200 ms off), long (150 ms on—150 ms off), double (100 ms on—100 ms off—100 ms on). Figure 8 depicts examples of the comparisons we made, based on variant 2 of iteration 1 (not exhaustive). For the evaluation, the order of the patterns was also reversed (e.g., base–short and short–base), and different combinations of tactors were used. These are not depicted in Figure 8.
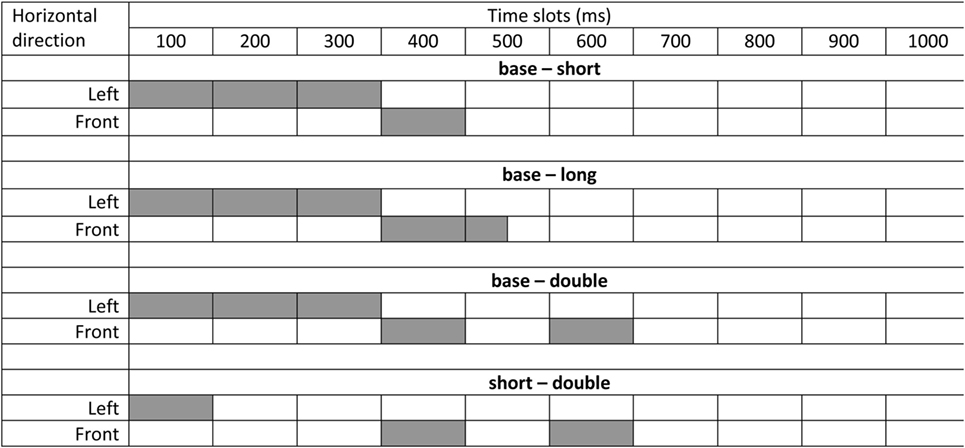
Figure 8. Examples of the comparisons we made, based on variant 2 of iteration 1 (not exhaustive).
Observations for pairwise presentations:
• base and short were discernable, though a 100-ms pulse is short and resulted in a reduced vibration intensity (depending on the specific tactile hardware specifications).
• base and long were discernable and the long pattern may solve reduced intensity effects possible for short pulses in combination with specific hardware.
• base and double may result in a “cutaneous rabbit” like percept (Geldard and Sherrick, 1972). This results in an altered spatial percept in which pulses are mislocated toward the location of later pulses. However, the mislocation was limited and may be acceptable (locations at 9, 12, and 3’o clock allow for a large mislocation without leading to confusion).
• Short and double may suffer from both reduced intensity and potential mislocation.
Based on these observation, base and long (or short) are the preferred temporal patterns in case two coding levels suffice and base, long (or short), and double for three levels.
Next, we also tried the temporal patterns with variant 4 from iteration 1. We tested base-long in combination with sequence 4. As described under iteration 1 above, sequence 4 led to a percept (Gestalt) of apparent motion for the base pattern. The same Gestalt occurred when using the long pattern. This Gestalt was hardly affected by the difference in temporal pattern and hindered the identification of the individual temporal duration of the tactors. Based on this observation, we discarded variant 4 as yet.
Finally, we tried the base-long and the base-double in a continuous stream instead of in a single 1-s sequence. We used two 1-s sequences in a row (i.e., six chunks of information). The rapid sequential presentation of six items with multiple levels (i.e., location and temporal pattern) turned out to be very difficult, indicating that we were nearing the limits of tactile processing capabilities. Horizontal location remains easy to perceive (also because of the fixed and predictable order of presentation—L, M, R, L, M, R), but temporal pattern became very difficult to comprehend. Although the difference between base and long was easily detectable in a single (1 s) stream, this became harder for continuous presentation. Base-double was easier to decode, but the rapid serial presentation of sequences still required substantial cognitive processing. The experts indicated that processing time is required after the presentation of a single sequence and that the 100 ms pause at the end of a single sequence was not sufficient. This resulted in additional information filters as described in iteration 4. But first we investigate vertical location.
Iteration 3: Vertical Location
After horizontal location and temporal pattern, vertical location is the third preferred coding parameter. We tested vertical location as coding parameter by introducing two rings of three tactors each with a 15-cm separation between the rings (please note that in Figure 1, the center-to-center distance is of the tactors is 5 cm) and the sequence and patterns as described in the previous iteration, but with each pattern randomly presented on the upper or the lower ring. The observations confirmed those of the previous iteration: horizontal location was clear, but temporal pattern was very difficult. Vertical location could at best be described as “doable” according to the experts. The large separation of the two rings would enable easy distinction between two signals presented in isolation, but vertical localization became very difficult under rapid and continuous serial presentation, even when ignoring the temporal patterns. This confirmed that we were nearing the processing limits and that decoding three dimension of a compound signal was impossible without sufficient processing time. Because the use of two rings may lead to complex spatio-temporal interactions, requires additional hardware, and makes the display less wearable and comfortable, we discarded the use of vertical location as third coding dimension.
Iteration 4: Information Filtering to Create Sufficient Processing Time
The expert observations indicated that sufficient information processing time is required after the presentation of three obstacles. There are several options to increase the pause at the end of a sequence to create the time to process information before the next sequence starts.
• Reduce the presentation time of the three slots in one sequence from the current 300 to 200 or even 100 ms. This option is not very realistic: short pulses are harder to detect in themselves and shorter slots also reduce the number of options to design differentiable temporal patterns.
• Reduce the refresh rate, e.g., to 0.5 Hz which means an additional second for further information processing after presentation. This option is also not very realistic because a low refresh rate would mean that the user has to reduce the walking speed to maintain the required safety margins.
• Reduce the amount of information chunks in a single sequence from the current three (the nearest object left, front, right) to one or two. This option has two advantages: it reduces the required number of 300 ms slots, allowing more processing time in between consecutive sequences, and it reduces the amount of information presented and thus the required processing time.
We decided to implement the third option by adding new rules to our filter rule 1: present not more than one object in each direction, namely: filter rule 2: if there is an object in the front direction then present only this object and ignore objects left and right. And filter rule 3: if there is no object in the front direction then present objects left and/or right in parallel (i.e., like in sequence 4). We implemented this using the base-double temporal coding.
Observations: this worked well (in the sense that the experts could easily describe the presented pattern correctly) for situations with a front object present but not so well for L + R parallel presentation of a double and a base signal. This led to the percept of a “double signal somewhere,” i.e., it was difficult to determine the exact location of the double signal when presented simultaneously with a base signal. Base and short simultaneously also did not work too well because the short signal was lengthened by the presence of the base signal and also felt like a long signal. These two observations led to a sequential presentation in a “Left 300 ms slot, pause 100 ms, Right 300 ms slot, pause 300 ms” rhythm. Also, when there is no object Left or Right, a blank or empty interval should explicitly be presented.
Testing with Naïve Participants
We tested the minimalistic designs with six naïve participants (three males). We presented a scenario resembling the approach of a door (objects left and right closing in, no front obstacle), going through the door and approaching a wall (object in front and closing in) and turning to the right, following the wall (enduring single object close left). This scenario was played repeatedly asking the participants to describe what they felt after each presentation.
Resulting Minimal Design
Based on the trials and observations, we come to the following minimal design:
1. Use three horizontal locations (9, 12, and 3’o clock) to code for left, front, and right directions, respectively.
2. Implement three filter rules: 1. If there are two or more objects in a direction, then only present the nearest object, 2. If there is an object in the front direction, then only present this object and ignore objects in the left and right directions, 3. If there is no object in the front direction, then present the nearest object in the left and/or right direction.
3. Use a 1-s information update rate.
4. Present the side information sequentially in a 300–100–300–300 ms pattern and leave slots without information explicitly blank.
5. Use the following temporal patterns: (1) a 300 ms filled interval (called “base”), (2) a 100 ms on—200 ms off pattern (called “short”) or a 150 ms on—150 ms off pattern if required by the hardware (called “long”), and when three levels are required: (3) a 100 ms on—100 ms off—100 ms on pattern (called “double”).
Experiment 4: User Evaluation
In Experiment 4, we continue with the results of experiment 3 and test the minimal signal design with five visually impaired users. The advantage of the minimalistic design over the use of audition as explored in Experiment 2 is that visually impaired users prefer to keep their auditory capacity available to perceive ambient sounds in the environment. To simulate a possible implementation, the tactile display is coupled to a sensor and image processing system able to detect on-ground and hanging objects and determine their horizontal direction (three levels) and distance (two levels).
Methods
Participants
Six users (four males, two females) voluntarily participated. One participant was not able to complete the experiment due to urgent personal circumstances and was left out of the analyses. Four of the five remaining participants were blind including one participant with born-blindness, and one was highly visually impaired. They were cane users for years (from 2 to 40 years), and two of them had guide dog experience. Four participants reported that they had had a mobility training; all participants had experience in mobile devices like mobile phones.
Apparatus
The experiment was run in a gymnasium (12 m × 18 m × 6 m) at the facilities of Bartiméus, Zeist, The Netherlands (knowledge center for people with a visual limitation). The gymnasium was only open for the participant and the experimenters. We used two simulated environments with grounded card boxes, hanging paper boards, foldable wardrobes and a soft vertical mat used to build a wall (see Figure 9). Participants started from a fixed location and were asked to walk toward a target location that was a loudspeaker playing light music. Participants used their own white cane. Obstacle information [three directions (left, front, right), two distances (closer than 2.5 m and beyond 2.5 m), and “hanging obstacle in view”] was gathered (near) real time using a dedicated, wearable sensor and image information processing module described elsewhere (Simros and Conradie, 2015; Zeng et al., 2017a,b). The obstacle information was filtered using the three rules described in Experiment 3 and presented using the following patterns and meanings: (1) base pattern meaning noise (sensor has no information), (2) double pattern meaning object near, (3) short pattern meaning object far, and (4) continuous pulsing of all three tactors in 500 ms on—500 ms off pattern meaning hanging object in the sensor’s field of view.
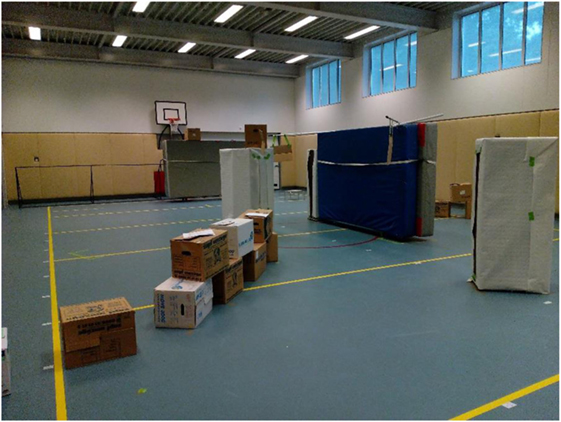
Figure 9. Test environment for the user evaluation.
Design and Dependent Variables
One scenario was completed using the white cane only, one scenario with the white cane and the tactile ETA. The order of conditions was alternating between participants as was the scenario completed in a specific condition (i.e., the participants walked different paths with a different obstacle layout in the condition with and without the ETA support). Subjective ratings, open evaluation questions and remarks were registered. Performance measures were the time to completion and whether hanging obstacles were hit.
Procedures
Before engaging in the experiment, participants received information about the experiment and the goals of the evaluation at least a week before and more detailed information provided by the experiment leader on site. The formal consent form was presented through an accessible document (Word format) which the participant could study using a computer in a separate room. After signing the informed consent, a questionnaire was filled out to gather demographic data and data on experience with mobility training and use of ETAs, followed by a familiarization with the equipment and tactile cues, but without using the sensor system. To explain the meaning of the tactile signals, swell paper depicting the top down view of the different segments was used as depicted in Figure 10.
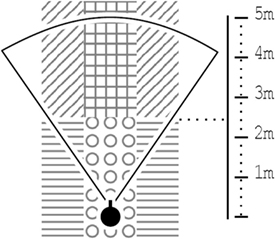
Figure 10. The three walking corridors on a swell paper. Please note that the horizontal directions were not defined as cones but as rectangular corridors.
After this, the participant was guided to the gymnasium and the experiment proper started. Participants were asked to walk toward the sound source at a moderate speed and circumvent obstacles on their way. Participants were informed that the maximum time to reach the target location was 5 min. One experimenter walked behind the participant and asked him/her to speak out what he/she was thinking (“Thinking-aloud-protocol”). A second experimenter was following at a greater distance and recorded comments and observations and guarded the participant’s safety and for instance stopped participants who walked too close to the walls of the gymnasium. After completing both conditions, a short post-questionnaire was completed. Please see the results section for the questions.
Results
All participants completed the task in both conditions. The runs with the ETA took significantly longer to complete, t(4) = 2.95, p < 0.05. On average, the participants needed 167 s to complete the scenario with the ETA and only 45 s without the ETA. This confirms earlier observations that processing the (additional) ETA information may reduce the walking pace. Both in the condition with and without the ETA, participants hit hanging objects (four and three participants, respectively). Some of the hits in the ETA conditions were caused by sudden turns of the body or head in which case the hanging obstacle is outside the field of view of the camera.
Ratings were used to evaluate the tactile hardware and signals. Therefore, participants only evaluated the condition including the tactile cues using a five-point Likert scale with higher score indicating a more favorable evaluation.
• Was it easy to acquire the orientation information about approaching obstacles by the tactile belt? M = 3.6, SD = 0.55.
• Was it easy to acquire the distance information about approaching obstacles by the tactile belt? M = 3.0, SD = 1.00.
• Did system respond fast enough? M = 2.8, SD = 0.84.
• Were you satisfied about the system to help you avoid obstacles while walking? M = 3.2, SD = 0.45.
• Was it comfortable to wear the whole system while walking? M = 3.8, SD = 1.10.
Observations and Remarks
• How was your strategy to find out a clear path? While walking the participants focused on finding whether there was something in front of them, and when there was they would try to turn their body (i.e., left or right) and wait for the feedback of the system. In other words: their strategy was to find a free path. Once there was a free path, they would continue to walk straight.
• If the price is within a reasonable range, will you use such a system in the future? All participants would like to use/buy such a system, if the price was affordable and further improvements were realized.
• What (of the tactile system) should be improve in the future? The vibrations should be adjustable in intensity.
Discussion
In Experiment 4, we implemented the filters and compound signals of experiment 3 in an actual obstacle avoidance system and evaluated them with participants from the foreseen user group. Due to the restriction of the sensor system and the limited number of participants (5), the study had primarily an exploratory approach. Informal observations of the experimenter indicate that even with the collision avoidance system, a substantial amount of collisions with grounded obstacles occurred, albeit much less than without the system. We did not include this as performance measure as contact with grounded objects such as walls is sometimes deliberate as they are used as guidance.
Although we did not instruct participants to complete the scenario as quickly as possible, processing the tactile information resulted in a lower walking speed (the longer completion times are not caused by participants covering longer distances). This is in accordance with our earlier observations in Experiment 1. As in Experiment 1, the question arises whether this effect of lower walking speed may become smaller or disappear after extensive training or prolonged usage. This is suggested by previous research, which has shown that training with assistive technology is crucial and can dramatically improve performance (Dakopoulos and Bourbakis, 2010). In the current experiment, participants had no training at all using the whole system (i.e., sensor and display together) while they had at least 2 years’ experience in using the white cane. Lack of training was also mentioned by the participants themselves. In addition, some of them commented that the test scenarios were too complex, and a simple and real daily life scenario would allow higher walking speeds. Apart from training to develop better skills in using the system, prolonged usage may increase the trust in the system. Lack of trust may also result in lower walking speeds.
The subjective ratings and remarks are encouraging but also show that the system has room for improvement. On average, the participants thought it was easier to get the direction information of approaching obstacles by the tactile belt, than getting the distance information (also confirming earlier results). Interestingly, the employed strategy is based on finding an obstacle-free path and maintain that, and not on creating a mental map of obstacles and use this to plan a route. This is in accordance with the two levels of navigation that distinguishes local guidance (maintaining a collision free course) and global awareness (i.e., building a mental map and planning an obstacle-free route). This also supports our approach to filtering/prioritizing obstacle information. Generally, the comfort and usability of the system are rated good, and all users were willing to buy such a system. However, the system needs to be faster and the vibration stronger. To increase usability a system may automatically adjust vibration levels based on for instance the user preferences and the context of use.
Conclusion
The results show that the system may help blind and visually impaired users in detecting and avoiding hanging obstacles during walking as long as they are within the sensor’s field of view. However, the objective performance does not substantiate the evaluation, at least partly due to system restrictions like a limited field of view. Training and prolonged usage may reduce or nullify the negative effects on walking speed, but no data on this issue are available yet. The results confirm that information filtering and fast presentation of the information are critical points and that the requirements for an local guidance ETA are strict and supporting local guidance tasks remains a challenge. The potential of the same system to support global awareness tasks was recently confirmed (Zeng et al., 2017a,b).
General Discussion and Conclusion
To facilitate navigation through for instance public spaces for the visually impaired, ETAs are being developed. The topic of this paper is how to balance the (increasing) amount of information available in an ETA and the processing capabilities of the user. More specifically, we focus on the presentation of obstacle avoidance information which puts strict requirements on the speed of presentation: information must be processed within appropriate safety margins (timewise) without slowing the user down. Our user evaluation shows that an ETA may indeed provide useful information above and beyond the information provided by the white cane as long as important boundary conditions are taken into account with respect to the auditory–tactile display design. The results with end users indicate that the acknowledged potential of the display does not necessarily improve performance which also depends on for instance the quality of the ETA’s sensor and obstacle detection algorithm.
Compound Tactile Signals
The present results show that tactile coding parameters that are sufficiently discriminable in isolation may not be so in compound signals. There are limitations to the number of features that can be coded in a single compound signal using location and temporal pattern. Four is too much, even under “single tasking” lab conditions. Two is doable, also in “dual” tasking conditions, i.e., simulated obstacle avoidance including walking and using the white cane. This means that filtering is required to keep the amount of presented information within these boundaries, despite the fact that future ETAs will increase the amount of information they can extract from the environment. This requires a careful balance between information richness and information processing capabilities. Tactile information processing limitations may be the bottleneck of future ETA systems for visually impaired.
The experiments show that using horizontal tactor location is the best coding parameter of those tested (90% correct, chance 33%). Temporal coding is preferred as secondary coding parameter (62% correct, chance 25%) and preferred over speed of signal repetition. Vertical tactor location is also possible as coding parameters (70% correct, chance 33%) but not as good as horizontal location. A disadvantage of using vertical location in addition to horizontal coding is that it requires additional tactors and makes the display hardware more complex and expensive and less user friendly.
Spatio-temporal interactions complicate the design of signals, especially when the requirement for high refresh rates dictates a fast presentation. Undesirable effects like complete fusion of signals presented close in time and/or space or mislocation can occur.
The required high information refresh rates necessitate additional filters, for instance in the number of obstacles that can be presented within one refresh cycle. Temporal boundary conditions are strict for local guidance tasks like obstacle avoidance but may be less strict for global awareness tasks like searching for specific objects in an environment and building a mental map. These tasks may even be done standing still. In that situation, filters can be less strict. This is recently shown by Zeng et al. (2017a,b) using the same ETA as we did in Experiment 4.
Multiple Resource Theories
The experiments confirm that the threat of (information) overload is clear and present. This may result in for instance the need to reduce walking speed while processing compound tactile messages (informal observations). This finding underlines the importance of testing/developing this kind of support tools under high load, multitasking conditions.
Off-loading the tactile channel through auditory presentation is possible, but this offloading is limited and may result in a new threat of auditory overload. In addition taxing the auditory channel may in turn interfere with other auditory tasks. Generally, the results confirm the Prenav model which is a specific variety within the family of multiple resource theories stressing the role of intuitive information presentation.
Ethics Statement
Only volunteers participated. The following inclusion and exclusion criteria applied (Experiment 1 and 2): age between 20 and 60 years old; no physical restrains with regard to walking; no difficulties with keeping balance; no known auditory or tactile deficits. Before engaging in the experiments, participants read and signed an informed consent. In Experiment 4, five users voluntarily participated. Four of them were blind including one participant with born-blindness, and one was highly visually impaired. Before engaging in the experiment, participants received information about the experiment and the goals of the evaluation at least a week before and more detailed information provided by the experiment leader on site. The formal consent form was presented through an accessible document (Word format) which the participant could study using a computer in a separate room. During the experiment, a second experimenter guarded the participant’s safety and for instance stopped participants who walked too close to the walls of the gymnasium. The experiments were approved by an Institutional Review Board [TNO Toetsings Comissie Proefpersoon Experimenten (TCPE), Soesterberg, The Netherlands]. Participants received a monetary reward according to the IRB norms and their travel costs were reimbursed.
Author Contributions
JE, TM, LK, and KP were involved in designing, analyzing, interpreting, and reporting experiments 1, 2, and 4. LK and KP were responsible for running experiments 1, 2, and 4. JE and LK participated as experts in experiment 3.
Conflict of Interest Statement
The authors declare that the research was conducted in the absence of any commercial or financial relationships that could be construed as a potential conflict of interest.
Acknowledgments
This research was supported by the EU FP7 SME Program, Project 605998 (Range-IT). The authors would like to thank all participants for their effort.
References
Aguerrevere, D., Choudhury, M., and Barreto, A. (2004). “Portable 3D sound/sonar navigation system for blind individuals,” in Second LACCEI International Latin American and Caribbean Conference for Engineering and Technology, Miami, FL, 1–6.
Amemiya, T., and Sugiyama, H. (2009). “Haptic handheld wayfinder with pseudo-attraction force for pedestrians with visual impairments,” in ASSETS’09 – Proceedings of the 11th International ACM SIGACCESS Conference on Computers and Accessibility, Pittsburgh, PA, 107–114.
Bach-y-Rita, P., Collins, C. C., Saunders, F., White, B., and Scadden, L. (1969). Vision substitution by tactile projection. Nature 221, 963–964. doi: 10.1038/221963a0
Blanke, O., Slater, M., and Serino, A. (2015). Behavioral, neural, and computational principles of bodily self-consciousness. Neuron 88, 145–166. doi:10.1016/j.neuron.2015.09.029
Borenstein, J. (1990). “The NavBelt – a computerized multi-sensor travel aid for active guidance of the blind,” in Proceedings. of the Fifth Annual CSUN Conference on Technology and Persons with Disabilities; 1990 Mar 21–24; Los Angeles, CA, 107–116.
Bousbia-Salah, M., Bettayeb, M., and Larbi, A. (2011). A navigation aid for blind people. J. Intell. Robot. Syst. Theory Appl. 64, 387–400. doi:10.1007/s10846-011-9555-7
Bousbia-Salah, M., and Fezari, M. (2007). “A navigation tool for blind people,” in Innovations and Advanced Techniques in Computer and Information Sciences and Engineering, ed. T. Sobh (Dubai: Springer), 333–337.
Bouzit, M. M., Chaibi, A. A., De Laurentis, K. J., and Mavroidis, C. C. (2004). “Tactile feedback navigation handle for the visually impaired,” in ASME International Mechanical Engineering Congress and Exposition, Dynamic Systems and Control, Parts A and B, Anaheim, CA, 1171–1177.
Cassinelli, A., Reynolds, C., and Ishikawa, M. (2007). “Augmenting spatial awareness with haptic radar,” in Proceedings of the 10th IEEE International Symposium on Wearable Computers (Montreux: ISWC), 61–64.
Conradie, P., Mioch, T., and Saldien, J. (2014). “Blind user requirements to support tactile mobility,” in Tactile Haptic User Interfaces for Tabletops and Tablets (TacTT 2014), CEUR Workshop Proceedings, Vol. 1324, Dresden, 48–53.
Cosgun, A., Sisbot, E. A., and Christensen, H. I. (2014). “Evaluation of rotational and directional vibration patterns on a tactile belt for guiding visually impaired people,” in IEEE Haptics Symposium, Hong Kong, 367–370.
Dakopoulos, D., and Bourbakis, N. G. (2010). Wearable obstacle avoidance electronic travel aids for blind: a survey. IEEE Trans. Syst. Man Cybern. C Appl. Rev. 40, 25–35. doi:10.1109/TSMCC.2009.2021255
Elliott, L. R., Van Erp, J. B. F., Redden, E. S., and Duistermaat, M. (2010). Field based validation of a tactile navigation device. IEEE Trans. Haptics 3, 7887. doi:10.1109/TOH.2010.3
Eriksson, L., Van Erp, J. B. F., Carlander, O., Levin, B., Van Veen, H. A. H. C., and Veltman, J. E. (2006). “Vibrotactile and visual threat cueing with high g threat intercept in dynamic flight simulation,” in HFES 50th Annual Meeting (Santa Monica: Human Factors and Ergonomics Society), 1547–1551.
Ertan, S., Lee, C., Willets, A., Tan, H., and Pentland, A. (1998). “A wearable haptic navigation guidance system,” in Proceedings of the 2nd IEEE International Symposium on Wearable Computers, Pittsburgh, PA, 164–165.
ETSI. (2002). “Human factors (HF); guidelines on the multimodality of icons, symbols and pictograms,” in European Telecommunications Standards Institute Guide EG 202 048 (Sophia Antipolis: ETSI).
Flores, G., Kurniawan, S., Manduchi, R., Martinson, E., Morales, L. M., and Akin Sisbot, E. (2015). Vibrotactile guidance for wayfinding of blind walkers. IEEE Trans. Haptics 8, 306–317. doi:10.1109/TOH.2015.2409980
Geldard, F. A., and Sherrick, C. E. (1972). The cutaneous “rabbit”: a perceptual illusion. Science 178, 178–179. doi:10.1126/science.178.4057.178
Heuten, W., Henze, N., Boll, S., and Pielot, M. (2008). “Tactile wayfinder: a non-visual support system for wayfinding,” in Proceedings of the 5th Nordic conference on Human-computer interaction: building bridges (NordiCHI ’08) (New York, NY, USA: ACM), 172–181.
ISO. (2009). Ergonomics of Human-System Interaction – Part 920: Guidance on Tactile and Haptic Interactions. Geneva: ISO.
Johnson, L., and Higgins, C. M. (2006). “A navigation aid for the blind using tactile-visual sensory substitution,” in Annual International Conference of the IEEE Engineering in Medicine and Biology – Proceedings (New York, NY), 6289–6292.
Karcher, S. M., Fenzlaff, S., Hartmann, D., Nagel, S. K., and Konig, P. (2012). Sensory augmentation for the blind. Front. Hum. Neurosci. 6:37. doi:10.3389/fnhum.2012.00037
Karnath, H. O., Christ, K., and Hartje, W. (1993). Decrease of contralateral neglect by neck muscle vibration and spatial orientation of trunk midline. Brain 116, 383–396. doi:10.1093/brain/116.2.383
Karnath, H. O., Schenkel, P., and Fischer, B. (1991). Trunk orientation as the determining factor of the ‘contralateral’ deficit in the neglect syndrome and as the physical anchor of the internal representation of body orientation in space. Brain 114, 1997–2014. doi:10.1093/brain/114.4.1997
Kim, D., Kim, K., and Lee, S. (2014). Stereo camera based virtual cane system with identifiable distance tactile feedback for the blind. Sensors 14, 10412–10431. doi:10.3390/s140610412
Kim, Y., Harders, M., and Gassert, R. (2015). Identification of vibrotactile patterns encoding obstacle distance information. IEEE Trans. Haptics 8, 298–305. doi:10.1109/TOH.2015.2415213
Lewis, L., Sarples, S., Chandler, E., and Worsfold, J. (2015). Hearing the way: requirements and preferences for technology-supported navigation aids. Appl. Ergon. 48, 56–69. doi:10.1016/j.apergo.2014.11.004
McDaniel, T., Krishna, S., Balasubramanian, V., Colbry, D., and Panchanathan, S. (2008). “Using a haptic belt to convey non-verbal communication cues during social interactions to individuals who are blind,” in Proceedings of the 7th IEEE International Workshop on Haptic Audio Visual Environments and Games, HAVE 2008, Ottawa, 13–18.
Meier, A., Matthies, D. J. C., Urban, B., and Wettach, R. (2015). “Exploring vibrotactile feedback on the body and foot for the purpose of pedestrian navigation,” in Proceedings of the 2nd International Workshop on Sensor-Based Activity Recognition and Interaction (WOAR ’15) Article 11 (New York, NY, USA: ACM).
Meijer, P. B. L. (1992). An experimental system for auditory image representations. IEEE Transl. Biomed. Eng. 39, 112–121. doi:10.1109/10.121642
Miao, M., Spindler, M., and Weber, G. (2011). “Requirements for indoor navigation system from blind users,” in Proceedings of the 7th Conference of the Workshop Human-Computer Interaction and Usability Engineering of the Austrian Computer Society, USAB 2011 (Graz, Austria: Springer), 673–679.
Palleja, T., Tresanchez, M., Teixido, M., and Palacin, J. (2010). Bioinspired electronic white cane implementation based on LIDAR, a triaxial accelerometer and a tactile belt. Sensors 10, 11322–11339. doi:10.3390/s101211322
Pawluk, D., Bourbakis, N., Giudice, N., Hayward, V., and Heller, M. (2015). Haptic assistive technology for individuals who are visually impaired. IEEE Trans. Haptics 8, 245–247. doi:10.1109/TOH.2015.2476735
Pielot, M., Poppinga, B., Heuten, W., and Boll, S. (2012). “PocketNavigator: studying tactile navigation systems in-situ,” in Proceedings of the SIGCHI Conference on Human Factors in Computing Systems (CHI ’12) (New York, NY, USA: ACM), 3131–3140.
Prescher, D., Spindler, M., Weber, M., and Weber, G. (2013). “Benutzerzentriertes Design der nicht-visuellen Navigation in Gebäuden,” in Mensch & Computer 2013: Interaktive Vielfalt, eds S. Boll, S. Maaß, and R. Malaka (München: Oldenbourg Verlag), 27–46.
Prevett, T. T., and Wickens, C. D. (1994). “Perspective displays and frame of reference: their independence to realize performance advantages over planar displays in a terminal area navigation task,” in Technical Report ARL-94-8/NASA-94-3 (Illinois: Aviation Research Laboratory, Institute of Aviation).
Prewett, M. S., Elliott, L. R., Walvoord, A. G., and Coovert, M. D. (2012). A meta-analysis of vibrotactile and visual information displays for improving task performance. IEEE Trans. Syst. Man Cybern. C Appl. Rev. 42, 123–132. doi:10.1109/TSMCC.2010.2103057
Roscoe, S. N. (1968). Airborne displays for flight and navigation. Hum. Factors 10, 321–332. doi:10.1177/001872086801000402
Sainarayanan, G., Nagarajan, R., and Yaacob, S. (2007). Fuzzy image processing scheme for autonomous navigation of human blind. Appl. Soft Comput. 7, 257–264. doi:10.1016/j.asoc.2005.06.005
Serino, A., Noel, J. P., Galli, G., Canzoneri, E., Marmaroli, P., Lissek, H., et al. (2015). Body part-centered and full body-centered peripersonal space representations. Sci. Rep. 5, 18603. doi:10.1038/srep18603
Shah, C., Bouzit, M., Youssef, M., and Vasquez, L. (2006). “Evaluation of RU-netra – tactile feedback navigation system for the visually impaired,” in Fifth International Workshop on Virtual Rehabilitation, IWVR 2006 (New York, NY: IEEE), 72–77.
Shoval, S., Borenstein, J., and Koren, Y. (1998). Auditory guidance with the NavBelt –a computerized travel aid for the blind. IEEE Trans. Syst. Man Cybern. 28, 459–467. doi:10.1109/5326.704589
Sinclair, I., Carter, J., Kassner, S., van Erp, J., Weber, G., Elliott, L., et al. (2012). “Towards a standard on evaluation of tactile/haptic interactions,” in Haptics: Perception, Devices, Mobility, and Communication (Tampere: Springer), 528–539.
Spindler, M., Weber, M., Prescher, D., Miao, M., Weber, G., and Ioannidis, G. (2012). “Translating floor plans into directions,” in ICCHP 2012, Part II, LNCS 7383, eds Miesenberger K., et al. (Linz: Springer), 59–66.
Tang, H., and Beebe, D. J. (2006). An oral tactile interface for blind navigation. IEEE Trans. Neural Syst. Rehabil. Eng. 14, 116–123. doi:10.1109/TNSRE.2005.862696
Van Erp, J. B. F. (2002). “Guidelines for the use of vibro-tactile displays in human computer interaction,” in Proceedings of Eurohaptics, Vol. 2002, Edinburgh, 18–22.
Van Erp, J. B. F. (2005a). Presenting directions with a vibro tactile torso display. Ergonomics 48, 313. doi:10.1080/0014013042000327670
Van Erp, J. B. F. (2005b). “Vibrotactile spatial acuity on the torso: effects of location and timing parameters,” in Proceedings of Worldhaptics (Los Alamitos, CA: IEEE Computer Society), 80–85.
Van Erp, J. B. F. (2007). Tactile Displays for Navigation and Orientation: Perception and Behaviour. Netherlands: Thesis Utrecht University.
Van Erp, J. B. F., and Kern, T. A. (2008). “ISO’s work on guidance for Haptic and tactile interactions,” in Proceedings of Eurohaptics 2008. LNCS, Vol. 5024 (Madrid: Springer), 936–940.
Van Erp, J. B. F., Toet, A., and Janssen, J. (2015). Uni-, bi- and tri-modal warning signals: effects of temporal parameters and sensory modality on perceived urgency. Saf. Sci. 72, 1–8. doi:10.1016/j.ssci.2014.07.022
Van Erp, J. B. F., and Van Veen, H. A. H. C. (2004). Vibrotactile in vehicle navigation system. Transp. Res. F Hum. Factors 7, 256. doi:10.1016/j.trf.2004.09.003
Van Erp, J. B. F., and Werkhoven, P. J. (2006). “Validation of principles for tactile navigation displays,” in HFES 50th Annual Meeting (Santa Monica: Human Factors and Ergonomics Society), 1687–1691.
Velazquez, R., and Bazan, O. (2010). “Preliminary evaluation of podotactile feedback in sighted and blind users,” in Annual International Conference of the IEEE Engineering in Medicine and Biology Society, EMBC’10, Buenos Aires, 2103–2106.
Wickens, C. D. (2002). Multiple resources and performance prediction. Theor. Issues Ergon. Sci. 3, 159–177. doi:10.1080/14639220210123806
Wickens, C. D., and Prevett, T. T. (1995). Exploring the dimensions of egocentricity in aircraft navigation displays. J. Exp. Psych. Appl. 1, 110–135.
World Health Organization. (2014). Visual Impairment and Blindness. Fact Sheet N°282. Available from: http://www.who.int/mediacentre/factsheets/fs282/en/
Zelek, J. S. (2005). Seeing by touch (haptics) for wayfinding. Int. Congr. Series 1982, 1108–1112. doi:10.1016/j.ics.2005.06.002
Zeng, L., Simros, M., and Weber, G. (2017a). “Camera-based mobile electronic travel aids support for cognitive mapping of unknown spaces,” in Proceedings of MobileHCI; 2017 Sept 4–7 (Vienna: ACM).
Zeng, L., Weber, G., Simros, M., Conradie, P., Saldien, J., Ravyse, I., et al. (2017b). “Range-IT: detection and multimodal presentation of indoor objects for visually impaired people,” in International Conference on Human-Computer Interaction with Mobile Devices and Services (Vienna, Austria: ACM Press).
Keywords: visually impaired persons, tactile perception, haptic interfaces, cognitive overload, electronic travel aid
Citation: van Erp JBF, Kroon LCM, Mioch T and Paul KI (2017) Obstacle Detection Display for Visually Impaired: Coding of Direction, Distance, and Height on a Vibrotactile Waist Band. Front. ICT 4:23. doi: 10.3389/fict.2017.00023
Received: 28 December 2016; Accepted: 22 September 2017;
Published: 13 October 2017
Edited by:
Javier Jaen, Universitat Politècnica de València, SpainReviewed by:
Ferran Argelaguet, Inria, FranceJosé Antonio Becerra Permuy, University of A Coruña, Spain
Copyright: © 2017 van Erp, Kroon, Mioch and Paul. This is an open-access article distributed under the terms of the Creative Commons Attribution License (CC BY). The use, distribution or reproduction in other forums is permitted, provided the original author(s) or licensor are credited and that the original publication in this journal is cited, in accordance with accepted academic practice. No use, distribution or reproduction is permitted which does not comply with these terms.
*Correspondence: Jan B. F. van Erp, jan.vanerp@tno.nl