Corrigendum: Analysis of a Large Standardized Food Challenge Data Set to Determine Predictors of Positive Outcome Across Multiple Allergens
 Sayantani Sindher1
 Andrew J. Long1,2
 Natasha Purington1
 Madeleine Chollet3Sara Slatkin3
 Sandra Andorf1Dana Tupa1
 Divya Kumar1Margaret A. Woch1
 Katherine L. O'Laughlin1
 Amal Assaad4Jacqueline Pongracic5
 Jonathan M. Spergel6
 Jonathan Tam7Stephen Tilles8Julie Wang9
 Stephen J. Galli1,10,11
 Kari C. Nadeau1
 R. Sharon Chinthrajah1*
- 1Sean N. Parker Center for Allergy and Asthma Research, Stanford University School of Medicine, Stanford, CA, United States
- 2Department of Pharmacy, Lucile Packard Children's Hospital Stanford, Stanford, CA, United States
- 3Department of Medicine, School of Medicine, Stanford, CA, United States
- 4Division of Allergy and Immunology, Cincinnati Children's Medical Center, Cincinnati, OH, United States
- 5Division of Allergy and Immunology, The Ann and Robert H. Lurie Children's Hospital of Chicago, Chicago, IL, United States
- 6Division of Allergy and Immunology, The Children's Hospital of Philadelphia Department of Pediatrics, Perelman School of Medicine at University of Pennsylvania, Philadelphia, PA, United States
- 7Division of Clinical Immunology and Allergy, Children's Hospital Los Angeles, Los Angeles, CA, United States
- 8ASTHMA Inc. Clinical Research Center, Northwest Asthma and Allergy Center, University of Washington, Seattle, WA, United States
- 9Division of Allergy and Immunology, Department of Pediatrics, Icahn School of Medicine at Mount Sinai, New York, NY, United States
- 10Department of Pathology, Stanford University School of Medicine, Stanford, CA, United States
- 11Department of Microbiology and Immunology, Stanford University School of Medicine, Stanford, CA, United States
Background: Double-blind placebo-controlled food challenges (DBPCFCs) remain the gold standard for the diagnosis of food allergy; however, challenges require significant time and resources and place the patient at an increased risk for severe allergic adverse events. There have been continued efforts to identify alternative diagnostic methods to replace or minimize the need for oral food challenges (OFCs) in the diagnosis of food allergy.
Methods: Data was extracted for all IRB-approved, Stanford-initiated clinical protocols involving standardized screening OFCs to a cumulative dose of 500 mg protein to any of 11 food allergens in participants with elevated skin prick test (SPT) and/or specific IgE (sIgE) values to the challenged food across 7 sites. Baseline population characteristics, biomarkers, and challenge outcomes were analyzed to develop diagnostic criteria predictive of positive OFCs across multiple allergens in our multi-allergic cohorts.
Results: A total of 1247 OFCs completed by 427 participants were analyzed in this cohort. Eighty-five percent of all OFCs had positive challenges. A history of atopic dermatitis and multiple food allergies were significantly associated with a higher risk of positive OFCs. The majority of food-specific SPT, sIgE, and sIgE/total IgE (tIgE) thresholds calculated from cumulative tolerated dose (CTD)-dependent receiver operator curves (ROC) had high discrimination of OFC outcome (area under the curves > 0.75). Participants with values above the thresholds were more likely to have positive challenges.
Conclusions: This is the first study, to our knowledge, to not only adjust for tolerated allergen dose in predicting OFC outcome, but to also use this method to establish biomarker thresholds. The presented findings suggest that readily obtainable biomarker values and patient demographics may be of use in the prediction of OFC outcome and food allergy. In the subset of patients with SPT or sIgE values above the thresholds, values appear highly predictive of a positive OFC and true food allergy. While these values are relatively high, they may serve as an appropriate substitute for food challenges in clinical and research settings.
Background
During recent years, the prevalence of IgE-mediated food allergies has steadily increased and has emerged as a significant health crisis (1) affecting 8% of the pediatric population with more than 30% of these children with multiple food (multifood) allergies (2). Not only are childhood food allergies associated with comorbid atopic conditions such as atopic dermatitis, asthma, and allergic rhinitis, but are also associated with impaired quality of life (3–8).
The diagnosis of food allergy is highly complex (9, 10). Skin prick testing (SPT) and food allergen-specific immunoglobulin E (sIgE) are commonly used to determine allergenicity, however outcomes are often variable. High thresholds of both SPT and sIgE have been established for specific foods and tend to correlate with reactivity, such as sIgE > 15 KU/L and SPT > 8 mm associated with 95% positive predictive value (PPV) for tree nuts (11). However, thresholds are less useful for intermediate values where there is already a doubt whether the patient is truly allergic (12–21), and may be associated with false positives (10, 22). Children in particular have a higher rate of sensitization without true allergy (23). Other biomarkers that have been explored include basophil activation tests (BATs) as well as the measurements of allergen-specific IgG, total IgE (tIgE), and component resolved diagnostics, but definitive thresholds remain to be established (24). Due to these limitations, the current gold standard for confirming food allergy is the double-blind, placebo-controlled food challenge (DBPCFC) (9, 10), which is typically performed in the research setting as part of inclusion into clinical trials; however, DBPCFCs are not without a number of limitations. While food challenge guidelines have been recommended in the literature, dosing strategies are not allergen-specific (25). DBPCFCs require multiple days of challenges for multi-food allergic individuals, which can significantly increase the cost. The most significant limitation is that food challenges carry the risk of potentially inducing severe anaphylaxis which may require hospitalization or care in the intensive care unit (26).
In this paper, we attempt to identify potential prognostic indicators for multi-food allergic individuals associated with outcomes during oral food challenges (OFCs) which could aid in risk stratification for designing challenge protocols for clinical trials. We tested data obtained from eligible participants from several food allergy trials that required either baseline DBPCFCs or unblinded food challenges as an inclusion criteria. In our analysis, we attempt to identify factors that may better predict food allergy outcomes in the research and clinical setting and provide guidance toward dosing strategies.
Methods
Data Source
All clinical trial participant data from food allergy studies conducted under IRB approved protocols were entered into a standardized database. The database was created by a board certified Allergy/Immunology physician and all food challenges were conducted, evaluated, and documented by trained research clinicians. Data entry was performed by trained research staff. Quality checks of data were performed by our data entry and statistics team.
Skin Prick Tests, IgE Blood Tests, and Oral Food Challenges
Between September 2010 to March 2016, participants were recruited to undergo OFCs as part of screening for clinical trial enrollment at 7 sites under an Investigational New Drug (IND) at Stanford University. During the initial screening visit, SPT and IgE values were obtained for each participant in the clinic at the time of the visit or from previous testing at a physician's office, depending on clinical trial inclusion criteria. SPT consisted of a positive histamine control, a negative saline control (both from Hollister-Stier) and allergen extracts from Greer. SPTs were performed on the volar surface of the forearm or back after application of the respective allergen solution. Mean wheal diameter was measured after 20 min. Allergen-specific IgE levels were measured by ImmunoCAP fluorescence enzyme immunoassay. Challenges to each food allergen were performed only in participants with suspected food allergy, defined broadly as an sIgE > 0.35 kU/L and/or a positive SPT (>3 mm above the negative control) to the challenged allergen. OFCs were standardized in methodology and escalated to at least 500 mg cumulative food protein to each of the participants' suspected allergens. Participants with previous reactions to food requiring the use of epinephrine for adverse reactions were eligible for screening and challenges under each study; however, those with a past history of intubation or hypotension related to a food allergy were excluded.
While most of the included challenges were conducted as DBPCFCs, some challenges were unblinded OFCs. All food challenges included for the purpose of analyses will be referred to as OFCs, herein, regardless of blinded status. Excluding such differences in blinding, all OFCs were performed using standardized methodology with respect to monitoring, according to validated guidelines (10, 27, 28). Challenges to eleven different food allergens were included in the analyses, consisting of almond, cashew, egg, hazelnut, milk, peanut, pecan, pistachio, sesame, walnut, and wheat. Typically challenges started with as small as 1 mg (for pistachio), then 2, 5, 20, 50, 100, 100, 100, 123 mg (for pistachio) or 124 mg. Pistachio started at 1 mg due to safety concerns since only those positive to a cashew challenge, were also challenged to pistachio. Challenges to allergens other than those mentioned above were defined as “other” and excluded from further analyses given the limited number of challenges performed to such allergens. Each OFC consisted of sequentially escalating doses of food protein ingested by the participant every 15 min as tolerated. Food protein was administered in flour form mixed in an appropriate vehicle, such as applesauce or pudding. During the course of the challenge, vital signs and pertinent physical examinations were repeated at least every 15 min at the discretion of the clinician. Type and severity of each dose-related allergic adverse event were determined and classified according to Bock criteria (27), and participants tolerating 500 mg cumulative protein dose during the challenge were considered to have a negative challenge, for the purpose of analysis. Cumulative tolerated dose (CTD) was defined as the last ingested cumulative protein dose at which no dose-related allergic adverse event occurred. All aspects of the studies from which data was obtained were authorized by the IRBs at each site.
Statistical Analysis
Challenges were censored at 500 mg CTD if the challenge was negative. A cumulative incidence plot and median survival were reported by food, and the equality of the incidence curves was tested using the log-rank test. The survfit function of R's survminer package was used to fit the model (29).
To determine possible predictors of a positive challenge, Cox proportional hazards models containing Gaussian random effects (i.e., frailty models) were fit to the primary outcome as a function of each clinical and demographic feature, adjusting for challenge food with a random effect for participant. The coxme function was used to fit each model (30). Hazard ratios and 95% CIs were reported.
To determine thresholds of SPT, sIgE, and the sIgE to tIgE ratio (IgEr) that best discriminated challenge outcome, the OptimalCutpoints package was implemented using receiver operator characteristic (ROC) curves based on Youden's index (31, 32). Next, a logistic regression model was fit to both SPT and sIgE then to SPT and sIgEr for each food. The ModelGood package was used to calculate the AUC from each multivariable model (33). The set of 5 ROC analyses were compared for each food graphically and by AUC.
To incorporate the dose-varying nature of the food challenge outcome, a dose-dependent ROC was used, predicting the probability of a positive challenge to a maximum cumulative dose of 500 mg. The survivalROC package was used to determine the optimal threshold, while time ROC was used to calculate the AUC, PPV, and negative predictive value (NPV) at the determined threshold by dose (34, 35). Kaplan-Meier curves were plotted based on the determined threshold, and P-values from the log-rank test were reported. Within positive OFCs, concordance of SPT and sIgE thresholds and SPT and sIgEr thresholds for each food was assessed and accuracy was reported.
In order to compare the two ROC methods, AUCs were derived from 1,000 bootstrap samples per ROC method, allergen, and marker. We then took the difference in the two AUCs and calculated a 95% confidence interval around the difference.
All analyses were conducted at the 0.05 alpha level. P-values were not adjusted where multiple comparisons were made. Analyses were conducted using R v.3.4.3 (36).
Data Management
Any value of sIgE > 100 kU/L was truncated to 101 due to clinical lab processing. If SPT or sIgE were not performed during screening then previously collected SPT and/or sIgE available within 12 months of the OFC were included in the analysis (14). Negative control (saline) SPT was subtracted from the raw food SPTs prior to analysis. Any SPT that was collected after the food challenge or collected more than 12 months before the challenge was excluded. If a subject had more than one value for SPT or sIgE, then the value obtained most recently was used.
To account for differences in maximum challenge doses, positive challenges with CTDs of 500 mg protein or higher were re-coded as having negative challenges. Subjects who had unknown or non-reported ethnicity were coded as missing ethnicity. Subjects with race of Native Hawaiian, other, or not reported were coded as other. Challenges to oat (placebo) were excluded from analyses. Further, challenges reported as negative with CTDs of < 500 mg cumulative protein were also excluded. Placebo challenges were not included in the analysis. A consort of these steps is illustrated in Figure 1.
FIGURE 1
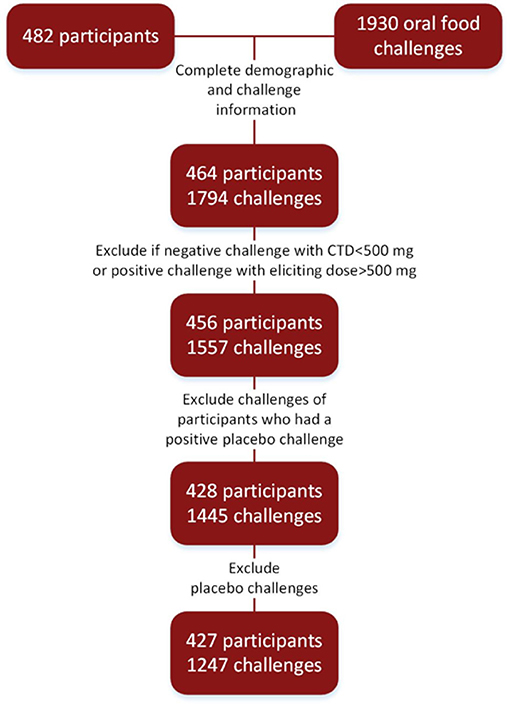
Figure 1. Consort diagram: food challenges conducted in research settings to arrive at final cohort.
Results
Baseline Demographics
Four hundred and twenty-seven participants were challenged to at least one food (Figure 1). Ages ranged from 1 to 54, with a median age of 9 years. The cohort was comprised of mostly non-Hispanic (97%), Caucasian (61%), and males (61%). The majority of participants also had atopic history, including asthma (62%), allergic rhinitis (77%), and atopic dermatitis (AD) (73%). The median number of doctor diagnosed food allergens was 5, with only 2% of the cohort being mono-food allergic. The median tIgE was 491 kU/L (Table 1).
TABLE 1
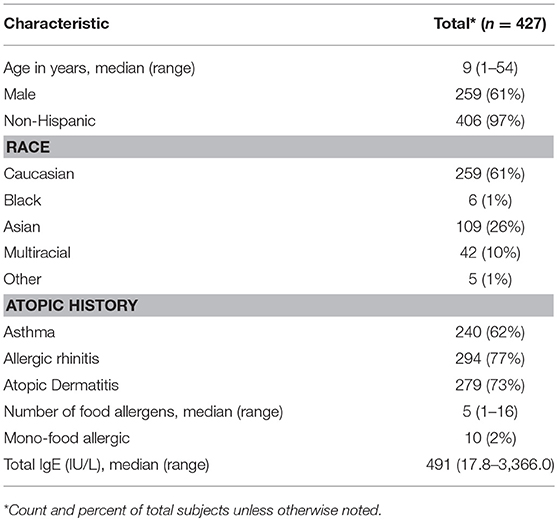
Table 1. Baseline demographics.
Challenge Overview
Eighty-five percent of OFCs resulted in a positive outcome. Between 41 and 100% of all OFCs conducted across foods were positive (Table 2). For instance, all pistachio challenges had positive outcomes, however only cashew allergic participants were challenged to pistachio. Cashew and pecan challenges had the next highest percent of positive challenges (93%), followed by peanut (92%). Some participants repeated food challenges to the same food allergen over time, therefore the number of positive OFCs may be higher than the number of unique allergic participants. The largest number of food challenges were conducted for peanut (n = 377) with 77% of participants having positive challenges. Only 41% of almond challenges resulted in a positive challenge outcome.
TABLE 2
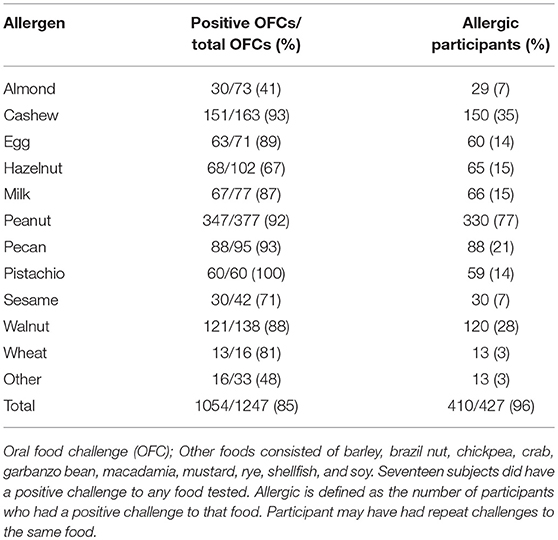
Table 2. Challenge summary by allergen.
The highest median CTD at which 50% of participants had no allergic reaction was 28.9 mg (for sesame), while the other challenged foods had lower median CTDs; except for challenges to almond where < 50% of participants had a positive outcome (Figure 2). No participant challenged to pistachio in our Center tolerated a cumulative protein dose >175 mg and 50% reacted at the first dose (CTD median = 0).
FIGURE 2
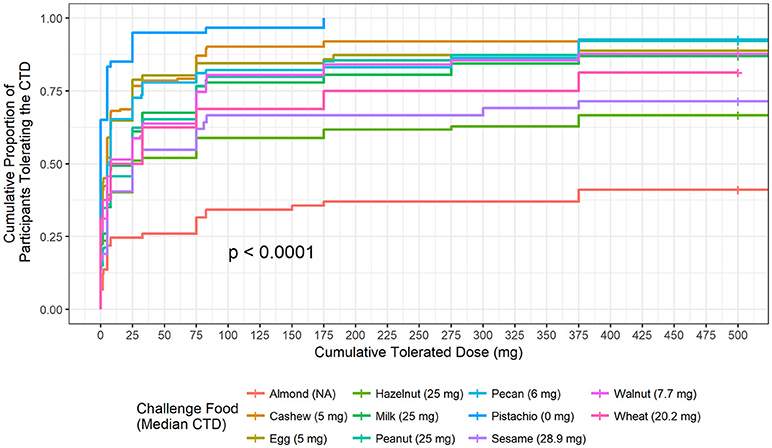
Figure 2. Cumulative tolerated dose by food. Each food is plotted to understand the proportion of participants who tolerated specified cumulative tolerated doses (CTD). Median CTD is the highest cumulative dose at which 50% of participants had no dose-related allergic reaction and is listed in the figure legend in parenthesis.
Average SPT values in the cohort ranged from 6.2 mm for almond to 13.6 mm for cashew and peanut (Table 3). Peanut had the highest median sIgE (67.55 kU/L) followed by wheat (61.5 kU/L) and almond had the lowest (4.39 kU/L).
TABLE 3
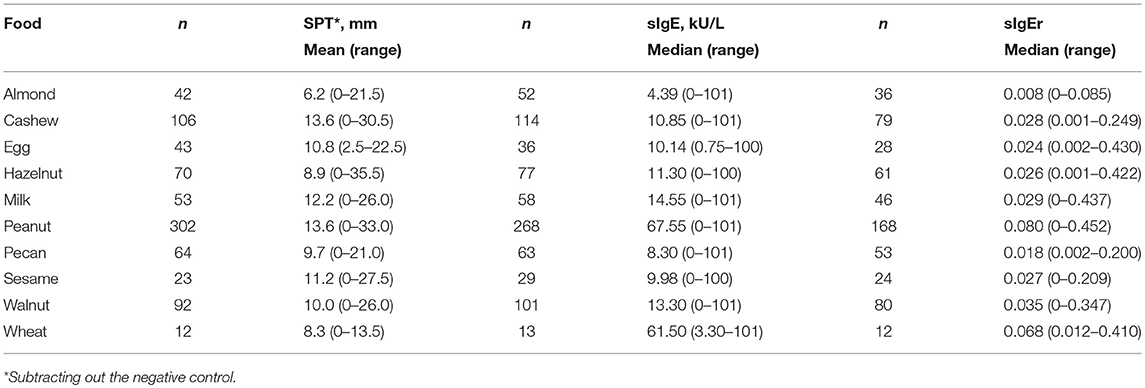
Table 3. Biomarker summaries per specific food.
Participants with a lifetime history of AD had 1.23-fold higher risk of a positive challenge outcome compared to those without a history of AD (hazard ratio [HR]: 1.23, 95% confidence interval [CI]: 1.00, 1.52) (Table 4). The risk of a positive challenge outcome increased by 4% for every additional doctor diagnosed food allergy (HR: 1.04, CI: 1.01, 1.07).
TABLE 4
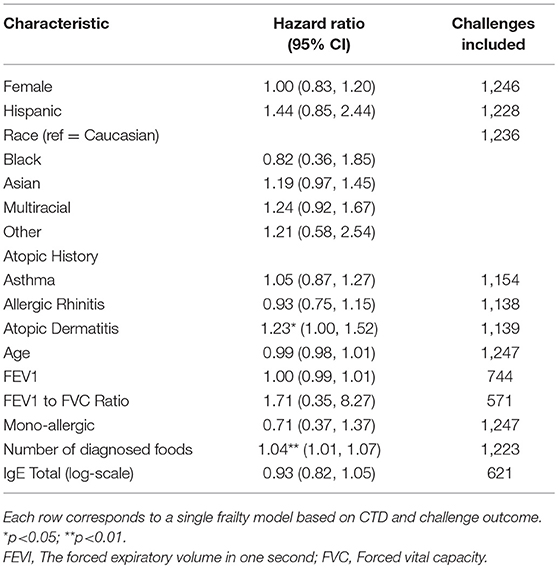
Table 4. Univariable associations of positive challenge.
Logistic ROC for Clinical Thresholds
The logistic ROC approach resulted in SPT thresholds that ranged from 4.5 mm for wheat to 14.5 mm for egg for predicting a positive OFC, with AUCs ranging from 0.52 to 0.90 (Table 5). The ROC approach using sIgE resulted in thresholds that ranged from 1.2 kU/L for cashew to 52.2 kU/L for wheat, with AUCs ranging from 0.59 to 0.92. AUCs for sIgEr thresholds ranged from 0.65 to 0.89.
TABLE 5
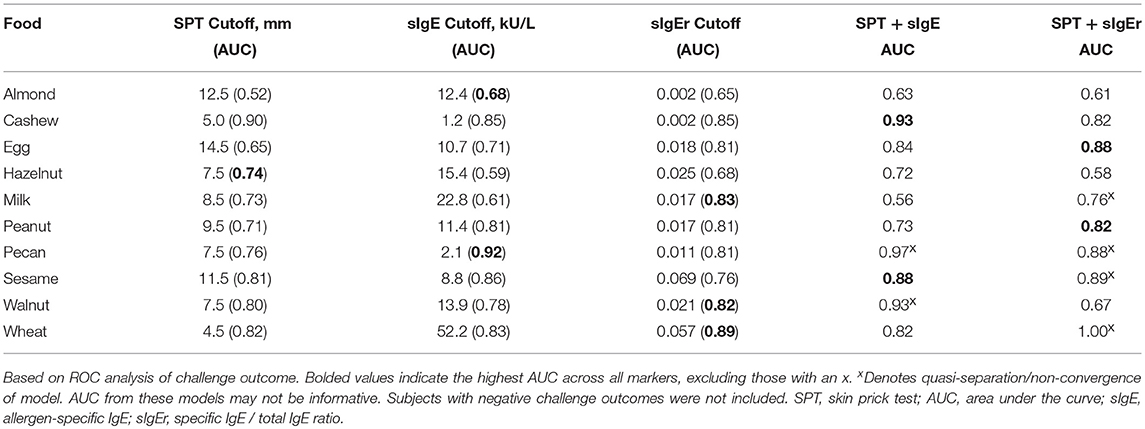
Table 5. Logistic ROC thresholds for food challenge outcome.
In four of the 10 allergens (cashew, egg, peanut, and sesame), the combination of SPT and either sIgE or sIgEr was better at discriminating food challenge outcome than any of the markers individually, and in one instance (for hazelnut), SPT alone was the best (Table 5). For cashew, egg, peanut, and sesame where the joint markers were superior, AUCs were 0.80 and above. A comparison of the joint markers and each individual marker by food are displayed in Figure 3. The best AUC for each food varied between the clinical markers.
FIGURE 3
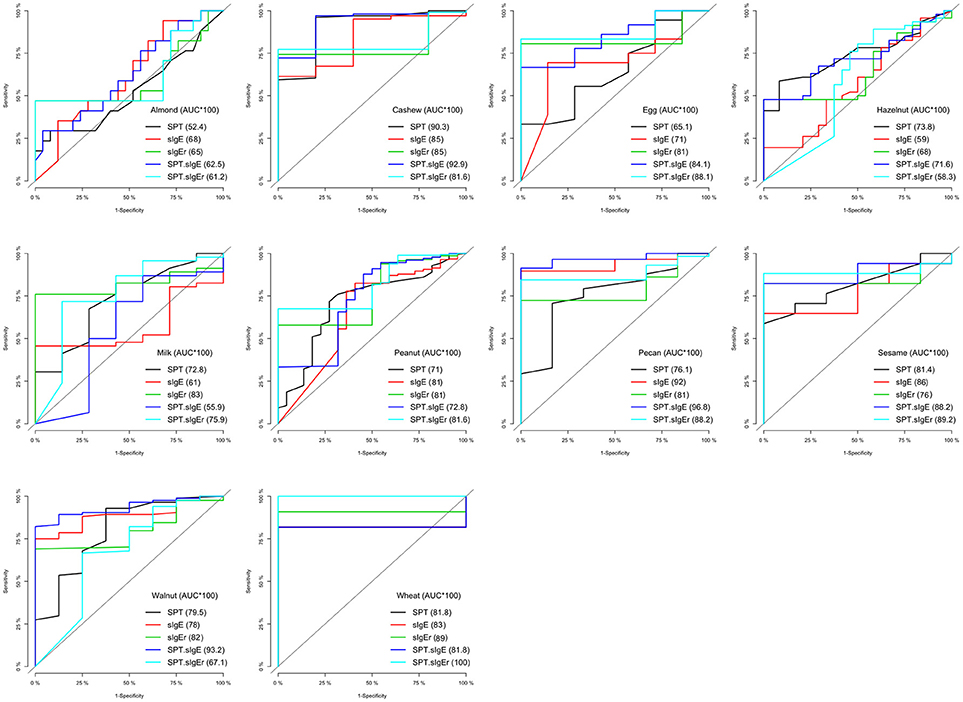
Figure 3. Logistic ROC comparisons of biomarker thresholds by allergen. Comparison of each biomarker to discriminate food challenge outcome. Higher area under the curve (AUC) suggests better discriminative ability. SPT, skin prick test; sIgE, specific Immunoglobin E, sIgEr, ratio of sIgE to total IgE.
CTD-Dependent ROC for Clinical Thresholds
ROC analyses were also conducted to assess for CTD and challenge outcome to account for the last tolerated dose in the food challenge outcome. Participants with SPTs above the calculated CTD-dependent thresholds were significantly more likely to not only have a positive challenge, but react at lower doses compared to those with values below the threshold for all foods except milk, egg, and wheat (Figure 4). AUCs for SPT ranged from 0.65 (almond) to 0.98 (cashew) (Table 6). Walnut had the lowest calculated SPT threshold of 4 mm and egg had the highest calculated SPT threshold of 13 mm. While thresholds chosen in the CTD-dependent ROC analysis were similar to those reported for the logistic ROC approach, AUCs were generally higher, though this difference was not significant, in the CTD-dependent ROCs.
FIGURE 4
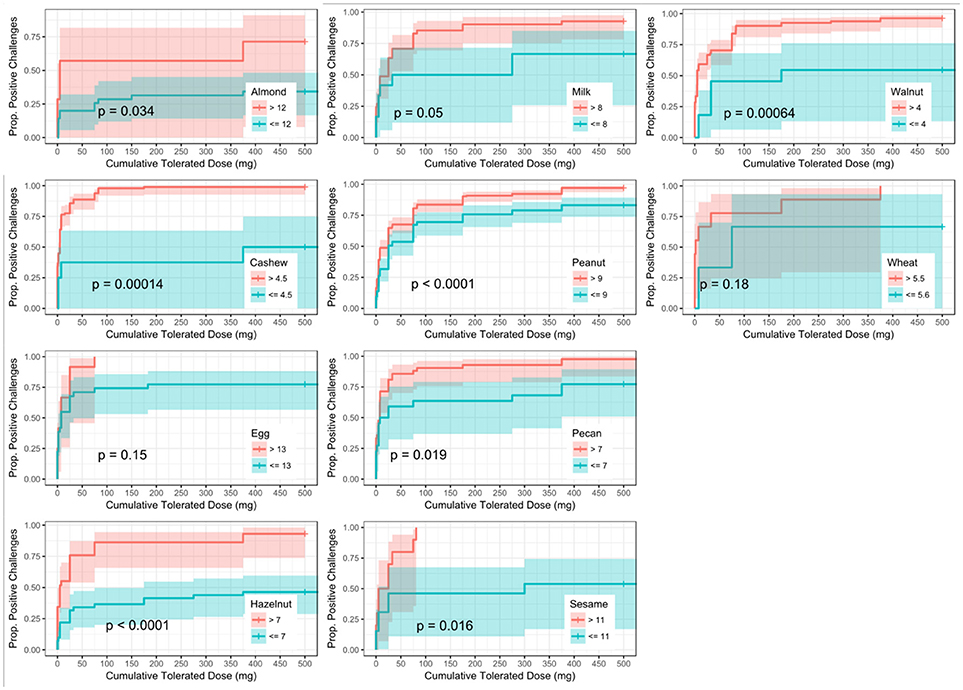
Figure 4. Dose to positive challenge by skin prick test (SPT) threshold and food. Kaplan-Meier curves of dose to positive challenge stratified by the CTD-dependent ROC thresholds for SPT by food. Red lines indicate risk of a positive challenge if SPT is above the threshold, while blue lines indicate risk for participants with SPT at or below the threshold.
TABLE 6
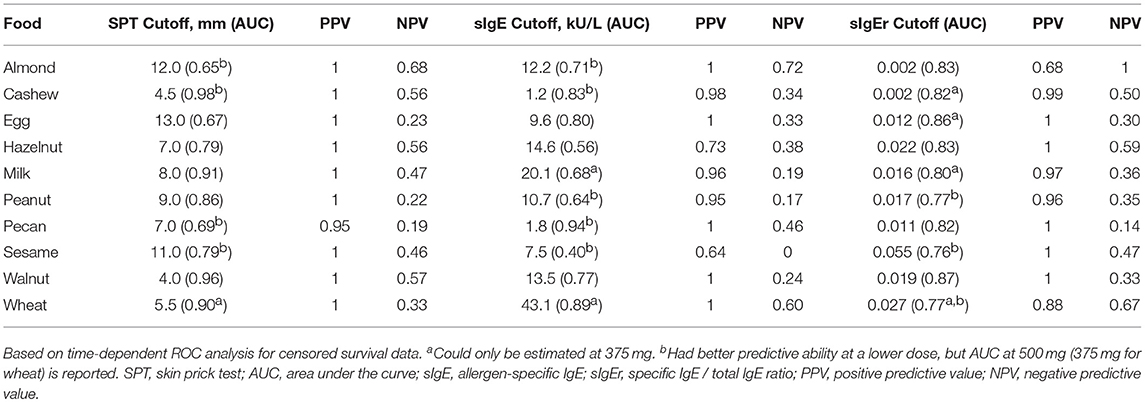
Table 6. CTD-dependent ROC thresholds at 500 mg CTD.
Similar to SPT, sIgE values above the threshold were associated with a lower dose to a positive outcome compared to those with values at or below the threshold (Figure 5). Cashew had the lowest calculated sIgE threshold of 1.2 kU/L, and wheat was the highest at 43.1 kU/L (Table 6). Cashew, pecan, and wheat thresholds had AUCs above 0.80. Hazelnut and sesame had the lowest AUCs. Threshold values were similar to those chosen through the logistic ROC analysis.
FIGURE 5
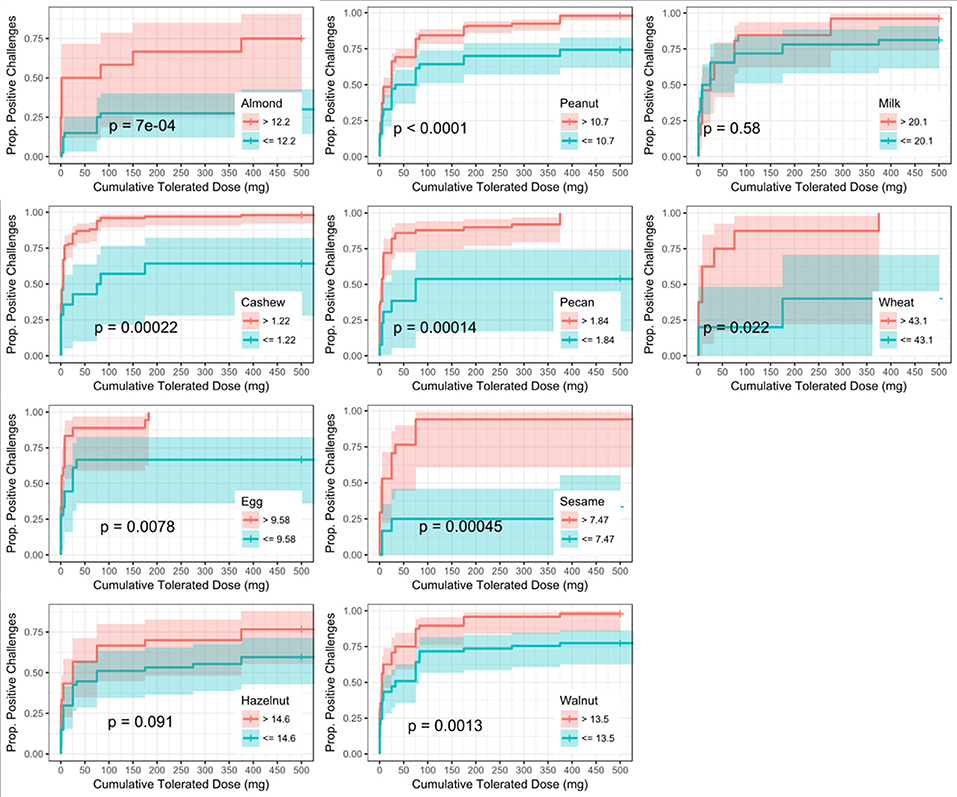
Figure 5. Dose to positive challenge by allergen-specific IgE (sIgE) threshold and food. Kaplan-Meier curves of dose to positive challenge stratified by the CTD-dependent ROC thresholds for sIgE by food. Red lines indicate risk of a positive challenge if sIgE is above the threshold, while blue lines indicate risk for participants with sIgE at or below the threshold.
Six of the ten derived sIgEr thresholds had AUCs above 0.80, with a lowest AUC of 0.76. At defined values SPT had the best predictive value compared to sIgE and sIgEr. The PPV for all tested foods was 1 except for pecan, which was 0.95. Within sIgE values, sesame was the lowest at 0.64. The sIgEr had a PPV range of 0.68 to 1 with almond having the lowest PPV (Table 6). As with SPT and sIgE, participants with sIgEr values below the threshold were less likely to have a positive challenge at the same CTD as someone with a value above the threshold (Figure 6). Significant risk stratification of food-specific challenge outcome by biomarker threshold was found in the majority of foods (Figures 4–6).
FIGURE 6
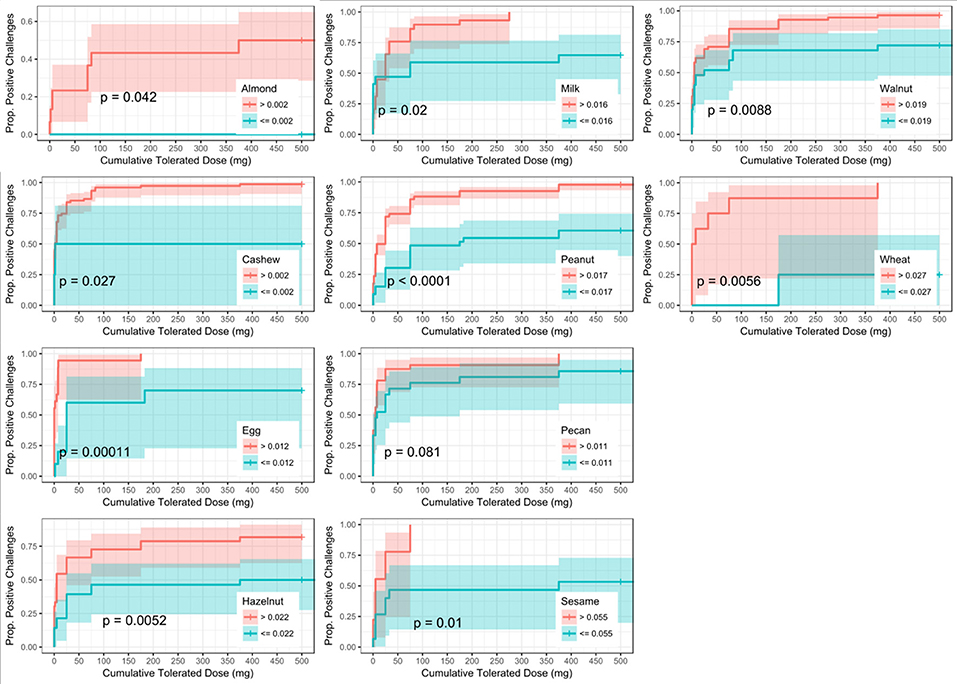
Figure 6. Dose to positive challenge by allergen-specific IgE to Total IgE ratio (sIgEr) threshold and food. Kaplan-Meier curves of dose to positive challenge stratified by the CTD-dependent ROC thresholds for sIgEr by food. Red lines indicate risk of a positive challenge if sIgEr is above the threshold, while blue lines indicate risk for participants with sIgEr at or below the threshold.
Among positive challenges, at least 60% of participants had SPT and sIgE values above the reported CTD-dependent thresholds for four of the ten allergens (cashew, peanut, pecan, and sesame), of which cashew displayed the highest level of SPT and sIgE threshold concordance at 90% (Figure 7). Among almond, egg, and wheat where accuracy was low, the SPT threshold was more likely to be negative when the sIgE threshold was positive. However, among milk and walnut, the SPT threshold was more likely to be positive when the sIgE threshold was negative. The overall agreement of SPT and sIgE thresholds was 65%. Half of the concordance rates for SPT and sIgEr were higher than those calculated for SPT and sIgE (Figure 8). The overall agreement of SPT and sIgEr thresholds was higher than that of SPT and sIgE with 72%.
FIGURE 7
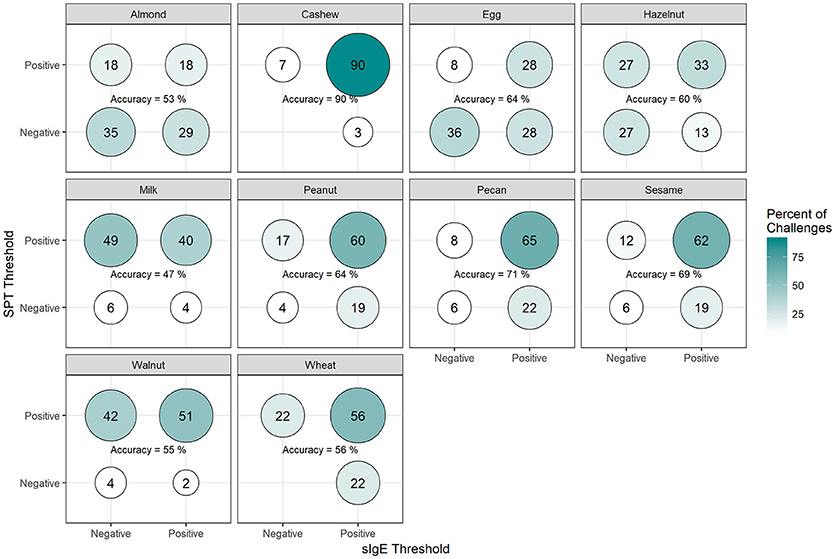
Figure 7. Concordance of skin prick test (SPT) and allergen-specific IgE (sIgE) CTD-dependent thresholds in positive challenges. Among participants with positive challenges, the percentage of participants with each combination of SPT and sIgE values above or below the CTD-dependent ROC thresholds by food. Percentages in each food add up to 100%. Accuracy is the percentage of SPT positive and sIgE positive plus the percentage of SPT negative and sIgE negative.
FIGURE 8
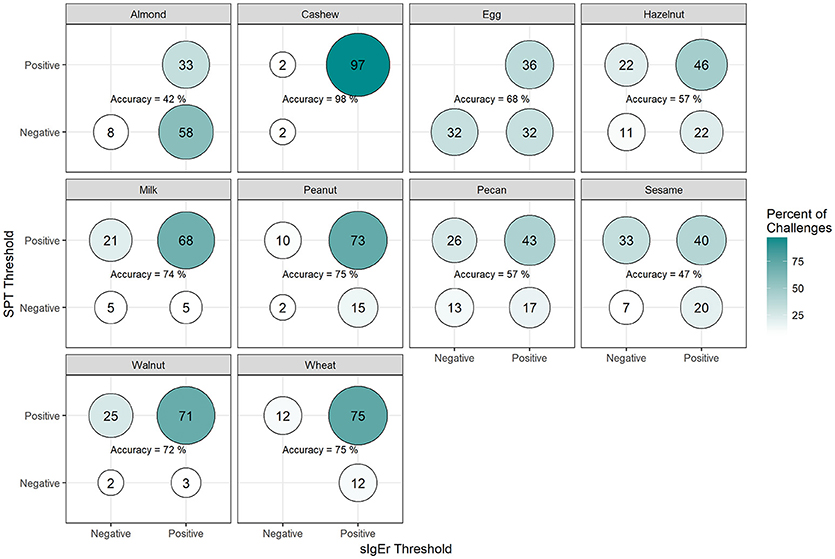
Figure 8. Concordance of skin prick test (SPT) and allergen-specific IgE to Total IgE ratio (sIgEr) CTD-dependent thresholds in positive challenges. Among participants with positive challenges, the percentage of participants with each combination of SPT and sIgEr values above or below the CTD-dependent ROC thresholds by food. Percentages in each food add up to 100%. Accuracy is the percentage of SPT positive and sIgEr positive plus the percentage of SPT negative and sIgEr negative.
Discussion
Presently, the gold standard for confirming food allergy remains the DBPCFC, especially in the research setting; however, the procedure can be time consuming, resource intensive, and carries the risk of life-threatening anaphylaxis (9, 10, 26, 27, 37). Recent studies have shown 40–70% of food allergic patients are allergic to more than one food (2), resulting in the need for multiple food challenges to prove or disprove each allergy. Additionally, positive reactions to placebo are not uncommon and can have a varied clinical presentation. In our experience, 12.7% of participants had positive placebo challenges, which is consistent with the published literature (38–44). In light of these significant burdens, there is a great need for a reliable method of diagnosing food allergies without food challenges, in addition to the ability to stratify participants according to potential risk in scenarios where a food challenge cannot be avoided.
Our large dataset of 1247 baseline OFCs allowed us to evaluate CTDs across several allergens and examine the utility of SPT, sIgE, sIgEr, and a combination of these markers in the prediction of food challenge outcome. SPTs and sIgE remain among the most widely used diagnostic markers for the evaluation of a suspected food allergy due to their simplicity and safety, with SPT providing nearly immediate results. Previous literature reports threshold values for each of these markers with high PPVs in the prediction of food challenge outcome and true food allergy (11, 45–50). We implemented similar methods to those described in the literature to derive optimal thresholds of SPT and sIgE for each individual allergen in our dataset. We further derived thresholds for the ratio of sIgE to tIgE to account for relative proportions of each allergen-specific IgE, which has yet to be evaluated in multi-food allergic patients. While a number of our calculated thresholds for SPT and sIgE values appeared to vary in relation to the thresholds at 95% PPV reported in the literature, differences in our cohort may be due to the fact that our participants are multi-food allergic (11, 45, 46, 49).
In addition to their use as individual predictors of food challenge outcome, prior studies have also assessed the utility of a combination of biomarkers (15, 51); however, to our knowledge, this is the first study to evaluate the utility of combining optimized threshold values for SPT with sIgE or sIgEr. While SPT had the highest PPV values compared to sIgE and sIgEr, the combination of SPT cut-off values with those for sIgE or sIgEr resulted in greater AUCs than SPT, sIgE, or sIgEr alone in the prediction of food challenge outcome. While previous data, mostly in the setting of allergen immunotherapy for allergic rhinitis, have demonstrated sIgEr to be promising as a predictive marker for clinical outcome (52–56), the ratio may have underperformed in our population due to limitations in the number of participants with both sIgE and tIgE values.
The methodology described above was also used in evaluating the association between specific allergens, baseline participant characteristics, and food challenge outcome. Our findings indicate that CTDs vary by allergen, suggesting that the use of identical dosing strategies for food challenges across all may not be the optimal, safest approach. Within our dataset, 50% of our participants had reactions before reaching the 10 mg dose for all foods, exluding almonds. When designing clinical trials that include food challenges, smaller incremental dose steps below 10 mg may aid in reducing the severity of reactions.
Additional findings from our dataset suggest that participants with a history of AD have an increased risk of a positive challenge outcome compared to those without a history of AD. While the presence of AD is often associated with a high rate of false-positives during food allergy testing, especially in children (57–59), our data suggests that among participants who are sensitized to one or more foods, those with a history of AD actually have a higher risk of a positive food challenge than those without a history. This is consistent with the current theory that the impaired skin barrier observed in those with AD may facilitate sensitization through environmental exposure to food allergens, and combined with avoidance of regular oral exposure, lead to true food allergy (60, 61). Although, previous literature has found asthma to be a significant predictor of severe reactions (51, 62), our data did not find asthma to be a significant factor associated with positive challenge outcome. Some studies have shown that age can affect IgE and SPT cutoff levels (22, 63, 64), with lower cutoffs typically used in children <2 years of age (65, 66), however our analysis did not reveal strong associations with age, SPT/sIgE/sIgEr cutoff levels and challenge outcomes. This is likely due to the limited number of participants aged <2 years who were challenged in our cohort.
Other studies have similarly explored factors in optimizing predictive outcome. In a retrospective study, DunnGavin et al. used a prognostic model that incorporated gender, age, and prior history of reaction in addition to sIgE, tIgE minus sIgE, and SPT. Their model accurately predicted OFC results 92% percent of the time (67). Cianferoni et al. conducted a retrospective chart review and used a multilogistic regression and discovered that age and history of prior non-cutaneous reactions, when combined with patient's SPT wheal size were predictive of multisystem reactions during food challenges. Simberloff et al. designed and implemented a Standardized Clinical Assessment and Management Plan (SCAMP) to improve sIgE and SPT thresholds to determine which patients would benefit from an OFC. While most studies for food allergy are focused on predictive models to distinguish between a positive or negative food challenge (10, 39, 68), our model also attempts to predict the dose at which a reaction may occur based on biomarkers. We utilized a novel approach to integrate the CTD with food challenge outcome when deriving optimally predictive SPT and sIgE threshold values. Our group has previously found this approach of adjusting for dose to be important in predicting OFC outcomes (62). The primary focus of our analysis was to determine whether the addition of CTD data with food challenge outcome would improve the diagnostic accuracy, as measured by AUC, of derived threshold values for available biomarkers when compared to a logistic ROC approach utilizing food challenge outcome alone. Our analysis did not reveal a statistical difference between these two approaches; however, incorporating CTD into the challenge outcome did allow for risk stratification and the generation of separate Kaplan–Meier curves for individuals with biomarker values above and below the generated thresholds, thus enabling a prediction of the cumulative protein dose that the individual will react to based on biomarker values (Figures 4–6). These findings are clinically useful, especially in the research setting, in that biomarker values above the threshold were associated with a positive outcome at a lower dose compared to those with biomarker values at or below the threshold. For instance, 50% of participants with an almond sIgE > 12.2 kU/L had a positive challenge by 5 mg CTD, compared to only about 16% of participants with almond sIgE < 12.2 kU/L. Therefore, during an oral challenge, clinicians may incorporate smaller dose increments during the early phase of a challenge for a participant with an sIgE above 12.2 kU/L compared to those below.
The results of our study are strengthened by the large sample size of included food challenges and our novel approach in calculating biomarker thresholds using dose-dependent ROC methodology. To qualify for certain trials the level of SPT and/or sIgE had to meet a certain threshold. Our cohort represents a highly allergic subset with high sIgE and SPT measurements, with values higher than what is typically encountered in the average clinical setting (15) but consistent with the baseline characteristics of patients in the research setting (69–71). sIgE values were capped at 101 kU/L, thus adding additional risk of skewing the sIgE and sIgEr to be falsely low. The thresholds reported in our analysis, though generally consistent with the previously reported thresholds in the literature, are relatively high for SPT, sIgE, and their combination (51); however, given the relatively high AUC levels for the majority of the reported individual and combined threshold values, the thresholds may be a reliable marker to use in clinical trials. In such a setting, the promising AUC levels may provide enough confidence to forego the need for food challenges in confirming allergy and determining study eligibility for a subset of participants. Some limitations of the study include the small sample size for several of the allergens (almond, sesame, and wheat). The results reported here should only be considered as hypothesis-driving and need to be validated in future studies involving larger trials.Our novel approach of utilizing CTD-dependent ROC to develop clinical thresholds was not statistically different than the more commonly used approach of thresholds calculated from logistic ROC; however, CTD-dependent approach allows for risk stratification and for predicting the challenge outcome based on biomarker values. Additionally, having multiple food allergies as well as a history of AD appears to increase the risk of a positive outcome during food challenges. The proposed thresholds may not be applicable for participants with biomarker values falling below the cut-off, and, thus, food challenges may still be unavoidable for such patients. There continues to be a need for newer biomarkers, such as BATs, component result diagnostics, and epigenetic markers, or combinations of these, which may be predictive tools across all allergens and should be considered in future studies.
Conclusion
For the diagnosis of true food allergy, an exact algorithm for determining when an OFC should be performed has yet to be found. Despite remaining the gold standard, food challenges demand significant time and resource requirements and place patients at risk for severe adverse events. As such, dedicated efforts have been made to identify alternative methods of diagnosis. Through our analyses of a large population of standardized food challenges across 11 different foods, we present SPT and sIgE values that are highly predictive of a positive challenge, suggesting food challenges may be unnecessary in the subset of patients with values falling above our reported cut-offs. Additionally our method allows for risk stratification to better predict the dose at which there may be a positive outcome based on biomarker values. While continued efforts will be needed to further refine and identify markers and diagnostic methods outside SPT and sIgE values that are able to fully replace the challenges used today, the ability to potentially forego challenges in the described subset of patients using readily obtainable biomarkers may be an improvement over the current standard of challenges for all patients participating in research.
Data Availability Statement
Data are available on request.
Ethics Statement
This study was carried out in accordance with the recommendations of ICH/GCP/CFR guidelines by the Stanford IRB with written informed consent from all subjects. All subjects gave written informed consent in accordance with the Declaration of Helsinki. The protocol was approved by the Stanford IRB.
Author Contributions
Study was designed by SSi, AJL, NP, KN and RSC; study was conducted by SSi, MW, AJL, DK, KN KO, RSC, AA, JP, JS, JT, ST, and JW; data collection and critical review of manuscript was conducted by AA, JP, JS, JT, ST, JW; data collection and analysis was conducted by MC, SS, SSi, NP, SA, DT, KN, and RSC; manuscript was written by SSi, AJL, NP, SJG, KN, and RSC.
Conflict of Interest Statement
The authors declare that the research was conducted in the absence of any commercial or financial relationships that could be construed as a potential conflict of interest.
Acknowledgments
We thank the National Institutes of Health (U19AI104209), the Sean N. Parker Center for Allergy and Asthma Research at Stanford University, Food Allergy Research and Education (FARE) Center of Excellence, Myra Reinhard Foundation, End Allergies Together (EAT), the Hartman Family Foundation, and the Naddisy Foundation. We thank Vanitha Sampath for her critical review of the manuscript and the subjects and their families for their participation in the study.
References
1. Savage J, Johns CB. Food allergy: epidemiology and natural history. Immunol Allergy Clin North Am. (2015) 35:45–59. doi: 10.1016/j.iac.2014.09.004
2. Gupta RS, Springston EE, Warrier MR, Smith B, Kumar R, Pongracic J, et al. The prevalence, severity, and distribution of childhood food allergy in the United States. Pediatrics (2011) 128:e9–17. doi: 10.1542/peds.2011-0204
3. Gupta RS, Kim JS, Barnathan JA, Amsden LB, Tummala LS, Holl JL. Food allergy knowledge, attitudes and beliefs: focus groups of parents, physicians and the general public. BMC Pediatr. (2008) 8:36. doi: 10.1186/1471-2431-8-36
4. Primeau MN, Kagan R, Joseph L, Lim H, Dufresne C, Duffy C, et al. The psychological burden of peanut allergy as perceived by adults with peanut allergy and the parents of peanut-allergic children. Clin Exp Allergy (2000) 30:1135–43. doi: 10.1046/j.1365-2222.2000.00889.x
5. Springston EE, Smith B, Shulruff J, Pongracic J, Holl J, Gupta RS. Variations in quality of life among caregivers of food allergic children. Ann Allergy Asthma Immunol. (2010) 105:287–94. doi: 10.1016/j.anai.2010.08.003
6. Avery NJ, King RM, Knight S, Hourihane JO. Assessment of quality of life in children with peanut allergy. Pediatr Allergy Immunol. (2003) 14:378–82. doi: 10.1034/j.1399-3038.2003.00072.x
7. Branum AM, Lukacs SL. Food allergy among children in the United States. Pediatrics (2009) 124:1549–55. doi: 10.1542/peds.2009-1210
8. Sicherer SH, Munoz-Furlong A, Godbold JH, Sampson HA. US prevalence of self-reported peanut, tree nut, and sesame allergy: 11-year follow-up. J Allergy Clin Immunol. (2010) 125:1322–6. doi: 10.1016/j.jaci.2010.03.029
10. Sampson HA, Aceves S, Bock SA, James J, Jones S, Lang D, et al. Food allergy: a practice parameter update-2014. J Allergy Clin Immunol. (2014) 134:1016–25.e43. doi: 10.1016/j.jaci.2014.05.013
11. Clark AT, Ewan PW. Interpretation of tests for nut allergy in one thousand patients, in relation to allergy or tolerance. Clin Exp Allergy (2003) 33:1041–5. doi: 10.1046/j.1365-2745.2003.01624.x
12. Perry TT, Matsui EC, Kay Conover-Walker M, Wood RA. The relationship of allergen-specific IgE levels and oral food challenge outcome. J Allergy Clin Immunol. (2004) 114:144–9. doi: 10.1016/j.jaci.2004.04.009
13. Peters RL, Gurrin LC, Allen KJ. The predictive value of skin prick testing for challenge-proven food allergy: a systematic review. Pediatr Allergy Immunol. (2012) 23:347–52. doi: 10.1111/j.1399-3038.2011.01237.x
14. Beigelman A, Strunk RC, Garbutt JM, Schechtman KB, Jaenicke MW, Stein JS, et al. Clinical and laboratory factors associated with negative oral food challenges. Allergy Asthma Proc. (2012) 33:467–73. doi: 10.2500/aap.2012.33.3607
15. DunnGalvin A, Daly D, Cullinane C, Stenke E, Keeton D, Erlewyn-Lajeunesse M, et al. Highly accurate prediction of food challenge outcome using routinely available clinical data. J Allergy Clin Immunol. (2011) 127:633–9.e1-3. doi: 10.1016/j.jaci.2010.12.004
16. Rolinck-Werninghaus C, Niggemann B, Grabenhenrich L, Wahn U, Beyer K. Outcome of oral food challenges in children in relation to symptom-eliciting allergen dose and allergen-specific IgE. Allergy (2012) 67:951–7. doi: 10.1111/j.1398-9995.2012.02838.x
17. Sampson HA, Ho DG. Relationship between food-specific IgE concentrations and the risk of positive food challenges in children and adolescents. J Allergy Clin Immunol. (1997) 100:444–51.
18. Calvani M, Berti I, Fiocchi A, Galli E, Giorgio V, Martelli A, et al. Oral food challenge: safety, adherence to guidelines and predictive value of skin prick testing. Pediatr Allergy Immunol. (2012) 23:755–61. doi: 10.1111/pai.12016
19. Celik-Bilgili S, Mehl A, Verstege A, Staden U, Nocon M, Beyer K, et al. The predictive value of specific immunoglobulin E levels in serum for the outcome of oral food challenges. Clin Exp Allergy (2005) 35:268–73. doi: 10.1111/j.1365-2222.2005.02150.x
20. Eigenmann PA. Are specific immunoglobulin E titres reliable for prediction of food allergy? Clin Exp Allergy (2005) 35:247–9. doi: 10.1111/j.1365-2222.2005.02183.x
21. Verstege A, Mehl A, Rolinck-Werninghaus C, Staden U, Nocon M, Beyer K, et al. The predictive value of the skin prick test weal size for the outcome of oral food challenges. Clin Exp Allergy (2005) 35:1220–6. doi: 10.1111/j.1365-2222.2005.2324.x
22. Knight AK, Shreffler WG, Sampson HA, Sicherer SH, Noone S, Mofidi S, et al. Skin prick test to egg white provides additional diagnostic utility to serum egg white-specific IgE antibody concentration in children. J Allergy Clin Immunol. (2006) 117:842–7. doi: 10.1016/j.jaci.2005.12.1304.
23. Gupta RS, Walkner MM, Greenhawt M, Lau CH, Caruso D, Wang X, et al. Food allergy sensitization and presentation in siblings of food allergic children. J Allergy Clin Immunol Pract. (2016) 4:956–62. doi: 10.1016/j.jaip.2016.04.009
24. Sindher SB, Long A, Acharya S, Sampath V, Nadeau KC. The use of biomarkers to predict aero-allergen and food immunotherapy responses. Clin Rev Allergy Immunol. (2018). doi: 10.1007/s12016-018-8678-z
25. Sampson HA, Gerth van Wijk R, Bindslev-Jensen C, Sicherer S, Teuber SS, Burks AW, et al. Standardizing double-blind, placebo-controlled oral food challenges: American Academy of Allergy, Asthma & Immunology-European Academy of Allergy and Clinical Immunology PRACTALL consensus report. J Allergy Clin Immunol. (2012) 130:1260–74. doi: 10.1016/j.jaci.2012.10.017
26. Cianferoni A, Khullar K, Saltzman R, Fiedler J, Garrett JP, Naimi DR, et al. Oral food challenge to wheat: a near-fatal anaphylaxis and review of 93 food challenges in children. World Allergy Organ J. (2013) 6:14. doi: 10.1186/1939-4551-6-14
27. Bock SA, Sampson HA, Atkins FM, Zeiger RS, Lehrer S, Sachs M, et al. Double-blind, placebo-controlled food challenge (DBPCFC) as an office procedure: a manual. J Allergy Clin Immunol. (1988) 82:986–97. doi: 10.1016/0091-6749(88)90135-2
28. Boyce JA, Assa'ad A, Burks AW, Jones SM, Sampson HA, Wood RA, et al. Guidelines for the diagnosis and management of food allergy in the United States: report of the NIAID-sponsored expert panel. J Allergy Clin Immunol. (2010) 126:S1-58. doi: 10.1016/j.jaci.2010.10.007
29. Kassambara A, Kosinski M. survminer: drawing survival curves using 'ggplot2'. R package version 0.4.2 (2018). Available onlinr at: https://CRAN.R-project.org/package=survminer
30. Therneau TM. Coxme: Mixed Effects Cox Models. R package version 2.2-7. (2018). Available online at: https://CRAN.R-project.org/package=coxme
31. Lopez-Raton M, Rodriguez-Alvarez MX, Suarez CC, Sampedro FG. OptimalCutpoints: an R package for selecting optimal cutpoints in diagnostic tests. J. Stat. Softw. (2014) 61:1–36. doi: 10.18637/jss.v061.i08
32. Ruopp MD, Perkins NJ, Whitcomb BW, Schisterman EF. Youden Index and optimal cut-point estimated from observations affected by a lower limit of detection. Biom J. (2008) 50:419–30. doi: 10.1002/bimj.200710415
33. Gerds TA. ModelGood: validation of risk prediction models. R package version 1.0.9. (2014). Available online at: https://CRAN.R-project.org/package=ModelGood
34. Heagerty PJ, Saha-Chaudhuri P. survivalROC: time-dependent ROC curve estimation from censored survival data. R package version 1.0.3. (2013). Available online at: https://CRAN.R-project.org/package=survivalROC
35. Blanche P, Dartigues JF, Jacqmin-Gadda H. Estimating and comparing time-dependent areas under receiver operating characteristic curves for censored event times with competing risks. Stat Med. (2013) 32:5381–97. doi: 10.1002/sim.5958
36. Team RC,. R: A Language Environment for Statistical Computing. Vienna: R Foundation for Statistical computing (2017). Available online at: https://www.R-project.org/
37. Santos AF, Gomes-Belo J, Hannachi F, Swan K. Advances in food allergy diagnosis. Curr Pediatr Rev. (2018) 14:139–149. doi: 10.2174/1573396314666180423105842
38. Ballmer-Weber BK, Vieths S, Luttkopf D, Heuschmann P, Wuthrich B. Celery allergy confirmed by double-blind, placebo-controlled food challenge: a clinical study in 32 subjects with a history of adverse reactions to celery root. J Allergy Clin Immunol. (2000) 106:373–8. doi: 10.1067/mai.2000.107196
39. Ballmer-Weber BK, Wuthrich B, Wangorsch A, Fotisch K, Altmann F, Vieths S. Carrot allergy: double-blinded, placebo-controlled food challenge and identification of allergens. J Allergy Clin Immunol. (2001) 108:301–7. doi: 10.1067/mai.2001.116430
40. Hourihane JB, Kilburn SA, Nordlee JA, Hefle SL, Taylor SL, Warner JO. An evaluation of the sensitivity of subjects with peanut allergy to very low doses of peanut protein: a randomized, double-blind, placebo-controlled food challenge study. J Allergy Clin Immunol. (1997) 100:596–600.
41. Ortolani C, Ballmer-Weber BK, Hansen KS, Ispano M, Wuthrich B, Bindslev-Jensen C, et al. Hazelnut allergy: a double-blind, placebo-controlled food challenge multicenter study. J Allergy Clin Immunol. (2000) 105:577–81. doi: 10.1067/mai.2000.103052
42. Vlieg-Boerstra BJ, van der Heide S, Bijleveld CM, Kukler J, Duiverman EJ, Dubois AE. Placebo reactions in double-blind, placebo-controlled food challenges in children. Allergy (2007) 62:905–12. doi: 10.1111/j.1398-9995.2007.01430.x
43. Wensing M, Penninks AH, Hefle SL, Akkerdaas JH, van Ree R, Koppelman SJ, et al. The range of minimum provoking doses in hazelnut-allergic patients as determined by double-blind, placebo-controlled food challenges. Clin Exp Allergy (2002) 32:1757–62. doi: 10.1046/j.1365-2222.2002.01555.x
44. Wensing M, Penninks AH, Hefle SL, Koppelman SJ, Bruijnzeel-Koomen CA, Knulst AC. The distribution of individual threshold doses eliciting allergic reactions in a population with peanut allergy. J Allergy Clin Immunol. (2002) 110:915–20. doi: 10.1067/mai.2002.129235
45. Sicherer SH, Sampson HA. Food allergy: epidemiology, pathogenesis, diagnosis, and treatment. J Allergy Clin Immunol. (2014) 133:291–307; quiz 8. doi: 10.1016/j.jaci.2013.11.020
46. Kido J, Hirata M, Ueno H, Nishi N, Mochinaga M, Ueno Y, et al. Evaluation of the skin-prick test for predicting the outgrowth of cow's milk allergy. Allergy Rhinol. (2016) 7:139–43. doi: 10.2500/ar.2016.7.0175.
47. Calvani M, Arasi S, Bianchi A, Caimmi D, Cuomo B, Dondi A, et al. Is it possible to make a diagnosis of raw, heated, and baked egg allergy in children using cutoffs? A systematic review. Pediatr Allergy Immunol. (2015) 26:509–21. doi: 10.1111/pai.12432
48. Sampson HA. Utility of food-specific IgE concentrations in predicting symptomatic food allergy. J Allergy Clin Immunol. (2001) 107:891–6. doi: 10.1067/mai.2001.114708
49. Adatia A, Clarke AE, Yanishevsky Y, Ben-Shoshan M. Sesame allergy: current perspectives. J Asthma Allergy (2017) 10:141–51. doi: 10.2147/jaa.s113612
50. Pariyaprasert W, Piboonpocanun S, Jirapongsananuruk O, Visitsunthorn N. Stability and potency of raw and boiled shrimp extracts for skin prick test. Asian Pac J Allergy Immunol. (2015) 33:136–42. doi: 10.12932/AP0530.33.2.2015
51. Simberloff T, Parambi R, Bartnikas LM, Broyles AD, Hamel V, Timmons KG, et al. Implementation of a Standardized Clinical Assessment and Management Plan (SCAMP) for food challenges. J Allergy Clin Immunol Pract. (2017) 5:335–44.e3. doi: 10.1016/j.jaip.2016.05.021
52. Eifan AO, Akkoc T, Yildiz A, Keles S, Ozdemir C, Bahceciler NN, et al. Clinical efficacy and immunological mechanisms of sublingual and subcutaneous immunotherapy in asthmatic/rhinitis children sensitized to house dust mite: an open randomized controlled trial. Clin Exp Allergy (2010) 40:922–32. doi: 10.1111/j.1365-2222.2009.03448.x
53. Di Lorenzo G, Mansueto P, Pacor ML, Rizzo M, Castello F, Martinelli N, et al. Evaluation of serum s-IgE/total IgE ratio in predicting clinical response to allergen-specific immunotherapy. J Allergy Clin Immunol. (2009) 123:1103–10, 10.e1-4. doi: 10.1016/j.jaci.2009.02.012
54. Li Q, Li M, Yue W, Zhou J, Li R, Lin J, et al. Predictive factors for clinical response to allergy immunotherapy in children with asthma and rhinitis. Int Arch Allergy Immunol. (2014) 164:210–7. doi: 10.1159/000365630
55. Van Overtvelt L, Baron-Bodo V, Horiot S, Moussu H, Ricarte C, Horak F, et al. Changes in basophil activation during grass-pollen sublingual immunotherapy do not correlate with clinical efficacy. Allergy (2011) 66:1530–7. doi: 10.1111/j.1398-9995.2011.02696.x
56. Wurtzen PA, Lund G, Lund K, Arvidsson M, Rak S, Ipsen H. A double-blind placebo-controlled birch allergy vaccination study II: correlation between inhibition of IgE binding, histamine release and facilitated allergen presentation. Clin Exp Allergy (2008) 38:1290–301. doi: 10.1111/j.1365-2222.2008.03020.x
57. Jensen-Jarolim E, Jensen AN, Canonica GW. Debates in allergy medicine: molecular allergy diagnosis with ISAC will replace screenings by skin prick test in the future. World Allergy Organ J. (2017) 10:33. doi: 10.1186/s40413-017-0162-3
58. Ram G, Cianferoni A, Spergel JM. Food allergy to uncommonly challenged foods is rare based on oral food challenge. J Allergy Clin Immunol Pract. (2016) 4:156–7 e5. doi: 10.1016/j.jaip.2015.07.017
59. Fleischer DM, Bock SA, Spears GC, Wilson CG, Miyazawa NK, Gleason MC, et al. Oral food challenges in children with a diagnosis of food allergy. J Pediatr. (2011) 158:578–83.e1. doi: 10.1016/j.jpeds.2010.09.027
60. Dharmage SC, Lowe AJ, Matheson MC, Burgess JA, Allen KJ, Abramson MJ. Atopic dermatitis and the atopic march revisited. Allergy (2014) 69:17–27. doi: 10.1111/all.12268
61. Lowe AJ, Su JC, Allen KJ, Abramson MJ, Cranswick N, Robertson CF, et al. A randomized trial of a barrier lipid replacement strategy for the prevention of atopic dermatitis and allergic sensitization: the PEBBLES pilot study. Br J Dermatol. (2018) 178:e19–e21. doi: 10.1111/bjd.15747
62. Chinthrajah RS, Purington N, Andorf S, Rosa JS, Mukai K, Hamilton R, et al. Development of a tool predicting severity of allergic reaction during peanut challenge. Ann Allergy Asthma Immunol. (2018) 121:69–76.e2. doi: 10.1016/j.anai.2018.04.020
63. Garcia-Ara C, Boyano-Martinez T, Diaz-Pena JM, Martin-Munoz F, Reche-Frutos M, Martin-Esteban M. Specific IgE levels in the diagnosis of immediate hypersensitivity to cows' milk protein in the infant. J Allergy Clin Immunol. (2001) 107:185–90. doi: 10.4172/2155-9600.1000350
64. Hill DJ, Heine RG, Hosking CS. The diagnostic value of skin prick testing in children with food allergy. Pediatr Allergy Immunol. (2004) 15:435–41. doi: 10.1111/j.1399-3038.2004.00188.x
65. Boyano-Martinez T, Garcia-Ara C, Diaz-Pena JM, Martin-Esteban M. Prediction of tolerance on the basis of quantification of egg white-specific IgE antibodies in children with egg allergy. J Allergy Clin Immunol. (2002) 110:304–9. doi: 10.1067/mai.2002.126081
66. Komata T, Soderstrom L, Borres MP, Tachimoto H, Ebisawa M. The predictive relationship of food-specific serum IgE concentrations to challenge outcomes for egg and milk varies by patient age. J Allergy Clin Immunol. (2007) 119:1272–4. doi: 10.1016/j.jaci.2007.01.038
67. Cianferoni A, Garrett JP, Naimi DR, Khullar K, Spergel JM. Predictive values for food challenge-induced severe reactions: development of a simple food challenge score. Isr Med Assoc J. (2012) 14:24–8.
68. Sporik R, Hill DJ, Hosking CS. Specificity of allergen skin testing in predicting positive open food challenges to milk, egg and peanut in children. Clin Exp Allergy (2000) 30:1540–6. doi: 10.1046/j.1365-2222.2000.00928.x
69. Burks AW, Jones SM, Wood RA, Fleischer DM, Sicherer SH, Lindblad RW, et al. Oral immunotherapy for treatment of egg allergy in children. N Engl J Med. (2012) 367:233–43. doi: 10.1056/NEJMoa1200435
70. Virkud YV, Burks AW, Steele PH, Edwards LJ, Berglund JP, Jones SM, et al. Novel baseline predictors of adverse events during oral immunotherapy in children with peanut allergy. J Allergy Clin Immunol. (2017) 139:882–8.e5. doi: 10.1016/j.jaci.2016.07.030
Keywords: food challenge, cumulative tolerated dose, AUC, biomarker evaluation, time-dependent ROC
Citation: Sindher S, Long AJ, Purington N, Chollet M, Slatkin S, Andorf S, Tupa D, Kumar D, Woch MA, O'Laughlin KL, Assaad A, Pongracic J, Spergel JM, Tam J, Tilles S, Wang J, Galli SJ, Nadeau KC and Chinthrajah RS (2018) Analysis of a Large Standardized Food Challenge Data Set to Determine Predictors of Positive Outcome Across Multiple Allergens. Front. Immunol. 9:2689. doi: 10.3389/fimmu.2018.02689
Received: 03 July 2018; Accepted: 31 October 2018;
Published: 27 November 2018.
Edited by:
Vida Abedi, Geisinger Health System, United StatesReviewed by:
Xi Ma, China Agricultural University, ChinaNicolò Merendino, Università degli Studi della Tuscia, Italy
Copyright © 2018 Sindher, Long, Purington, Chollet, Slatkin, Andorf, Tupa, Kumar, Woch, O'Laughlin, Assaad, Pongracic, Spergel, Tam, Tilles, Wang, Galli, Nadeau and Chinthrajah. This is an open-access article distributed under the terms of the Creative Commons Attribution License (CC BY). The use, distribution or reproduction in other forums is permitted, provided the original author(s) and the copyright owner(s) are credited and that the original publication in this journal is cited, in accordance with accepted academic practice. No use, distribution or reproduction is permitted which does not comply with these terms.
*Correspondence: R. Sharon Chinthrajah, schinths@stanford.edu