 Barbara J. H. Verhaar1,2,3*
 Heleen M. A. Hendriksen3
 Francisca A. de Leeuw3Astrid S. Doorduijn3Mardou van Leeuwenstijn3
 Charlotte E. Teunissen4Frederik Barkhof5,6Philip Scheltens3
 Robert Kraaij7
 Cornelia M. van Duijn8,9
 Max Nieuwdorp2Majon Muller1Wiesje M. van der Flier3,10
- 1Department of Internal Medicine - Geriatrics, Amsterdam Cardiovascular Sciences, Amsterdam University Medical Center (UMC), Amsterdam, Netherlands
- 2Department of Internal and Vascular Medicine, Amsterdam University Medical Center (UMC), Amsterdam, Netherlands
- 3Alzheimer Center, Department of Neurology, Amsterdam Neuroscience, Amsterdam University Medical Center (UMC), Amsterdam, Netherlands
- 4Department of Clinical Chemistry, Amsterdam University Medical Center (UMC), Amsterdam, Netherlands
- 5Department of Radiology and Nuclear Medicine, Amsterdam University Medical Center (UMC), Amsterdam, Netherlands
- 6University College London (UCL) Institutes of Neurology, Faculty of Brain Sciences, London, United Kingdom
- 7Department of Internal Medicine, Erasmus Medical Center (MC), Rotterdam, Netherlands
- 8Department of Epidemiology, Erasmus Medical Center (MC), Rotterdam, Netherlands
- 9Nuffield Department of Population Health, University of Oxford, Oxford, United Kingdom
- 10Department of Epidemiology and Data Science, Amsterdam University Medical Center (UMC), Vrije Universiteit Amsterdam, Amsterdam, Netherlands
Introduction: Several studies have reported alterations in gut microbiota composition of Alzheimer’s disease (AD) patients. However, the observed differences are not consistent across studies. We aimed to investigate associations between gut microbiota composition and AD biomarkers using machine learning models in patients with AD dementia, mild cognitive impairment (MCI) and subjective cognitive decline (SCD).
Materials and Methods: We included 170 patients from the Amsterdam Dementia Cohort, comprising 33 with AD dementia (66 ± 8 years, 46%F, mini-mental state examination (MMSE) 21[19-24]), 21 with MCI (64 ± 8 years, 43%F, MMSE 27[25-29]) and 116 with SCD (62 ± 8 years, 44%F, MMSE 29[28-30]). Fecal samples were collected and gut microbiome composition was determined using 16S rRNA sequencing. Biomarkers of AD included cerebrospinal fluid (CSF) amyloid-beta 1-42 (amyloid) and phosphorylated tau (p-tau), and MRI visual scores (medial temporal atrophy, global cortical atrophy, white matter hyperintensities). Associations between gut microbiota composition and dichotomized AD biomarkers were assessed with machine learning classification models. The two models with the highest area under the curve (AUC) were selected for logistic regression, to assess associations between the 20 best predicting microbes and the outcome measures from these machine learning models while adjusting for age, sex, BMI, diabetes, medication use, and MMSE.
Results: The machine learning prediction for amyloid and p-tau from microbiota composition performed best with AUCs of 0.64 and 0.63. Highest ranked microbes included several short chain fatty acid (SCFA)-producing species. Higher abundance of [Clostridium] leptum and lower abundance of [Eubacterium] ventriosum group spp., Lachnospiraceae spp., Marvinbryantia spp., Monoglobus spp., [Ruminococcus] torques group spp., Roseburia hominis, and Christensenellaceae R-7 spp., was associated with higher odds of amyloid positivity. We found associations between lower abundance of Lachnospiraceae spp., Lachnoclostridium spp., Roseburia hominis and Bilophila wadsworthia and higher odds of positive p-tau status.
Conclusions: Gut microbiota composition was associated with amyloid and p-tau status. We extend on recent studies that observed associations between SCFA levels and AD CSF biomarkers by showing that lower abundances of SCFA-producing microbes were associated with higher odds of positive amyloid and p-tau status.
Introduction
Alzheimer’s disease (AD) is the most common cause of dementia, and is characterized by the accumulation of amyloid beta in plaques and the formation of neurofibrillary tangles including hyperphosphorylated tau (p-tau). Another hallmark is chronic neuroinflammation, which is reflected by activation of microglia and increased cytokine production (1). The gut microbiome has been shown to interact with the innate and adaptive immune system, by release of bacterial toxins and production of metabolites (2, 3). As has been shown in other neurological conditions such as multiple sclerosis (4, 5), gut microbiota could affect neuroinflammation.
The gut is populated with trillions of microbiota, including bacteria, viruses, fungi, archaea and protozoa (6). Collectively, the genomes of these cells are referred to as the gut microbiome. The microbiota composition is affected by dietary factors, age, sex, body mass index (BMI) and medication use, including antibiotics, metformin, proton pump inhibitors and statins (7). Gut microbiota live in symbiosis with the host and are needed for the degradation of macronutrients and production of metabolites (8, 9). Short chain fatty acids (SCFAs) are key metabolites of the gut microbiota, which are produced by fermentation of indigestible dietary fibers (10).
Animal studies have reported differences in gut microbiota composition between AD and wild-type mice, including a decrease in SCFA-producing microbes (11, 12). Fecal microbiota transplantation from wild type mice to AD-like animal models such as APP/PS1 and ADLPAPT mice resulted in a reduction of amyloid, suggesting a causal relation between gut microbes and AD (12, 13). Colonization of Tg2576 mice with Bacteroides exacerbates amyloid depositions, suggesting a mechanism for the impact of gut microbiota on AD pathology (14). In addition, an intervention with sodium butyrate, an SCFA, in an AD mice model resulted in a reduction of AD pathology (15).
In line with these animal studies, five human studies observed alterations in microbiota composition in patients with AD or mild cognitive impairment (MCI) compared to controls, with a lower abundance of SCFA-producing species in patients with AD (16–20). However, the nature of the specific microbiota alterations was conflicting across studies, with for instance lower (16, 19, 20) and higher (17) abundance of Ruminococcaceae spp., and lower (17) and higher (16, 18, 19) abundance of the Bacteroidetes phylum of MCI or AD patients compared to controls. In addition, former studies did not take into account AD pathology as measured with AD biomarkers (17–20), while studies that did focused on a limited set of microbes for these analyses (16, 21).
Hence, we aimed to assess the relation between gut microbiota composition, as measured with 16S rRNA sequencing, and biomarkers of AD pathology, including CSF biomarkers and MRI measures of vascular burden and neurodegeneration, in a memory clinic population with AD dementia, mild cognitive impairment (MCI) and subjective cognitive decline (SCD).
Methods
Study Population
We invited 223 study participants from the Amsterdam Dementia Cohort and SCIENCe project, for fecal sample collection. All invited participants were diagnosed with AD dementia, MCI or SCD and had mini-mental state examination (MMSE) scores higher than 16. Of the invited participants, 175 subjects collected samples, and 170 subjects could be included in our analyses (Figure 1), comprising 33 patients with AD, 22 patients with MCI and 120 subjects with SCD (23–25). All patients underwent comprehensive neuropsychological assessment, neurological examination, lumbar puncture and MRI as part of a standard dementia screening (23). MCI and AD diagnoses were established by consensus in a multidisciplinary meeting according to the National Institute on Aging-Alzheimer’s Association criteria (26, 27). Subjects with SCD presented with memory complaints but performed normal on cognitive examinations and did not fulfill criteria for MCI, dementia, psychiatric diagnoses or other neurological diagnoses (23). Patients were seen annually for follow-up visits, during which cognitive assessments and medical examinations were repeated. Prior to these follow-up visits, patients were asked to collect fecal samples. The study protocol was approved by the Ethics Committee of the Amsterdam UMC, and all study participants provided written informed consent.
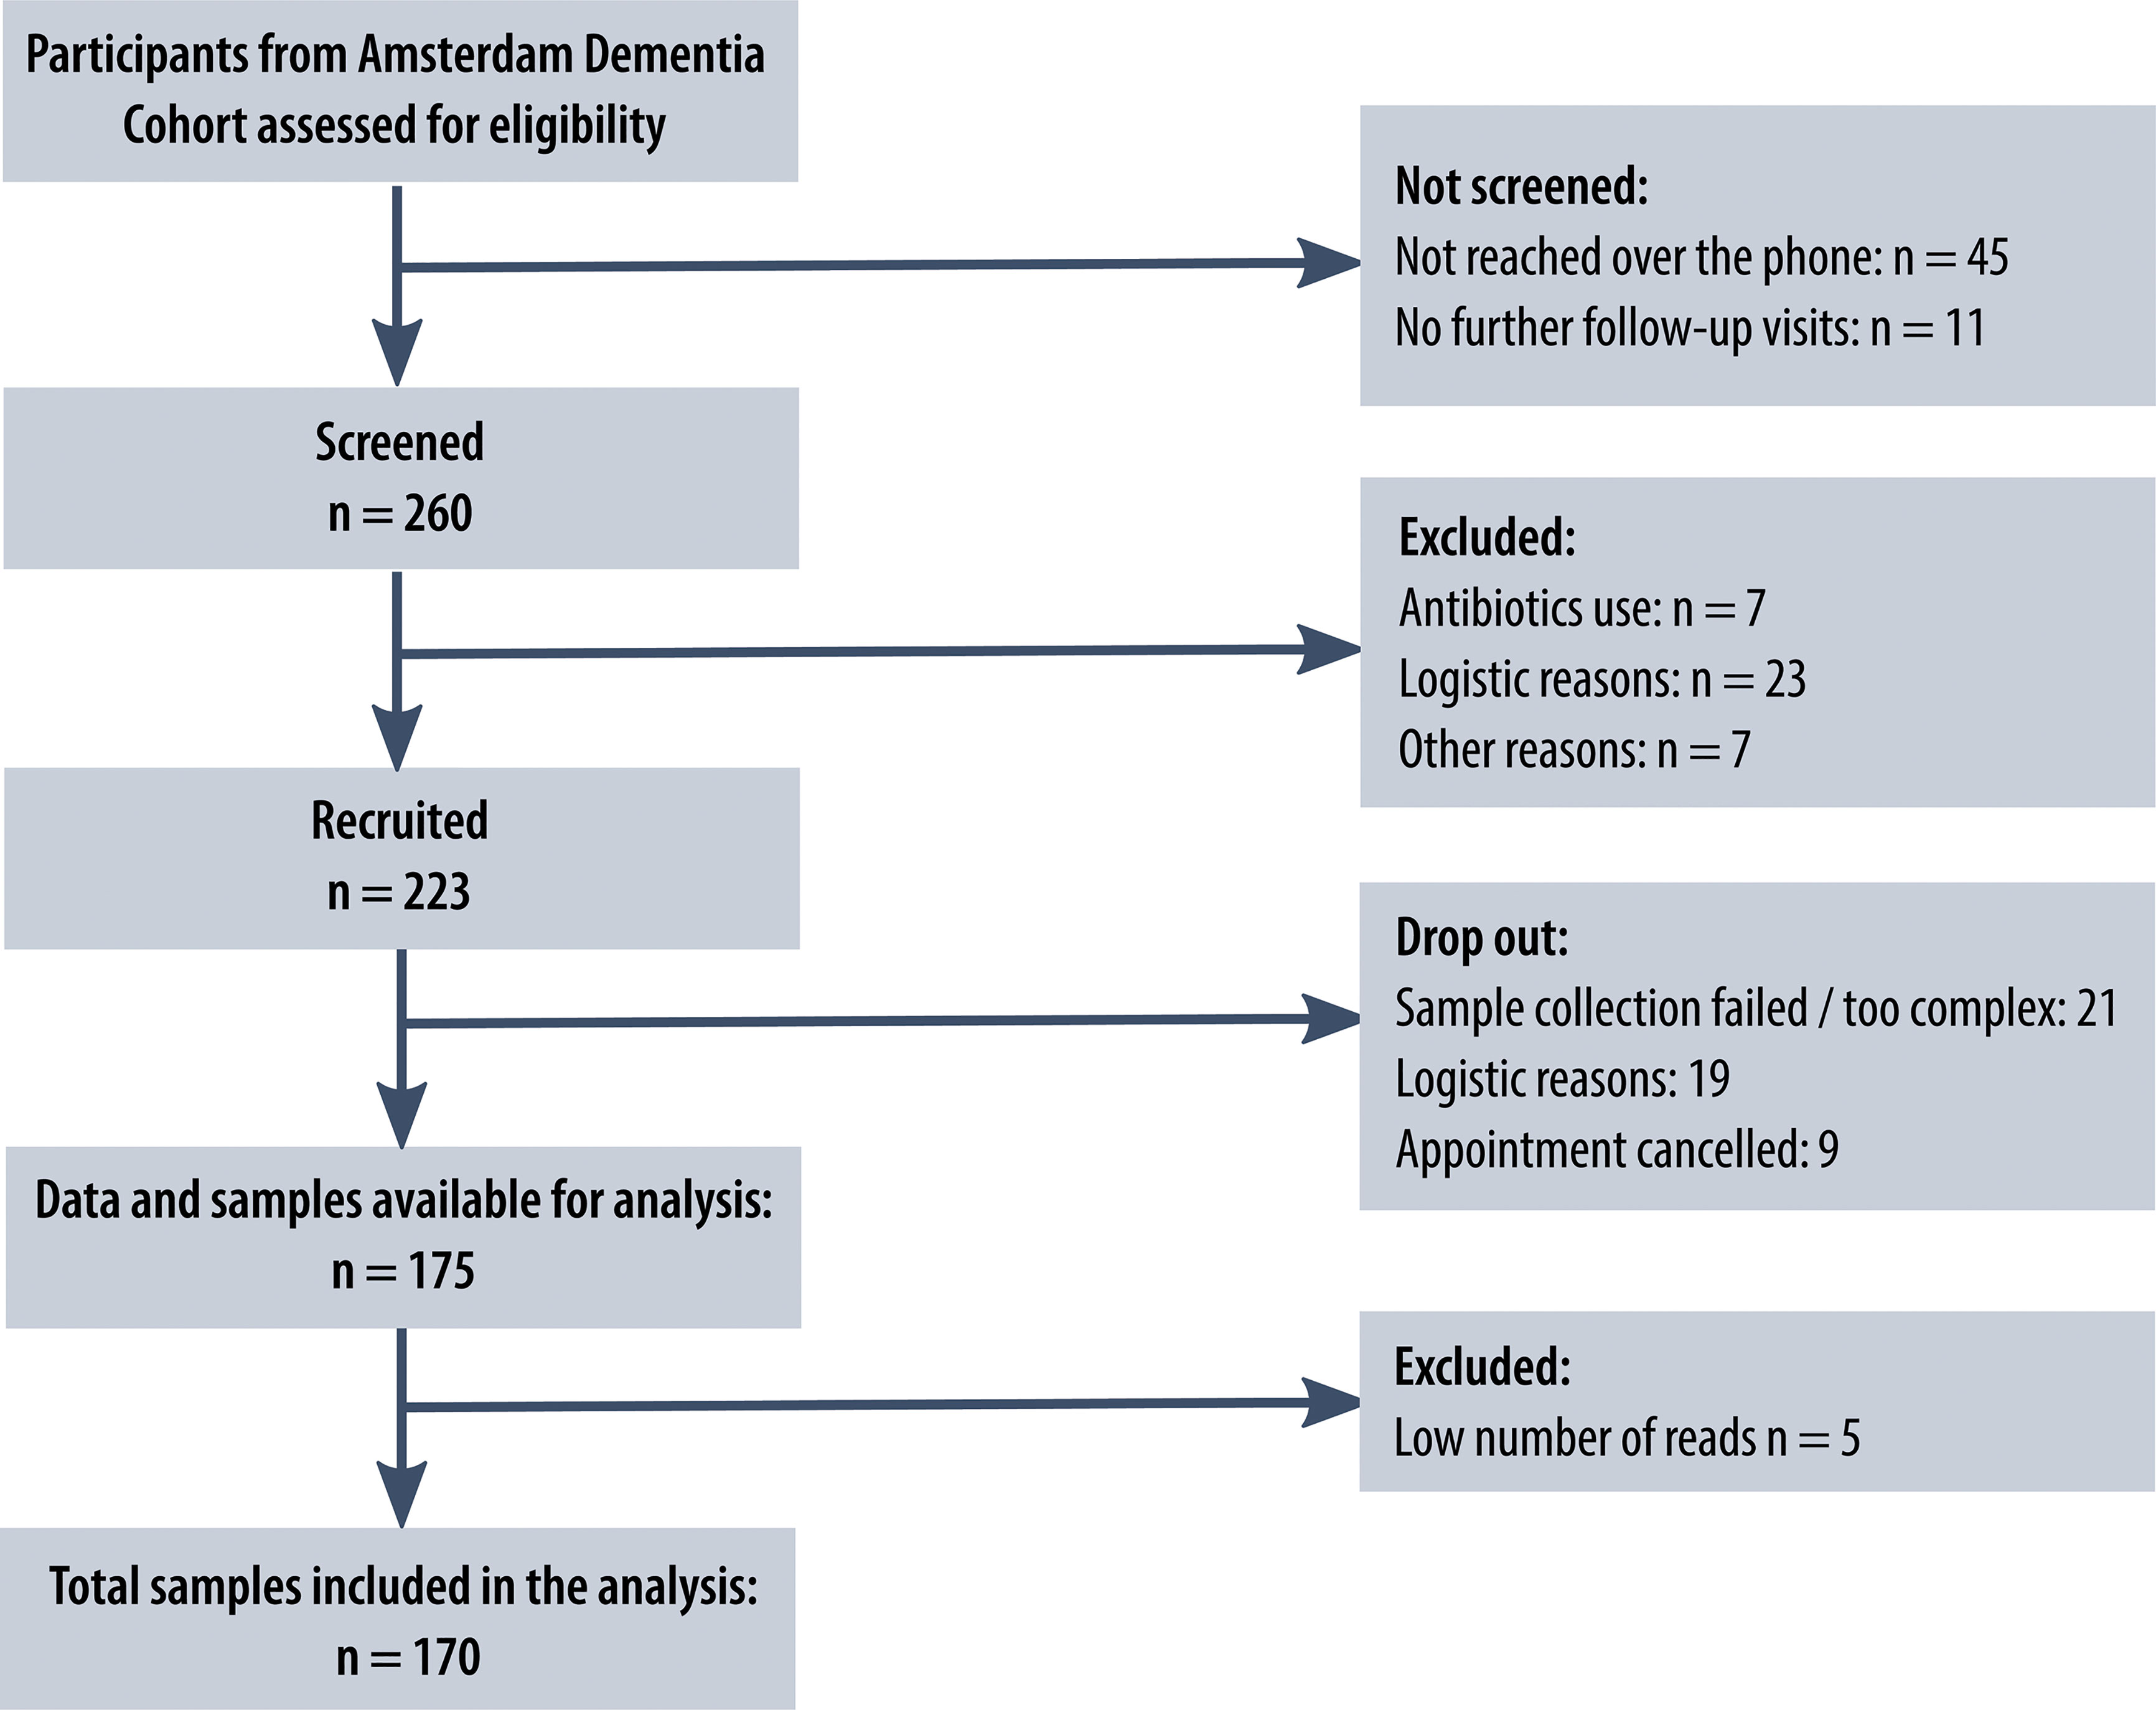
Figure 1 Study flowchart. Flowchart of the number of patients from the Amsterdam Dementia Cohort screened, recruited and included in the analysis, including reasons for exclusion at different stages. The flowchart was designed following the ‘Strengthening The Organization and Reporting of Microbiome Studies’ (STORMS) checklist (22).
Descriptive characteristics included age, sex, medical history (history of hypertension, hypercholesterolemia and diabetes; self-reported or described in a referral letter), medication use [antihypertensive medication, glucose lowering medication, cholesterol lowering medication, proton pump inhibitors (PPI)], smoking status (current smoking yes/no) and alcohol use (in units per day). Global cognitive functioning was assessed using the MMSE (scale 0-30) (28).
Gut Microbiota Composition
Patients were sent a fecal collection kit prior to their memory clinic follow-up visit. Seven patients who used antibiotics within three months prior to collection were not included. Other exclusion criteria were diarrhea in the past week or severe gastro-intestinal conditions, including inflammatory bowel disease. A flowchart with the screening and recruiting procedure and reasons for exclusion at each stage is presented in Figure 1. The included patients were asked to store the sample in a freezer and to transport the samples to the hospital in a cooling bag. The 175 samples were shipped to Erasmus Medical Center, Rotterdam, the Netherlands, for sequencing. Aliquots of ~300 mg feces were homogenized and DNA was isolated using bead-beating and the InviMag Stool DNA kit (Invitek Molecular GmbH, Berlin, Germany) on a KingFisher Flex robot (Thermo Fisher Scientific, Breda, Netherlands). Fecal microbiota composition was determined by sequencing the V3 and V4 hypervariable regions of the 16S rRNA gene on an Illumina MiSeq platform (Illumina Inc., San Diego, CA, USA) using 319F (ACTCCTACGGGAGGCAGCAG) −806R (GGACTACHVGGGTWTCTAAT) primers and dual-indexing (29). The processing of the raw sequencing data is described in Supplement 1, which after rarefying to 20.000 counts per sample resulted in a dataset with 170 samples and 7894 amplicon sequence variants (ASVs). Prior to the machine learning analyses, we filtered for ASVs that had at least 5 counts in 30% of the subjects, which resulted in a dataset with 181 ASVs. Of these ASVs, taxonomy was available up to species level for 32%, up to genus level for 88% and up to family level for 99%.
AD Biomarkers
CSF was obtained by lumbar puncture using a 25-gauge needle and collected in 10 ml polypropylene tubes (Sarstedt). Amyloid-β1-42 (Aβ42) and p-tau concentrations were determined with sandwich ELISAs, using Innotest (Fujirebio) and Elecsys immunoassays. Patients were classified as having a positive amyloid status, indicative for AD pathology, if they had amyloid values lower than the platform-dependent cut-off (Innotest <813 pg/ml (30, 31); Elecsys <1000 pg/ml). A positive p-tau status was defined as having p-tau values higher than the platform-dependent cut-off (Innotest >52 pg/ml; Elecsys >19pg/ml). Because of the high correlations between these platforms, Elecsys values were converted to Innotest values (32). CSF biomarkers were available for 116 patients at a median of 2.4 [IQR 2.2, 3.2] years before the time of fecal sampling.
MRI scans were performed on a 3.0T scanner and the protocol included T1-weighted, T2-weighted, fluid-attenuated inversion recovery (FLAIR) and gradient echo T2*-weighted images. A trained neuroradiologist evaluated all scans using visual rating scales. Medial temporal atrophy (MTA) was rated on coronal reconstructions of T1-weighted images of both sides, perpendicular to the long axis of the hippocampus (0-4 scale). MTA was averaged across left and right scores, and was dichotomized with a cut-off of ≥1 (33, 34). Global cortical atrophy (GCA) was assessed on transverse FLAIR images and rated using a 4-point scale (0-3) and dichotomized (cut-off ≥1) (34, 35). White matter hyperintensities (WMH) were assessed on the same sequences using the Fazekas scale for white matter hyperintensities (0-3) and dichotomized with a cut-off of ≥2 (36). Microbleeds were defined as oval or round hypointense lesions up to 10 mm on a T2*-weighted MRI. Microbleeds counts were dichotomized into present or absent (37). MRI results were available for 136 patients at a median of 2.1 [IQR 0.5, 2.4] years before the time of fecal sampling.
Statistical Analysis
Differences in descriptive and outcome variables between diagnosis groups were tested using analysis of variance for continuous variables with normal distributions, Kruskal-Wallis tests for continuous variables with non-normal distributions and chi-square tests for categorical variables. To compare microbiota composition between groups, we calculated alpha diversity indices, including Shannon index, richness and Faith’s phylogenetic diversity (38, 39). In addition, we compared beta diversity between groups by testing differences in Bray-Curtis distance with a PERMANOVA test. We used the rarefied microbiota data to calculate alpha and beta diversity.
We used machine learning models to predict dichotomized AD biomarkers, including amyloid and p-tau status, MTA, GCA, WMH and microbleeds, from gut microbiota composition (i.e. the relative abundance of ASVs). Subjects were excluded for a particular model if data on that outcome variable were missing. Microbiota abundance data is compositional data, with skewed, zero-inflated and overdispersed distributions. We used gradient-boosted tree models [XGBoost algorithm (40)], which is a state-of-the art algorithm that has shown good accuracy in comparative microbiota studies (41). To prevent overfitting, we used a nested cross-validation design in performing these models (Supplement 2). In each of the 200 iterations, the dataset was randomly split into a test set containing 20% of the subjects and a training set with the remaining 80%. Within the train set, 5-fold cross-validation was performed in order to optimize the model hyperparameters. Two random variables were added to the microbiota data in each iteration as a benchmark. The resulting model was evaluated on the test set which yielded an area under the receiver-operator curve (AUC) as main model quality metric, and a ranked list of microbial predictors with their relative importance to the model. These were recorded for each iteration and were averaged across 200 iterations.
We selected the two machine learning models with the highest AUCs for logistic regression, to obtain effect sizes for the associations between the 20 highest ranked (i.e. highest feature importance) microbes and the dichotomous outcome of these machine learning models. We ran three models: model 1 adjusted for age, sex and BMI, model 2 with additional adjustment for diabetes, statin and proton pump inhibitor (PPI) use and model 3 with additional adjustment for MMSE. The effect sizes, reported as odds ratios (OR) per log2-increase in counts with 95%-confidence intervals (95%-CI) were visualized in a forest plot. Spearman rank correlation coefficients were calculated between the top 10 best predicting ASVs found by the two best performing machine learning models and the AD biomarkers and were visualized with a correlation heatmap. We used hierarchical clustering (Ward’s method) to order the ASVs in this plot and to draw a dendrogram. The correlations with amyloid levels and MMSE scores were inversed for interpretability, since lower levels are indicative for AD pathology in contrast to other biomarkers.
Machine learning was implemented in Python (v. 3.7.4) using the XGBoost (v. 0.90), numpy (v. 1.16.4), pandas (v. 0.25.1), and scikit-learn (v. 0.21.2) packages. Statistical analyses and visualizations were performed using R version 3.6.2.
Data Availability
The sequencing data presented in this study can be found in an online repository, European Nucleotide Archive (ENA) accession number PRJEB49329 (https://www.ebi.ac.uk/ena/browser/view/PRJEB49329). Clinical data are available upon reasonable request at Alzheimer Center Amsterdam, Amsterdam UMC, location VUmc in Amsterdam, The Netherlands.
Results
Population Characteristics
The mean age of the overall study population was 63 years (Table 1), with the AD dementia group (66.0±8.0) older than the SCD group (62.0±7.5; p<0.05). Patients with AD dementia, MCI and SCD were comparable in terms of sex, BMI, smoking status and alcohol use, as well as most cardiovascular risk factors. However, diabetes was more prevalent among patients with AD dementia and MCI compared to SCD (p<0.05). AD dementia and MCI patients more often had abnormal AD biomarkers than controls, such as positive amyloid and p-tau status (p<0.001), and MTA (p<0.01) and GCA scores ≥1 (p<0.05). Distributions of amyloid and p-tau CSF levels are presented in Supplement 3. Prevalence of WMH ≥2 and microbleeds tended to be higher in patients with MCI, but this difference was not significant. The gut microbiota composition on genus level of the three diagnosis groups is shown in Figure 2. When comparing the 20 most abundant genera between diagnosis groups, only two genera, Subdoligranulum (p<0.05) and Phascolarctobacterium (p<0.05), had different abundances between groups. There were no differences in beta diversity (PERMANOVA p=0.223), nor in alpha diversity, as measured with Shannon index, richness and Faith’s phylogenetic diversity.
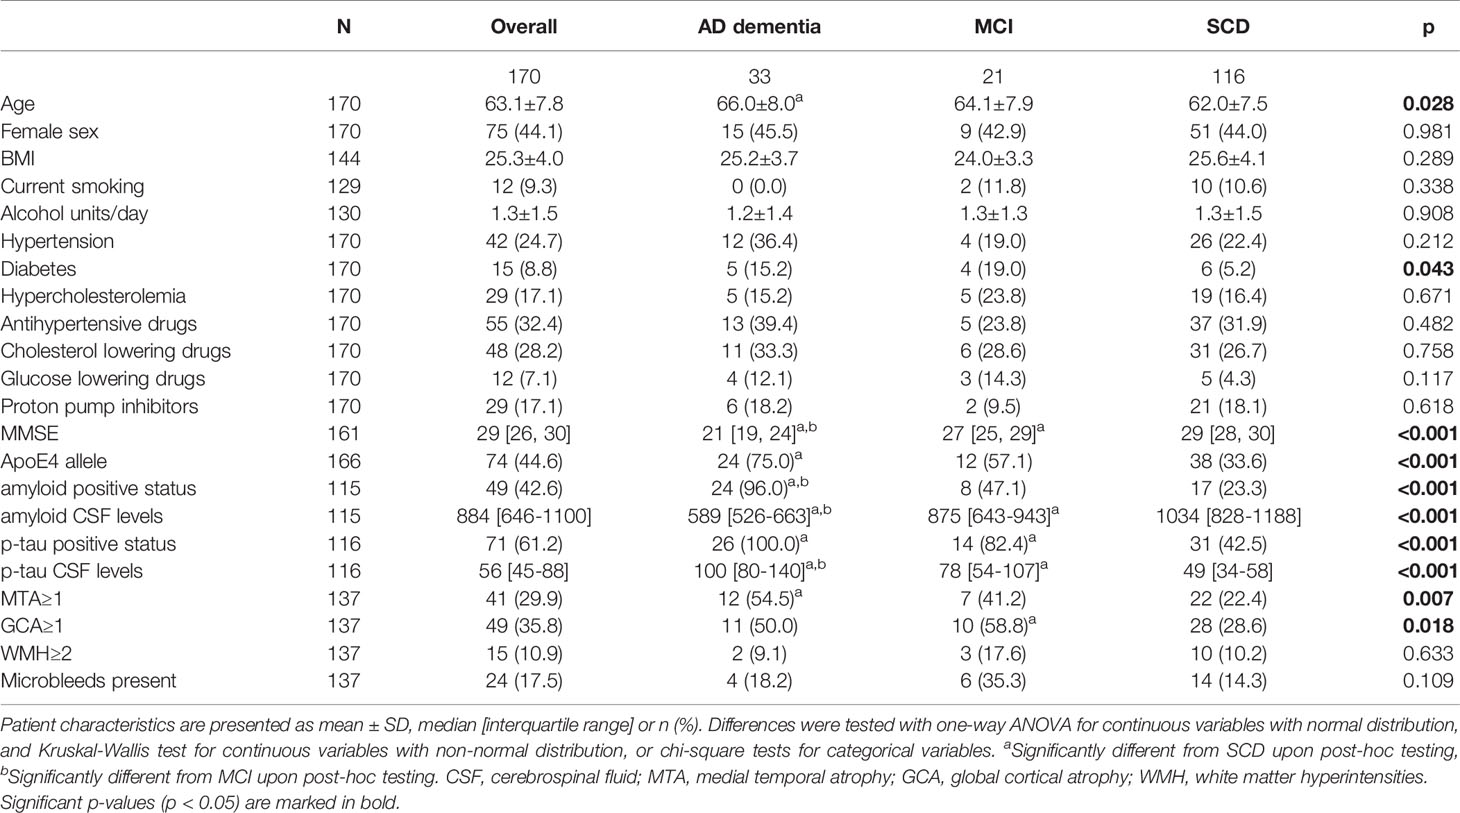
Table 1 Patient characteristics.
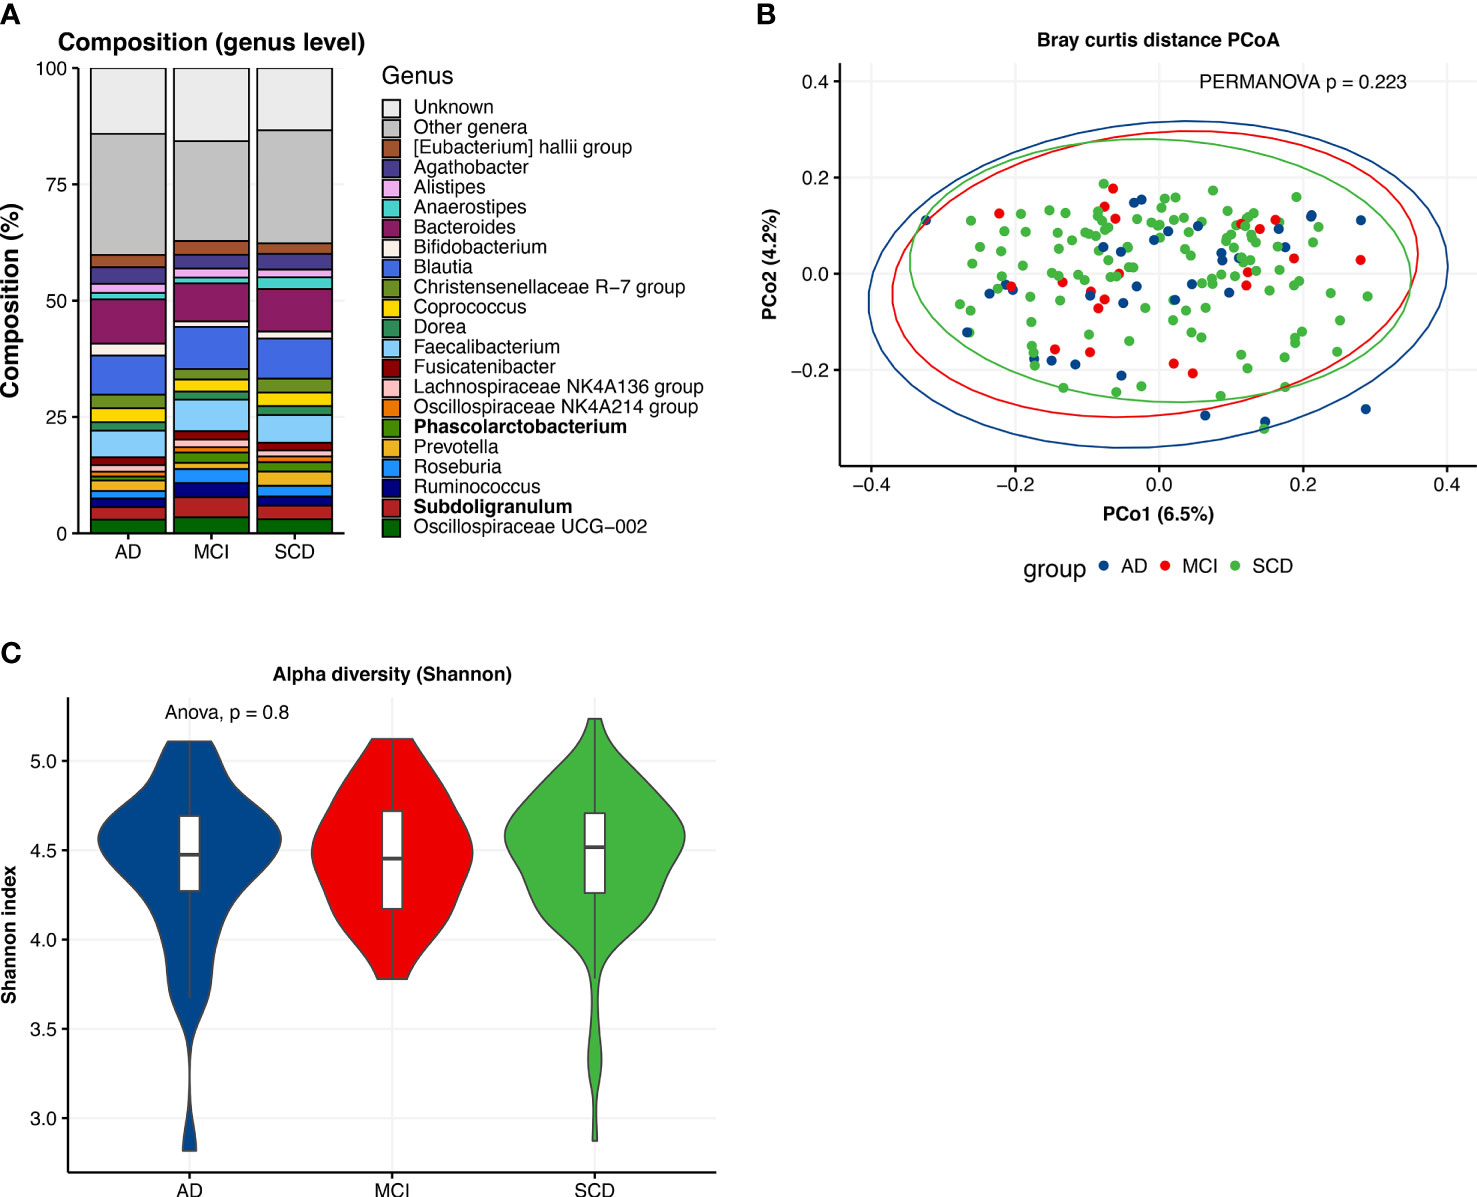
Figure 2 Descriptive characteristics of microbiota composition, differences between diagnosis groups. (A) Compositional plot of top 20 genera with bars representing diagnosis groups: Alzheimer’s disease dementia (AD), mild cognitive impairment (MCI) and subjective cognitive decline (SCD). “Unknown” refers to ASVs of which taxonomy was not known up to genus level. Genera with different abundances across groups (Kruskal-Wallis test, p <0.05) are marked in bold. (B) Principal coordinate analysis (PCoA) plot of Bray-Curtis distances per diagnosis group with PERMANOVA test for group differences. (C) Alpha diversity (Shannon index) of gut microbiota composition per diagnosis group.
Associations Gut Microbiota Composition and AD Biomarkers
The machine learning model for the prediction of amyloid status from gut microbiota composition performed best with an AUC of 0.64±0.10 (Figure 3). This model was closely followed by the p-tau model with an AUC of 0.63±0.09, while AUCs of the MRI visual scores ranged between 0.50 and 0.53. Highest ranked predictors of the amyloid (CSF) predicting model with all subjects included [Eubacterium] ventriosum group spp., Subdoligranulum spp., and Anaerostipes spp. In the model predicting p-tau, highest ranked microbes included Lachnospiraceae spp., Lachnoclostridium edouardi and Blautia faecis. These microbes are all anaerobic bacteria from the Firmicutes phylum and Eubacterieae, Ruminococcaceae and Lachnospiraceae families that are known for production of SCFAs. Some ASVs, including Subdoligranulum spp., Roseburia hominis and Butyricoccus spp., could be found in the top 20 predictors of both the amyloid and p-tau model. The receiver-operating curves (ROCs) of the amyloid and p-tau models with the relative importance of the highest ranked predictors can be found in Supplement 4.
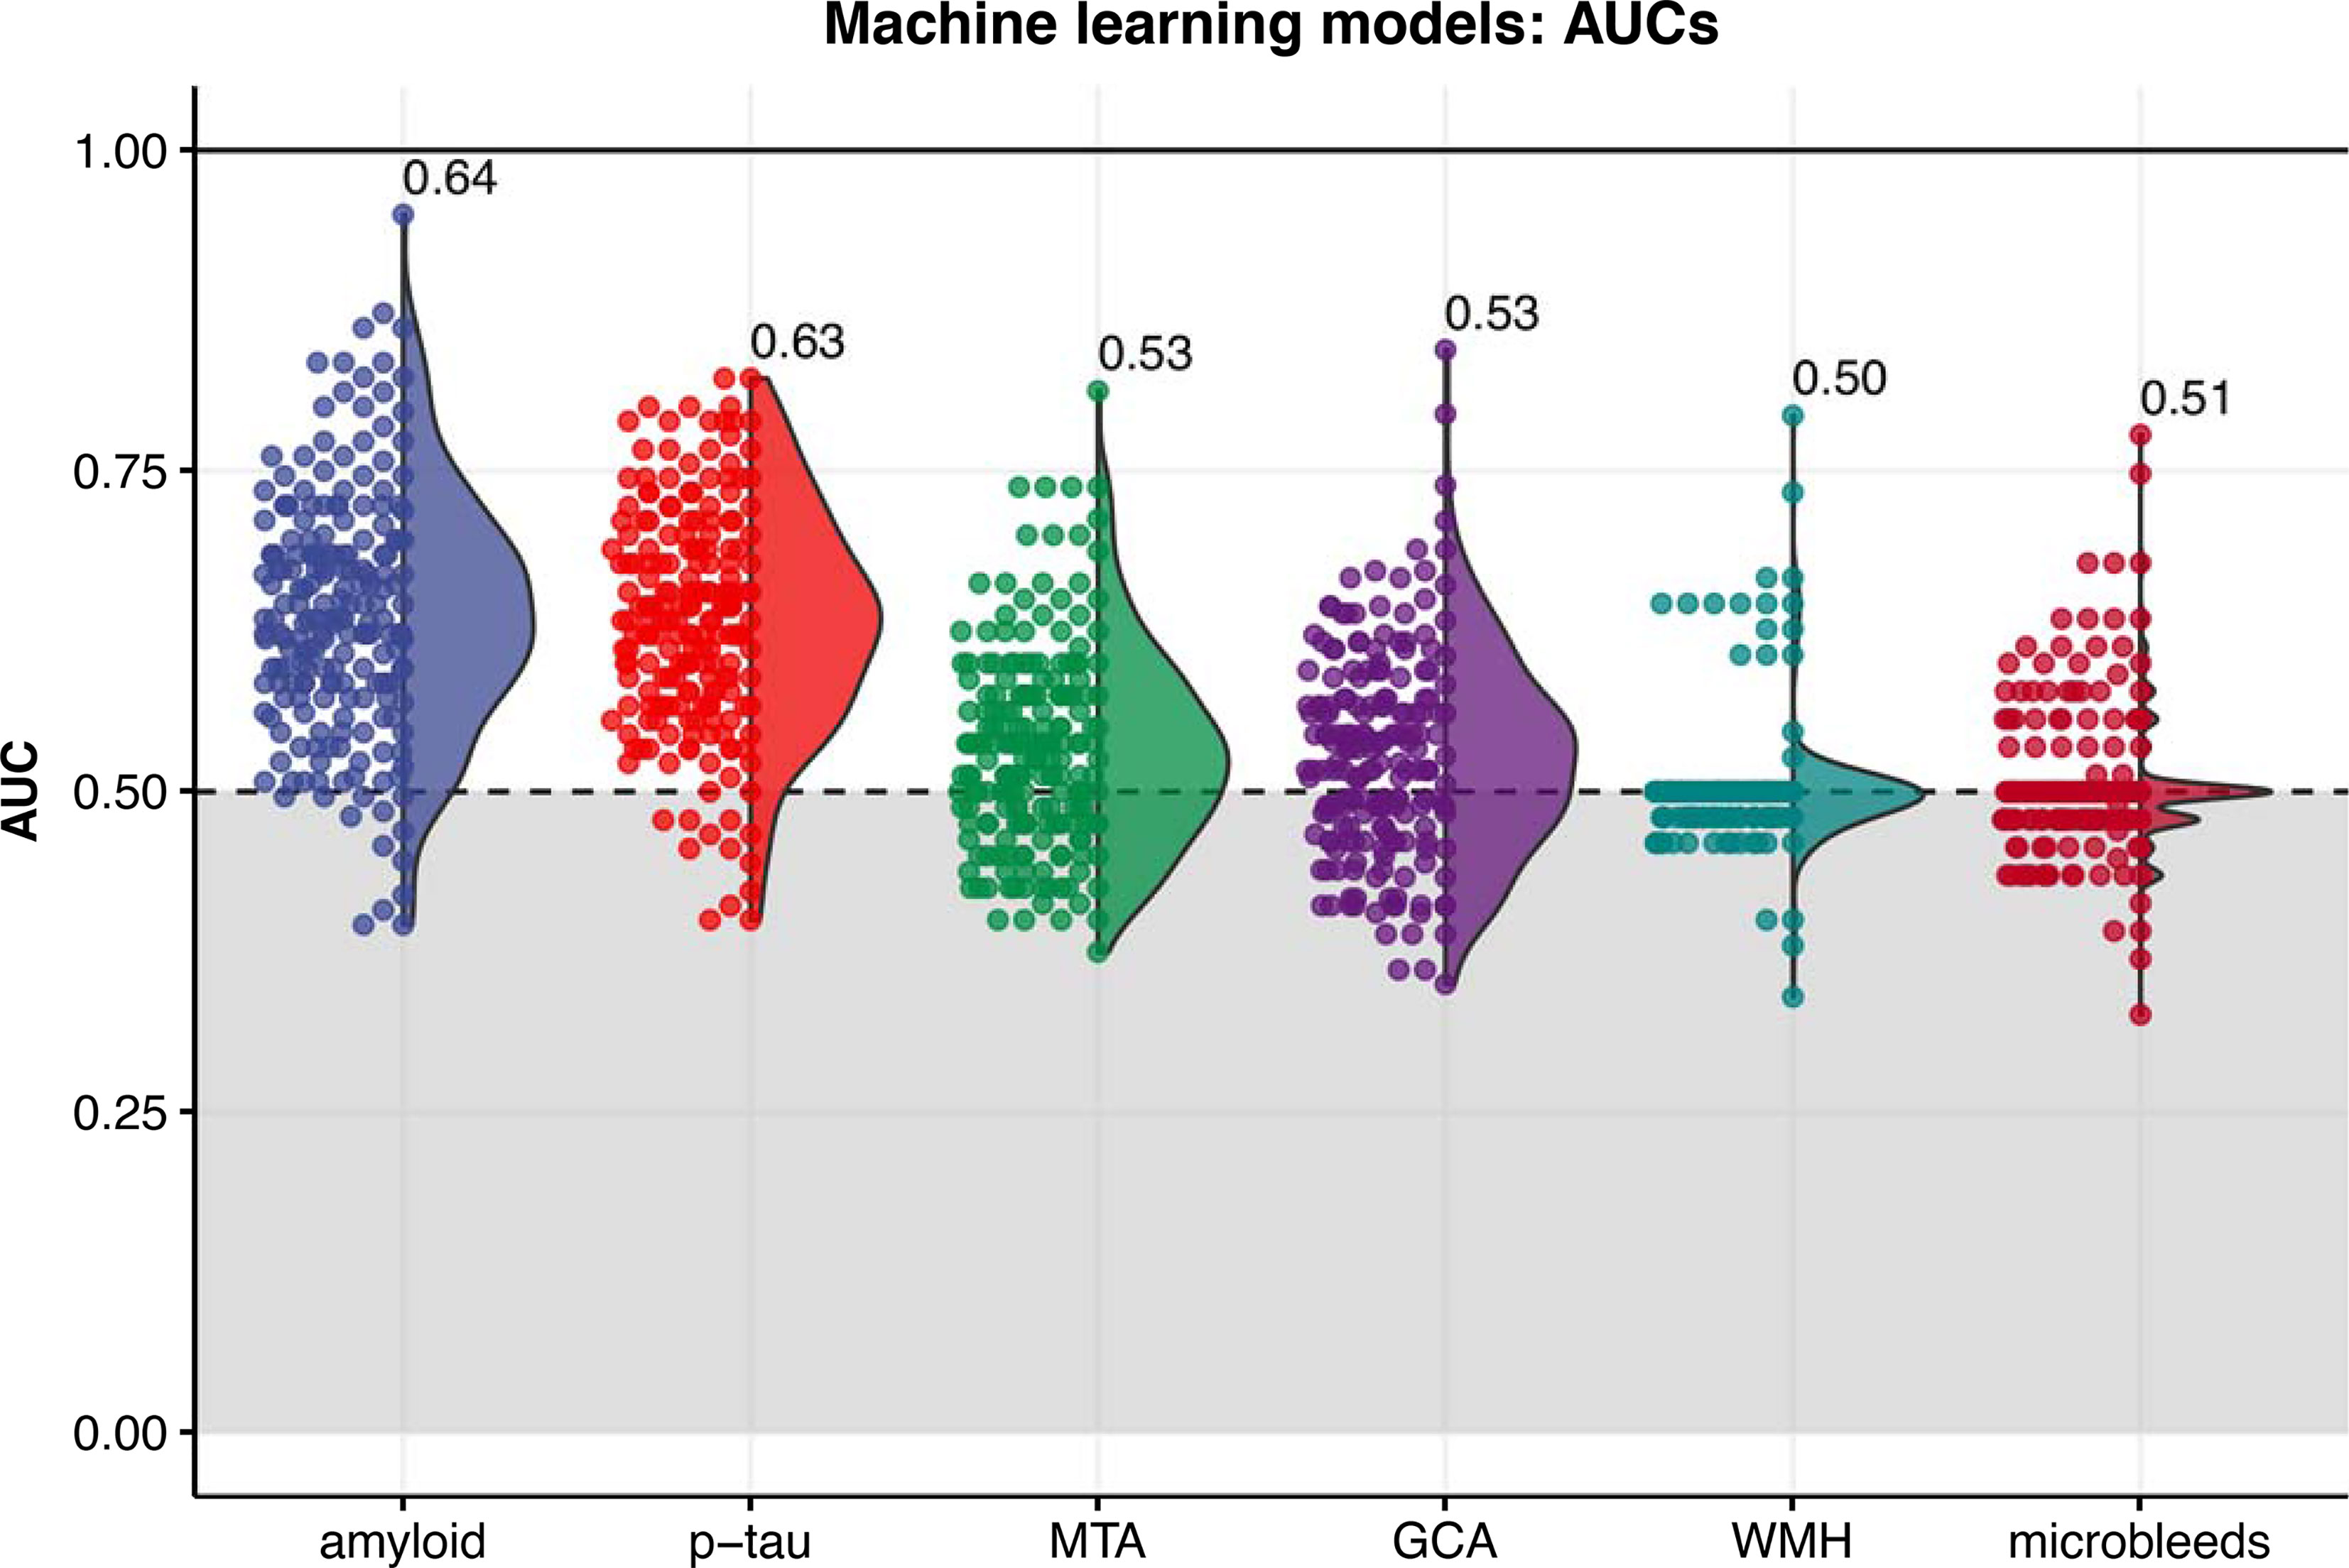
Figure 3 Distribution of area under the receiver-operating curves (AUCs) resulting from 200 iterations of the machine learning classification models (XGBoost algorithm) for each outcome. The labels indicate the mean AUC over 200 iterations. MTA, medial temporal atrophy; GCA, global cortical atrophy; WMH, white matter hyperintensities.
Logistic regression models showed significant associations with amyloid status for 10 of the 20 highest ranked microbial predictors from the amyloid status machine learning model (Figure 4A) in model 1 and 2. Two ASVs, Coprococcus catus (OR 0.78 (0.63-0.97), p<0.05; model 2) and Oscillospiraceae UCG-005 spp. (OR 0.76 (0.59-0.93), p<0.05; model 2), were only associated with amyloid status in model 1 and 2. Eight associations remained significant in model 3, adjusting for age, sex, BMI, diabetes, proton pump inhibitor and statin use, and MMSE, including [Eubacterium] ventriosum group spp. (OR 0.76 (0.62-0.91) per log2-increase in counts, p<0.01), Lachnospiraceae spp. (OR 0.69 (0.49-0.97), p<0.05), Marvinbryantia spp. (OR 0.72 (0.53-0.96), p<0.05), Monoglobus spp. (OR 0.75 (0.57-0.98)), [Ruminococcus] torques group spp. (OR 0.84 (0.71-0.99), p<0.05), Roseburia hominis (OR 0.78 (0.63-0.95), p<0.05), and Christensenellaceae R-7 spp. (OR 0.82 (0.68-0.96), p<0.05), and [Clostridium] leptum spp. (OR 1.55 (1.18-2.12), p<0.01).
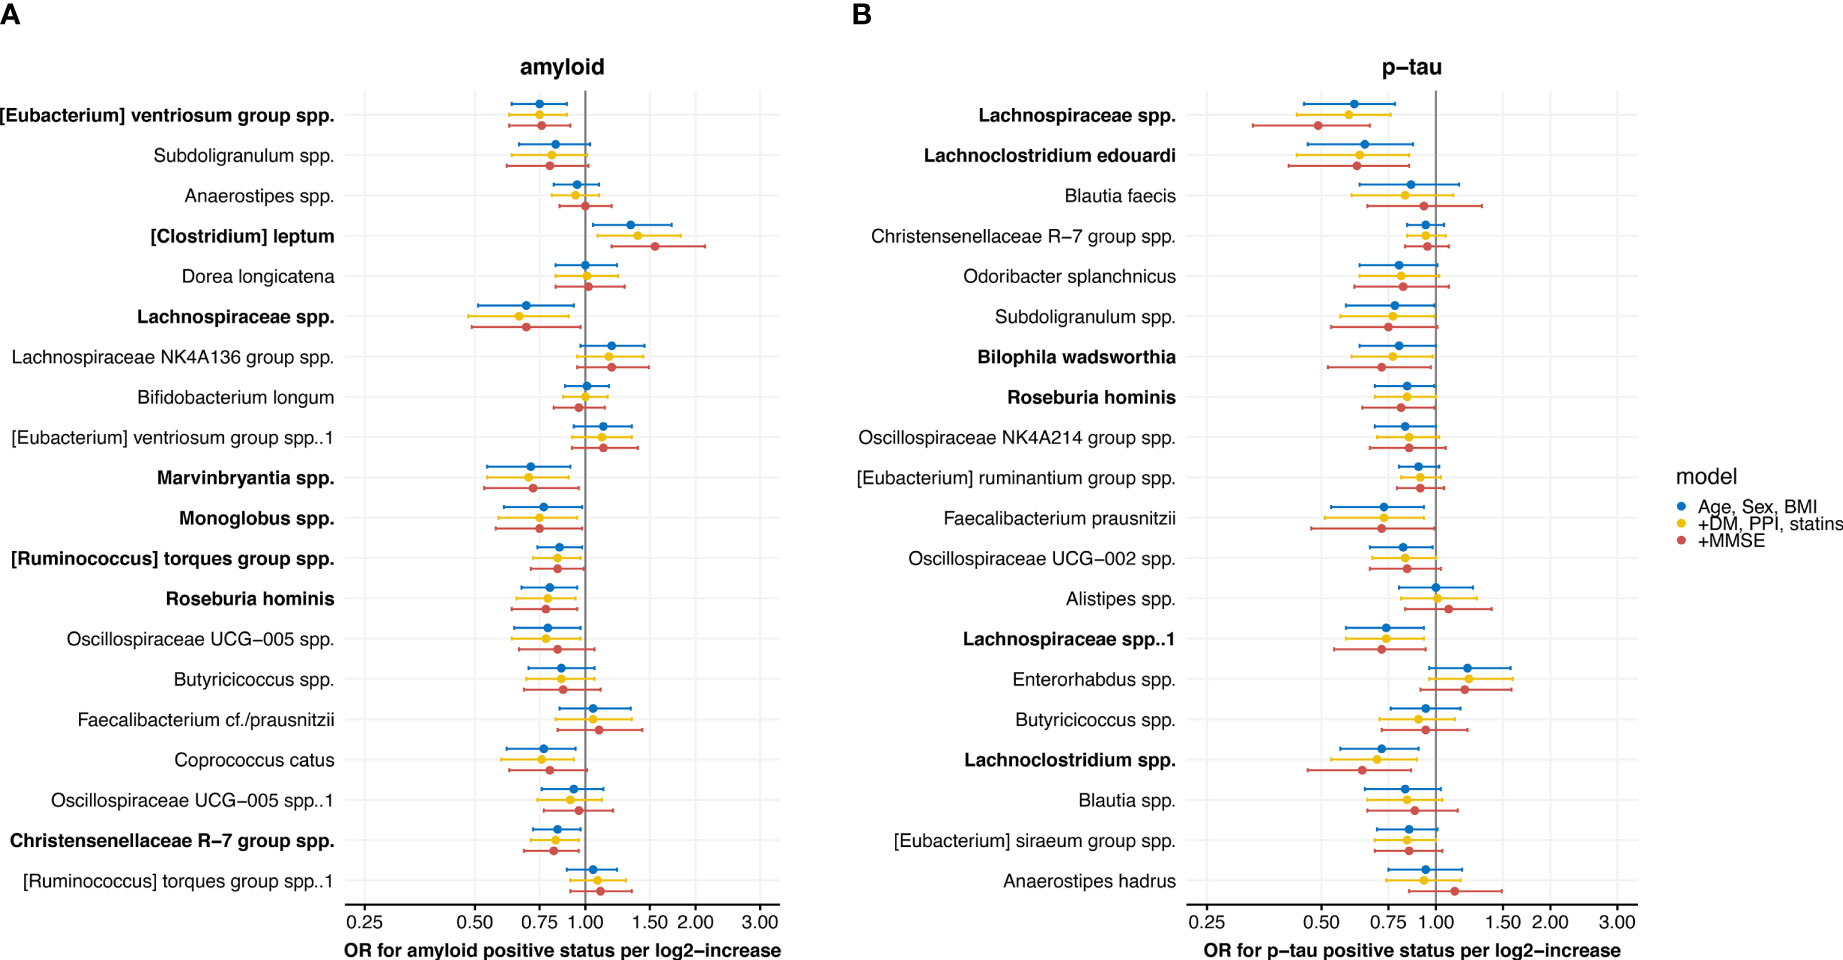
Figure 4 Forest plots with results from the logistic regression models with associations between the 20 highest ranked microbial predictors from the machine learning model, ordered by ranking, and (A) amyloid and (B) p-tau positive status. Three models are shown: 1) adjusted for age, sex and body mass index (BMI), 2) additionally adjusted for diabetes mellitus (DM), use of proton pump inhibitors (PPI) and statins and 3) additionally adjusted for mini-mental state examination (MMSE) score. Results are presented as odds ratios (OR) with 95% confidence intervals. Microbes with significant associations in the fully adjusted model are marked in bold.
Six of the top 20 highest ranked microbial predictors from the p-tau status model were associated with p-tau status in the fully adjusted model 3 (Figure 4B). These included two Lachnospiraceae spp. ASVs (OR 0.49 (0.33-0.67), p<0.001, and OR 0.72 (0.54-0.94), p<0.05), Lachnospiraceae edouardii (OR 0.62 (0.41-0.85), p<0.01) and Lachnoclostridium spp. (OR 0.72 (0.54-0.94), p<0.01), which all belong to the Lachnospiraceae family. In addition, Roseburia hominis (OR 0.81 (0.64-0.99), p<0.05) and Bilophila wadsworthia (OR 0.72 (0.52-0.97), p<0.05) were lower abundant in patients with a positive p-tau status.
Associations of Top Predicting Microbes With Other Biomarkers
We also calculated Spearman’s correlations between the 10 highest ranked microbes from the amyloid and p-tau models (19 microbes in total, because of an overlap of one ASV) and all AD biomarkers, including amyloid and p-tau levels (Figure 5). Five ASVs correlated with higher amyloid levels (0.27<rs<0.22), while one ASV, [Clostridium] leptum, correlated with lower amyloid levels (rs 0.29, p<0.01). Four ASVs correlated with lower p-tau levels (-0.33<rs<-0.19). Roseburia hominis and Odoribacter splanchicus correlated with both higher amyloid and lower p-tau levels. Lachnospiraceae NK4A136 group spp. and Anaerostipes spp. correlated with lower GCA visual scores on MRI. In addition, Anaerostipes spp. and Odoribacter splanchicus correlated with higher MMSE scores, while [Clostridium] leptum correlated with lower MMSE scores.
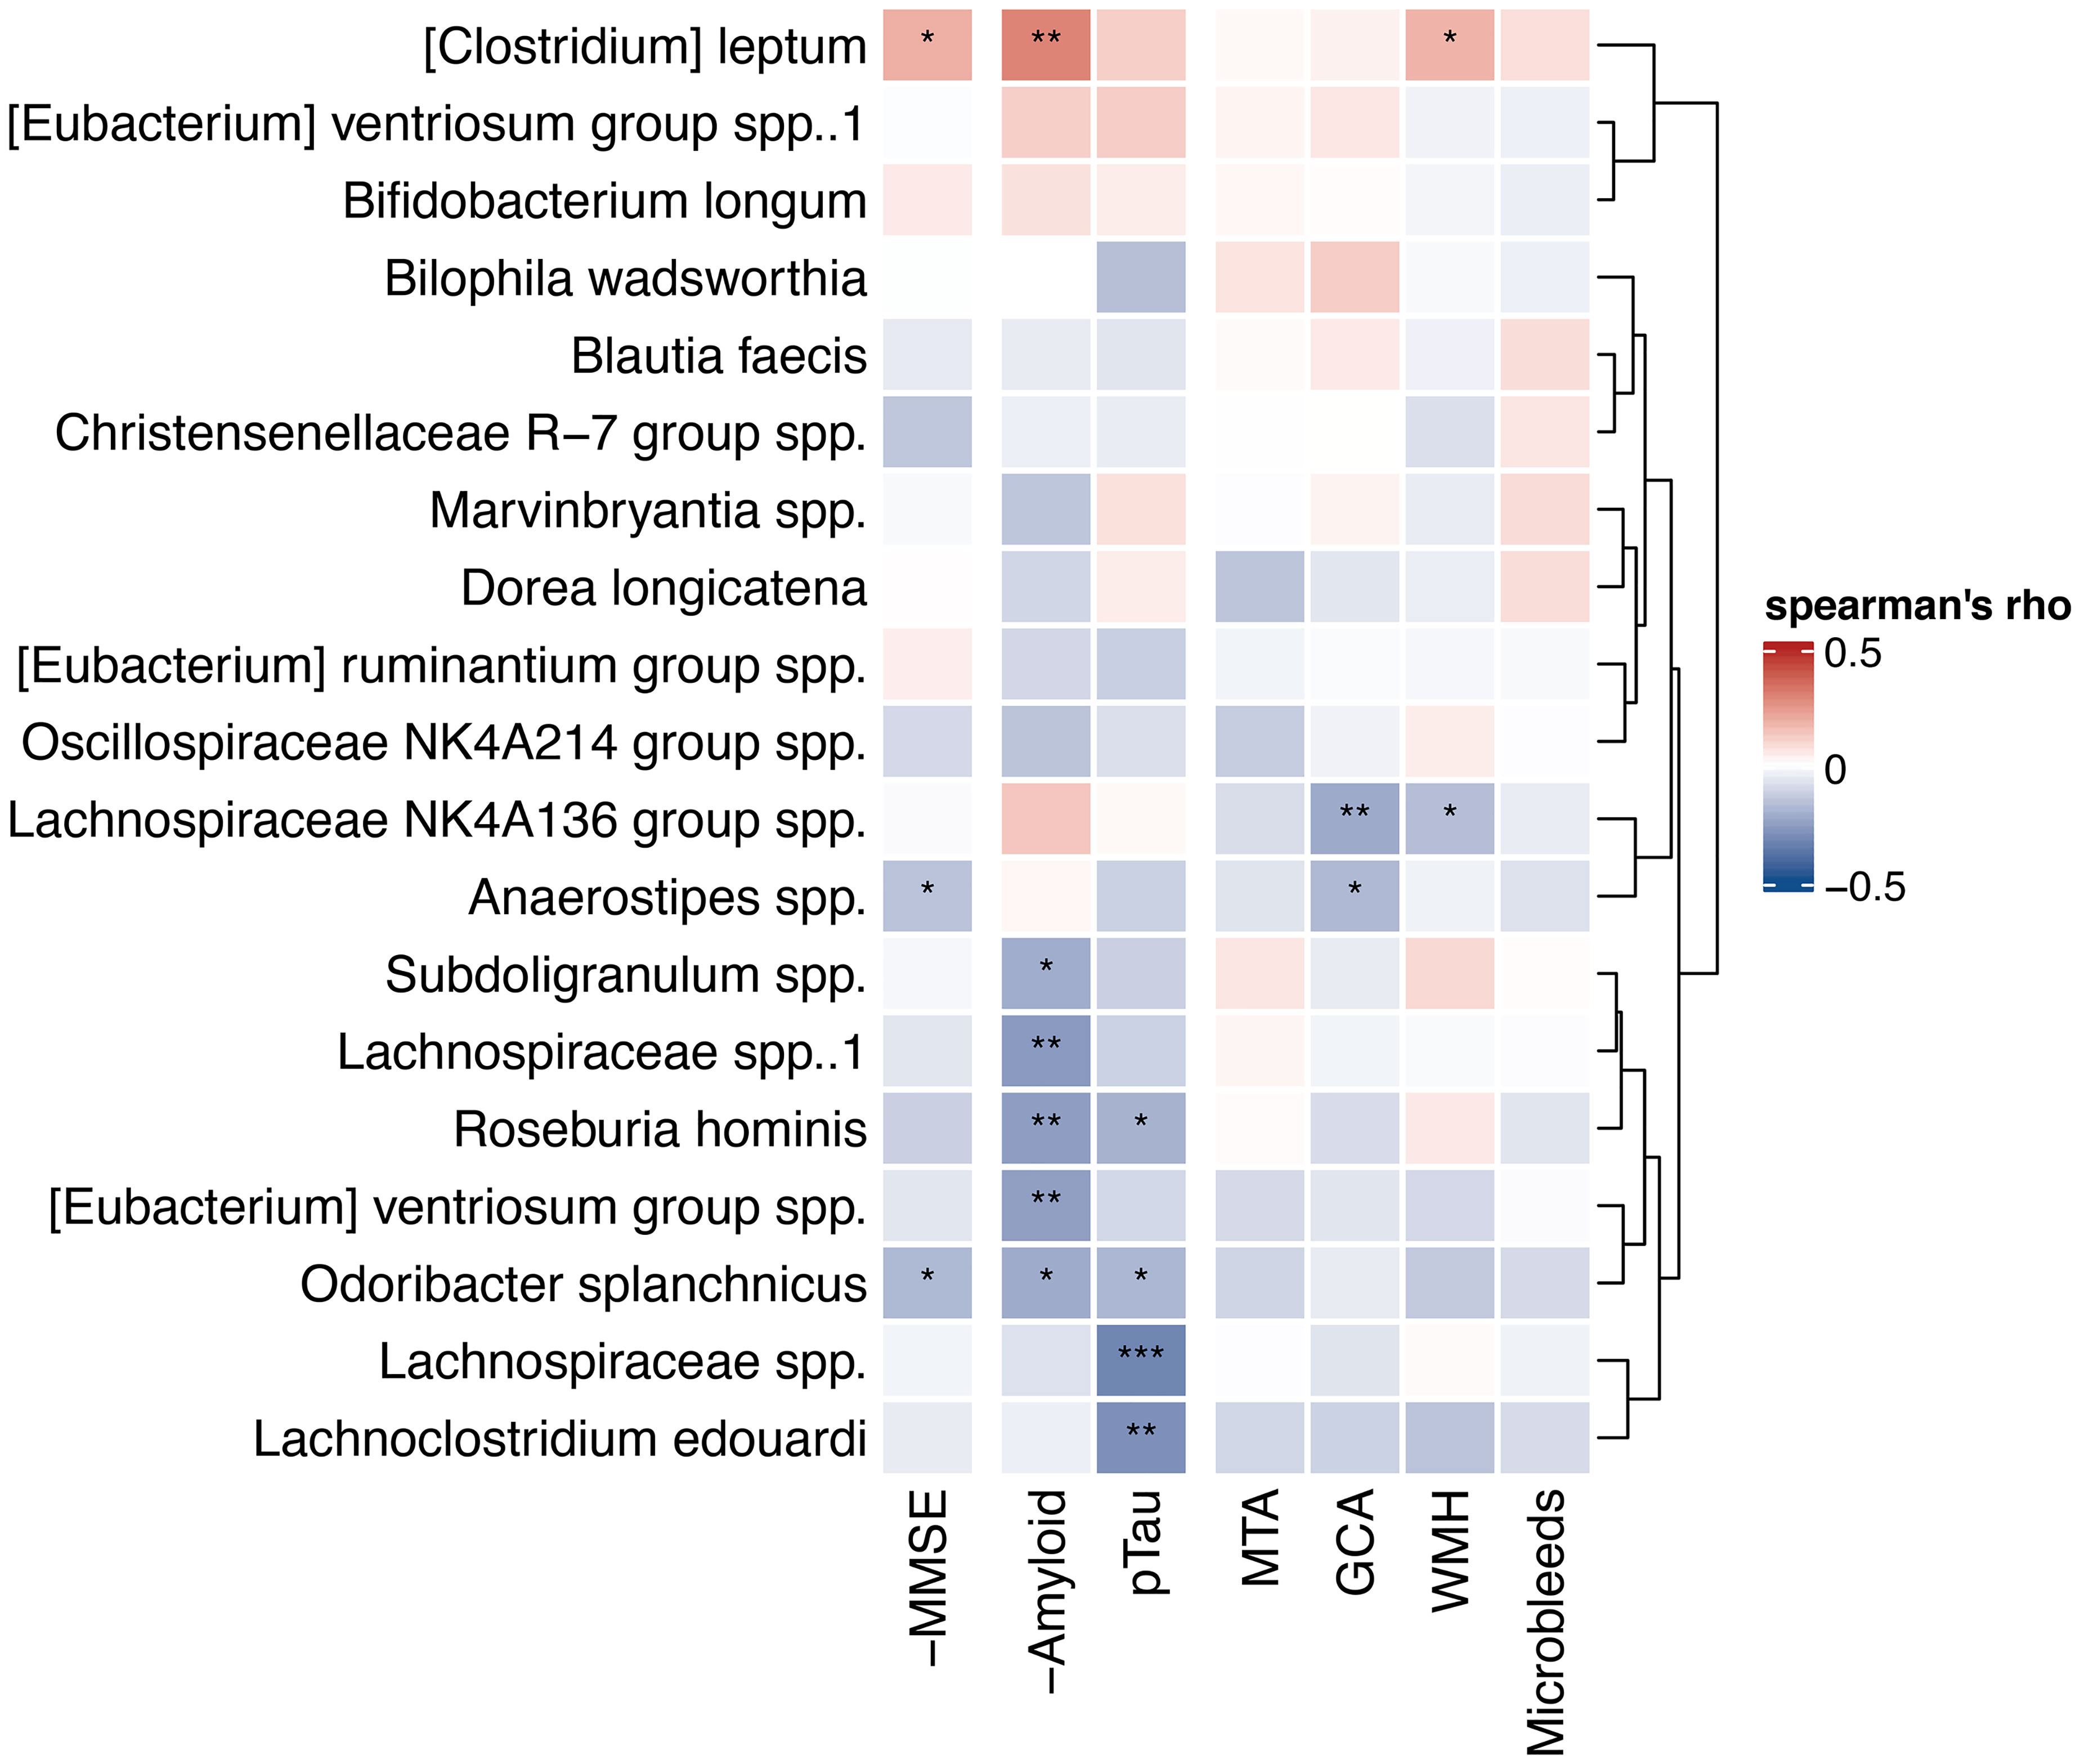
Figure 5 Heatmap of correlations with highest ranked predictors. Spearman’s correlations between 10 highest ranked microbial predictors from the amyloid and p-tau machine learning models and continuous AD biomarkers. Hierarchical clustering (Ward’s method) was used to order the microbes and draw the dendrogram on the right. Correlations with MMSE and amyloid CSF levels are reversed for interpretability (-MMSE and -Amyloid), as lower values of these variables are indicative for pathology, in contrast to the other biomarkers. Negative (blue) correlations in this heatmap reflect correlations with less biomarkers indicative for AD pathology. *p < 0.05, **p < 0.01, ***p < 0.001. MMSE, mini-mental state examination; P-tau, phosphorylated tau; MTA, medial temporal atrophy; GCA, global cortical atrophy; WMH, white matter hyperintensities.
Discussion
Our main findings are the associations between gut microbiota composition and CSF amyloid and p-tau status. Discriminative value of the models predicting amyloid and p-tau status from gut microbiota composition was modest, but nonetheless we provide evidence that several SCFA-producing microbes are altered in patients with abnormal CSF amyloid and/or p-tau. We extend on animal studies reporting associations between SCFAs and amyloid pathology by showing that lower abundance SCFA-producing microbes was associated with lower odds of amyloid and p-tau positive status (15, 42).
Five cross-sectional studies of differences in gut microbiota between patients with AD and controls found that several microbes were less abundant in AD, including Faecalibacterium prausnitzii, Eubacterium, Anaerostipes, Ruminococcus, and Roseburia spp, while other microbes, such as Odoribacter splanchicus, Bacteroides, Prevotella, and Alistipes spp., were more abundant (16–20). In line with these studies, we found that many of the highest ranked predictors for amyloid and p-tau status belonged to the Lachnospiraceae family, including Roseburia hominis, [Ruminococcus] torques, Lachnoclostridium, Monoglobus and Marvinbryantia spp. In contrast to earlier findings, higher abundance of Odoribacter splanchicus and Alistipes spp. correlated with more normal levels of AD biomarkers (higher amyloid and lower p-tau CSF levels) in our analyses, albeit these associations were lost after adjustment for covariates.
Two previous studies investigated associations between AD biomarkers and a specific subset of gut microbes (16, 21). One cross-sectional study correlated 13 microbial genera, that were differently abundant between AD patients and controls including a few that are SCFA-producing, with amyloid and p-tau levels in 40 patients. Blautia and Bacteroides spp. were associated with higher levels of biomarkers indicative of AD pathology, while SMB53 and cc115 spp. were associated with lower AD biomarkers. Of these genera, only Blautia faecis was also among the best predictors for p-tau status in our analyses, although this association was not significant in the adjusted analyses. These different findings could be explained by the older study population or by their inclusion of very low abundance taxa in the statistical analyses. A study that assessed differences between amyloid positive and negative patients in six microbes measured using qPCR found that Escherichia/Shigella spp. were more abundant while Eubacterium rectale was less abundant in amyloid positive patients (21). Indeed, several Eubacterium species were among the highest ranked predictors for amyloid status in our analyses. We did, however, not confirm the Escherichia/Shigella association, most likely because qPCR is more sensitive in finding changes in low abundant pathogens than 16S rRNA gene amplicon sequencing. [Clostridium] leptum, a microbe from the Oscillospiraceae family, was the only ASV associated with higher odds of amyloid positive status, and also correlated with lower continuous amyloid CSF levels. To our knowledge, we are the first to report an association between this microbe and AD biomarkers.
Our analyses allowed us to differentiate between predictors for amyloid and p-tau status. Microbial predictors for amyloid and p-tau status showed some overlap, such as Roseburia hominis and Lachnospiraceae spp. We also found differences in highest ranked predictors for amyloid compared to p-tau status; microbial strains from the Eubacterium and Ruminococcus genera were the highest ranked predictors for amyloid status, while several Lachnoclostridium spp. were among the highest predictors for p-tau status.
In contrast to our findings in CSF amyloid and p-tau, we did not find associations between microbiota composition and MRI measures including vascular markers such as WMH and microbleeds in our machine learning model (AUC 0.50), perhaps due to the low prevalence of cerebrovascular damage in this young study population. The low prevalence of cerebrovascular damage also makes it unlikely that the observed associations with amyloid and p-tau were mediated by vascular pathology.
There are several hypotheses regarding the mechanisms by which gut microbiota could affect AD pathology which involve several metabolites and toxins. Lipopolysaccharide (LPS) can be found in the outer membrane of gram-negative bacteria and has been shown to elicit peripheral inflammatory responses, affect the permeability of the blood-brain barrier and induce neuroinflammation (43, 44). In contrast, capsular polysaccharide A (PSA) of Bacteroides fragilis species has been shown to have anti-inflammatory effects on the peripheral immune system (45), and to suppress central neuroinflammation by induction of T-regulatory cells in mice (46). However, Bacteroides fragilis was not among the highest ranked predictors for amyloid nor p-tau status in our analyses, nor were other species from the gram-negative Bacteroides genus.
The highest ranked predictors were mostly species from the predominantly gram-positive Firmicutes phylum known for SCFA production. SCFAs, including acetate, propionate and butyrate, are produced by gut bacteria in fermentation processes of otherwise undigestible dietary fibers and have immunomodulatory potential (10, 47). SCFAs could have indirect effects on AD pathology by induction of peripheral inflammation or by altering the integrity of the blood-brain barrier, as shown by a butyrate intervention study in germ-free mice (42). Alternatively, SCFA could have direct anti-inflammatory effects on microglia as was shown in an in vitro study (48). In that regard, future studies could focus on associations between fecal and plasma SCFA levels and inflammatory brain markers such as glial fibrillary acidic protein (GFAP) (49).
There are several limitations of our study including the cross-sectional design which warrants caution that observed associations should not be interpreted as causal relationships. Moreover, time lags between the biomarker measurements and the fecal sampling might have confounded some associations. Although we adjusted for relevant confounders such as age, sex, BMI, diabetes and medication use, we cannot rule out residual confounding. Dietary factors in particular have been shown to affect microbiota composition (50). Since AD patients tend to lose weight over the course of the disease, it has been suggested that cognitive decline could lead to lower energy intake which might also affect microbiota composition (51). However, we have found previously that macronutrient intake was not different between diagnosis groups in this cohort (52). Moreover, associations between gut microbiota composition and AD biomarkers remained significant when adjusting for cognitive function (MMSE). Of note, higher abundance of SCFA-producing microbes is indicative for, but does not necessarily reflect higher gut or plasma SCFA levels. To assess microbial production of SCFAs, metagenomic sequencing would be needed, which was not within the scope of the current study.
Strengths of this study include the availability of several AD biomarkers, including CSF and MRI data, and the inclusion of patients in different stages of the AD disease continuum. Fecal samples were obtained using a standardized protocol, participants taking antibiotics were excluded, and microbiota composition was determined with 16S gene amplicon sequencing, which is a widely used sequencing method. Machine learning prediction models enabled us to simultaneously include all ASVs as features in order to find the best predicting microbes. Nested cross-validation ensured robustness of the models and prevented overfitting.
The putative relation between gut microbiota composition and AD pathology, may provide opportunities for future treatment. Different treatment strategies based on modulating gut microbiota composition have been investigated in other diseases such as inflammatory bowel disease and diabetes (53–55). Fecal microbiota transplantation (FMT) aims to restore gut microbiota composition by administering microbiota from healthy donors to diseased subjects through a nasoduodenal tube (55). In obese subjects, FMT has been shown to alter brain dopamine transporter binding, thus pointing towards a gut-brain connection (56). Nonetheless, FMT is logistically challenging and the effects of transplantation fade over time (57, 58). Another strategy includes the use of prebiotics (often fiber supplements) aimed to promote the growth of certain microbes, or probiotics, supplements of beneficial strains (59). A meta-analysis showed positive effects on cognition of Bifidobacterium and Lactobacillus probiotics in patients with MCI (60). However, beneficial butyrate-producing species are often strictly anaerobic or oxygen sensitive, complicating culturing and probiotic production (61). A third strategy is to directly target microbial pathways such as SCFA production, by interventions with high fiber intake or by administering SCFAs including acetate or sodium butyrate (62, 63).
Concluding, we found associations between gut microbiota composition and AD pathology in our memory clinic cohort. Lower abundance of SCFA-producing microbes was associated with higher odds of AD pathology. SCFAs are known to have peripheral immunomodulatory potential, providing a putative target for treatment.
Data Availability Statement
The datasets presented in this study can be found in online repositories. The names of the repository/repositories and accession number(s) can be found below: https://www.ebi.ac.uk/ena/browser/home, accession ID: PRJEB49329.
Ethics Statement
The studies involving human participants were reviewed and approved by Medisch Ethische Toetsingscommissie VUmc. The patients/participants provided their written informed consent to participate in this study.
Author Contributions
WF, CT, FB, PS, and CD contributed to conception and design of the study. HH, FL, AD, ML, and BV collected the data. RK was responsible for the sequencing of the samples. BV performed the statistical analyses. WF, MN, and MM contributed to the interpretation of the results. BV wrote the first draft of the manuscript. All authors contributed to manuscript revision, read, and approved the submitted version.
Funding
Research of Alzheimer Center Amsterdam is part of the neurodegeneration research program of Amsterdam Neuroscience. Alzheimer Center Amsterdam is supported by Stichting Alzheimer Nederland and Stichting VUmc fonds. The chair of WF is supported by the Pasman stichting. WF is recipient of a grant by Stichting Equilibrio and of ZonMW-Memorabel funded #733050814. The SCIENCe project is supported by a research grant of stichting Dioraphte. BV is appointed on an Amsterdam Cardiovascular Sciences (ACSPhD2019P003) and an Alzheimer Nederland grant (WE.03-2017-12). FB is supported by the NIHR biomedical research centre at UCLH. MN is supported by a personal ZONMW-VICI grant 2020 (09150182010020).
Conflict of Interest
CT received grants from the European Commission, the Dutch Research Council (ZonMW), Association of Frontotemporal Dementia/Alzheimer’s Drug Discovery Foundation, The Weston Brain Institute, Alzheimer Netherlands. CT has a collaboration contract with ADx Neurosciences, performed contract research or received grants from Probiodrug, Biogen, Esai, Toyama, Janssen prevention center, Boehringer, AxonNeurosciences, Fujirebio, EIP farma, PeopleBio, and Roche. FB is a consultant for Biogen-Idec, Bayer-Schering, Merck-Serono, Roche, Combinostics and IXICO; has received sponsorship from European Commission–Horizon 2020, National Institute for Health Research–University College London Hospitals Biomedical Research Centre, Novartis, and Merck; and serves on the editorial boards of Radiology, Neuroradiology, Multiple Sclerosis Journal, and Neurology. PS has received consultancy/speaker fees from Lilly, GE Healthcare, Novartis, Sanofi, Nutricia, Probiodrug, Biogen, Roche, Avraham, and EIP Pharma. PS has acquired grant support from GE Healthcare, Danone Research, Piramal, and MERCK. All funding was paid to the institution. MN is part of the Scientific Advisory Board of Caelus Health, The Netherlands and Kaleido Biosciences, USA. However, none of these are directly relevant to the current paper. WF received research funding from ZonMW, NWO, EU-FP7, EU-JPND, Alzheimer Nederland, CardioVascular Onderzoek Nederland, Health~Holland, Topsector Life Sciences & Health, stichting Dioraphte, Gieskes-Strijbis fonds, stichting Equilibrio, Pasman stichting, Biogen MA Inc, Boehringer Ingelheim, Life-MI, AVID, Roche BV, Fujifilm, Combinostics. WF holds the Pasman chair. WF is recipient of ABOARD, which is a public-private partnership receiving funding from ZonMW (#73305095007) and Health~Holland, Topsector Life Sciences & Health (PPP-allowance; #LSHM20106). She has performed contract research for Biogen MA Inc, and Boehringer Ingelheim. She has been an invited speaker at Boehringer Ingelheim, Biogen MA Inc, Danone, Eisai, WebMD Neurology (Medscape). WF is consultant to Oxford Health Policy Forum CIC, Roche, and Biogen MA Inc. WF participated in an advisory board of Biogen MA Inc and Roche. WF was associate editor of Alzheimer, Research & Therapy in 2020/2021. WF is associate editor at Brain. All funding was paid to the institution.
The remaining authors declare that the research was conducted in the absence of any commercial or financial relationships that could be construed as a potential conflict of interest.
Publisher’s Note
All claims expressed in this article are solely those of the authors and do not necessarily represent those of their affiliated organizations, or those of the publisher, the editors and the reviewers. Any product that may be evaluated in this article, or claim that may be made by its manufacturer, is not guaranteed or endorsed by the publisher.
Supplementary Material
The Supplementary Material for this article can be found online at: https://www.frontiersin.org/articles/10.3389/fimmu.2021.794519/full#supplementary-material
References
1. Heneka MT, Carson MJ, Khoury J, Landreth GE, Brosseron F, Feinstein DL, et al. Neuroinflammation in Alzheimer’s Disease. Lancet Neurol (2015) 14:388–405. doi: 10.1016/S1474-4422(15)70016-5
2. Levy M, Kolodziejczyk AA, Thaiss CA, Elinav E. Dysbiosis and the Immune System. Nat Rev Immunol (2017) 17(4):219–32. doi: 10.1038/nri.2017.7
3. van Olst L, Roks SJM, Kamermans A, Verhaar BJH, van der Geest AM, Muller M, et al. Contribution of Gut Microbiota to Immunological Changes in Alzheimer’s Disease. Front Immunol (2021) 12:683068. doi: 10.3389/fimmu.2021.683068
4. Saresella M, Marventano I, Barone M, La Rosa F, Piancone F, Mendozzi L, et al. Alterations in Circulating Fatty Acid Are Associated With Gut Microbiota Dysbiosis and Inflammation in Multiple Sclerosis. Front Immunol (2020) 11:1390. doi: 10.3389/fimmu.2020.01390
5. Moccia M, Clerici M, Keshavarzian A, Engen PA, Zaferiou A, Rasmussen H, et al. Single-Arm, Non-Randomized, Time Series, Single-Subject Study of Fecal Microbiota Transplantation in Multiple Sclerosis. Front Neurol (2020) 11:978. doi: 10.3389/fneur.2020.00978
6. Ley RE, Peterson DA, Gordon JI. Ecological and Evolutionary Forces Shaping Microbial Diversity in the Human Intestine. Cell (2006) 124:837–48. doi: 10.1016/j.cell.2006.02.017
7. Scott KP, Gratz SW, Sheridan PO, Flint HJ, Duncan SH. The Influence of Diet on the Gut Microbiota. Pharmacol Res (2013) 69(1):52–60. doi: 10.1016/j.phrs.2012.10.020
8. Gentile CL, Weir TL. The Gut Microbiota at the Intersection of Diet and Human Health. Science (2018) 362(6416):776–80. doi: 10.1126/science.aau5812
9. Cerf-Bensussan N, Gaboriau-Routhiau V. The Immune System and the Gut Microbiota: Friends or Foes? Nat Rev Immunol (2010) 10:735–44. doi: 10.1038/nri2850
10. Deleu S, Machiels K, Raes J, Verbeke K, Vermeire S. Short Chain Fatty Acids and its Producing Organisms: An Overlooked Therapy for IBD? EBioMedicine (2021) 66:103293. doi: 10.1016/j.ebiom.2021.103293
11. Zhang L, Wang Y, Xiayu X, Shi C, Chen W, Song N, et al. Altered Gut Microbiota in a Mouse Model of Alzheimer’s Disease. J Alzheimer’s Dis (2017) 60(4):1241–57. doi: 10.3233/JAD-170020
12. Sun J, Xu J, Ling Y, Wang F, Gong T, Yang C, et al. Fecal Microbiota Transplantation Alleviated Alzheimer’s Disease-Like Pathogenesis in APP/PS1 Transgenic Mice. Transl Psychiatry (2019) 9(1):1–13. doi: 10.1038/s41398-019-0525-3
13. Kim MS, Kim Y, Choi H, Kim W, Park S, Lee D, et al. Transfer of a Healthy Microbiota Reduces Amyloid and Tau Pathology in an Alzheimer’s Disease Animal Model. Gut (2020) 69:283–94. doi: 10.1136/gutjnl-2018-317431
14. Cox LM, Schafer MJ, Sohn J, Vincentini J, Weiner HL, Ginsberg SD, et al. Calorie Restriction Slows Age-Related Microbiota Changes in an Alzheimer’s Disease Model in Female Mice. Sci Rep (2019) 9(1):1–14. doi: 10.1038/s41598-019-54187-x
15. Fernando WMADB, Martins IJ, Morici M, Bharadwaj P, Rainey-Smith SR, Lim WLF, et al. Sodium Butyrate Reduces Brain Amyloid-β Levels and Improves Cognitive Memory Performance in an Alzheimer’s Disease Transgenic Mouse Model at an Early Disease Stage. J Alzheimer’s Dis (2020) 74(1):91–9. doi: 10.3233/JAD-190120
16. Vogt NM, Kerby RL, Dill-Mcfarland KA, Harding SJ, Merluzzi AP, Johnson SC, et al. Gut Microbiome Alterations in Alzheimer’s Disease. Sci Rep (2017) 7):13537. doi: 10.1038/s41598-017-13601-y
17. Zhuang ZQ, Shen LL, Li WW, Fu X, Zeng F, Gui L, et al. Gut Microbiota Is Altered in Patients With Alzheimer’s Disease. J Alzheimer’s Dis (2018) 63:1337–46. doi: 10.3233/JAD-180176
18. Haran JP, Bhattarai SK, Foley SE, Dutta P, Ward DV, Bucci V, et al. Alzheimer’s Disease Microbiome Is Associated With Dysregulation of the Anti-Inflammatory P-Glycoprotein Pathway. MBio (2019) 10:e00632-19. doi: 10.1128/mBio.00632-19
19. Liu P, Wu L, Peng G, Han Y, Tang R, Ge J, et al. Altered Microbiomes Distinguish Alzheimer’s Disease From Amnestic Mild Cognitive Impairment and Health in a Chinese Cohort. Brain Behav Immun (2019) 80:633–43. doi: 10.1016/j.bbi.2019.05.008
20. Ueda A, Shinkai S, Shiroma H, Taniguchi Y, Tsuchida S, Kariya T, et al. Identification of Faecalibacterium Prausnitzii Strains for Gut Microbiome-Based Intervention in Alzheimer’s-Type Dementia. Cell Rep Med (2021) 2(9):100398. doi: 10.1016/j.xcrm.2021.100398
21. Cattaneo A, Cattane N, Galluzzi S, Provasi S, Lopizzo N, Festari C, et al. Association of Brain Amyloidosis With Pro-Inflammatory Gut Bacterial Taxa and Peripheral Inflammation Markers in Cognitively Impaired Elderly. Neurobiol Aging (2017) 49:60–8. doi: 10.1016/j.neurobiolaging.2016.08.019
22. Mirzayi C, Renson A, Furlanello C, Sansone S-A, Zohra F, Elsafoury S, et al. Reporting Guidelines for Human Microbiome Research: The STORMS Checklist. Nat Med (2021) 27(11):1885–92. doi: 10.1038/s41591-021-01552-x
23. van der Flier WM, Pijnenburg YAL, Prins N, Lemstra AW, Bouwman FH, Teunissen CE, et al. Optimizing Patient Care and Research: The Amsterdam Dementia Cohort. J Alzheimer’s Dis (2014) 41(1):313–27. doi: 10.3233/JAD-132306
24. van der Flier WM, Scheltens P. Amsterdam Dementia Cohort: Performing Research to Optimize Care. J Alzheimer’s Dis (2018) 62(3):1091–111. doi: 10.3233/JAD-170850
25. Slot RER, Verfaillie SCJ, Overbeek JM, Timmers T, Wesselman LMP, Teunissen CE, et al. Subjective Cognitive Impairment Cohort (SCIENCe): Study Design and First Results. Alzheimer’s Res Ther (2018) 10(1):1–13. doi: 10.1186/s13195-018-0390-y
26. Albert MS, DeKosky ST, Dickson D, Dubois B, Feldman HH, Fox NC, et al. The Diagnosis of Mild Cognitive Impairment Due to Alzheimer’s Disease: Recommendations From the National Institute on Aging-Alzheimer’s Association Workgroups on Diagnostic Guidelines for Alzheimer’s Disease. Alzheimer’s Dement (2011) 7(3):270–9. doi: 10.1016/j.jalz.2011.03.008
27. McKhann G, Drachman D, Folstein M, Katzman R, Price D, Stadlan EM. Clinical Diagnosis of Alzheimer’s Disease. Neurology (1984) 34(7):939–9. doi: 10.1212/WNL.34.7.939
28. Tombaugh TN, McIntyre NJ. The Mini-Mental State Examination: A Comprehensive Review. J Am Geriatr Soc (1992) 40(9):922–35. doi: 10.1111/j.1532-5415.1992.tb01992.x
29. Fadrosh DW, Ma B, Gajer P, Sengamalay N, Ott S, Brotman RM, et al. An Improved Dual-Indexing Approach for Multiplexed 16S rRNA Gene Sequencing on the Illumina MiSeq Platform. Microbiome (2014) 2:1–7. doi: 10.1186/2049-2618-2-6
30. Mulder C, Verwey NA, van der Flier WM, Bouwman FH, Kok A, van Elk EJ, et al. Amyloid-β(1–42), Total Tau, and Phosphorylated Tau as Cerebrospinal Fluid Biomarkers for the Diagnosis of Alzheimer Disease. Clin Chem (2010) 56(2):248–53. doi: 10.1373/clinchem.2009.130518
31. Tijms BM, Willemse EAJ, Zwan MD, Mulder SD, Visser PJ, van Berckel BNM, et al. Unbiased Approach to Counteract Upward Drift in Cerebrospinal Fluid Amyloid-β 1–42 Analysis Results. Clin Chem (2018) 64(3):576–85. doi: 10.1373/clinchem.2017.281055
32. Willemse EAJ, Maurik ISv, Tijms BM, Bouwman FH, Franke A, Hubeek I, et al. Diagnostic Performance of Elecsys Immunoassays for Cerebrospinal Fluid Alzheimer’s Disease Biomarkers in a Nonacademic, Multicenter Memory Clinic Cohort: The ABIDE Project. Alzheimer’s Dement Diagn Assess Dis Monit (2018) 10:563. doi: 10.1016/J.DADM.2018.08.006
33. Scheltens P, Kuiper M, Ch Wolters E, Barkhof F, Valk J, Weinsten HC, et al. Atrophy of Medial Temporal Lobes on MRI in “Probable” Alzheimer’s Disease and Normal Ageing: Diagnostic Value and Neuropsychological Correlates. J Neurol Neurosurg Psychiatry (1992) 55:967–72. doi: 10.1136/jnnp.55.10.967
34. Rhodius-Meester HFM, Benedictus MR, Wattjes MP, Barkhof F, Scheltens P, Muller M, et al. MRI Visual Ratings of Brain Atrophy and White Matter Hyperintensities Across the Spectrum of Cognitive Decline Are Differently Affected by Age and Diagnosis. Front Aging Neurosci (2017) 9:117. doi: 10.3389/fnagi.2017.00117
35. Pasquier F, Leys D, Weerts JGE, Mounier-Vehier F, Barkhof F, Scheltens P. Inter-And Intraobserver Reproducibility of Cerebral Atrophy Assessment on Mri Scans With Hemispheric Infarcts. Eur Neurol (1996) 36:268–72. doi: 10.1159/000117270
36. Fazekas F, Chawluk JB, Alavi A, Hurtig HI, Zimmerman RA. MR Signal Abnormalities at 1.5 T in Alzheimer’s Dementia and Normal Aging. Am J Roentgenol (1987) 8:421–426. doi: 10.2214/ajr.149.2.351
37. Wardlaw JM, Smith EE, Biessels GJ, Cordonnier C, Fazekas F, Frayne R, et al. Neuroimaging Standards for Research Into Small Vessel Disease and its Contribution to Ageing and Neurodegeneration. Lancet Neurol (2013) 12:822–38. doi: 10.1016/S1474-4422(13)70124-8
38. Faith DP. Conservation Evaluation and Phylogenetic Diversity. Biol Conserv (1992) 61(1):1–10. doi: 10.1016/0006-3207(92)91201-3
39. Hill MO. Diversity and Evenness: A Unifying Notation and Its Consequences. Ecology (1973) 54(2):427–32. doi: 10.2307/1934352
40. Chen T, Guestrin C. XGBoost: A Scalable Tree Boosting System. In: Proceedings of the ACM SIGKDD International Conference on Knowledge Discovery and Data Mining (2016) 785–94. doi: 10.1145/2939672.2939785
41. Wang X-W, Liu Y-Y. Comparative Study of Classifiers for Human Microbiome Data. Med Microecol (2020) 4:100013. doi: 10.1016/j.medmic.2020.100013
42. Braniste V, Al-Asmakh M, Kowal C, Anuar F, Abbaspour A, Tóth M, et al. The Gut Microbiota Influences Blood-Brain Barrier Permeability in Mice. Sci Transl Med (2014) 6(263):263ra158. doi: 10.1126/scitranslmed.3009759
43. Xaio H, Banks WA, Niehoff ML, Morley JE. Effect of LPS on the Permeability of the Blood–Brain Barrier to Insulin. Brain Res (2001) 896(1–2):36–42. doi: 10.1016/S0006-8993(00)03247-9
44. Moissl-Eichinger C, Willing BP, Burke CM, Lukiw WJ. Bacteroides Fragilis Lipopolysaccharide and Inflammatory Signaling in Alzheimer’s Disease. Front Microbiol (2016) 7:1544. doi: 10.3389/fmicb.2016.01544
45. Shen Y, Torchia MLG, Lawson GW, Karp CL, Ashwell JD, Mazmanian SK. Outer Membrane Vesicles of a Human Commensal Mediate Immune Regulation and Disease Protection. Cell Host Microbe (2012) 12(4):509–20. doi: 10.1016/j.chom.2012.08.004
46. Wang Y, Begum-Haque S, Telesford KM, Ochoa-Repáraz J, Christy M, Kasper EJ, et al. A Commensal Bacterial Product Elicits and Modulates Migratory Capacity of CD39+ CD4 T Regulatory Subsets in the Suppression of Neuroinflammation. Gut Microbes (2014) 5(4):552–61. doi: 10.4161/gmic29797
47. Venegas DP, de la Fuente MK, Landskron G, González MJ, Quera R, Dijkstra G, et al. Short Chain Fatty Acids (SCFAs) Mediated Gut Epithelial and Immune Regulation and Its Relevance for Inflammatory Bowel Diseases. Front Immunol (2019) 10:277. doi: 10.3389/fimmu.2019.00277
48. Wenzel TJ, Gates EJ, Ranger AL, Klegeris A. Short-Chain Fatty Acids (SCFAs) Alone or in Combination Regulate Select Immune Functions of Microglia-Like Cells. Mol Cell Neurosci (2020) 105:103493. doi: 10.1016/j.mcn.2020.103493
49. Verberk IMW, Laarhuis MB, van den Bosch KA, Ebenau JL, van Leeuwenstijn M, Prins ND, et al. Serum Markers Glial Fibrillary Acidic Protein and Neurofilament Light for Prognosis and Monitoring in Cognitively Normal Older People: A Prospective Memory Clinic-Based Cohort Study. Lancet Heal Longev (2021) 2(2):e87–95. doi: 10.1016/S2666-7568(20)30061-1
50. Claesson MJ, Jeffery IB, Conde S, Power SE, O’connor EM, Cusack S, et al. Gut Microbiota Composition Correlates With Diet and Health in the Elderly. Nature (2012) 488(7410):178–84. doi: 10.1038/nature11319
51. Poehlman ET, Dvorak RV. Energy Expenditure, Energy Intake, and Weight Loss in Alzheimer Disease. Am J Clin Nutr (2000) 71(2):650S–5S. doi: 10.1093/ajcn/71.2.650s
52. Doorduijn AS, Schueren MAE devd, Rest Ov de, Leeuw FA de, Hendriksen HMA, Teunissen CE, et al. Energy Intake and Expenditure in Patients With Alzheimer’s Disease and Mild Cognitive Impairment: The NUDAD Project. Alzheimer’s Res Ther (2020) 12(1):1–8. doi: 10.1186/s13195-020-00687-2
53. Vieira AT, Fukumori C, Ferreira CM. New Insights Into Therapeutic Strategies for Gut Microbiota Modulation in Inflammatory Diseases. Clin Transl Immunol (2016) 5(6):e87. doi: 10.1038/cti.2016.38
54. Meijnikman AS, Gerdes VE, Nieuwdorp M, Herrema H. Evaluating Causality of Gut Microbiota in Obesity and Diabetes in Humans. Endocr Rev (2018) 39(2):133–53. doi: 10.1210/er.2017-00192
55. Groot P, Nikolic T, Pellegrini S, Sordi V, Imangaliyev S, Rampanelli E, et al. Faecal Microbiota Transplantation Halts Progression of Human New-Onset Type 1 Diabetes in a Randomised Controlled Trial. Gut (2021) 70(1):92–105. doi: 10.1136/gutjnl-2020-322630
56. Hartstra AV, Schüppel V, Imangaliyev S, Schrantee A, Prodan A, Collard D, et al. Infusion of Donor Feces Affects the Gut–Brain Axis in Humans With Metabolic Syndrome. Mol Metab (2020) 42:101076. doi: 10.1016/j.molmet.2020.101076
57. Kootte RS, Levin E, Salojärvi J, Smits LP, Hartstra AV, Udayappan SD, et al. Improvement of Insulin Sensitivity After Lean Donor Feces in Metabolic Syndrome Is Driven by Baseline Intestinal Microbiota Composition. Cell Metab (2017) 26(4):611–619.e6. doi: 10.1016/j.cmet.2017.09.008
58. Chen J, Zaman A, Ramakrishna B, Olesen SW. Stool Banking for Fecal Microbiota Transplantation: Methods and Operations at a Large Stool Bank. Front Cell Infect Microbiol (2021) 0:281. doi: 10.3389/fcimb.2021.622949
59. Sanders ME, Merenstein DJ, Reid G, Gibson GR, Rastall RA. Probiotics and Prebiotics in Intestinal Health and Disease: From Biology to the Clinic. Nat Rev Gastroenterol Hepatol (2019) 16(10):605–16. doi: 10.1038/s41575-019-0173-3
60. Zhu G, Zhao J, Zhang H, Chen W, Wang G. Probiotics for Mild Cognitive Impairment and Alzheimer’s Disease: A Systematic Review and Meta-Analysis. Foods (2021) 10(7):1672. doi: 10.3390/foods10071672
61. Andrade JC, Almeida D, Domingos M, Seabra CL, Machado D, Freitas AC, et al. Commensal Obligate Anaerobic Bacteria and Health: Production, Storage, and Delivery Strategies. Front Bioeng Biotechnol (2020) 8:1–23. doi: 10.3389/fbioe.2020.00550
62. Wijdeveld M, Nieuwdorp M, IJzerman R. The Interaction Between Microbiome and Host Central Nervous System: The Gut-Brain Axis as a Potential New Therapeutic Target in the Treatment of Obesity and Cardiometabolic Disease. Expert Opin Ther Targets (2020) 24(7):639–53. doi: 10.1080/14728222.2020.1761958
Keywords: gut microbiota, microbiome, Alzheimer’s disease, amyloid beta, P-tau, MRI
Citation: Verhaar BJH, Hendriksen HMA, de Leeuw FA, Doorduijn AS, van Leeuwenstijn M, Teunissen CE, Barkhof F, Scheltens P, Kraaij R, van Duijn CM, Nieuwdorp M, Muller M and van der Flier WM (2022) Gut Microbiota Composition Is Related to AD Pathology. Front. Immunol. 12:794519. doi: 10.3389/fimmu.2021.794519
Received: 13 October 2021; Accepted: 31 December 2021;
Published: 31 January 2022.
Edited by:
Guillaume Dorothee, U938 Centre de Recherche Saint Antoine (CRSA) (INSERM), FranceReviewed by:
Nathalie Rolhion, Institut National de la Santé et de la Recherche Médicale (INSERM), FranceLaura M. Cox, Harvard Medical School, United States
Barbara B. Bendlin, University of Wisconsin-Madison, United States
Copyright © 2022 Verhaar, Hendriksen, de Leeuw, Doorduijn, van Leeuwenstijn, Teunissen, Barkhof, Scheltens, Kraaij, van Duijn, Nieuwdorp, Muller and van der Flier. This is an open-access article distributed under the terms of the Creative Commons Attribution License (CC BY). The use, distribution or reproduction in other forums is permitted, provided the original author(s) and the copyright owner(s) are credited and that the original publication in this journal is cited, in accordance with accepted academic practice. No use, distribution or reproduction is permitted which does not comply with these terms.
*Correspondence: Barbara J. H. Verhaar, b.j.verhaar@amsterdamumc.nl