 Peng Feng
 Zhenqing Li2
 Yuelin Zhang
- 1Neurosurgery Shaanxi Provincial People’s Hospital, Xi’an, China
- 2Medical College of Nantong University, Nantong, China
- 3Hengyang Medical School, University of South China, Hengyang, China
- 4Graduate Office Xi’an Medical University, Xi’an, China
Glioblastoma multiforme (GBM) has been identified as a frequently occurring adult primary brain cancer that is highly aggressive. Currently, the prognostic outcome for GBM patients is dismal, even with intensive treatment, and the median overall survival (OS) is 14.6 months. Immunotherapy, which is specific at the cellular level and can generate persistent immunosurveillance, is now becoming a promising tool to treat diverse cancers. However, the complicated nature of the tumor microenvironment (TME) makes it challenging to develop anti-GBM immunotherapy because several cell types, cytokines, and signaling pathways are involved in generating the immunosuppressive environment. Novel immunotherapies can illustrate novel tumor-induced immunosuppressive mechanisms. Here, we used unsupervised clustering analysis to identify different subtypes of immune cell infiltration that actuated different prognoses, biological actions, and immunotherapy responses. Gene cluster A, with a hot immune cell infiltration phenotype, had high levels of immune-related genes (IRGs), which were associated with immune pathways including the interferon-gamma response and interferon-alpha response, and had low IDH1 and ATRX mutation frequencies. Gene cluster B, a cold immune cell infiltration subtype, exhibited a high expression of the KCNIP2, SCRT1, CPLX2, JPH3, UNC13A, GABRB3, ARPP21, DLGAP1, NRXN1, DLL3, CA10, MAP2, SEZ6L, GRIA2, and GRIA4 genes and a low expression of immune-related genes, i.e., low levels of immune reactivity. Our study highlighted the complex interplay between immune cell infiltration and genetic mutation in the establishment of the tumor immune phenotype. Gene cluster A was identified as an important subtype with a better prognosis and improved immunotherapy response.
Introduction
Glioblastoma multiforme (GBM) is the most aggressive and most lethal primary brain tumor and often occurs as a primary brain cancer in adults (1). GBM tumors are characterized by aggressive growth, intensive angiogenesis, and poor prognosis. The median survival is approximately 15 months when a modern protocol of complex treatment is used (1–3). Currently, there is no efficient therapy available for relapsed or advanced GBM cases. Due to the plasticity and proliferation capacity of tumor stem cells, GBM has strong radiation resistance, and radiotherapy and chemotherapy cannot effectively eliminate CSCs (4). Thus, the development of fundamentally novel approaches to GBM treatment is needed. Immunotherapy (IT) is one such treatment with great potential. Over the last decade, immune checkpoint inhibitor (ICI)-based immunotherapies have achieved immense success in the treatment of diverse cancers. Nonetheless, according to a recent clinical trial, an objective response was achieved in just 8% of cases in which the ICI programmed cell death 1 (PD-1) was used to treat relapsed GBM. A recent study highlighted the importance of GBM heterogeneity, which makes this kind of cancer among the most challenging to treat (5). The different patterns of heterogeneity in glioma show different chromosome, genome, and transcriptome characteristics (5) and different patterns of biomarkers and driver genes (6). Based on these characteristics, we can obtain different effective and detailed targets for different biological models of GBM. Emerging evidence suggests that intratumoral heterogeneity may also influence tumor immune responses. Cancer heterogeneity may influence antigens and particular gene mutations, which can be recognized by the immune system and then regulate the immune response (7). However, more efforts are needed to explain the underlying mechanism associated with alterations in response patterns. The improved responses to anti-PD-1 therapy have been related to greater tumor mutation burdens among diverse cancers as well as T-cell infiltrating degrees within the tumor microenvironment (TME). Defining reliable targets for the prediction of the ICI response is still a major challenge because of the dynamic nature and complexity of the immune response in the TME (8, 9). Several studies have shown that primary GBM can be divided into distinct immune subgroups, which can be defined by gene expression profiles (10, 11). However, the underlying molecular principles driving the establishment and maintenance of the tumor immune phenotype are still not addressed in detail. Here, we aim to reveal the complexity of immune cell infiltration and epigenetic alterations and their impact on the establishment and maintenance of the tumor immune microenvironment and tumor prognosis. Our study not only showed the molecular mechanism of how cancer cells evade immune surveillance but also identified the key genes that regulate immune cell infiltration and activate immune-related pathways. Many studies have shown that metastasis is the most lethal development, especially brain metastasis. Many works have reported that lung adenocarcinoma, breast cancer, and bladder cancer can produce brain metastasis at a significant frequency (12–15) and cause poor treatment outcomes and poor prognosis (12, 14, 16). Esophageal cancer can affect intestinal microorganisms (17, 18) and indirectly promote the development of GBM, leading to a poor prognosis (19–25). Low-grade glioma can also cause secondary GBM (26). Thus, we conducted an external validation [in esophageal carcinoma (ESCA), low-grade glioma (LGG), lung adenocarcinoma (LUAD), breast cancer (BRCA), and bladder cancer (BLAD) cohorts] to verify the ability of those gene clusters to predict the prognosis of other tumors. Our findings showed that the activated key genes have the potential to improve the risk assessment of GBM under immunotherapy and enable early stratification of patients with cancer at a higher risk for treatment failure who may benefit from combination therapy targeting newly identified key genes.
Materials and Methods
Datasets and Data Normalization
The gene expression matrix of 1,092 patients and complete survival information were downloaded as follows: 145 samples (TCGA-GBM) from The Cancer Genome Atlas (TCGA) database (https://portal.gdc.cancer.gov/), 693 samples from the Chinese Glioma Genome Atlas (CGGA)-GBM, and 254 samples from the Gene Expression Omnibus (GEO) datasets (GSE7696 and GSE4412). Detailed survival data were available for 474 samples, including 141 samples in TCGA, 195 samples in CGGA, and 137 samples in the GEO datasets. Normalization of the data was conducted after multiple datasets were merged, and then the expression values were log-transformed. We used the “ComBat” algorithm to reduce the impact of the probable batch effects (27). Furthermore, we obtained segment data on copy numbers at FireBrowse (http://firebrowse.org), and the immune cell marker genes were acquired from the TISIDB (http://cis.hku.hk/TISIDB/data/download/CellReports.txt). The gene expression matrix and related clinical data of TCGA-BRCA, TCGA-LUAD, TCGA-BLAD, TCGA-ESCA, and TCGA-LGG were acquired from the TCGA database.
Consensus Clustering for Different Immune Cell Infiltration Subtypes
We used consensus clustering to stratify and cluster those samples based on the immune cell infiltration pattern with a specific pattern in which the “km” analysis, Pearson’s distance, and Ward’s linkage-based unsupervised clustering approach were conducted by the “Consensus Cluster Plus” R package (28). To ensure clustering stability, we repeated the aforementioned process approximately 100 times.
Differentially Expressed Genes Associated With the Immune Cell Infiltration Phenotype
We used the limma package (29) to acquire the differentially expressed genes (DEGs) between the two clusters (cluster A and cluster B). The absolute fold-change cutoff was designated as >1, and P <0.05 was identified as significant.
Consensus Clustering for Different Gene Subtypes
In order to reveal the correlation between the tumor immune subtypes and epigenetic events, we used consensus clustering with “PAM” analysis (parameters: reps, 100; pItem, 0.8; pFeature, 1; Ward.D2 and Euclidean distance, k = 3) based on those DEG expression matrix data to stratify those samples into different gene subtypes. The aforementioned process was repeated 100 times to ensure clustering stability.
Gene Set Variation Analysis and Functional Annotation
To explore the biological event differences in different subtypes, the gene set variation analysis (GSVA) package in R (30) software was used to conduct the biological function analysis (11). In addition, “h.all.v7.5.1.symbols.gmt” was downloaded from the MSigDB dataset, and P <0.5 was considered significant.
Collection of Somatic Alteration Data
The mutation data were acquired from TCGA-GBM (https://portal.gdc.cancer.gov/), and we evaluated the total number of non-synonymous mutations in GBM. Then, we used the “maftools” R package (https://rdrr.io/bioc/maftools/) to identify the significantly mutated genes between different gene clusters based on the top 80% of the genes with the highest alteration frequency. A P-value <0.05 was identified as statistically significant.
Chemotherapeutic Response Prediction
Based on the largest public pharmacogenomics database, namely, the Genomics of Drug Sensitivity in Cancer (GDSC), the “pRRophetic” function of the R package (31) was adopted for predicting chemotherapeutic responses to paclitaxel and cisplatin in every sample. The package determined the half-maximal inhibitory concentration (IC50) of GDSC training set samples through 10-fold cross-validation (13).
Copy Number Variation Analysis
Copy number variation (CNV) data (GBM.snp:genome_wide_snp_6:broad_mit_edu:Level_3:segmented_scna_minus_germline_cnv_hg18:seg.seg) were acquired from http://www.firebrowse.org/. A segment_Mean >0.1 was identified as a gain and a value less than −0.1 as a loss. We used the package “BSgenome.Hsapiens.UCSC.hg19” to analyze the copy number variation of different subtypes.
Gene Expression Data After Immunotherapy
For further investigation of immunotherapy response, we downloaded the IMvigor210 datasets, which include data from 298 urothelial cancer patients who received immunotherapy and detailed information about the response to PD-L1 blockade; these data can be obtained from an accessible, well-documented software and data package (32). Then, we used the IMvigor210 datasets to analyze the value of different gene clusters in the predicted PD-1 response.
Statistical Analysis
The R 4.0.0 package was used for all statistical analyses. The Wilcoxon signed-rank test was carried out for pairwise comparative analysis, whereas multiple groups were compared using the Kruskal–Wallis test (33). The false discovery rates (FDRs) in limma and gene set enrichment analysis (GSEA) were adjusted by the Benjamini–Hochberg approach at the P <0.05 significance level. The “survival” package (34) was used to determine the difference in survival between different subtypes. The correlation between categorical clinical information and the defined clusters was statistically examined by Fisher’s exact test. P <0.05 was identified as statistically significant.
Results
Different Immune Cell Infiltration Profiles
Four gene expression datasets, including the TCGA-GBM, CGGA-GBM, and GEO datasets (GSE7696 and GSE4412), comprising 1,092 samples in total, were subjected to ssGSEA computational algorithms to predict the immune cell infiltration score. Based on the 28 immune cell types, we used unsupervised hierarchical cluster analysis to identify two main clusters: A and B (Figure 1A). Cluster A exhibited high infiltration by the activation of 28 immune cells (Figure 1B). Cluster A was also associated with a better survival rate (Figure 1C) and was enriched in the interferon-alpha response, interferon-gamma response, and IL2 stat5 signaling (Figure 1D), which demonstrated that cluster A more readily produced an immune response than cluster B. Furthermore, this study derived a correlation coefficient heatmap for visualizing 28 tumor-infiltrating immune cell types (Figure 1E). The two clusters had 34 DEGs (differentially expressed genes) (Table S1), as shown in Figure 1F.
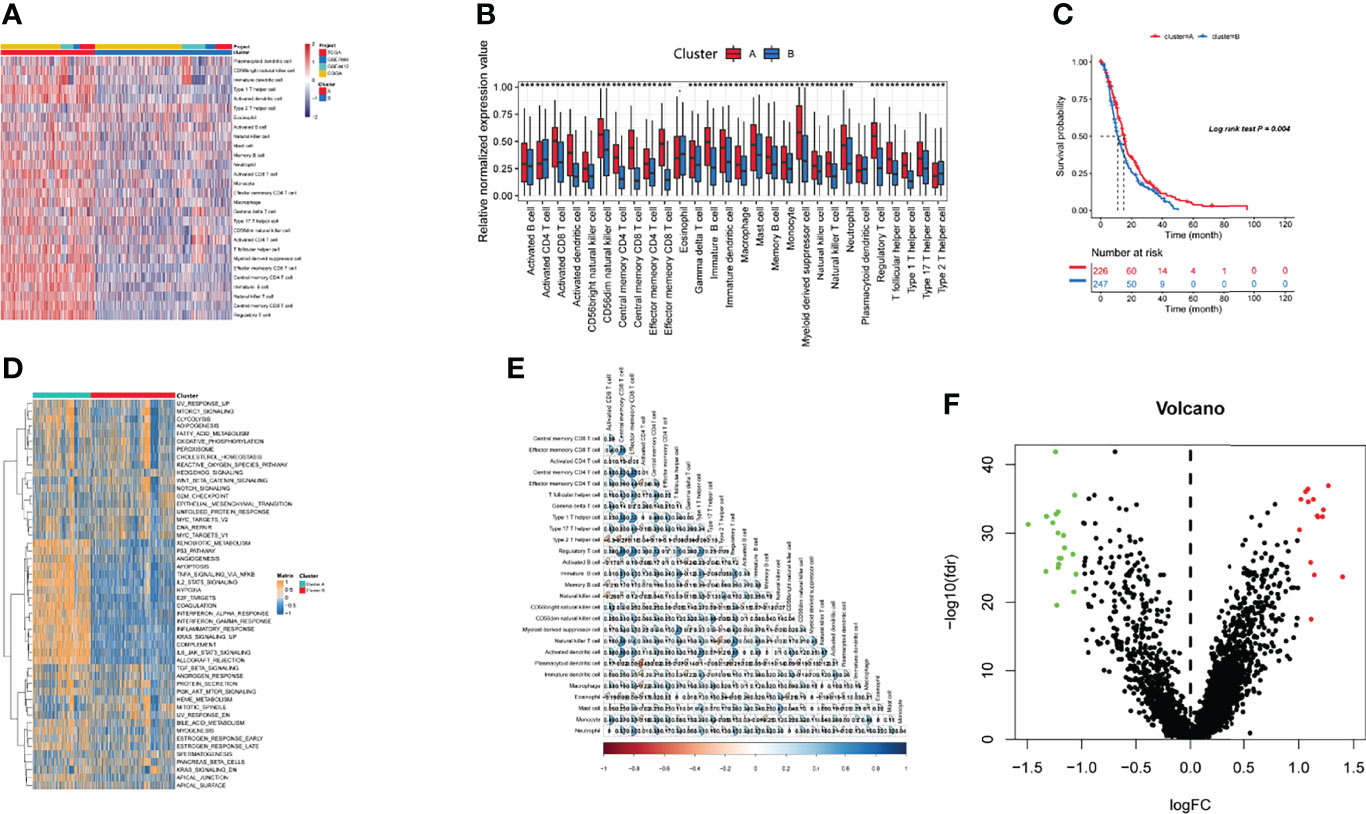
Figure 1 Identification of immunogenic subtypes. (A) Landscapes for the 28 infiltrating immune cell types of both clusters. (B) The distribution of tumor-infiltrating immune cells in the two clusters. (C) Survival analysis of the two clusters. (D) Heatmaps of 50 hallmark pathways with differential activation in different clusters. (E) The correlations with different immune cells. (F) Differentially expressed genes in the two clusters. (***p ≤ 0.001).
Identified Gene Subtypes Based on the DEGs
Recent studies have used gene expression data to define different immune subtypes and divide tumor patients into immunotherapy response groups (10, 11). Thus, we used consensus clustering analysis of the gene expression data of 34 DEGs to identify different gene clusters (gene cluster A and gene cluster B) (Figure 2A). Gene cluster A can be defined as a hot immune cell infiltration type (Figure 2B), associated with a better survival rate (Figure 2C). Moreover, we pictured a correlation coefficient heatmap for visualizing 34 gene expression levels (Figure 2D). Furthermore, immune-related genes, including CD274, CTLA4, HAVCR2, IDO1, LAG3, and PDCD1, were identified as immune checkpoint-relevant signature genes, and CD8A, CXCL10, CXCL9, GZMA, GZMB, IFNG, PRF1, TBX2, and TNF (immune-activity-relevant signature genes) were overexpressed in gene cluster A compared with the other subtypes. This indicated that gene cluster A is associated with high levels of immune reactivity (Figure 2E). Because MHC class I complexes present tumor-associated antigens, they are essential for immune surveillance and can help to improve the clinical responses of immunotherapy targeting immune checkpoints (35). Here, we assessed the B2M and HLA gene expression levels in the two gene clusters. The results showed that the expression of all B2M and HLA genes was progressively reduced in gene cluster B, suggesting that impaired antigen presentation may be the evasion mechanism of gene cluster B in the immune response (Figure 2F). First, we compared the activation status of 50 tumorigenesis-related pathways in the two gene clusters. We observed the significance of the IL6–JAK–STAT3 signaling, interferon-alpha response, and interferon-gamma response pathways in gene cluster B (Figure 3A). IFNG can regulate innate and adaptive immune responses (35–37), and increasing evidence has identified that IFNG can enhance antigen presentation, T-lymphocyte differentiation, and maturation to activate the tumor immune response (36, 38, 39). In our study, gene cluster A had abundant immune cell infiltration and strong immune pathway activity, which indicated that gene cluster A is a better fit for immunotherapy. Genetic alterations significantly affect the formation of tumor genetic subtypes. As Figure 3B shows, we found that gene cluster B had the highest total tumor mutation load. Gene cluster B had high mutation frequencies of IDH1 (12.1%) and ATRX (12.1%) (Table 1), indicating that patients in gene cluster B with ICI treatment failure may benefit from combined inhibition with IDH1 and ATRX. Furthermore, we evaluated the IC50 of paclitaxel and cisplatin, and the study indicated that the gene cluster A patients showed stronger responses (P < 0.05) to paclitaxel and cisplatin therapy than did the gene cluster B patients (Figure 3C). We also assessed the copy number changes in the two subtypes, and significant increases in both copy loss and gain were found for gene cluster A compared to gene cluster B (Figure 3D). For gene cluster B, copy number variation was primarily observed within the 12q13.2 chromosomal region, while no such variation in this region was observed for gene cluster A (Figure 3E).
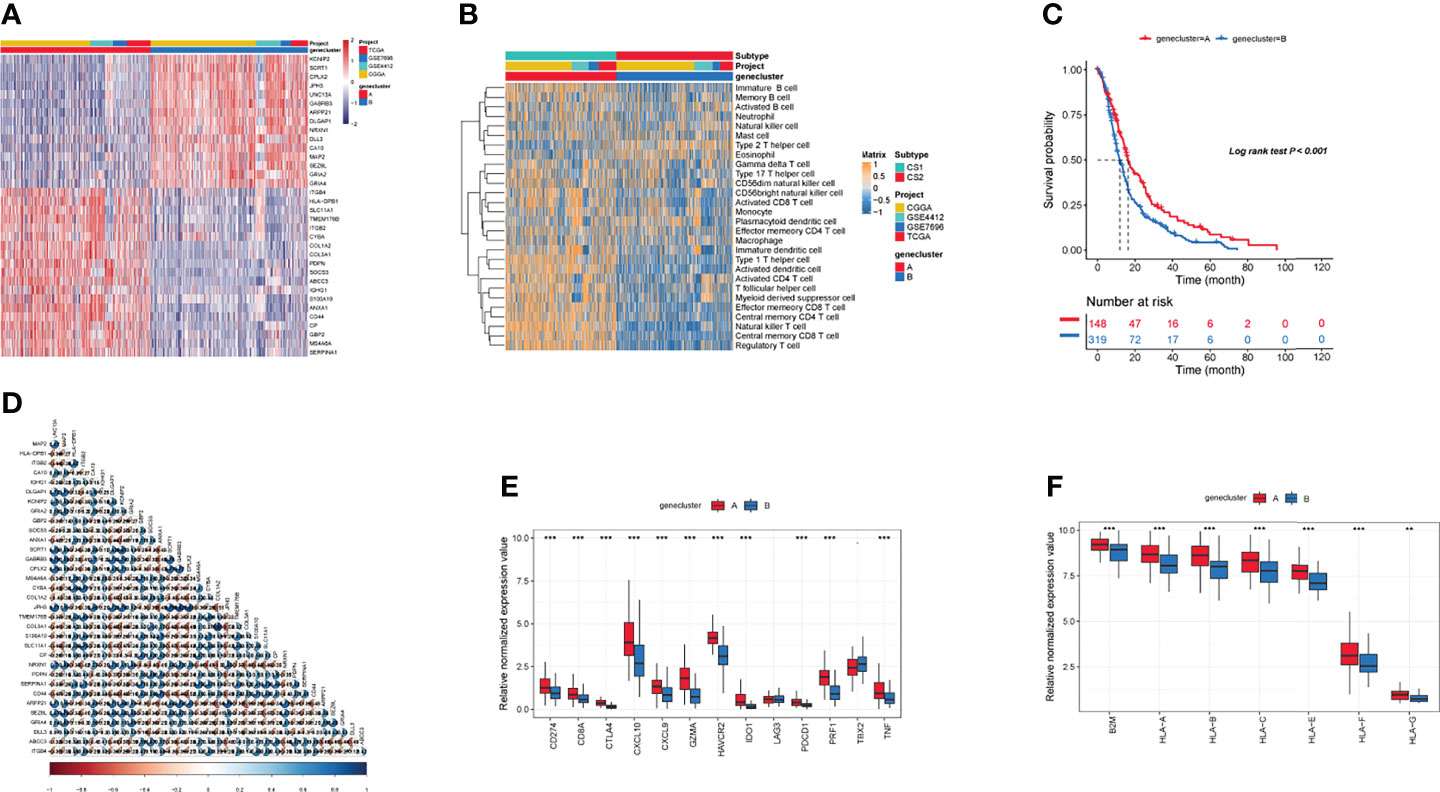
Figure 2 Identification of gene subtypes. (A) The landscapes of 34 differentially expressed genes in the two gene clusters. (B) Heatmaps of infiltration of 28 immune cell types in different gene clusters. (C) Survival analysis in the two gene clusters. (D) The correlation in 34 genes in the tumor patients. (E) Expression of genes related to immune activation (CD8A, CXCL9, CXCL10, GZMA, GZMB, IFNG, PRF1, TNF, TBX2) and immune checkpoints (CD274, IDO1, PDCD1, HAVCR2, LAG3, CTLA4) within the two gene clusters. (F) The distribution of B2M and HLA genes in the two gene clusters. (**p ≤ 0.01; ***p ≤ 0.001).
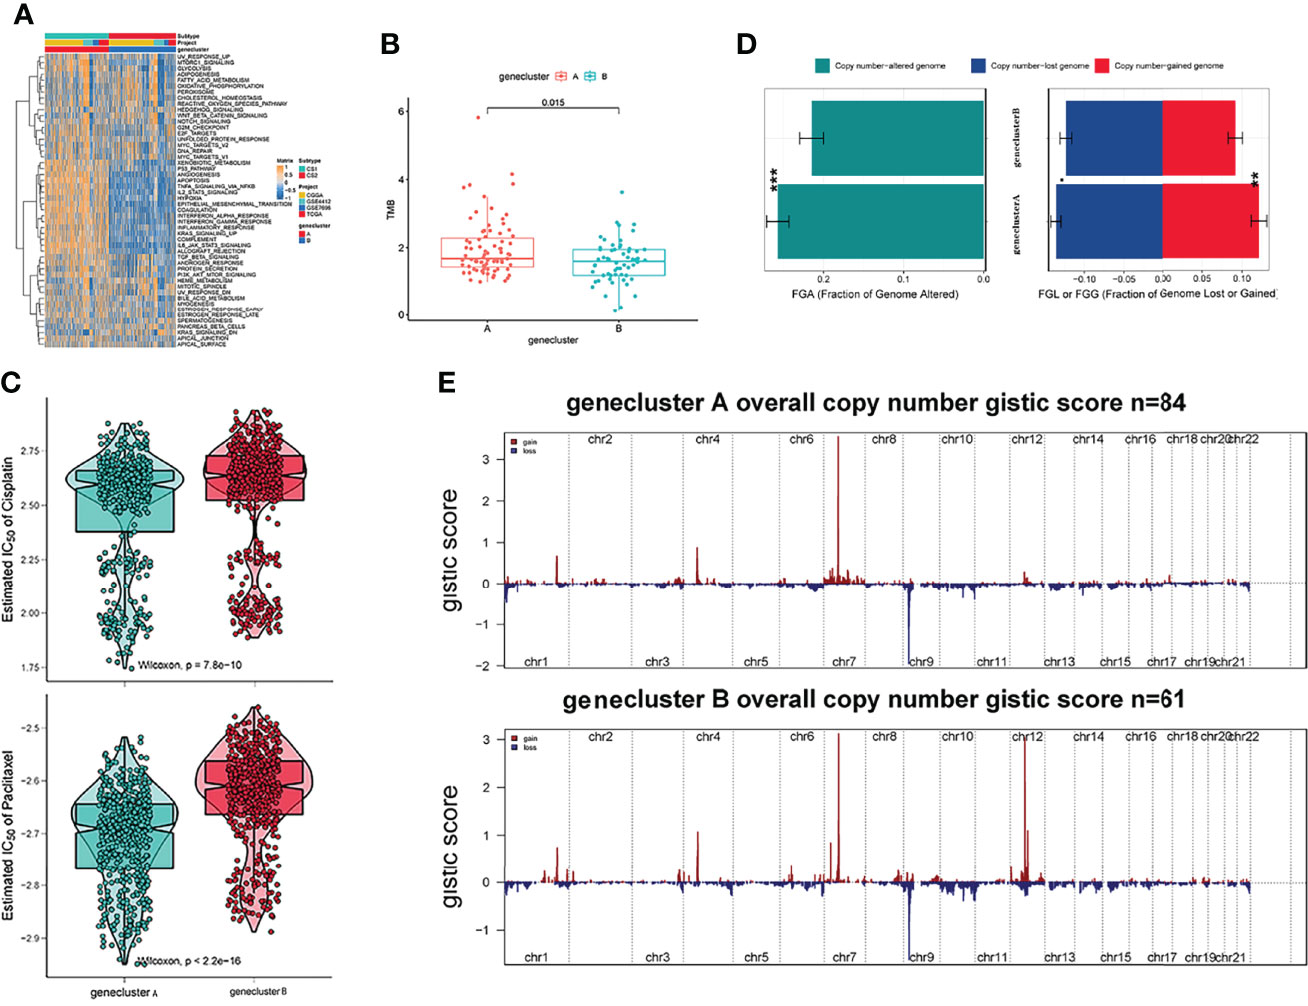
Figure 3 Genetic alteration landscape among glioblastoma multiforme (GBM) genomic subtypes. (A) Heatmaps of 50 hallmark pathways with differential activation in different gene clusters. (B) The distribution of tumor burden mutations in different gene clusters. (C) Patients with gene cluster A are likely to receive greater benefit from cisplatin and paclitaxel treatment. (D) Fraction genome gain/loss (FGA/FGG) and fraction genome altered (FGA) distributions. Bar charts show the mean ± SEM. (E) The G score plot of the deleted or amplified genomic regions in gene clusters was determined using GISTIC 2.0. The G score was determined by multiplying copy numbers by the frequency across cases. (**p ≤ 0.01; ***p ≤ 0.001).
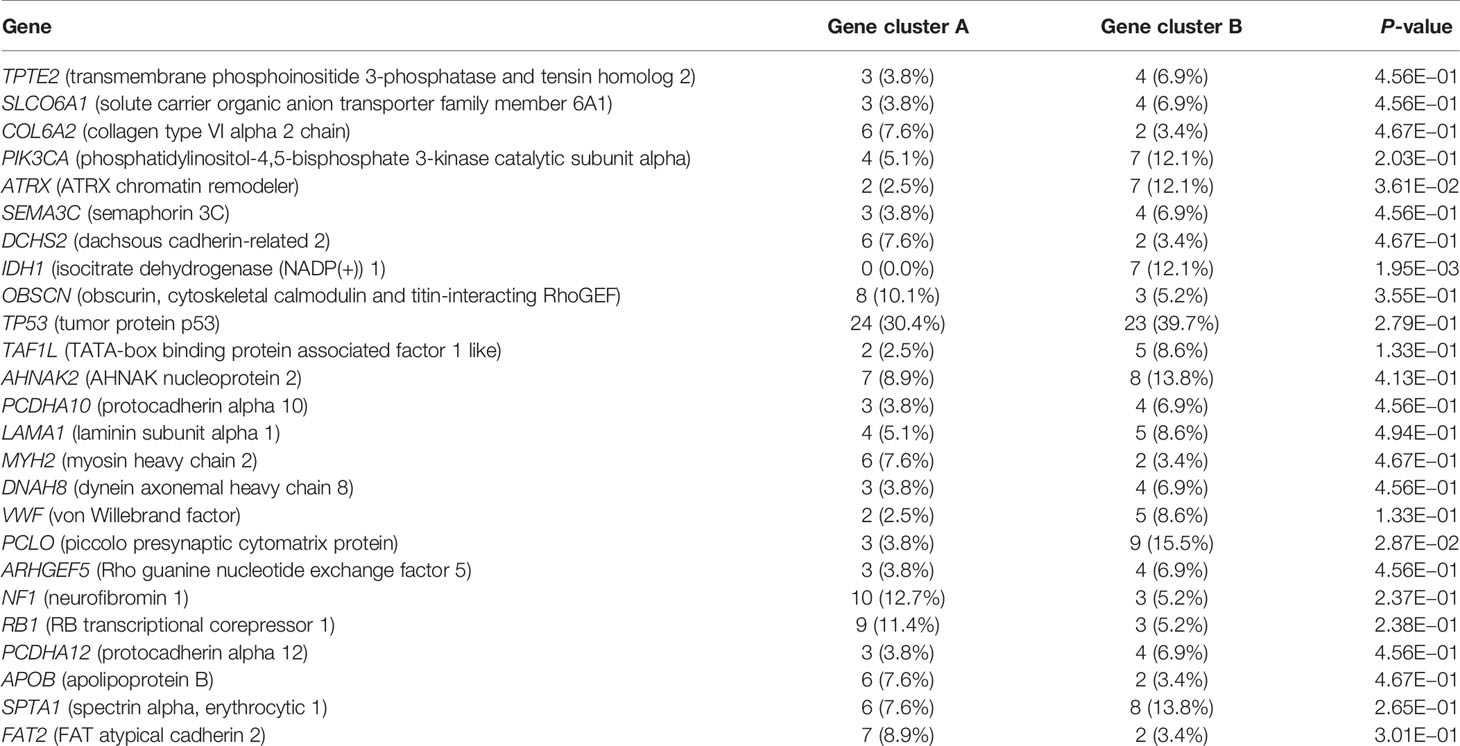
Table 1 Association of different subtypes with somatic variants.
Immunotherapy Response
Since transcriptomic data are extensively utilized in cancer studies, we evaluated 100 specific genes with significant upregulation as classifiers for all subtypes based on the GBM cohort. We produced genetic signatures composed of these sets of 100 genes to predict the subtypes of GBM cases in the external datasets (Figures 4A, B). The results revealed that the cluster A subtype had a high CR/PR of 28.3% compared with the cluster B subtype (Figure 4C). In the IMvigor210 cohort, the cluster A subtype had an increased OS rate compared with additional subtypes from anti-PD-1 treatment (Figure 4D).
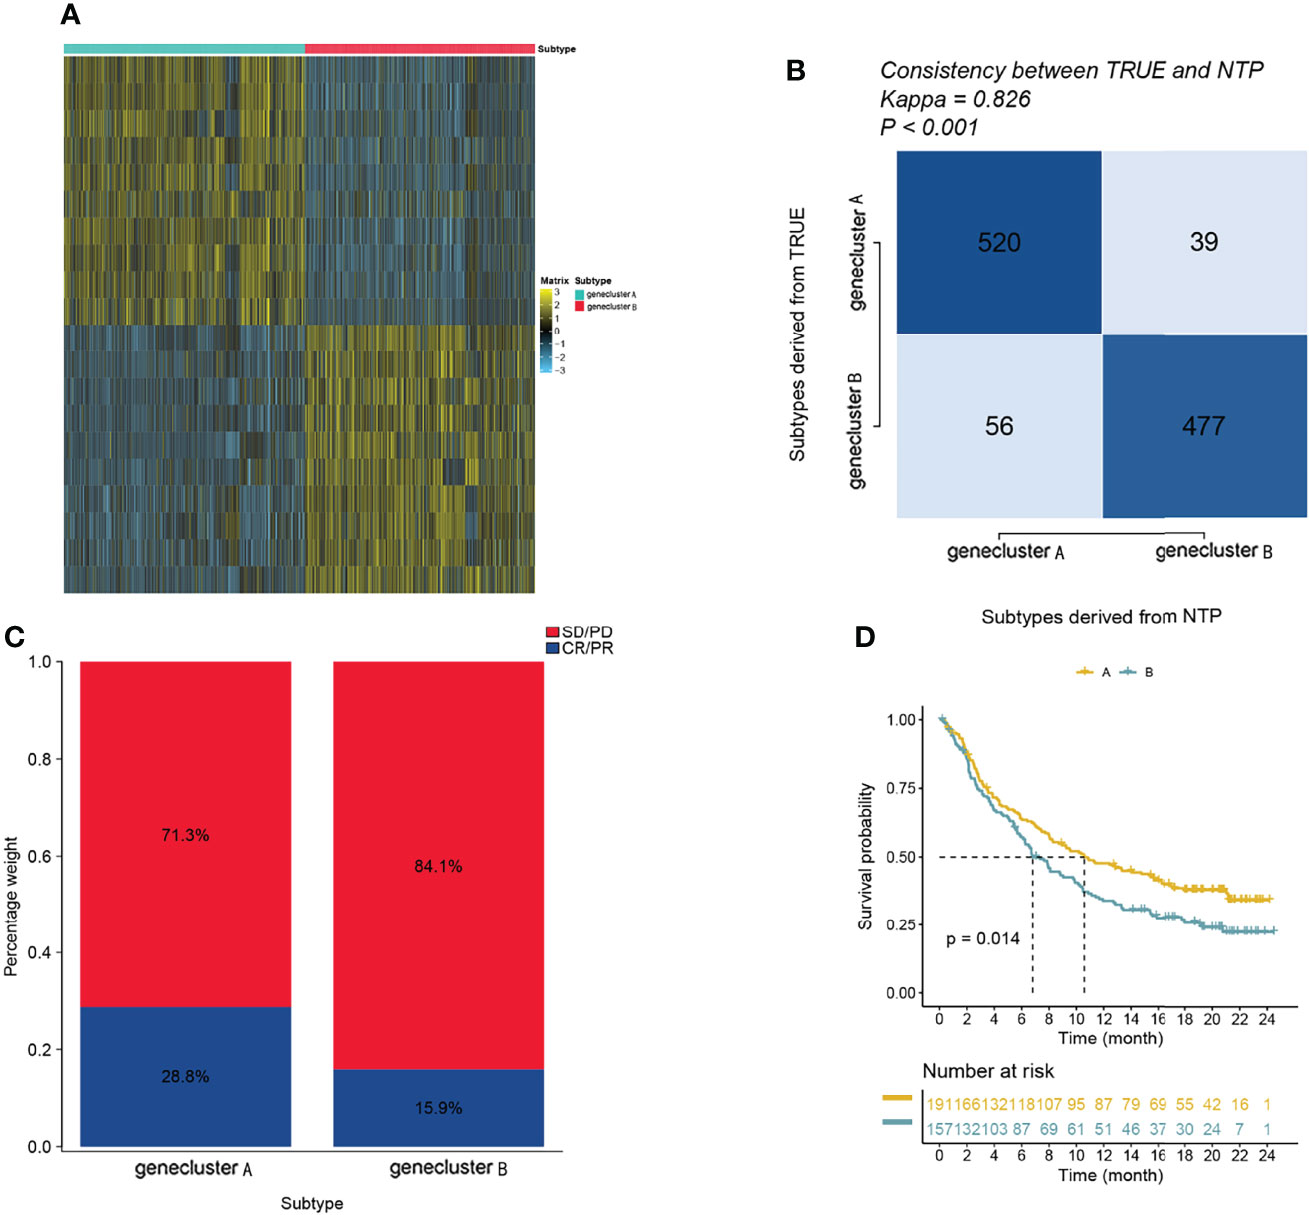
Figure 4 The role of gene clusters in the prediction of immunotherapeutic benefits. (A) Heatmap showing significantly upregulated biomarkers with subtype specificity examined by limma for GBM subtypes. (B) Consistency heatmap using Kappa statistics. (C) Different subtypes with varying anti-PD-1 responses. (D) Kaplan–Meier graphs of different subtypes in the IMvigor210 cohort.
Validation of Diverse Clinical Outcomes of Subtypes in External Cohorts
To reproduce those two subtypes, the 100 most significant genes in every subtype relative to the remaining two were selected and assigned as gene clusters A and B. Then, the clinical outcomes of cases in the BRCA, LUAD, BLAD, ESCA, and LGG cohorts were compared. Patients showed similar survival rates regardless of cluster assignment, although those from cluster B showed the poorest clinical outcomes (P < 0.05, Figure 5).
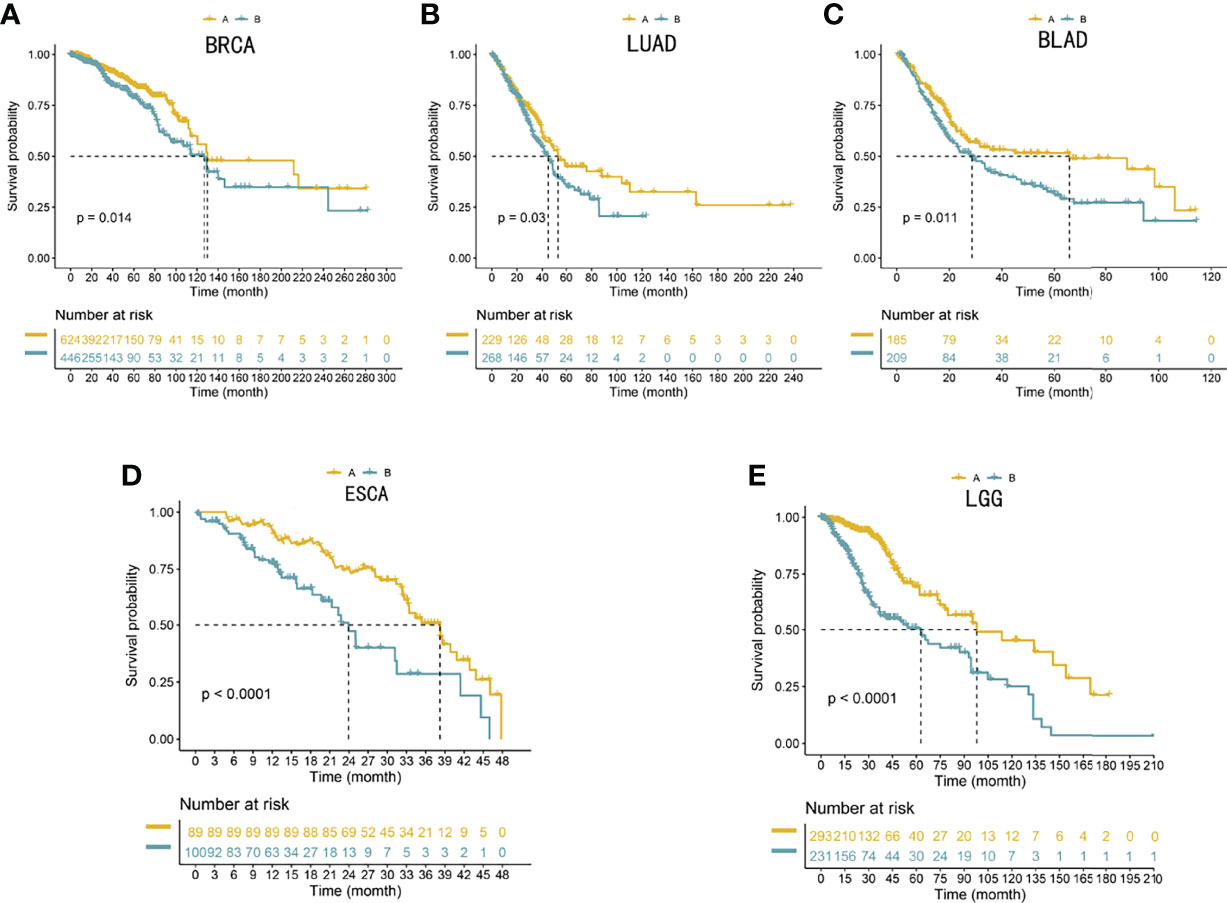
Figure 5 (A–E) Validation of the 100-gene signature to reproduce the five gene subtypes in external cohorts. Log-rank tests and Kaplan–Meier curves were adopted for displaying and comparing the OS between the two subtypes. The Benjamini–Hochberg step-up method was utilized to adjust the P-values in the two subtypes.
Discussion
Glioblastoma
GBM is a common intracranial tumor with a high degree of malignancy; it is characterized by fast growth, strong invasion, a high frequency of recurrence, and poor prognosis (40, 41). The treatment of GBM poses two main problems. First, because of the high malignancy, rapid progression, 3–5-day cancer cell cycle, and short disease course, GBM relapse after even radical surgery becomes inevitable. Second, cancer cells adapt to potentially invade the surrounding non-carcinoma tissues; they can approach some lobes, deeper structures, or the contralateral hemisphere via the corpus callosum (42, 43). Hence, it is imperative to avoid metastasis and improve prognosis in patients with GBM. Previous clinical trials of immunotherapies suggest that immunotherapy is highly effective in inhibiting cancer progression and improving patient quality of life. Recently, significant advances have been made in immune cell infiltration into central nervous system (CNS) tumors, but immunotherapy still shows a low response rate in GBM. Thus, it is urgent to understand the molecular mechanisms underlying immune cell infiltration and immune escape and the related gene expression characteristics of the tumor cells themselves and the TME to improve the effect of ICI therapy. Here, we used unsupervised hierarchical cluster analysis to identify two different immune cell infiltration clusters. Variations in prognosis, immune cell infiltration, and underlying biological function among distinct subgroups were assessed. Cluster A, also called the inflammatory subtype, had high expression levels of immune-related genes; high activation of immune-associated pathways such as the interferon-alpha response, interferon-gamma response, and IL2 stat5 signaling; and a better survival rate. Conversely, cluster B demonstrated the worst prognosis, which may be impacted by tumor-related pathways such as apoptosis, hypoxia, and E2F targets.
Thirty-four DEGs between two immune subtypes showed clear differential expression between hot immune cell infiltration (cluster A) and cold immune cell infiltration (cluster B). For establishing the relationship between tumor immune subtypes and epigenetic events, we identified the different gene clusters. Gene cluster A can be identified as a hot immune subtype, characterized by better prognosis, high expression levels of immune-related genes, and low mutation frequencies of IDH1 and ATRX. A recent study showed that IDH1 and ATRX mutations can regulate the innate immune response in gliomas, which also enhances the invasiveness of gliomas and facilitates glioma development (44, 45). Gene cluster B had high mutation frequencies of IDH1 (12.1%) and ATRX (12.1%) (Table 1), which indicated that patients in gene cluster B with ICI treatment failure may benefit from combined treatment with IDH1 and ATRX inhibitors. Gene cluster B can be called the cold immune subtype, associated with poor prognosis, and we found that the 12q13.2 region gain is associated with gene cluster B. Chemotherapy remains the principal method for cancer treatment, with paclitaxel and cisplatin being the classical drugs. We also observed that the gene cluster A patients were more likely to respond to paclitaxel and cisplatin therapy (P < 0.05) than the gene cluster B patients. Among the two gene clusters, the immune-related genes (CD274, CTLA4, HAVCR2, IDO1, LAG3, and PDCD1) and immune activity-relevant genes (CD8A, CXCL10, CXCL9, GZMA, GZMB, IFNG, PRF1, TBX2, and TNF) were expressed at higher levels in the gene cluster A subtype than in the other subtypes, indicating that gene cluster A has a high level of immunoreactivity, which means that it has a high level of immune activation and can then elicit an effective immune response. The evaluation of patients receiving immunotherapy by IMvigor210 showed a remarkable enrichment of gene cluster A in patients who responded to immunotherapy (28.3%), confirming the predictive value of this genetic profile. This suggests that the existing immunity has anticancer activity, which may have a positive effect on the immunotherapy response.
Many studies have reported that lung adenocarcinoma, breast cancer, and bladder cancer can significantly produce brain metastasis (13–15) and cause poor treatment outcomes and poor prognosis (12, 14, 16). A recent study showed that the gut microbiota can promote the development of glioma (22, 24), especially with respect to cell proliferation and tumor invasiveness phenotypes (19–21). The gut microbiota presents unique changes in esophageal cancer and can indirectly cause the deterioration of GBM and lead to a poor prognosis of GBM (19–25). Recent studies have shown that low-grade glioma can also cause secondary GBM (26). To evaluate the ability of those gene clusters to predict the prognosis of other tumors, we conducted an external validation (ESCA, LGG, LUAD, BRCA, and BLAD cohorts). We selected the top 100 specific genes with the highest values in each subtype to reproduce the two gene clusters, representing the separation of gene cluster A and gene cluster B. The clinical prognosis of gene cluster A was better in all five external cohorts (P < 0.05, Figure 5).
In our study, gene cluster A could be classified as an effective immune response subtype, demonstrating that GBM samples with a gene cluster A-related gene expression signature have effective cytotoxic immune cells. Through a comprehensive analysis of multiple omics data, we revealed the high mutation frequency of IDH1 and ATRX mutations as a marker of gene cluster B, taking into account genetic and epigenetic changes as well as the effects of gene mutations. This observation indicates that patients with GBM at a higher risk for treatment failure might benefit from targeted IDH1 and ATRX inhibition in combination with ICI. Our study differs from other recently published studies (11) mainly because we performed a comprehensive analysis of multiple omics data to highlight the association between tumor immune subtypes and epigenetic patterns. We identified gene cluster A as a key tumor immune response subtype, with high levels of tumor-infiltrating cytotoxic immune cells and consequent high efficacy of ICI therapy.
While the existing studies mainly focus on the expression of specific genes (46), our study mainly focused on subtypes that were constructed by the expression profiles of multiple genes and revealed the various mechanisms of immune regulation and the tumor immune response. This system may be more stable and less sensitive to changes in the expression of single genes.
In summary, this study comprehensively analyzes the immune cell infiltration pattern in GBM and sheds more light on pro-/antitumor immune modulation within GBM. Differences in gene expression patterns were associated with tumor heterogeneity and treatment complexity. Hence, this study identified a key gene expression subtype that can be considered relevant to immunotherapy and chemotherapy response and can help promote the individualized treatment of tumors (Figure 6).
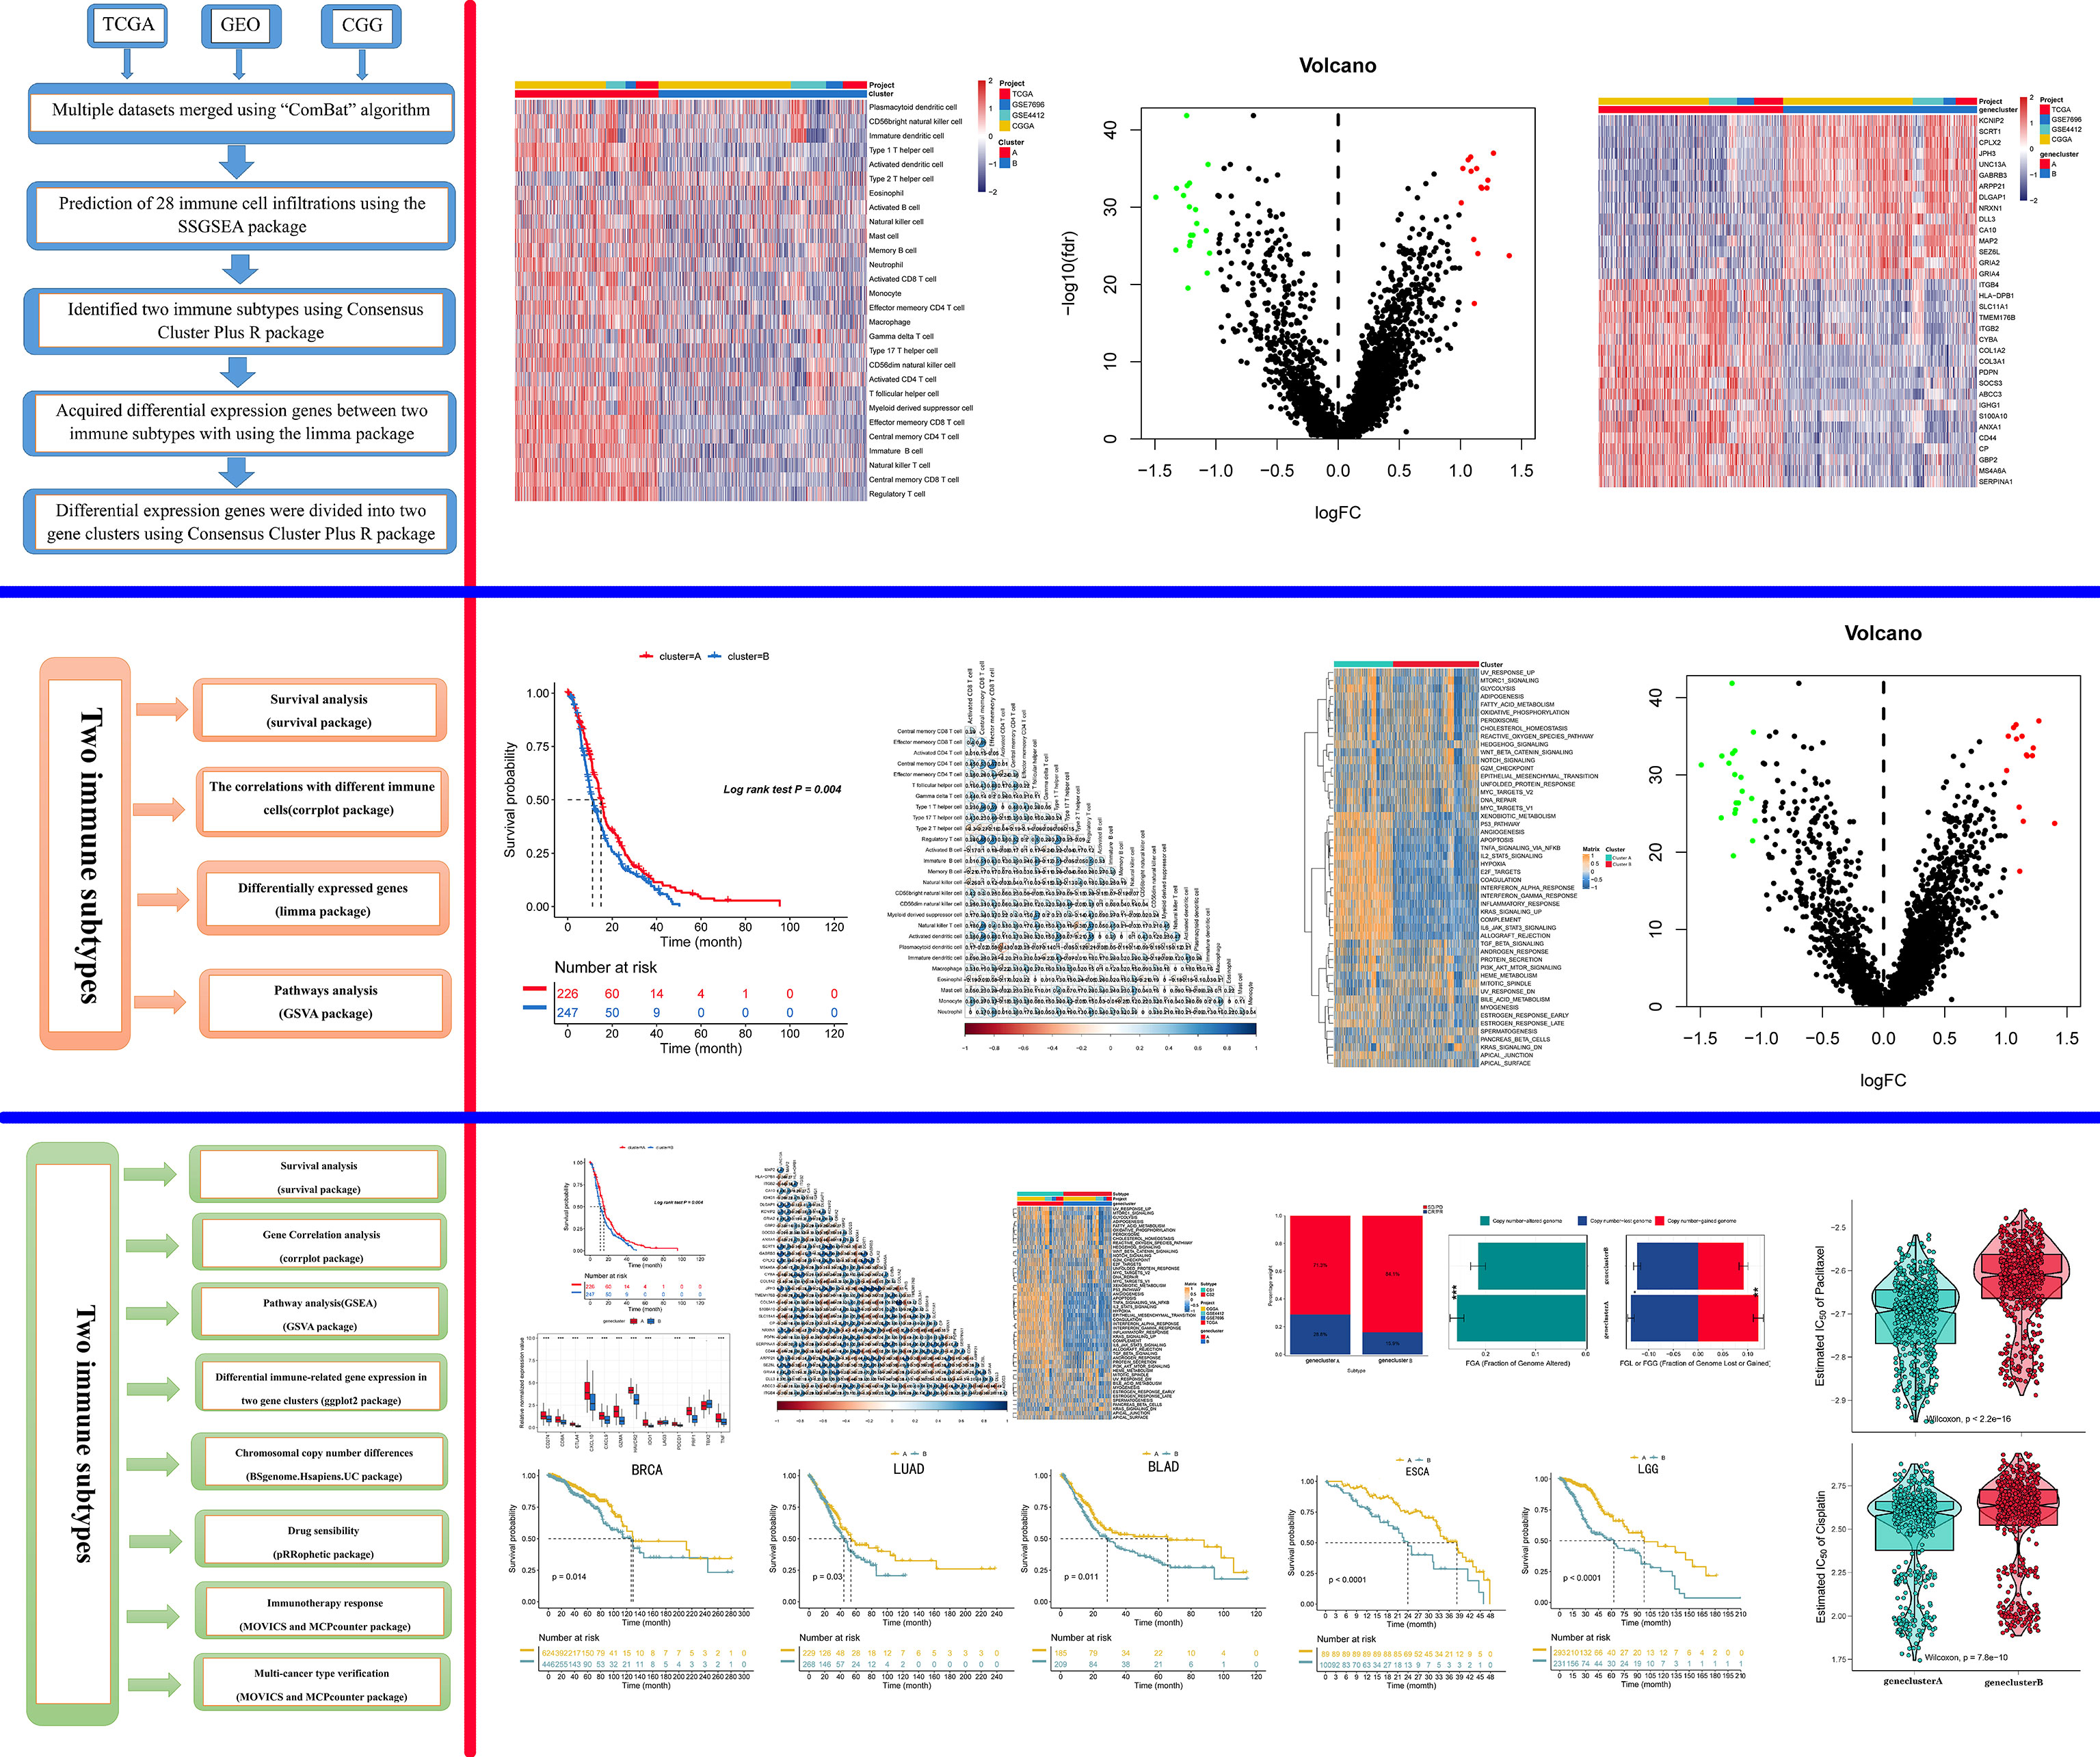
Figure 6 Graphical abstract. The model of a complex multi-omics regulation of the tumor immune phenotype in GBM.
Data Availability Statement
The datasets presented in this study can be found in online repositories. The names of the repository/repositories and accession number(s) can be found in the article/Supplementary Material.
Author Contributions
PF and XM conceived and designed the study, obtained funding, and drafted the manuscript. PF and ZL acquired the data and drafted the manuscript. PF critically revised the manuscript. ZL,YL and YZ performed statistical analysis and technical support. All authors contributed to the article and approved the submitted version.
Funding
This study was supported by a grant (grant number: 2022SF-166) from the Key Project of Shaanxi Province-the field of Social Development.
Conflict of Interest
The authors declare that the research was conducted in the absence of any commercial or financial relationships that could be construed as a potential conflict of interest.
Publisher’s Note
All claims expressed in this article are solely those of the authors and do not necessarily represent those of their affiliated organizations, or those of the publisher, the editors and the reviewers. Any product that may be evaluated in this article, or claim that may be made by its manufacturer, is not guaranteed or endorsed by the publisher.
Supplementary Material
The Supplementary Material for this article can be found online at: https://www.frontiersin.org/articles/10.3389/fimmu.2022.799509/full#supplementary-material
References
1. Lukas RV, Wainwright DA, Ladomersky E, Sachdev S, Sonabend AM, Stupp R. Newly Diagnosed Glioblastoma: A Review on Clinical Management. Oncol (Williston Park) (2019) 33(3):91–100.
2. Gimple RC, Bhargava S, Dixit D, Rich JN. Glioblastoma Stem Cells: Lessons From the Tumor Hierarchy in a Lethal Cancer. Genes Dev (2019) 33(11-12):591–609. doi: 10.1101/gad.324301.119
3. Gilbert MR, Dignam JJ, Armstrong TS, Wefel JS, Blumenthal DT, Vogelbaum MA, et al. A Randomized Trial of Bevacizumab for Newly Diagnosed Glioblastoma. N Engl J Med (2014) 370(8):699–708. doi: 10.1056/NEJMoa1308573
4. Lathia JD, Mack SC, Mulkearns-Hubert EE, Valentim CL, Rich JN. Cancer Stem Cells in Glioblastoma. Genes Dev (2015) 29(12):1203–17. doi: 10.1101/gad.261982.115
5. Eder K, Kalman B. Molecular Heterogeneity of Glioblastoma and its Clinical Relevance. Pathol Oncol Res (2014) 20(4):777–87. doi: 10.1007/s12253-014-9833-3
6. Herrera-Oropeza GE, Angulo-Rojo C, Gástelum-López SA, Varela-Echavarría A, Hernández-Rosales M, Aviña-Padilla K. Glioblastoma Multiforme: A Multi-Omics Analysis of Driver Genes and Tumour Heterogeneity. Interface Focus (2021) 11(4):20200072. doi: 10.1098/rsfs.2020.0072
7. Jamal-Hanjani M, Thanopoulou E, Peggs KS, Quezada SA, Swanton C. Tumour Heterogeneity and Immune-Modulation. Curr Opin Pharmacol (2013) 13(4):497–503. doi: 10.1016/j.coph.2013.04.006
8. Binnewies M, Roberts EW, Kersten K, Chan V, Fearon DF, Merad M, et al. Understanding the Tumor Immune Microenvironment (TIME) for Effective Therapy. Nat Med (2018) 24(5):541–50. doi: 10.1038/s41591-018-0014-x
9. Chen DS, Mellman I. Elements of Cancer Immunity and the Cancer-Immune Set Point. Nature (2017) 541(7637):321–30. doi: 10.1038/nature21349
10. Yang K, Shi Y, Luo M, Mao M, Zhang X, Chen C, et al. Identification of a Unique Tumor Cell Subset Employing Myeloid Transcriptional Circuits to Create an Immunomodulatory Microenvironment in Glioblastoma. Oncoimmunology (2022) 11(1):2030020. doi: 10.1080/2162402X.2022.2030020
11. Thorsson V, Gibbs DL, Brown SD, Wolf D, Bortone DS, Ou Yang T-H, et al. The Immune Landscape of Cancer. Immunity (2018) 48(4):812–30.e14. doi: 10.1016/j.immuni.2018.03.023
12. Cosgrove N, Varešlija D, Keelan S, Elangovan A, Atkinson JM, Cocchiglia S, et al. Mapping Molecular Subtype Specific Alterations in Breast Cancer Brain Metastases Identifies Clinically Relevant Vulnerabilities. Nat Commun (2022) 13(1):514. doi: 10.1038/s41467-022-27987-5
13. Shih DJ, Nayyar N, Bihun I, Dagogo-Jack I, Gill CM, Aquilanti E, et al. Genomic Characterization of Human Brain Metastases Identifies Drivers of Metastatic Lung Adenocarcinoma. Nat Genet (2020) 52(4):371–7. doi: 10.1038/s41588-020-0592-7
14. Chen C, Guo Q, Tang Y, Qu W, Zuo J, Ke X, et al. Screening and Evaluation of the Role of Immune Genes of Brain Metastasis in Lung Adenocarcinoma Progression Based on the TCGA and GEO Databases. J Thorac Dis (2021) 13(8):5016–34. doi: 10.21037/jtd-21-935
15. Koh YW, Han J-H, Haam S, Lee HW. An Immune-Related Gene Expression Signature Predicts Brain Metastasis in Lung Adenocarcinoma Patients After Surgery: Gene Expression Profile and Immunohistochemical Analyses. Transl Lung Cancer Res (2021) 10(2):802–14. doi: 10.21037/tlcr-20-1056
16. Yao Z, Zheng Z, Ke W, Wang R, Mu X, Sun F, et al. Prognostic Nomogram for Bladder Cancer With Brain Metastases: A National Cancer Database Analysis. J Transl Med (2019) 17(1):411. doi: 10.1186/s12967-019-2109-7
17. Chen C, Chen L, Lin L, Jin D, Du Y, Lyu J. Research Progress on Gut Microbiota in Patients With Gastric Cancer, Esophageal Cancer, and Small Intestine Cancer. Appl Microbiol Biotechnol (2021) 105(11):4415–25. doi: 10.7150/jca.29072
18. Deng Y, Tang D, Hou P, Shen W, Li H, Wang T, et al. Dysbiosis of Gut Microbiota in Patients With Esophageal Cancer. Microb Pathog (2021) 150:104709. doi: 10.1016/j.micpath.2020.104709
19. Sepich-Poore GD, Zitvogel L, Straussman R, Hasty J, Wargo JA, Knight R. The Microbiome and Human Cancer. Science (2021) 371(6536):1317–41. doi: 10.1126/science.abc4552
20. Routy B, Le Chatelier E, Derosa L, Duong CP, Alou MT, Daillère R, et al. Gut Microbiome Influences Efficacy of PD-1-Based Immunotherapy Against Epithelial Tumors. Science (2018) 359(6371):91–7. doi: 10.1126/science.aan3706
21. Matson V, Fessler J, Bao R, Chongsuwat T, Zha Y, Alegre M-L, et al. The Commensal Microbiome is Associated With Anti-PD-1 Efficacy in Metastatic Melanoma Patients. Science (2018) 359(6371):104–8. doi: 10.1126/science.aao3290
22. D'Alessandro G, Antonangeli F, Marrocco F, Porzia A, Lauro C, Santoni A, et al. Gut Microbiota Alterations Affect Glioma Growth and Innate Immune Cells Involved in Tumor Immunosurveillance in Mice. Eur J Immunol (2020) 50(5):705–11. doi: 10.1002/eji.201948354
23. Patrizz A, Dono A, Zorofchian S, Hines G, Takayasu T, Husein N, et al. Glioma and Temozolomide Induced Alterations in Gut Microbiome. Sci Rep (2020) 10(1):21002. doi: 10.1038/s41598-020-77919-w
24. Rothhammer V, Borucki DM, Tjon EC, Takenaka MC, Chao C-C, Ardura-Fabregat A, et al. Microglial Control of Astrocytes in Response to Microbial Metabolites. Nature (2018) 557(7707):724–8. doi: 10.1038/s41586-018-0119-x
25. Mehrian-Shai R, Reichardt JK, Harris CC, Toren A. The Gut-Brain Axis, Paving the Way to Brain Cancer. Trends Cancer (2019) 5(4):200–7. doi: 10.1016/j.trecan.2019.02.008
26. Pallud J, Fontaine D, Duffau H, Mandonnet E, Sanai N, Taillandier L, et al. Natural History of Incidental World Health Organization Grade II Gliomas. Ann Neurol (2010) 68(5):727–33. doi: 10.1002/ana.22106
27. Johnson WE, Li C, Rabinovic A. Adjusting Batch Effects in Microarray Expression Data Using Empirical Bayes Methods. Biostatistics (2007) 8(1):118–27. doi: 10.1093/biostatistics/kxj037
28. Wilkerson MD, Hayes DN. ConsensusClusterPlus: A Class Discovery Tool With Confidence Assessments and Item Tracking. Bioinformatics (2010) 26(12):1572–3. doi: 10.1093/bioinformatics/btq170
29. Ritchie ME, Phipson B, Wu D, Hu Y, Law CW, Shi W, et al. Limma Powers Differential Expression Analyses for RNA-Sequencing and Microarray Studies. Nucleic Acids Res (2015) 43(7):e47. doi: 10.1093/nar/gkv007
30. Hänzelmann S, Castelo R, Guinney J. GSVA: Gene Set Variation Analysis for Microarray and RNA-Seq Data. BMC Bioinf (2013) 14:7. doi: 10.1186/1471-2105-14-7
31. Geeleher P, Cox N, Huang RS. Prrophetic: An R Package for Prediction of Clinical Chemotherapeutic Response From Tumor Gene Expression Levels. PloS One (2014) 9(9):e107468. doi: 10.1371/journal.pone.0107468
32. Mariathasan S, Turley SJ, Nickles D, Castiglioni A, Yuen K, Wang Y, et al. Tgfβ Attenuates Tumour Response to PD-L1 Blockade by Contributing to Exclusion of T Cells. Nature (2018) 554(7693):544–8. doi: 10.1038/nature25501
33. Guo S, Zhong S, Zhang A. Privacy-Preserving Kruskal-Wallis Test. Comput Methods Programs BioMed (2013) 112(1):135–45. doi: 10.1016/j.cmpb.2013.05.023
34. Holleczek B, Gondos A, Brenner H. periodR - an R Package to Calculate Long-Term Cancer Survival Estimates Using Period Analysis. Methods Inf Med (2009) 48(2):123–8. doi: 10.3414/ME0563
35. Schumacher TN, Schreiber RD. Neoantigens in Cancer Immunotherapy. Science (2015) 348(6230):69–74. doi: 10.1126/science.aaa4971
36. Alspach E, Lussier DM, Schreiber RD. Interferon γ and Its Important Roles in Promoting and Inhibiting Spontaneous and Therapeutic Cancer Immunity. Cold Spring Harb Perspect Biol (2019) 11(3). doi: 10.1101/cshperspect.a028480
37. Ivashkiv LB. Ifnγ: Signalling, Epigenetics and Roles in Immunity, Metabolism, Disease and Cancer Immunotherapy. Nat Rev Immunol (2018) 18(9):545–58. doi: 10.1038/s41577-018-0029-z
38. Overacre-Delgoffe AE, Chikina M, Dadey RE, Yano H, Brunazzi EA, Shayan G, et al. Interferon-γ Drives Treg Fragility to Promote Anti-Tumor Immunity. Cell (2017) 169(6):1130–41.e11. doi: 10.1016/j.cell.2017.05.005
39. Castro F, Cardoso AP, Gonçalves RM, Serre K, Oliveira MJ. Interferon-Gamma at the Crossroads of Tumor Immune Surveillance or Evasion. Front Immunol (2018) 9:847. doi: 10.3389/fimmu.2018.00847
40. Jiang E, Xu Z, Wang M, Yan T, Huang C, Zhou X, et al. Tumoral Microvesicle-Activated Glycometabolic Reprogramming in Fibroblasts Promotes the Progression of Oral Squamous Cell Carcinoma. FASEB J (2019) 33(4):5690–703. doi: 10.1096/fj.201802226R
41. Adesina AM, Nalbantoglu J, Cavenee WK. P53 Gene Mutation and Mdm2 Gene Amplification are Uncommon in Medulloblastoma. Cancer Res (1994) 54(21):5649–51.
42. Lai J-P, Oseini AM, Moser CD, Yu C, Elsawa SF, Hu C, et al. The Oncogenic Effect of Sulfatase 2 in Human Hepatocellular Carcinoma is Mediated in Part by Glypican 3-Dependent Wnt Activation. Hepatology (2010) 52(5):1680–9. doi: 10.1002/hep.23848
43. Vortmeyer AO, Stavrou T, Selby D, Li G, Weil RJ, Park WS, et al. Deletion Analysis of the Adenomatous Polyposis Coli and PTCH Gene Loci in Patients With Sporadic and Nevoid Basal Cell Carcinoma Syndrome-Associated Medulloblastoma. Cancer (1999) 85(12):2662–7. doi: 10.1002/(SICI)1097-0142(19990615)85:12<2662::AID-CNCR24>3.0.CO;2-0
44. Udugama M, Hii L, Garvie A, Cervini M, Vinod B, Chan F-L, et al. Mutations Inhibiting KDM4B Drive ALT Activation in ATRX-Mutated Glioblastomas. Nat Commun (2021) 12(1):2584. doi: 10.1038/s41467-021-22543-z
45. Hu C, Wang K, Damon C, Fu Y, Ma T, Kratz L, et al. ATRX Loss Promotes Immunosuppressive Mechanisms in IDH1 Mutant Glioma. Neuro Oncol (2021) 24:888–900. doi: 10.1093/neuonc/noab292
Keywords: GBM, PD-1 inhibitor, immune cell infiltration, TCGA, immunotherapy
Citation: Feng P, Li Z, Li Y, Zhang Y and Miao X (2022) Characterization of Different Subtypes of Immune Cell Infiltration in Glioblastoma to Aid Immunotherapy. Front. Immunol. 13:799509. doi: 10.3389/fimmu.2022.799509
Received: 21 October 2021; Accepted: 18 May 2022;
Published: 21 June 2022.
Edited by:
Anna Maria Di Giacomo, Siena University Hospital, ItalyReviewed by:
Adriane Feijo Evangelista, Barretos Cancer Hospital, BrazilKatia Aviña-Padilla, University of Illinois at Urbana-Champaign, United States
Copyright © 2022 Feng, Li, Li, Zhang and Miao. This is an open-access article distributed under the terms of the Creative Commons Attribution License (CC BY). The use, distribution or reproduction in other forums is permitted, provided the original author(s) and the copyright owner(s) are credited and that the original publication in this journal is cited, in accordance with accepted academic practice. No use, distribution or reproduction is permitted which does not comply with these terms.
*Correspondence: Xingyu Miao, miaoxyu@163.com