 Ameet A. Chimote1
 Abdulaziz O. Alshwimi1
 Martina Chirra1
 Vaibhavkumar S. Gawali1Margaret V. Powers-Fletcher2Kristin M. Hudock3,4
 Laura Conforti1*
- 1Department of Internal Medicine, Division of Nephrology, University of Cincinnati, Cincinnati, OH, United States
- 2Department of Internal Medicine, Division of Infectious Diseases, University of Cincinnati, Cincinnati, OH, United States
- 3Department of Internal Medicine, Division of Pulmonary, Critical Care and Sleep Medicine, University of Cincinnati, Cincinnati, OH, United States
- 4Department of Pediatrics, Division of Pulmonary Biology, Cincinnati Children’s Hospital Medical Center, Cincinnati, OH, United States
Introduction: Severe COVID-19 is characterized by cytokine storm, an excessive production of proinflammatory cytokines that contributes to acute lung damage and death. Dexamethasone is routinely used to treat severe COVID-19 and has been shown to reduce patient mortality. However, the mechanisms underlying the beneficial effects of dexamethasone are poorly understood.
Methods: We conducted transcriptomic analysis of peripheral blood mononuclear cells (PBMCs) from COVID-19 patients with mild disease, and patients with severe COVID-19 with and without dexamethasone treatment. We then treated healthy donor PBMCs in vitro with dexamethasone and investigated the effects of dexamethasone treatment ion channel abundance (by RT-qPCR and flow cytometry) and function (by electrophysiology, Ca2+ influx measurements and cytokine release) in T cells.
Results: We observed that dexamethasone treatment in severe COVID-19 inhibited pro-inflammatory and immune exhaustion pathways, circulating cytotoxic and Th1 cells, interferon (IFN) signaling, genes involved in cytokine storm, and Ca2+ signaling. Ca2+ influx is regulated by Kv1.3 potassium channels, but their role in COVID-19 pathogenesis remains elusive. Kv1.3 mRNA was increased in PBMCs of severe COVID-19 patients, and was significantly reduced in the dexamethasone-treated group. In agreement with these findings, in vitro treatment of healthy donor PBMCs with dexamethasone reduced Kv1.3 abundance in T cells and CD56dimNK cells. Furthermore, functional studies showed that dexamethasone treatment significantly reduced Kv1.3 activity, Ca2+ influx and IFN-g production in T cells.
Conclusion: Our findings suggest that dexamethasone attenuates inflammatory cytokine release via Kv1.3 suppression, and this mechanism contributes to dexamethasone-mediated immunosuppression in severe COVID-19.
1 Introduction
Coronavirus disease 2019 (COVID-19), caused by severe acute respiratory syndrome coronavirus 2 (SARS-CoV-2), is a public health emergency that has affected millions globally. Since the outset of the COVID-19 pandemic, there has been a concerted global research effort to understand the nature of the disease caused by SARS-CoV-2, decipher the complex immune responses to SARS-CoV-2 infection, and develop effective therapeutics and vaccines (1–3). Inflammatory cytokines, produced and released by activated innate and adaptive immune cells, are essential for anti-viral immune responses, including the response to SARS-CoV-2. However, in severe respiratory COVID-19, infection of lung tissue by SARS-CoV-2 triggers the cross-talk between epithelial cells and innate and adaptive immune cells leading to pathologically uncontrolled levels of proinflammatory cytokines, i.e. “cytokine storm”. The cytokine storm ultimately results in respiratory failure and unfavorable patient outcomes (4, 5). Indeed, severe COVID-19 is characterized by a marked increase in the production of proinflammatory cytokines such as interleukin-6 (IL-6), interferon-γ (IFN-γ), and IL-17, diminished antiviral type I and type III interferon (IFN) responses, increased immune cell exhaustion and decreased cytotoxicity (3, 6, 7). Understanding the molecular mechanisms responsible for these aberrant immune responses in severe COVID-19 patients is critical to the development of new therapeutics that may prevent cytokine storm and mortality.
Dexamethasone, a corticosteroid drug with exclusively glucocorticoid activity, is currently administered as standard of care for severe COVID-19. Results from the RECOVERY (Randomized Evaluation of COVID-19 Therapy) clinical trial in mid-2020 showed that dexamethasone reduces mortality by one-third in severely ill COVID-19 patients requiring mechanical ventilation (8). Dexamethasone is an anti-inflammatory drug commonly prescribed to treat several diseases including autoimmune and inflammatory disorders, cancers and acute respiratory distress syndrome (ARDS) (9–12). In severely ill COVID-19 patients, dexamethasone is purported to reduce cytokine storms by inhibiting immune cells like T, B, Natural Killer (NK) and dendritic cells and specifically by suppressing their abundance and function, including T cell receptor signaling and cytokine release (12–14). However, there remains a critical gap, in understanding the molecular mechanisms underlying the effects of dexamethasone that lead to attenuation of COVID-19 severity.
Immune cell function, including cytokine production and release is controlled by Ca2+ signaling that is regulated by the concerted function of ion channels, transporters, and pumps. Activation-induced Ca2+ influx in immune cells occurs through Ca2+ release–activated Ca2+ (CRAC) channels that consist of two subunits: a plasma membrane localized pore-forming subunit, Orai1, and an endoplasmic reticulum-localized Ca2+ sensor, the stromal interaction molecule 1 (Stim1) (15, 16). Ca2+ influx through CRAC channels is facilitated by the voltage-gated Kv1.3 and the Ca2+ dependent KCa3.1 potassium (K+) channels, which control the membrane potential and hence the driving force for Ca2+ influx into the cell (15, 17). Increased intracellular Ca2+ is necessary for activation of transcription factors that control the expression of molecules involved in multiple immune effector functions, including cytokine production and release, cytotoxicity and proliferation (15). Ca2+ signaling is required for expression of the majority of T cell activation genes (15, 17). Previously published studies show that blockade of ion channel function in T cells resulted in decreased cytotoxicity, motility, and cytokine release (18–22). Although an effective adaptive immune response mediated by cytotoxic CD8+ T cells against SARS-CoV-2 is critical to controlling viral dissemination and lung damage, the contribution of the ion channels, including Kv1.3, in regulating the effector functions of T cells and other immune cells involved in the response against SARS-CoV-2 is yet to be investigated. Interestingly, dexamethasone has been shown to downregulate Kv1.3 channels in a human macrophage cell line and in Jurkat T cells (13, 23). Therefore, it would be important to investigate if ion channels, especially Kv1.3 play an important role in mediating the therapeutic effect of dexamethasone treatment in severe COVID-19.
In this study, we performed a comparative transcriptomic analysis in peripheral blood mononuclear cells (PBMCs) from patients with mild and severe COVID-19 disease with and without dexamethasone treatment. We observed that not only severe illness altered key immune signaling pathways involved in inflammation, cytokine release, exhaustion, and antiviral immunity in PBMCs but also that these alterations were associated with an increase in Kv1.3 channel expression. Moreover, by demonstrating the differentially regulated pathways as a result of dexamethasone treatment in severe COVID-19 patients, we provide evidence that decreased expression of Kv1.3 channels in PBMCs mediates the immunosuppressive effect of dexamethasone.
2 Materials and methods
2.1 Study design
This study was designed to investigate the immune and molecular mechanisms involved in COVID-19 disease progression and determine the beneficial effects of dexamethasone in severely ill patients. This study was conducted in PBMCs from patients with mild and severe COVID-19. For the latter group, we utilized samples from patients that either were treated with dexamethasone or not. We used cryopreserved PBMCs from unexposed healthy donors (collected before the arrival of SARs-Cov-2 in the United States) as controls. We conducted transcriptomic experiments and identified the antiviral immune response pathways and genes that were differentially expressed between the following groups: 1) mild COVID-19 patients vs. healthy individuals, 2) severe vs. mild COVID-19 patients, and 3) severe COVID-19 patients with or without dexamethasone treatment. We then conducted a correlation analysis utilizing our gene sets. This analysis identified Ca2+ fluxes-related functions among the biological functions that were modified by dexamethasone-treatment in patients with severe COVID-19. Since Ca2+ fluxes in immune cells are controlled by ion channels, we performed RT-qPCR experiments to quantify the ion channel expression in our patient cohorts. We confirmed the inhibitory effect of dexamethasone on ion channel abundance (by RT-qPCR and flow cytometry) by conducting in vitro experiments with healthy donor PBMCs. Next, we determined the functional significance of Kv1.3 alterations due to dexamethasone in CD8+ T cells by measuring the channel activity (by electrophysiology) and IFN-γ production. The criteria for patient inclusion in our study are described in detail below. The samples were de-identified, and the sample size was sufficient to detect statistical significance between the experimental groups. None of the samples were excluded from analysis, and investigators were not blinded during experiments. Statistical methods used in this study are summarized in the “Statistical analysis” section, and the P values and statistical methods used for individual experiments are provided in the individual figures and figure legends.
2.2 Patient samples (human samples and subjects)
De-identified PBMCs samples from patients with 1) mild COVID-19, 2) severe COVID-19, and 3) severe COVID-19 treated with dexamethasone were obtained from the Cincinnati COVID-19 Biorepository. Adult subjects who presented to the University of Cincinnati Medical Center (UCMC) with at least one symptom of COVID-19 (shortness of breath, fever, cough) and/or a positive RT-PCR test for SARS-CoV-2 provided written informed consent to participate in this study. Subjects with mild disease were outpatients or were seen in the ER only and were never admitted at UCMC for COVID-19. Individuals who were defined as having severe disease were patients hospitalized in the UCMC (requiring admission to the ICU or Medical Step-down units) with signs of respiratory distress and requiring O2 within 7 days of their acute presentation. The individuals included in the severe COVID-19 treated with dexamethasone cohort were severe cases (defined above) who were treated with 6 mg of dexamethasone per day between 1-7 days of a positive COVID-19 diagnosis. Exclusion criteria for all groups included a diagnosis of cancer or autoimmune disease, and for mild and severe groups (dexamethasone-untreated), we also had an additional exclusion criterion that the subjects should not have received dexamethasone or any other corticosteroid. Patients included in our study were in the age range of 38-75 years and were included regardless of race, ethnicity, gender, pregnancy status, or any pre-existing conditions (except cancer or autoimmunity as mentioned earlier). The samples for the mild and severe COVID-19 patient cohorts were collected between early May and early July 2020, when dexamethasone treatment for severe cases was not the prevalent standard of care for severe illness, prior to the published findings of the RECOVERY trial (8). Only one individual in the severe COVID-19 patient cohort received Remdesivir, as widespread access to this drug was limited early on during the pandemic. The samples for severe COVID-19 patients that received dexamethasone were collected between mid-August and mid-September 2020. All of the demographic, clinical, laboratory and treatment data from the date closest to the sample collection were extracted from the patients’ electronic medical records and compiled in a centralized database created by the Center for Health Informatics at the University of Cincinnati and are presented in Tables S1, S2. In Table S2, all of the severe COVID-19 patients included in the dexamethasone-treated cohort received at least 6 mg of dexamethasone for 5-6 days before the samples were collected. Interestingly, mortality was not reported in any of the individuals included in this study.
Whole blood was freshly collected from all subjects and immediately processed. PBMCs were isolated from the whole blood by Ficoll-Paque density gradient centrifugation as described previously and cryopreserved at the University of Cincinnati Biorepository until further use (21).
As healthy controls for this study, we used cryopreserved PBMCs that were isolated from discarded blood units from Hoxworth Blood Center (University of Cincinnati) for prior unrelated studies in our laboratory between late 2016 and mid-2019. We considered these donors as unexposed healthy controls as the first cases of SARS-CoV-2 were documented in the state of Ohio on March 9, 2020. Demographic information about these samples is not available.
Informed consent was obtained from all COVID-19 patients and healthy donors participating in the study. Sample collection for the Cincinnati COVID-19 Biorepository and informed patient consent for the study were approved under IRB # 2020-0329, while sample collection from blood obtained from the Hoxworth Blood Center was approved under IRB # 2013-2516 by the University of Cincinnati Institutional Review Board.
2.3 Sample processing
The cryopreserved PBMCs from COVID-19 patient cohorts and unexposed healthy controls were thawed in a 37°C water bath, centrifuged at 300 X g for 10 minutes at room temperature, and the cell pellets were resuspended in RPMI 1640 medium supplemented with 10% human serum, penicillin (200 U/ml), streptomycin (200 μg/ml), 1 mM L-glutamine, and 10 mM Hepes (all from ThermoFisher) and maintained overnight (~12 hours) in a cell culture incubator at 37°C supplemented with 5% CO2. The viability of the samples (Table S3) was assessed by flow cytometry using Zombie UV Live/Dead stain (Biolegend) prior to RNA isolation for NanoString and RT-qPCR assays.
2.4 Immune cell profiling, immune pathway, and gene expression analysis with NanoString nCounter
Transcriptomic analysis on COVID-19 patients (mild, severe +/- dexamethasone) and unexposed healthy donor PBMCs was performed using NanoString nCounter platform (NanoString Technologies). Total RNA was isolated from the samples using the E.Z.N.A. total RNA isolation Kit (Omega Bio-tek) and quantified using a NanoDrop 2000 spectrophotometer (ThermoFisher Scientific). The RNA quality was analyzed using an Agilent 2100 Bioanalyzer (Agilent); and concentrated using the RNA Clean and Concentrator kit (Zymo Corp.). All of our processed RNA samples fulfilled the following qualitative criteria to be eligible for NanoString analysis: 260:280 ratio > 1.8, 260:230 ratio > 2.0, and DV-200 (percentage of nucleotide fragments >200 bp) > 30% (22). We analyzed 100 ng of RNA from four mild, three severe, and four severe COVID-19 patients treated with dexamethasone, along with five unexposed healthy donors using the human Host Response CodeSet panel (NanoString), which includes 773 genes covering the host immune response to infectious diseases, and 12 internal reference genes for data normalization. The RNA samples were hybridized as per the manufacturer’s instructions, and each sample was read in a multiplexed reaction with the reference (positive, negative controls, and housekeeping genes) probes on the NanoString nCounter Flex instrument.
2.5 NanoString data analysis
The raw gene expression data (counts) were calculated through the Basic Analysis of the nSolver software (version 4.0, NanoString) and then imported into the nSolver Advanced Analysis plug-in (version 2.0) for cell type profiling, pathway score analysis, and differential gene expression; and Rosalind software (OnRamp Bio) for normalized gene expression data. The counts were normalized to the geometric means of internal housekeeping gene probes. Principal components analysis was performed on the normalized counts of the individual genes using GraphPad Prism (version 9.1.2). Relative cell type abundance was calculated using the nSolver Advanced Analysis software as described by us earlier using the method described by Danaher et al., and data are presented as “cell scores” (22, 24). Pathway scores were determined using the nSolver advanced analysis, which condensed each sample’s gene expression profile into a small set of pathway scores, which were derived using the first principal component of each gene set’s data and are oriented such that a higher pathway score corresponds to mostly higher abundance of the constituent genes that define each individual pathway. To determine changes in the pathway scores in the patient cohorts, we performed pairwise student’s t-tests between 1) healthy controls and mild COVID-19, 2) mild and severe COVID-19, and 3) severe COVID-19 +/- dexamethasone. We identified the pathways that were significantly changed by dexamethasone in severe COVID-19 and determined the changes in the abundance of the individual genes that constituted these pathways by performing t-tests on the normalized counts of the individual genes between 1) mild and severe COVID-19 and 2) severe COVID-19 +/- dexamethasone. Heatmaps were generated for cell scores, pathway scores, and normalized counts using Morpheus open-source software (https://software.broadinstitute.org/morpheus). Differential gene expression with dexamethasone treatment in severe COVID-19 was performed by pairwise comparison between severely ill patients +/- dexamethasone using the nSolver advanced analysis. P value was adjusted in the nSolver advanced analysis using the Benjamini-Yekutieli method with the false discovery threshold set at 0.05, and the data were plotted as a volcano plot by graphing each target’s -log10 (p-value) and log2 (fold change) using GraphPad Prism. The normalized gene count data was further used to perform network visualization to determine whether dexamethasone treatment in severe COVID-19 patients altered any biological processes associated with Ca2+ signaling. For this analysis, we first calculated the differential gene expression for each gene in the NanoString panel using the open-source software AltAnalyze (http://www.AltAnalyze.org). We defined the genes with a P value < 0.05 and a fold change > 1.5 (or < 1.5) as significantly differentially expressed. We identified the genes increased (> 1.5 fold change) in severe COVID-19 as compared to mild disease and genes decreased (< 1.5 fold change) by dexamethasone treatment in severe illness. Further functional enrichment analysis was performed on these differentially expressed genes using g: Profiler (https://biit.cs.ut.ee/gprofiler) by evaluating them for enrichment of Gene Ontology (GO) term- Biological Processes (25). Visual interaction networks for enriched Biological Processes were generated using Cytoscape (version 3.9.1) (26). We generated visual interaction networks for all of the calcium ion signaling-related pathways decreased by dexamethasone treatment in severe disease.
2.6 Healthy donor cell isolation, in vitro dexamethasone treatment and CD8+ T cell activation
For experiments involving in vitro dexamethasone treatment, we obtained discarded blood units from Hoxworth Blood Center. Demographic information about these samples is not available. PBMCs were isolated from whole blood as described earlier by Ficoll-Paque density gradient centrifugation (GE Healthcare Bio-Sciences) (21). CD8+ T cells were isolated from PBMCs by negative selection using the EasySep Human CD8+ T Cell Enrichment Kit (STEMCELL Technologies Inc.) as per the manufacturer’s protocol. The PBMCs and CD8+ T cells were maintained in RPMI 1640 medium supplemented with 10% human serum, penicillin (200 U/ml), streptomycin (200 μg/ml), 1 mM L-glutamine, and 10 mM Hepes and treated with dexamethasone (Millipore Sigma). Stock solution (1 mM) of dexamethasone was prepared in absolute ethanol (Fisher Scientific) and added to the cultured PBMCs and CD8+ T cells (~3 X 10⁶ cells) for 24 and 48 h, at final working concentrations of 1 μM and 0.1 μM. Viability of cells post-dexamethasone treatment was determined by trypan blue exclusion (Figure S1). Some of the treated PBMCs (~ 1 X 10⁶ cells) were cryopreserved (CryoStor CS10 cryopreservation medium, STEMCELL Technologies) and stored in liquid nitrogen until used for flow cytometry experiments. The remaining PBMCs and all of the CD8+ T cells were used immediately for RT-qPCR and electrophysiology experiments. For the experiments involving Ca2+ and IFN-γ measurements, CD8+ T cells were activated with plate-bound mouse anti-human CD3 (10 μg/ml) and mouse anti-human CD28 (10 μg/ml) antibodies (BioLegend) as previously described (18, 22).
2.7 RT-qPCR
Total RNA was isolated from PBMCs using the E.Z.N.A. total RNA isolation Kit (Omega Bio-tek). 300 ng of RNA was used to synthesize complementary DNA (cDNA) using the LunaScript® RT SuperMix Kit (New England Biolabs) as per the manufacturer’s instructions. Predesigned primers for RT-qPCR were obtained using TaqMan Gene Expression Assays (Applied Biosystems, ThermoFisher) to detect the expression of KCNA3 (assay ID: Hs00704943_s1), KCNN4 (assay ID: Hs01069779_m1), Orai1 (assay ID: Hs03046013_m1), Stim1 (assay ID: Hs00963373_m1) and 18S rRNA (assay ID: Hs99999901_s1). The RT-qPCR reactions were set up in a 96-well plate by adding 30 ng of cDNA, 1× TaqMan Gene Expression Master Mix (Applied Biosystems, ThermoFisher), and 1 μl of TaqMan Gene Expression Assay primers. All samples were run in triplicates. 18S rRNA was used as an internal control. RT-qPCR was cycled in QuantStudio Real-Time PCR Systems (Applied Biosystems, ThermoFisher). CT values were measured using QuantStudio Design & Analysis software v 1.5.1 (Applied Biosystems). CT values for KCNA3, KCNN4, Orai, and Stim1 were normalized against measured CT values for 18S rRNA, and the ΔΔCT values were calculated as described previously (20). Relative quantity (RQ) values, which represent the fold change in the gene expression, were calculated as the 2−ΔΔCT values as compared to control (healthy donor PBMCs) samples.
2.8 Flow cytometry
For phenotyping, cryopreserved PBMCs (~1x10⁶ per condition) from healthy donors +/- dexamethasone were thawed, resuspended in 100 μl PBS and stained with Zombie UV Live/Dead stain for 20 min. Cells were washed with cell staining buffer (Biolegend) and fixed with 4% paraformaldehyde for 30 min. Cells were stained for surface guinea pig anti- Kv1.3 (Alomone Labs) and Orai1 (ATTO-633, Alomone Labs) primary antibodies overnight at 4°C in the dark. The next day, cells were washed twice in cell staining buffer, followed by a secondary anti-guinea pig (Alexa Fluor 555 goat anti-guinea pig IgG; ThermoFisher) antibody. Cells were then stained with an antibody cocktail for surface stains (CD3, CD4, CD8, CD19, CD56, CD16, and CD14 antibodies) and acquired on a flow cytometer. A complete list of antibodies used in the phenotyping staining panel are presented in Table S4. We have previously confirmed the specificity of the Kv1.3 and Orai1 antibodies used this this study (19, 27). All samples were acquired on a BD Fortessa flow cytometer (BD Biosciences) and analyzed with FlowJo software (BD Biosciences). Unstained and single-stained PBMCs from healthy donors, along with UltraComp eBeads (ThermoFisher), were used for compensation.
2.9 Electrophysiology
Kv1.3 currents were recorded from CD8+ T cells in whole-cell voltage clamp configuration using an AxoPatch 200B Amplifier (Molecular devices). Pipettes were formed from Borosilicate glass (TW150F-4, World Precision Instruments) with a P-97 horizontal puller (Sutter Instruments) and had a resistance between 4 and 7 MΩ when filled with intracellular pipette solution containing (in mmol/L) 140 KF, 55 EGTA, 5 CaCl2, 10 MgCl2, and 10 HEPES [pH 7.22; (19)]. The external solution contained (in mmol/L) 145 NaCl, 5 KCl, 1 MgCl2, 2.5 CaCl2, 5.5 glucose, and 10 HEPES (pH 7.4,all reagents from Millipore-Sigma). Kv1.3 currents were elicited by 800-ms step pulse depolarization from -80mV to +50 mV. Data were acquired using pCLAMP 8.0 software (Molecular Devices) through a 16-bit A-D/D-A interface (Digidata1320A, Molecular Devices). Data were low pass filtered frequency at 2 kHz and digitalized at 100 kHz. The amplitude of the peak current was determined at +50 mV. The verity of Kv1.3 currents was confirmed by blocking the channels by ShK-Dap22 (Bachem), a specific Kv1.3 channel blocker (28).
2.10 Calcium measurements
Intracellular Ca2+ was measured using the Ca2+ add-back method (19, 29). Briefly, 0.1-1 X 10⁶ freshly isolated CD8+ T cells treated with either dexamethasone or ShK-Dap22 (vehicle- treated cells used as controls) and activated as described in section 2.6, were loaded with 1:1000 fold of 2 mg/ml Indo-1 AM ratiometric dye (ThermoFisher) and 0.015% Pluronic F-127 (ThermoFisher) in Hank’s balanced salt solution containing (in mM) 1 CaCl2, 1 MgCl2 and 1% FBS for 30 min at 37°C, then washed three times in Hank’s balanced salt solution supplemented with 10 mM HEPES (pH 7.0) and 1% FBS. Prior to measurements, cells were resuspended in a Ca2+-depleted solution prepared from the HBSS/HEPES solution mentioned above and supplemented with 0.5 mM EGTA (pH 7.4). Samples were kept in a 37°C water bath until analysis. The Indo-1 fluorescence ratio (indicative of the intracellular Ca2+ levels) in CD8+ T cells was measured by flow cytometry on a BD Fortessa Flow cytometer (BD Biosciences), using instrument set up acquisition parameters and experimental protocol as described by us earlier (29). The following protocol was used to measure changes in intracellular Ca2+: cells were first exposed to thapsigargin (TG, 1 μM) in 0 mM Ca2+ solution followed by 2 mM Ca2+-containing solution. Analysis of the kinetics was performed using FlowJo software (BD Biosciences). Ca2+ fold change was measured as the ratio between the peak intensity ratio of Indo-1 upon addition of 2 mM Ca2+ and the mean baseline Indo-1 ratio at 0 mM Ca2+ (prior to TG addition). We also calculated the area under the curve (AUC), an estimate for the average Ca2+ influx into the cell, for the part of Ca2+-response curve after addition of 2 mM Ca2+ solution.
2.11 IFN-γ measurements
For measuring IFN-γ release, cryopreserved PBMCs from severely ill COVID-19 patients as well as from healthy donors were thawed and rested overnight in the presence of 10 ng/ml IL-2 (Biolegend). The following day, viability was determined by trypan blue exclusion, and CD8+ T cells were isolated as described in section 2.6. The concentration of the CD8+ T cells was adjusted to 1 X 10⁶ cells/ml and cells were then treated with 0.1 and 1 mM dexamethasone, 10 nM and 100 nM ShK-Dap22, while cells treated with vehicle served as controls, and were activated for 48 h with plate-bound anti-human CD3 and anti-human CD28 antibodies as described in section 2.6. After 48 h, IFN-γ levels in cell culture supernatants were detected by using enzyme-linked immunosorbent assay (ELISA) (Human IFN gamma uncoated ELISA kit, ThermoFisher) according to the manufacturer’s instructions.
2.12 Statistical analysis
Statistical analyses were performed using either Student’s t test (paired or unpaired) and analysis of variance (ANOVA). The normality of sample distribution was assessed by Shapiro-Wilk test, and where the samples failed normality, comparisons were performed by Mann-Whitney rank sum test or ANOVA on ranks. Post hoc testing on ANOVA was performed by multiple pairwise comparison procedures using either Holm-Sidak, Tukey, or Dunn’s methods. Statistical analysis was performed using SigmaPlot 13.0 (Systat Software Inc.) and GraphPad Prism 9.0 (GraphPad Software LLC.). P ≤ 0.05 was defined as statistically significant. The statistical tests applied to detect significance for our NanoString experiments are described in the NanoString data analysis section. For NanoString data analysis, due to the small sample size and low power for statistical analysis, we did not perform multiple comparison adjustments and have reported the non-adjusted P-values in the relevant data figures and tables. The appropriate statistical tests, along with their significance values for all of the data, are described in the individual figure legends.
3 Results
3.1 Immune profiles of COVID-19 associated with disease progression and dexamethasone treatment
Experiments were performed to determine whether the alterations in the host immune response to SARS-CoV-2 are related to disease severity and also to dexamethasone treatment. To that end, we generated transcriptomic data from PBMCs obtained from the above-mentioned COVID-19 patient cohorts and healthy controls, using the NanoString Host-Response panel. Clustering analysis of our transcriptomic datasets indicates that the PBMCs from COVID-19 patients (irrespective of disease severeity and dexamethasone treatment) group separately as compared to healthy individuals (Figure 1A). Furthermore, we also observed that most dexamethasone-treated severe COVID-19 patients and mild patients were clustered separately from the severe COVID-19 patients who did not receive the drug, indicating that disease severity as well as dexamethasone treatment could be a source of variation in our datasets. We then profiled the relative abundance of immune cell populations among the patient cohorts. We found an increase in CD56dimNK cells, suggesting increased cytotoxicity in mild patients compared to healthy donors (Figure 1B). We also detected a significant increase in exhausted CD8+ T cells in mild patients as compared to healthy individuals, while NK, CD8+ T, and Th1 cells were reduced, all of which can lead to ineffective pathogen clearance (Figure 1B). Compared to mild disease, individuals with severe COVID-19 showed fewer CD56dimNK cells, whereas patients with severe COVID-19 who received dexamethasone displayed decreased abundance of cytotoxic, CD56dimNK, Th1, exhausted CD8+, and mast cell populations (Figures 1C, D). Collectively, these data suggest that dexamethasone may exacerbate the reduction of CD56dimNK cells that occurs with disease severity, while controlling the exhausted T cells that were already increased in patients with mild disease.
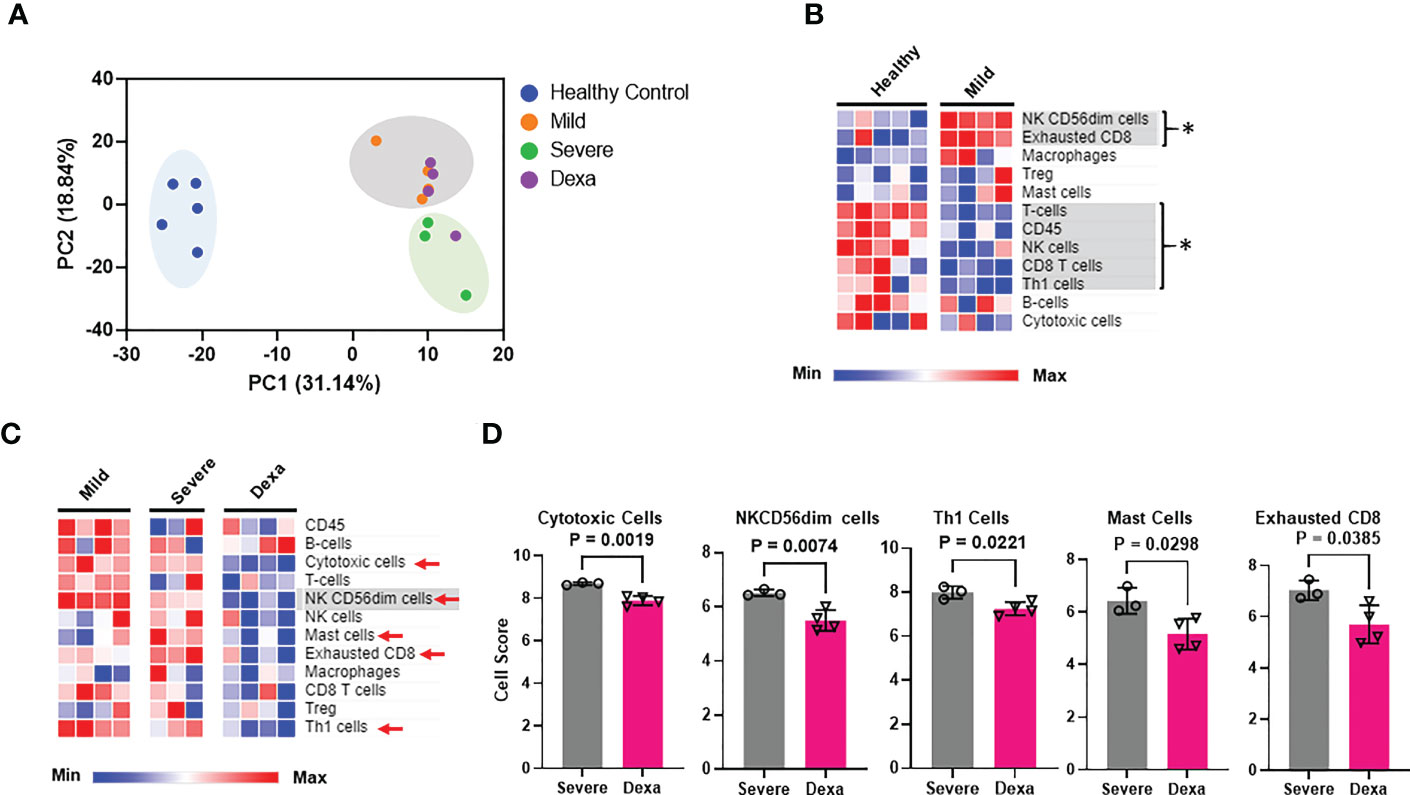
Figure 1 Immune cell profiling of PBMCs from healthy controls, mild and severe COVID-19 patients and severe COVID-19 patients treated with dexamethasone. (A) Principal components analysis (PCA) of NanoString transcriptomic data. (B) Heatmap depicting immune cell abundance in PBMCs from healthy donors (n=5) and mild COVID-19 patients (n=4). Significantly altered cell types are highlighted in gray and represented by *. (C) Heatmap depicting abundance of immune cell types in PBMCs from patients with mild (n=4), severe COVID-19 (Severe, n=3), and severe COVID-19 + dexamethasone (Dexa, n=4). Significantly altered cell types between mild and severe are highlighted in gray, and those altered between severe +/- dexamethasone are marked by red arrows. (D) Cell types significantly altered by dexamethasone treatment in severe COVID-19 patients. Bars represent means ± SD. In (A, D), each symbol represents an individual patient or healthy donor. Dexa = dexamethasone. Significance was determined by unpaired t-test and by Mann-Whitney rank sum test where samples failed normality. The abundance of the different immune cell types (at the RNA level) in the various patient cohorts was calculated as log2 cell type scores. The cell scores for a specific cell type can only be compared between two groups (such as mild vs. severe COVID-19) but do not support claims that a cell type is more abundant than another cell type within the same group.
To elucidate the mechanisms by which SARS-CoV-2 alters immune cell functionality, we analyzed the immune pathways that were differentially expressed in our COVID-19 patient cohorts. Pathway analysis revealed significant alterations in multiple pathways responsible for innate immune cell activation, immune cell exhaustion, adaptive host immune responses as well as inflammatory and interferon responses in patients with mild COVID-19, as compared to healthy controls (Figure 2A). However, the primary focus of our study was to determine which pathways were enriched in severe COVID-19 patients compared to mild disease, and investigate if any of these enriched pathways were altered by dexamethasone treatment. In severe disease we observed an increase in immune exhaustion and an enhanced innate cell-driven inflammatory response. Specifically, we saw an increase in NF-κB, and IL-6 pathways. We also saw upregulation of the Type III interferon response pathways, while IL-1 signaling and virus-host interactions were significantly reduced (Figure 2B). In contrast, PBMCs from patients with severe COVID-19 who received dexamethasone, had a signaling pathway profile more similar to that of mild patients. This included reduced Type III interferon signaling, immune exhaustion, and NF-κB signaling pathways and increased virus-host interaction in severe patients treated with dexamethasone. Additionally, severe patients with dexamethasone showed reduced host-defense peptides, Type II interferon and chemokine signaling pathways (Figures 2B, C).
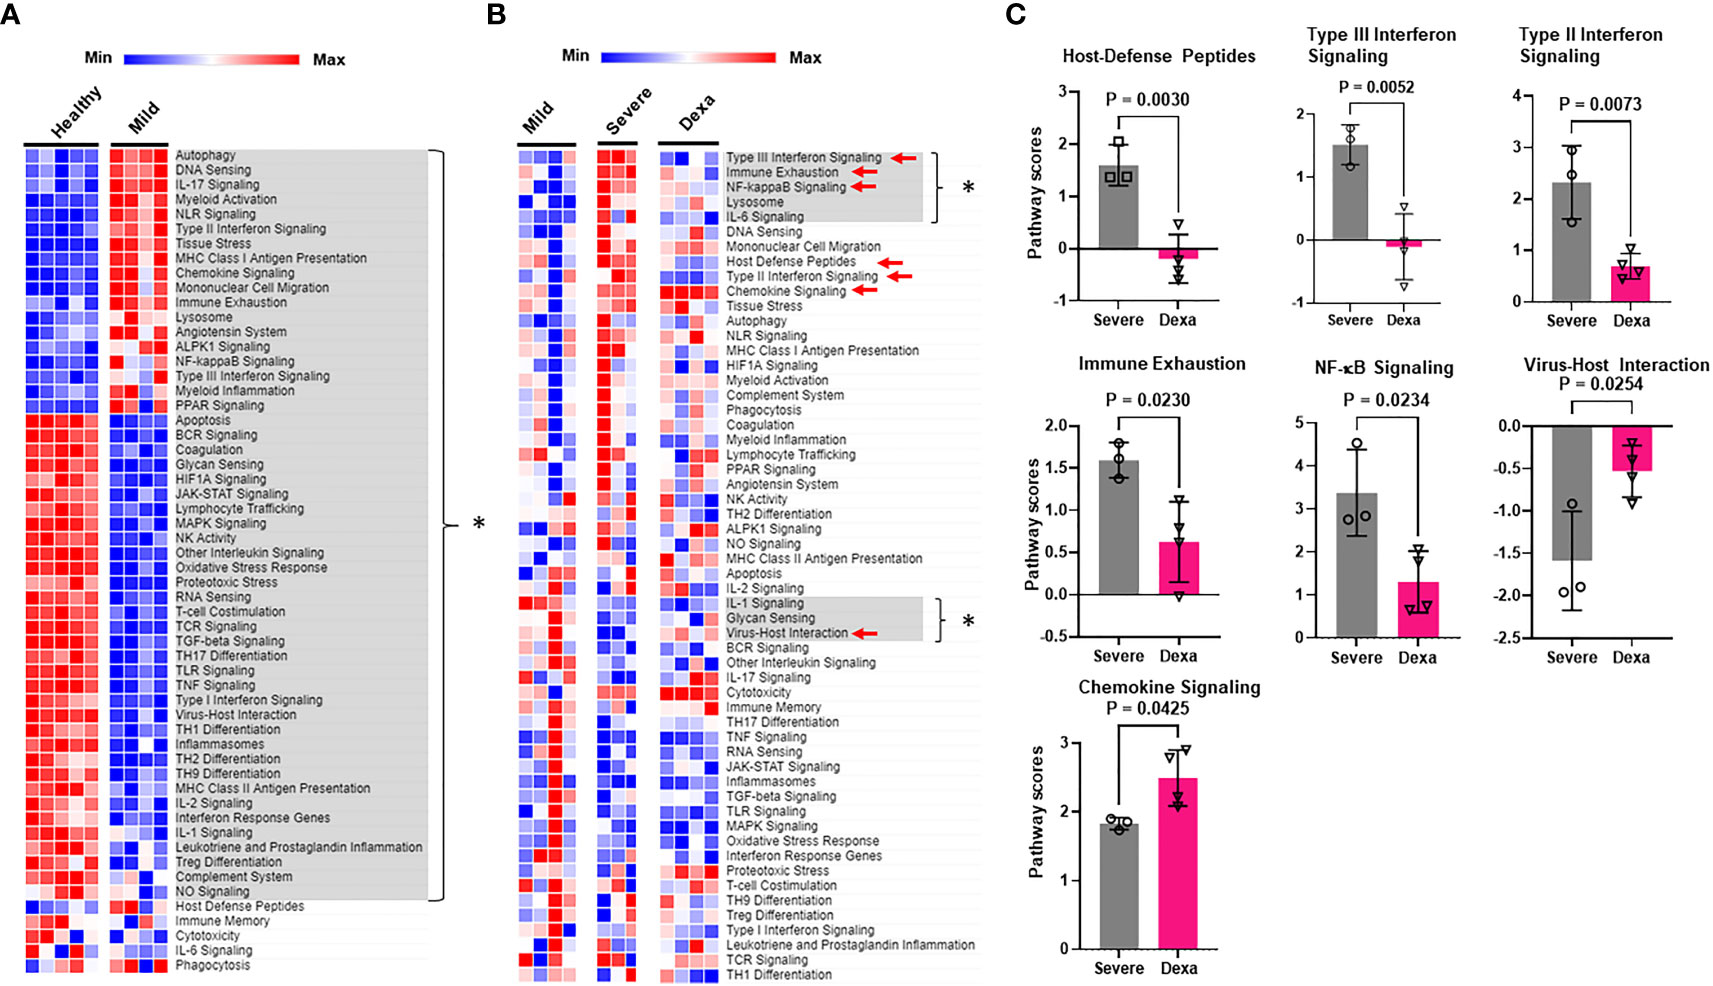
Figure 2 Immune signaling pathways altered by COVID-19 and by dexamethasone. (A) Heatmap depicting immune signaling pathway scores in PBMCs from healthy donors (n=5) and COVID-19 patients with mild disease (n=4). Significantly altered pathways are highlighted in gray and represented by * (B) Heatmap depicting immune signaling pathway scores in PBMCs from patients with mild (n=4), severe COVID-19 (Severe, n=3), and severe COVID-19 + dexamethasone (Dexa, n=4). Significantly altered pathways between mild and severe groups are highlighted in gray and represented by *, and those altered between severe +/- dexamethasone are marked by red arrows. (C) Pathways significantly altered by dexamethasone treatment in severe COVID-19 patients. Bars represent means ± SD, and each symbol represents an individual. Significance determined by unpaired t-test.
We then identified the differentially expressed genes in severe COVID-19 patients with and without dexamethasone treatment. Dexamethasone resulted in differential expression of several genes involved in immune response of host to viruses, including genes relevant to cytokine storm. Cytokine storm is associated with ARDS that is the leading cause of mechanical ventilation in severe COVID-19, and these patients benefit from dexamethasone which acts by abrogating the cytokine storm, thus preventing patient mortality (3, 4, 8). We therefore compared the expression of the genes mediating cytokine storm in our patient cohorts and observed that, compared to individuals with mild COVID-19, patients with severe illness showed a significant increase in IL6, IFNG, IL18, and IL1B, while dexamethasone treatment decreased the abundance of IL6, IFNG and IL18 (Figures 3A, B) (30). Other differentially expressed genes in severe COVID-19 patients after dexamethasone treatment are presented as a volcano plot in Figure 3C and are listed in Table 1. We first looked at the differentially expressed genes associated with the anti-viral immune response and inflammatory pathways that were significantly altered by dexamethasone in severe COVID-19 (shown in Figure 2C). Within these altered pathways, the most relevant genes downregulated by dexamethasone included: TIGIT, LAG3, PDCD1, CTLA4, EOMES, and CD86 (immune exhaustion), FASLG (immune exhaustion and NF-κB signaling), VCAM1 (NF-κB and Type II interferon signaling); IFNG, IRF7, and HLA-C (Type II interferon signaling); CCR5 (virus-host interaction and chemokine signaling); TMPRSS2 (virus-host interaction); IFNL1 and IL10RB (Type III interferon signaling); and CD40LG (NF-κB signaling), while the most relevant genes upregulated by dexamethasone included: CXCR4 (chemokine signaling and virus-host interaction); UBA52 and CUL1 (NF-κB signaling). Furthermore, as shown in Table 1, in severe COVID-19 patients, dexamethasone treatment downregulated genes belonging to inflammatory and interferon signaling pathways that have been purported to contribute to COVID-19 disease severity which included type I interferon signaling (IFI27, IFNB1, IFITM2, IFNA2, IRF7, ISG15), inflammatory JAK-STAT and MAPK signaling (IFNB1, IFNL1, IFITM2, IFITM3, IFNG, IL11RA), innate immune signaling pathways such as NOD (nucleotide-binding and oligomerization domain)-like receptor (NLR) signaling (IFNB1, IL6, IFNA2, IRF7, IL18, IF116) and pathways influencing T cell receptor stimulation and NK cell activity (6, 31). Additionally, we observed that dexamethasone reduced the abundance of genes related to cytotoxicity (GZMA) and inflammatory cell death/PANoptosis (ZBP1) (31, 32). Overall, our immune profiling transcriptomic data highlight that PBMCs from patients with severe COVID-19 show a characteristic increase in immune exhaustion and various pro-inflammatory signaling pathways, as well as markers of cytokine storm and cytotoxicity, which are attenuated by dexamethasone administration.
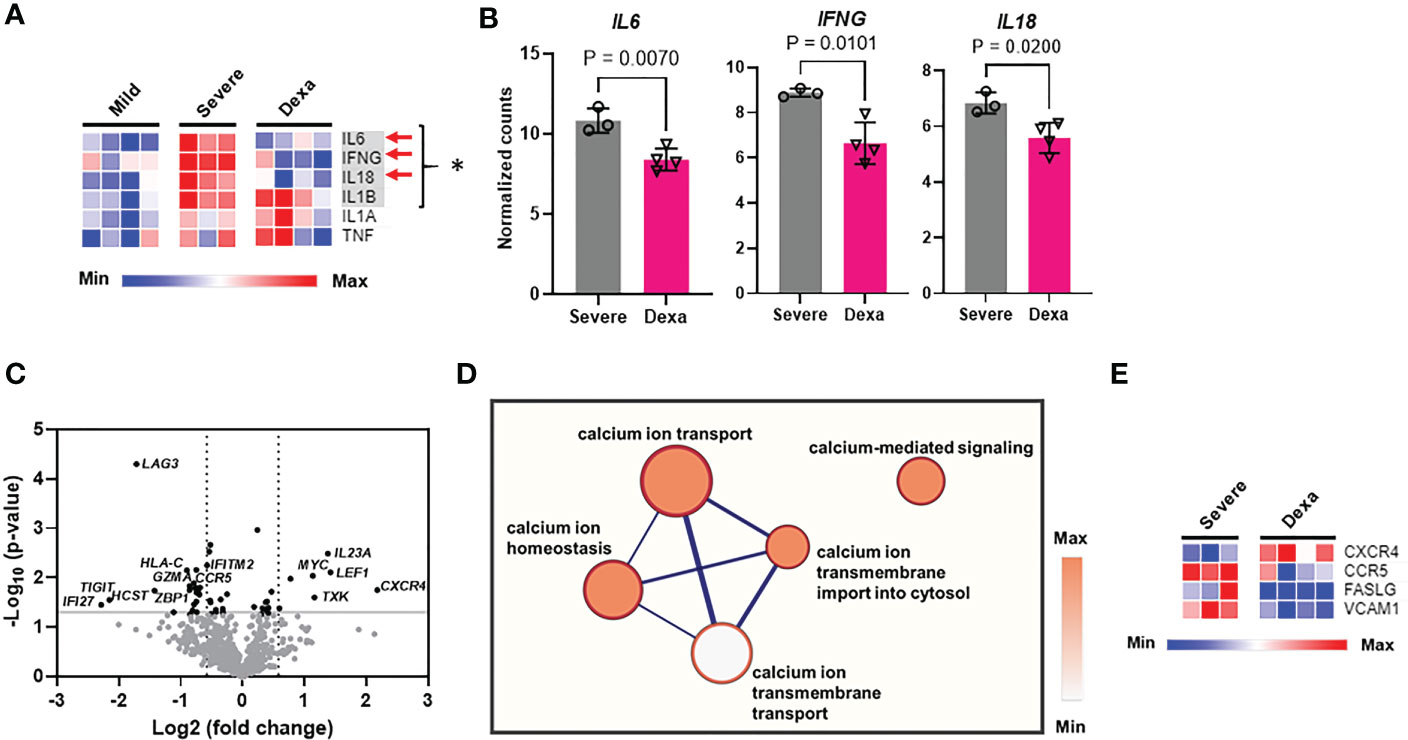
Figure 3 Cytokine storm gene expression, differential gene expression, and calcium signaling pathways altered by dexamethasone in severe COVID-19. (A) Heatmap depicting expression levels (determined as normalized RNA counts by NanoString) of genes involved in cytokine storm production in PBMCs from patients with mild (n=4), severe COVID-19 (Severe, n=3), and severe COVID-19 treated with dexamethasone (Dexa, n=4). Significantly altered genes between mild and severe groups are highlighted in gray and represented by *, and those altered between severe +/- dexamethasone are marked by red arrows. (B) Cytokine storm genes significantly altered by dexamethasone treatment in severe COVID-19 patients. Bars represent means ± SD, and each symbol represents an individual. Significance in (A, B) was determined by unpaired t-test. (C) Volcano plot showing differentially expressed genes (P<0.05 with unpaired t test, -log10Pvalue > 1.3, fold change>1.5) altered by dexamethasone in severe COVID-19. Top differentially expressed genes are labeled. (D) Correlation network analysis for calcium signaling-related pathways that were decreased by dexamethasone in severe COVID-19. The cluster of nodes that represent the transmembrane calcium ion transport are grouped together in the outer rectangle. Thicker edges (blue lines) indicate the number of genes shared between the nodes, whereas the intensity of the node fill color indicates the enrichment of genes in that specific process. (E) Heatmap depicting expression levels (determined as normalized RNA counts by NanoString) of significantly altered genes, that were involved in the calcium signaling-related pathways (shown in Panel D) in PBMCs from patients with severe COVID-19 (Severe, n=3), and severe COVID-19 treated with dexamethasone (Dexa, n=4). Further details and p-values for these genes are presented in Table S5. Significance determined by unpaired t-test.
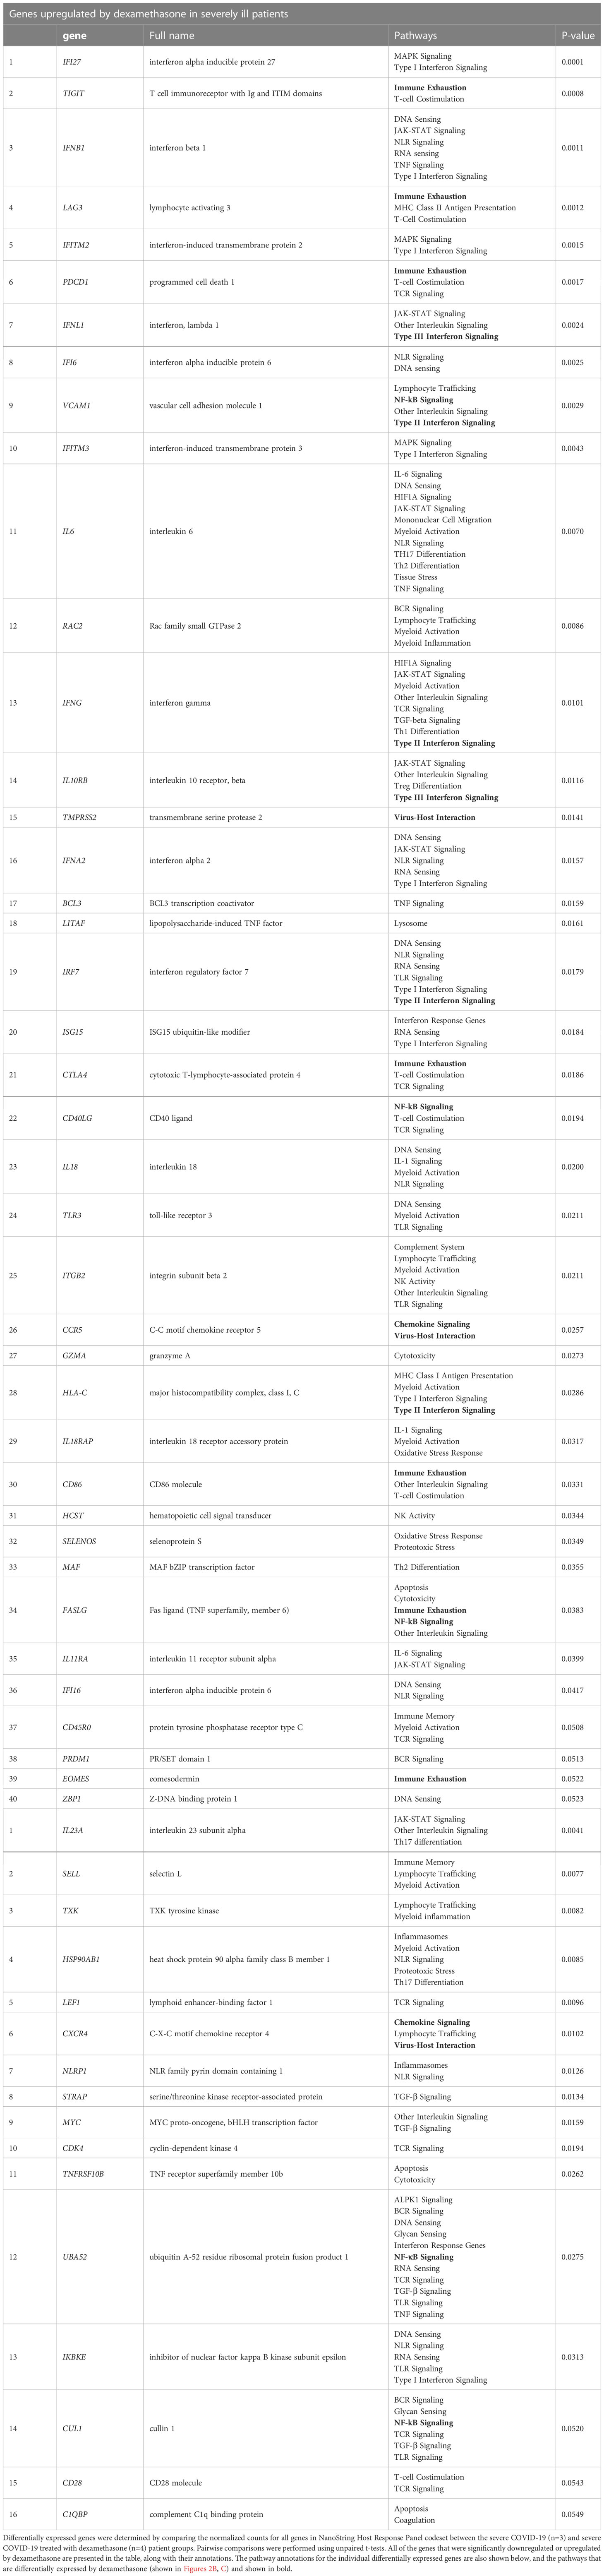
Table 1 List of genes differentially expressed by dexamethasone treatment in severe COVID-19 patients.
3.2 Impact of COVID-19 and dexamethasone on calcium-regulated pathways and Kv1.3 channels
Multiple signaling pathways that regulate the production of pro-inflammatory cytokines (including IFN-γ), chemokines and cytotoxic granules rely on cytosolic Ca2+, which regulates the activity and signaling pathways of multiple transcription factors including NF-AT and NF-κB (17, 33–35). Hence, we performed correlation network analysis to identify the biological processes associated with our gene sets and identified whether Ca2+ homeostasis processes were altered by treatment with dexamethasone. This analysis revealed that transmembrane Ca2+ ion transport-associated functions like Ca2+ ion transport into the cell and Ca2+-mediated signaling, were decreased by dexamethasone treatment (Figure 3D). We further queried the genes that constituted these altered calcium ion signaling-related pathways and found that CXCR4, CCR5, FASLG and VCAM1 were differentially expressed (Figure 3E, Table S5). Since Ca2+ influx into cells is regulated by ion channels, we conducted experiments to investigate whether ion channels are involved in COVID-19 severity and the response to dexamethasone.
The potassium channels Kv1.3 and KCa3.1, encoded by the KCNA3 and KCNN4 genes, respectively, and the CRAC channel (formed by two subunits encoded by the ORAI1 and STIM1 genes) are well-established regulators of Ca2+ entry into immune cells (16, 17). We investigated whether the KCNA3, KCNN4, ORAI1, and STIM1 expression were altered in severe disease and determined the impact of dexamethasone treatment on channel expression. RT-qPCR experiments revealed that KCNA3 expression was increased in severe COVID-19 as compared to mild COVID-19 patients and healthy controls (Figure 4A). Dexamethasone treatment decreased KCNA3 expression to levels below those of healthy controls (Figure 4A). In contrast, neither disease severity nor dexamethasone treatment altered KCNN4 expression (Figure 4B). ORAI1 abundance was decreased in all of our COVID-19 patients compared to healthy controls (Figure 4C). However, there were no significant differences in ORAI1 expression between mild and severe patients, and, additionally, dexamethasone treatment in severely ill patients did not affect ORAI1 expression (Figure 4C). STIM1 expression was not altered in mild or severe COVID-19 patients compared to healthy controls, but severe COVID-19 patients with dexamethasone displayed increased gene expression (Figure 4D). In summary, we demonstrate that KCNA3 expression correlates with disease severity, and dexamethasone decreases the upregulation of KCNA3 that is observed in severe COVID-19 to levels below that of healthy control PBMCs.
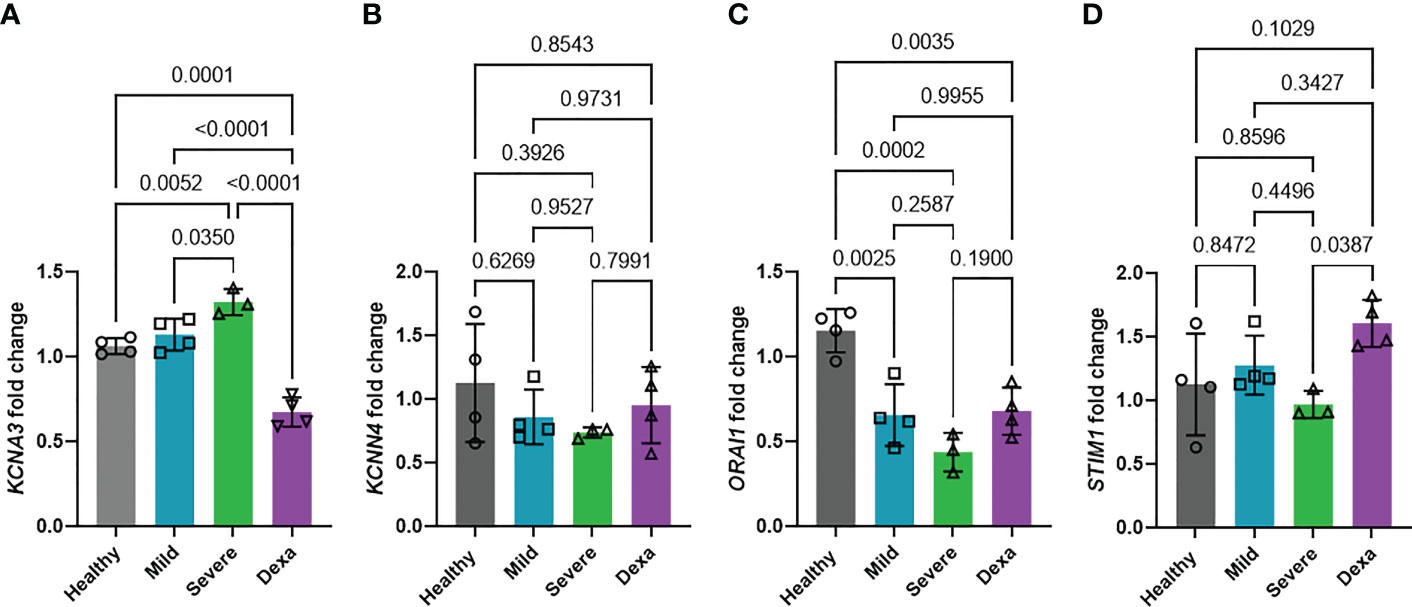
Figure 4 Changes in ion channel expression with disease progression and dexamethasone treatment. Fold change in mRNA abundance of Kv1.3 (KCNA3, A), KCa3.1 (KCNN4, B), Orai (ORAI1, C) and Stim1 (STIM1, D) in PBMCs from healthy donors (n=4), and patients with mild COVID-19 (n=4), severe COVID-19 (Severe, n=3), and severe COVID-19 + dexamethasone (Dexa, n=4) was determined by RT-qPCR. Data are normalized to healthy donor PBMCs. Each sample was run in triplicate. 18S rRNA was used as the housekeeping gene. Bars represent means ± SD, and each symbol represents an individual patient. Data were analyzed by one-way analysis of variance (ANOVA) (P < 0.001 in A, P = 0.4270 in B, P=0.0003 in C, and P=0.0414 in D), and post hoc testing was performed by the Holm-Sidak method.
3.3 Corroborating evidence for a role of Kv1.3 in dexamethasone-mediated immunosuppressive effects
Kv1.3 channels regulate cytokine and chemokine production as well as other immune cell functions, several of which are altered by dexamethasone treatment in severe COVID-19 patients (Figure 2) (15, 16). We conducted in vitro experiments in healthy donor PBMCs to verify our findings on altered KCNA3, ORAI1, and STIM1 gene expression in dexamethasone-treated COVID-19 patients and confirmed that in vitro treatment with dexamethasone altered the abundance of these ion channel encoding genes. We isolated PBMCs from healthy individuals and exposed them to 0.1 and 1 μM dexamethasone for 24 and 48 h, while vehicle-treated PBMCs were used as controls. These concentrations were chosen to reflect the plasma concentrations of 23-72 nM reported in humans treated with dexamethasone at steady state (36). In vitro administration of dexamethasone did not affect cell viability of PBMCs (Figure S1). Dexamethasone treatment significantly decreased KCNA3 abundance as compared to vehicle-treated control at 24 h (Figure S2) and 48 h (Figure 5A). ORAI1 expression was not altered at 24 h (Figure S2) but was decreased at 48 h (Figure 5A). STIM1 was not altered at either 24 h (Figure S2) or 48 h after dexamethasone (Figure 5A).
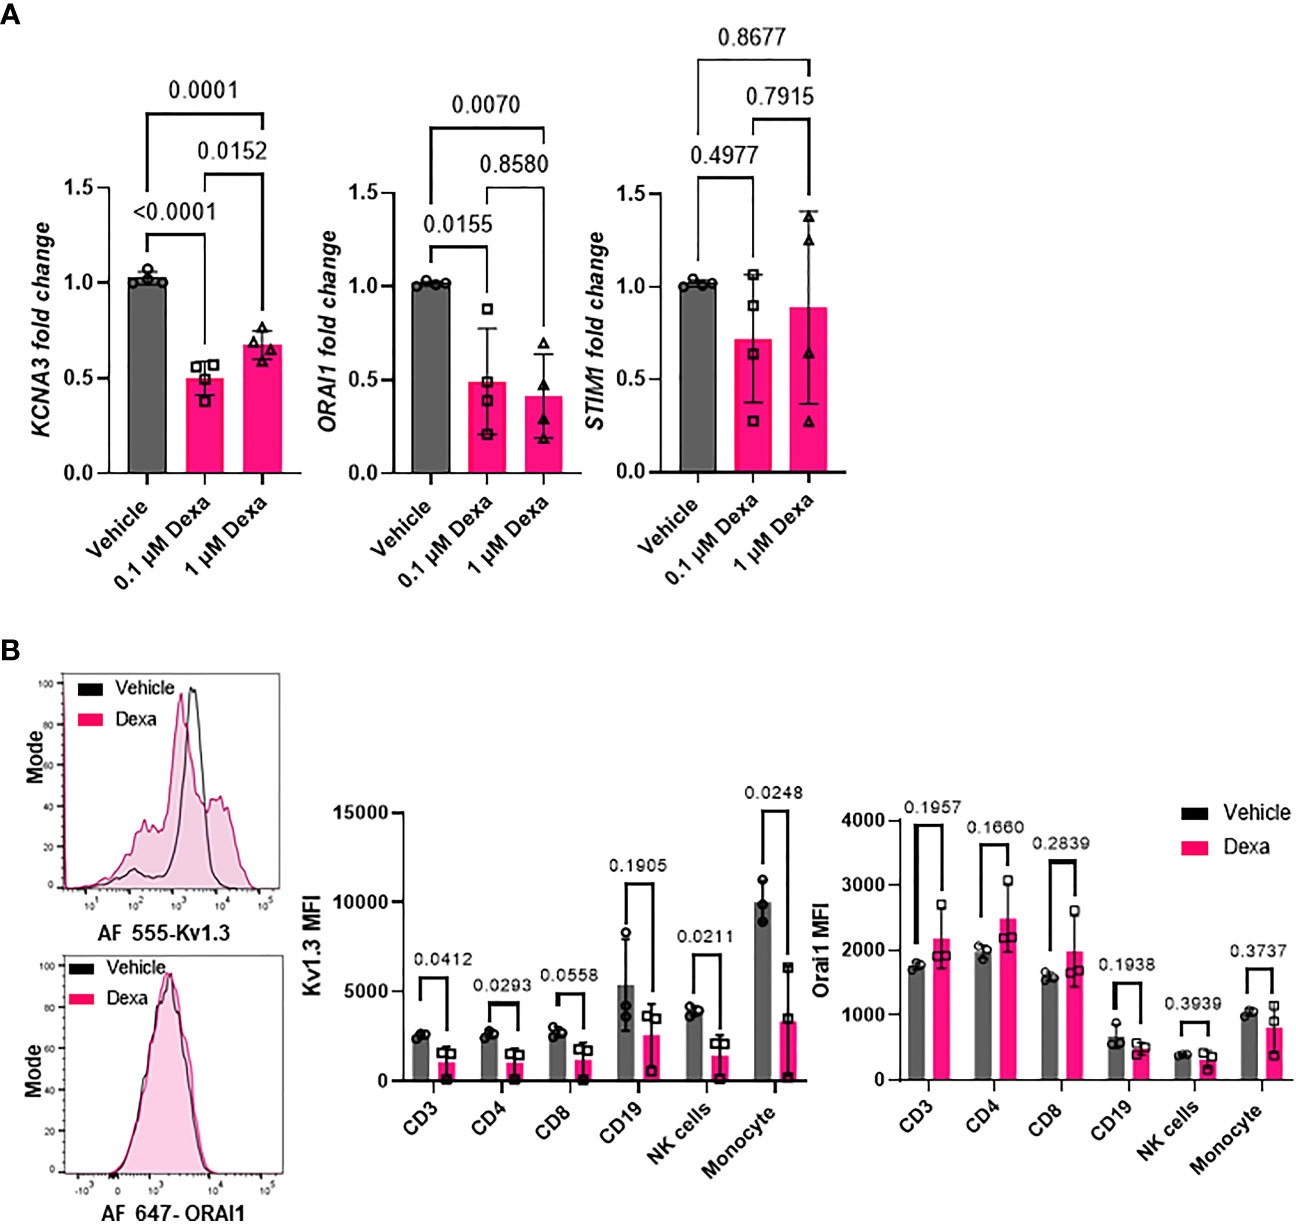
Figure 5 Effect of dexamethasone on Kv1.3 channel abundance. (A) Kv1.3 (KCNA3), Orai1 (ORAI1), and Stim1 (STIM1) mRNA expression in PBMCs from healthy donors (n=4) treated with 0.1 μM and 1μM dexamethasone or vehicle for 48 h was determined by RT-qPCR. Data were normalized to vehicle-treated control. Significance was determined by one-way analysis of variance (ANOVA) for KCNA3 (P < 0.001), ORAI1 (P=0.005), and by ANOVA on ranks for STIM1 (p=0.630). Post-hoc testing was performed by the Holm-Sidak method. (B) Kv1.3 and Orai1 abundance in immune cell subsets from healthy donor PBMCs treated with 1 μM dexamethasone for 48 h. (Left) Representative flow cytometry histograms showing Kv1.3 (top) and Orai1 (bottom) abundance in the presence or absence of dexamethasone treatment in CD3+ T cell subsets. (Right) Mean fluorescence intensity (MFI) of Kv1.3 and Orai1 in immune cell subsets from three healthy donors treated in vitro with 1 μM dexamethasone or vehicle for 48 h. Significance determined by paired t-test. means ± SD, and each symbol represents an individual donor. .
To determine whether in vitro treatment of healthy donor PBMCs with dexamethasone for 48 hours altered Kv1.3 and Orai1 protein levels, we performed flow cytometry. We designed a multicolor flow cytometry panel for leukocytes and mononuclear cells (see Materials and Methods) to assess Kv1.3 and Orai1 protein abundance in various immune cell subsets, as defined by gating strategies presented in Figure S3. We observed that dexamethasone significantly reduced Kv1.3 protein abundance in CD3+ T cells, CD4+ T cells, CD56dimNK cells, and monocytes as compared to vehicle-treated controls after 48 h treatment (Figure 5B). Furthermore, in the CD8+ T cell subset, we observed a trend towards decreased Kv1.3 abundance (p=0.0558, Figure 5B), while dexamethasone did not alter Kv1.3 abundance in the CD19+ B cell subset (Figure 5B). Dexamethasone did not alter the percentage of Kv1.3+ cells (Figure S4) and Orai1 protein abundance in each immune cell subset (Figure 5B).
We then conducted functional studies to determine whether the decreased abundance of KCNA3 by dexamethasone translated into an actual reduction of functional Kv1.3 channels and inhibition of effector functions. We conducted these experiments in CD8+ T cells that are critical to mounting an effective antiviral immune response in severe COVID-19 (2). We thus exposed CD8+ T cells from healthy donors to dexamethasone (0.1 μM and 1 μM) for 48 h (controls were treated with DMSO, vehicle) and performed electrophysiological experiments to assess whether the decreased Kv1.3 expression by dexamethasone in CD8+ T cells correlated with reduced Kv1.3 channel function. Kv1.3 activity (defined by the Kv1.3 peak current) was significantly inhibited in dexamethasone-treated CD8+ T cells as compared to vehicle-treated controls (Figure 6A, Table S6). This inhibition of Kv1.3 currents by dexamethasone was similar to that induced by ShK-Dap22, a specific Kv1.3 channel blocker, at concentrations that fully block the channel activity (Figure S5). On exposure to dexamethasone, there was no change in cell capacitance, a measure of cell size, and an indication of the activation state of these cells (Table S6) (19).
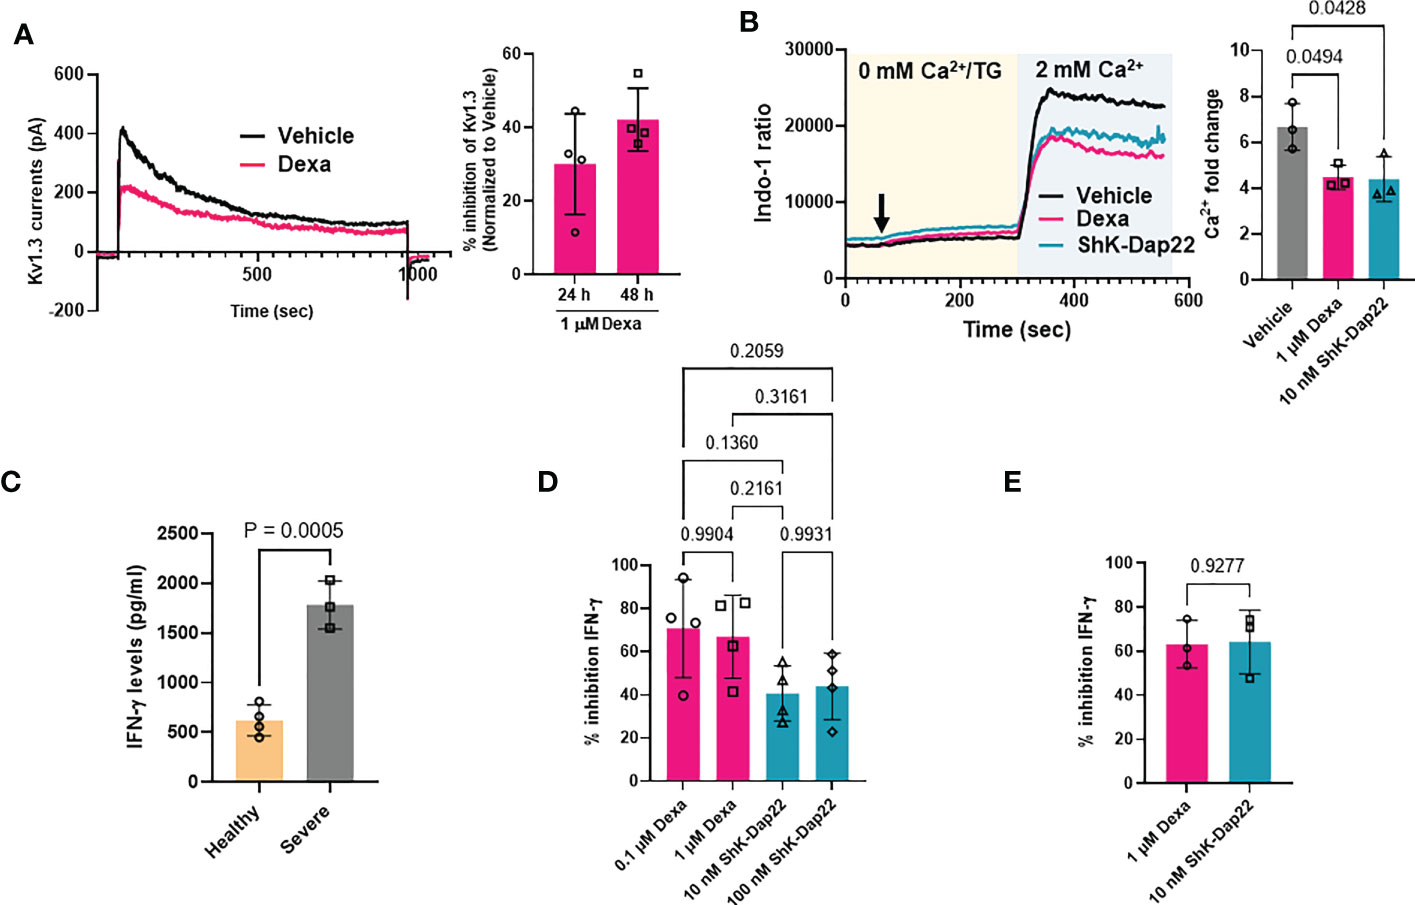
Figure 6 Effect of dexamethasone on Kv1.3 channel function, Ca2+ signaling and cytokine production. (A) Inhibition of Kv1.3 currents in CD8+ T cells treated with 1 μM dexamethasone (Dexa) for 24 and 48 h. Representative Kv1.3 currents are shown on the left, and percentage inhibition of Kv1.3 currents by dexamethasone in n=4 donors is shown on the right. (B) Representative Ca2+ response (shown as a ratio of Indo-1 fluorescence at 400 and 480 nm) recorded in activated healthy donor CD8+ T cells treated with either 1μM dexamethasone, 10 nM ShK-Dap22, or vehicle for 48 h are shown on the left. Cells were loaded with Indo-1 ratiometric dye, and the fluorescence was recorded by flow cytometry. Indo-1 loaded cells were first exposed to thapsigargin (arrow) in 0 mM Ca2+, followed by 2 mM Ca2+, which yields a rapid influx of Ca2+ (see Materials and Methods). Data are representative of independent experiments performed in CD8+ T cells isolated from n=3 healthy donors. The average fold change in peak Ca2+ levels in n = 3 healthy donors are shown on the right. Significance was determined by one-way analysis of variance (ANOVA, p=0.0309), and post hoc testing was performed by Tukey’s test. (C) IFN-γ release determined by ELISA in the supernatant of activated CD8+ T cells from n=4 healthy donors and n=3 severe COVID-19 patients. Significance was determined by unpaired t test (D) Percent inhibition of IFN-γ secretion as compared to vehicle treated cells after treatment of activated healthy donor (n=4) CD8+ T cells with either 0.1 μM and 1μM dexamethasone, 10 nM and 100 nM ShK-Dap22, or vehicle for 48 h. Significance was determined by one-way analysis of variance (ANOVA, p=0.9390). (E) Percent inhibition of IFN-γ secretion compared to vehicle treated cells after treatment of activated severe COVID-19 patient (n=3) CD8+ T cells with either 1μM dexamethasone, 10 nM ShK-Dap22, or vehicle for 48 h. Significance was determined by paired-t test. Activation of CD8+ T cells in panels (B–E) was done for 48 h with plate bound anti-CD3 and anti-CD28 antibodies. Bars represent means ± SD, and each symbol represents an individual.
It is well-documented that a reduction in Kv1.3 activity leads to a reduction in the Ca2+ influx in T cells (15–17, 29). Thus, we measured the Ca2+ response of activated CD8+ T cells isolated from healthy donors that were exposed to either dexamethasone or ShK-Dap22. Representative recordings of intracellular Ca2+ levels in dexamethasone, ShK-Dap22 and vehicle treated CD8+ T cells from the same individual are presented in Figure 6B (left). Using the Ca2+ add-back method, the endoplasmic reticulum (ER) Ca2+ stores are emptied by adding TG (a SERCA pump inhibitor) in Ca2+-free medium, which opens the CRAC channels and results in Ca2+ influx upon readdition of extracellular Ca2+ in a T cell receptor (TCR) independent and ion channel dependent manner (29, 37). The Ca2+ recordings show that, compared to the vehicle-treated controls, dexamethasone and ShK-Dap22 reduced the Ca2+ influx. Dexamethasone significantly reduced the peak Ca2+ levels achieved during re-introduction of Ca2+ in the media by 33% (n = 3 healthy donors) (Figure 6B, right). We observed a similar reduction in peak Ca2+ with ShK-Dap22 (34%) (Figure 6B). Comparably, the AUC was deceased by ~35% in both treatment groups (Figure S6). These data show that the inhibition of Kv1.3 channels by dexamethasone contributes to the suppression of Ca2+ signaling. We further investigated the effect of dexamethasone on IFN-γ production, downstream to ion-channel mediated Ca2+ signaling, in both severe COVID-19 patients and healthy donors CD8+ T cells (16, 18, 22). We observed a 3-fold increase in IFN-γ production in activated CD8+ T cells from severe COVID-19 patients as compared to healthy individuals (Figure 6C) as expected as these patients underwent a cytokine storm (Figure 3A). The IFN-γ production was significantly reduced by dexamethasone and Kv1.3 blockade in CD8+ T cells from healthy donors (Figure 6D) and severely ill patients (Figure 6E). These data show that the decrease in functional Kv1.3 channels and Ca2+ signaling brought about by dexamethasone in CD8+ T cells from healthy volunteers and severely ill COVID-19 patients contributes to their attenuated effector functions, thereby establishing a new mechanism for the beneficial effects of dexamethasone in severe COVID-19.
4 Discussion
Herein, we report transcriptomic and functional studies that not only identify the immune and molecular signaling mechanisms that are altered in severe COVID-19, but also may account for some of the beneficial effects of dexamethasone in severely ill COVID-19 patients. Comparative transcriptomic analysis in PBMCs from patients with mild and severe COVID-19 disease demonstrated that severe illness altered immune pathways involved in inflammation including cytokine release, T cell exhaustion, interferon signaling and anti-viral immunity. Furthermore, we provide evidence that dexamethasone treatment of severe patients reversed these changes. These modified immune responses associated with disease progression and the effect of dexamethasone converge on Kv1.3 channels that regulate Ca2+ signaling in immune cells.
Several studies in COVID-19 patients have highlighted the contribution of abnormal host immune responses to disease pathogenesis and progression (3, 6, 31, 38–40). While little is known about the molecular mechanisms regulating mild versus severe disease, there is consensus that the pathogenesis of SARS-CoV-2 pneumonia is due to aberrant local and systemic inflammatory response elicited by the innate and adaptive immune cells to clear the virus (3, 31). While, in our study, early disease (mild patients) showed a profound alteration of multiple inflammatory pathways (50/55 pathways in our NanoString transcriptomic panel), we observed that disease severity in comparison, is accompanied by the alteration of relatively few key pathways as compared to mild patients (8/55 pathways). In agreement with published data, we observed that severe COVID-19 increased immune exhaustion, lysosome pathway, and Type III interferon, combined with elevated NF-κB and IL-6 signaling leading to increased levels of circulating pro-inflammatory cytokines, or “cytokine storm” (4, 6, 40–42). The current standard of care for the cytokine storm in severe COVID-19 focuses on conventional anti-viral drugs like remdesivir, to block viral entry, and dexamethasone, to inhibit the immune system (43). The primary benefit of dexamethasone in severe COVID-19 is thought to be suppression of cytokine storm (12). An intricate interplay between immune cell types, inflammatory cytokines and immune cell signaling pathways is responsible for the cytokine storm in severe COVID-19 patients (4). While conventional anti-viral therapeutics have limited efficacy, dexamethasone successfully improved the clinical outcomes, and most importantly prevented patient mortality in these patients (5, 8). While it is well-known that dexamethasone is anti-inflammatory in function, the mechanisms underlying its beneficial effects in severe COVID-19 have not been defined. Our transcriptomic analysis revealed the immune and molecular mechanisms mediating the effect of dexamethasone in severe COVID-19. Our approach in evaluating the same was to highlight the inflammatory and immune pathways and genes that were differentially expressed by dexamethasone in severe COVID-19 patients, and more importantly to investigate whether this altered transcriptomic profile was similar to mild COVID-19 patients. We assume that this correction indicated a “beneficial effect” of dexamethasone (albeit some of the immune alterations in severe patients may be adaptive in nature and not pathogenic). Leukopenia is characteristic of severe COVID-19 (3, 6, 44). Severe COVID-19 patients show depletion of NK, CD3, and CD8 cells, which impairs the immune response against the virus and contribute to further progression of the disease severity (3, 44, 45). However, the reduction of these cells in severe COVID-19 is a double-edged sword as, while they are needed to fight the virus, they also contribute to tissue inflammation. In accordance with published findings, we observed a reduction in CD56dimNK cell populations in the severe COVID-19 group. This cell population was further reduced in our dexamethasone-treated population, along with a reduction in cytotoxic cells, mast cells, Th1 cells and exhausted CD8+ T cells (6). Dexamethasone is known to reduce the number of T cells and also inhibit Th1 cell-mediated activation of NK cells and macrophages (10).
Cytokine storm is characterized by the overproduction of IL-1, IL-6, IL-18, IFN-γ and TNF-α (4, 30). We observed that patients with severe illness displayed an increased abundance of the genes encoding for IL-1 (IL1B), IL-6, IL-18 and IFN-γ, whereas dexamethasone-treatment decreased genes encoding for IL-6, IFN-γ, and IL-18. Higher levels of IL-6 in severely ill individuals correlate with higher mortality and thus a reduction in IL-6 by dexamethasone could contribute to improving the disease outcomes for severely ill patients (3, 4, 6, 31, 46). The pro- inflammatory cytokines that define the cytokine storm are induced by the pattern recognition receptors (PRRs) that sense the viral molecules, and are expressed by the innate immune cells. A crucial signaling event mediating this pro-inflammatory cytokine induction by PRRs is activation of the NF-κB pathway (4, 5, 31, 47). In accordance with published reports, we observed that NF-kB signaling pathway was upregulated in severe disease (6, 31). However, we observed decreased NF-kB signaling post-dexamethasone treatment. We also observed that severe COVID-19 patients treated with dexamethasone had decreased ZBP1 expression. ZBP1 is a Z-RNA–sensing PRR which promotes NF-κB–driven proinflammatory cytokine expression in response to SARS-CoV-2 infection and is strongly induced by type I and type III IFNs (31, 32). Interestingly, single cell transcriptomic studies recently showed that the expression of ZBP1 was increased in immune cell subsets from patients with COVID-19 as compared to healthy controls, and this increased expression correlated with increased patient mortality (32). Moreover, in a preclinical mouse study, increased ZBP1 expression in mice infected with SARS-CoV-2 induced inflammatory cell death and limited the efficacy of IFN therapy, a result that could be reversed by genetic deletion of ZBP1 (32). We can thus speculate that reduction in ZBP1 by dexamethasone may similarly limit the inflammatory cell death in severe COVID-19 and may facilitate an improved therapeutic response.
IFN-γ, a type II interferon secreted by NK cells and T cells, is instead reduced by dexamethasone together with IL-18 (a cytokine which stimulates IFN-γ production) (4). IFN-γ is critical for host-immune response against COVID-19 (4, 48). However, based on current literature, the role of IFN-γ in COVID-19 is ambiguous. Commensurate with our findings, IFN-γ levels are increased in the serum of COVID-19 patients, and also in healthy donor PBMCs infected ex-vivo with SARS-CoV-2 (6, 32, 38, 49). While IFN-γ production can be beneficial as it decreases viral loads and enhances T cell cytotoxicity, persistent high levels of IFN-γ in cytokine storm however potentiate hyperinflammation by recruiting macrophages and leads to lung injury and ARDS in severely ill patients (50). Type III interferon pathway is also upregulated in severe COVID-19 patients. Others have shown instead that type III interferons are attenuated in severe COVID-19 disease (51). This discrepancy may be due to the gene analytical method used (measurement of secreted cytokines vs measuring of transcriptomic changes). Similarly, while several studies report delayed or attenuated type I interferon signature in severe disease, we did not see any change in the type I interferon signature with severe disease (6). Type I interferon signaling is one of the earliest protective responses against SARS-CoV-2 virus (5, 6, 31). Type I and type III interferons induce similar sets of interferon stimulated genes (ISGs) and activate overlapping signaling pathways (7, 52). Neutrophils from severe COVID-19 patients treated with dexamethasone downregulated ISGs (30). We report that dexamethasone treatment downregulated the type III interferon pathway, along with IFNΛ1 expression, but not type I interferon pathway, suggesting that this could be another mechanism by which dexamethasone inhibits proinflammatory cytokine production in severe disease. Furthermore, dexamethasone inhibited genes belonging to the NLR signaling pathway, which is responsible for activating the inflammasome and production of pro-inflammatory cytokines and pyroptotic cell death (31, 47). Thus, this reduction in inflammatory cytokines, inflammatory and interferon signaling pathways by dexamethasone can be an advantage in severe COVID-19.
Along with hyperinflammation in severe COVID-19, there is overwhelming evidence in the literature pointing towards cytotoxic cell immunosuppression due to upregulation of immune exhaustion markers (PD-1, TIGIT, Tim-3, CTLA-4) as an alternative mechanism to severe disease pathogenesis (6, 40, 53–56). Accordingly, we observed an increased immune exhaustion signature in severe COVID-19. While it has been reported that dexamethasone upregulated CTLA-4 abundance in lymphocytes in vitro, in our cohort of severe COVID-19 patients, dexamethasone suppressed the gene encoding for CTLA-4, as well as other exhaustion signature genes TIGIT, LAG3, PD1, FASL, Eomesodermin and CD86 (40, 57, 58). Interestingly, we also observed that dexamethasone decreased the abundance of TMPRSS2, a serine protease which facilitates SARS-CoV-2 entry (59). In summary, our transcriptomic findings show that dexamethasone corrects some of the pathways that are altered in severe COVID-19 as compared to mild patients, namely it reduces immune exhaustion, type III interferon and NF-κB signaling, while restoring virus-host interactions. The transcriptomic changes we report in severe COVID-19 patients as a consequence of dexamethasone treatment were associated with changes in Ca2+ signaling and Ca2+ transport functions, thus implicating ion channels in the development of severe disease and the response to dexamethasone.
We showed that Kv1.3 expression was significantly increased in PBMCs from severe COVID-19 patients raising the possibility that upregulation of Kv1.3 could contribute to the hyperactivity of immune cells and increased production of IFN-γ by CD8+ T cells in severe COVID-19. Indeed, we reported here that INF-γ release is 3-fold higher in severe COVID-19 patients as compared to healthy donor. Although it is well established that Kv1.3 channels are positive regulators of T, B, NK, and macrophage function (60–62), this is the first report to our knowledge, of data supporting a role for Kv1.3 in the pathogenesis of severe COVID-19. Since Kv1.3 is overexpressed in effector memory T cells and we used a mixed population of PBMCs, it is possible that the differences we observed in Kv1.3 expression in severe patients compared to mild may be underestimated (15, 63, 64). In accordance with previously published reports, which show that dexamethasone inhibits Kv1.3 channels in Jurkat T and human macrophage cell lines, we observed that Kv1.3 expression was lower in PBMCs from dexamethasone-treated group (13, 23). Our in vitro studies supported this finding as dexamethasone decreased Kv1.3 expression in T and NK cells and monocytes but not B cells. Functional studies in CD8+ T cells, which provide a critical antiviral immune response in severe COVID-19, showed that the dexamethasone-induced changes in Kv1.3 gene expression translated into decreased channel activity, Ca2+ influx and production of IFN-γ strongly suggesting that Kv1.3 contributes to dexamethasone-mediated immunosuppression (2, 31, 65).
Our findings raise the prospect that Kv1.3 blockade could serve as a novel therapeutic approach in severe COVID-19. Kv1.3 blockers have shown benefits as immune-suppressive agents in autoimmune diseases (22, 66, 67). Dalazatide, a Kv1.3 channel inhibitor currently in clinical trials, has been reported to reduce inflammatory cytokines such as IFN-γ, IL-17, and TNF–α in CD4+ and CD8+ T cells from patients with systemic lupus erythematosus (SLE) (68). We have also shown that cell-targeted Kv1.3 knockdown reduced Ca2+ influx, CD40L and IFN-γ in memory T cells from SLE patients (18, 22, 29). The advantage of Kv1.3 blockers over dexamethasone resides in the possibility that, while the former may not induce a global immune suppression, they may still suppress the cytokine storm but leave the body able to clear acute infections. Indeed, Kv1.3 blockers target activated effector memory T cells which, when unregulated, contribute to damaging inflammation, while leaving naïve and central memory T cells able to provide an acute response to immunological challenges (KCa3.1 controls the function of these T cells) (15). Furthermore, the benefits of a Kv1.3 targeted therapy may not be limited to severe COVID-19, but also extended to “Long Covid” syndrome or post-acute sequelae of SARS-CoV-2 infection (PASC) as it could inhibit the chronic inflammation in the nervous system [Kv1.3 channels regulate microglia function (60, 62)] and pulmonary arteries that are associated with these long-forms of the disease that depend on memory T cells (3).
There are limitations to our study. First, this was a study performed on only a small patient cohort. With a disease as heterogenous as COVID 19, this warrants a conservative interpretation of the results (69). A study in a larger cohort could confirm our findings of borderline significance and elicit other important mechanisms. Second, the samples included in this study were procured at the beginning of the pandemic when the original Wuhan strain (Wuhan-Hu-1) was dominant, and vaccinations were not yet available. Further studies on PBMCs from patients infected with more recent strains of SARS-CoV-2 may confirm the pivotal role of Kv1.3 channels in the disease pathogenesis. Thirdly, these samples were not obtained from a clinical trial in which severe COVID-19 patients were randomized to dexamethasone-treated or control groups. As these samples were collected prior to RECOVERY, there could be a possible clinical bias in which patients who received empiric steroids were more ill. Moreover, we were not able to determine if the clinical outcomes in the dexamethasone-treated patients were better than untreated. To attempt to control for this, we calculated the Sequential Organ Failure Assessment (SOFA) scores, and the number of organ failures at the time of patient sampling was similar for both cohorts. Furthermore, while interpreting the results of this study, we should also take into account that other glucocorticoid receptor (GR) mediated immune suppressive mechanisms like upregulation of checkpoint inhibitors are also taking place. Nevertheless, our study not only convincingly demonstrates a mechanism for the therapeutic effect of dexamethasone that is consistent with the literature, but also underscores the potential benefits of a therapy targeting Kv1.3 channels in COVID-19. This treatment modality could be of benefit in other pathologies where a cytokine storm occurs as a result of other pathogenic microbial infections, therapies (iatrogenic), cancers, or autoimmunity.
Data availability statement
The datasets presented in this study can be found in online repositories. The names of the repository/repositories and accession number(s) can be found below: GSE227341 (GEO).
Ethics statement
The studies involving human participants were reviewed and approved by University of Cincinnati Institutional Review Board. The patients/participants provided their written informed consent to participate in this study.
Author contributions
Conceptualization: AC and LC; Methodology: AC and LC; Formal Analysis: AC and LC; Investigation: AC, AA, VG, and MC; Resources: KH and MP-F; Visualization: AC, AA, and MC; Project administration: AC and LC; Supervision: LC; Writing – original draft: AC and LC; Writing – review and editing: AC and LC; Funding acquisition: LC. All authors discussed the results and commented on the manuscript. All authors contributed to the article and approved the submitted version.
Funding
This work was funded by grant support from the University of Cincinnati, Department of Internal Medicine Senior Pilot Grant and the National Institutes of Health (grant R01CA95286) to LC. MC received grant support from the National Institutes of Health (grant R38HL155775 01). The Research Flow Cytometry Core (Division of Rheumatology) at Cincinnati Children’s Hospital Medical Center received grant support from the National Institutes of Health (grant AR070549), while the Center for Health Informatics, University of Cincinnati were supported by a grant from the National Institutes of Health (National Center for Advancing Translational Sciences, grant 2UL1TR001425-05A1).
Acknowledgments
We are grateful to the patients and healthy donors that participated in the study. The authors would like to thank the personnel at the University of Cincinnati Retroviral Reference Lab for processing the patient samples. The COVID-19 patient biospecimens were provided by the University of Cincinnati Biorepository. We acknowledge the Center for Health Informatics, University of Cincinnati for providing the patient information. RNA quality control was performed at Genomics, Epigenomics and Sequencing Core, Department of Environmental Health, University of Cincinnati. NanoString experiments were performed using equipment maintained by the Diagnostic Immunology Laboratory, Cincinnati Children’s Hospital Medical Center. The authors would like to thank Ms. Taylor Lange (Division of Oncology, Cincinnati Children’s Hospital Medical Center) and Dr. Mario Medvedovic (Department of Biostatistics and Bioinformatics, University of Cincinnati) for advising us on Bioinformatics analysis. The authors would also like to thank Dr. Roman Jandarov (Department of Biostatistics and Bioinformatics, University of Cincinnati) for his valuable counsel on statistical analysis. We are grateful to Dr. Eric Smith (Department of Internal Medicine) for his helpful comments on the manuscript. All flow cytometry experiments were performed using equipment maintained by the Research Flow Cytometry Core (Division of Rheumatology) at Cincinnati Children’s Hospital Medical Center.
Conflict of interest
The authors declare that the research was conducted in the absence of any commercial or financial relationships that could be construed as a potential conflict of interest.
Publisher’s note
All claims expressed in this article are solely those of the authors and do not necessarily represent those of their affiliated organizations, or those of the publisher, the editors and the reviewers. Any product that may be evaluated in this article, or claim that may be made by its manufacturer, is not guaranteed or endorsed by the publisher.
Supplementary material
The Supplementary Material for this article can be found online at: https://www.frontiersin.org/articles/10.3389/fimmu.2023.1143350/full#supplementary-material
References
1. Carvalho T, Krammer F, Iwasaki A. The first 12 months of COVID-19: a timeline of immunological insights. Nat Rev Immunol (2021) 21:245–56. doi: 10.1038/s41577-021-00522-1
2. Sette A, Crotty S. Adaptive immunity to SARS-CoV-2 and COVID-19. Cell (2021) 184:861–80. doi: 10.1016/j.cell.2021.01.007
3. Merad M, Blish CA, Sallusto F, Iwasaki A. The immunology and immunopathology of COVID-19. Science (2022) 375:1122–7. doi: 10.1126/science.abm8108
4. Fajgenbaum DC, June CH. Cytokine storm. New Engl J Med (2020) 383:2255–73. doi: 10.1056/NEJMra2026131
5. Yang L, Xie X, Tu Z, Fu J, Xu D, Zhou Y. The signal pathways and treatment of cytokine storm in COVID-19. Signal Transduct Target Ther (2021) 6:255. doi: 10.1038/s41392-021-00679-0
6. Hadjadj J, Yatim N, Barnabei L, Corneau A, Boussier J, Smith N, et al. Impaired type I interferon activity and inflammatory responses in severe COVID-19 patients. Science (2020) 369:718–24. doi: 10.1126/science.abc6027
7. Kim YM, Shin EC. Type I and III interferon responses in SARS-CoV-2 infection. Exp Mol Med (2021) 53:750–60. doi: 10.1038/s12276-021-00592-0
8. Horby P, Lim WS, Emberson JR, Mafham M, Bell JL, Linsell L, et al. Dexamethasone in hospitalized patients with covid-19. N Engl J Med (2021) 384:693–704. doi: 10.1056/NEJMoa2021436
9. Cain DW, Cidlowski JA. Immune regulation by glucocorticoids. Nat Rev Immunol (2017) 17:233–47. doi: 10.1038/nri.2017.1
10. Liberman AC, Budziñski ML, Sokn C, Gobbini RP, Steininger A, Arzt E. Regulatory and mechanistic actions of glucocorticoids on T and inflammatory cells. Front Endocrinol (2018) 9. doi: 10.3389/fendo.2018.00235
11. Villar J, Ferrando C, Martínez D, Ambrós A, Muñoz T, Soler JA, et al. Dexamethasone treatment for the acute respiratory distress syndrome: a multicentre, randomised controlled trial. Lancet Respir Med (2020) 8:267–76. doi: 10.1016/S2213-2600(19)30417-5
12. Kino T, Burd I, Segars JH. Dexamethasone for severe COVID-19: How does it work at cellular and molecular levels? Int J Mol Sci (2021) 22:6764. doi: 10.3390/ijms22136764
13. Lampert A, Müller MM, Berchtold S, Lang KS, Palmada M, Dobrovinskaya O, et al. Effect of dexamethasone on voltage-gated k+ channels in jurkat T-lymphocytes. Pflügers Archiv (2003) 447:168–74. doi: 10.1007/s00424-003-1148-2
14. Mazer MB, Davitt E, Turnbull IR, Caldwell CC, Brakenridge SC, Remy KE, et al. In vitro-administered dexamethasone suppresses T cell function with reversal by interleukin-7 in coronavirus disease 2019. Crit Care Explor (2021) 3:e0378. doi: 10.1097/CCE.0000000000000378
15. Cahalan MD, Chandy KG. The functional network of ion channels in T lymphocytes. Immunol Rev (2009) 231:59–87. doi: 10.1111/j.1600-065X.2009.00816.x
16. Chirra M, Newton HS, Gawali VS, Wise-Draper TM, Chimote AA, Conforti L. How the potassium channel response of T lymphocytes to the tumor microenvironment shapes antitumor immunity. Cancers (2022) 14:3564. doi: 10.3390/cancers14153564
17. Feske S, Wulff H, Skolnik EY. Ion channels in innate and adaptive immunity. Annu Rev Immunol (2015) 33:291–353. doi: 10.1146/annurev-immunol-032414-112212
18. Chimote AA, Hajdu P, Kottyan LC, Harley JB, Yun Y, Conforti L. Nanovesicle-targeted Kv1.3 knockdown in memory T cells suppresses CD40L expression and memory phenotype. J Autoimmun (2016) 69:86–93. doi: 10.1016/j.jaut.2016.03.004
19. Chimote AA, Hajdu P, Sfyris AM, Gleich BN, Wise-Draper T, Casper KA, et al. Kv1.3 channels mark functionally competent CD8+ tumor-infiltrating lymphocytes in head and neck cancer. Cancer Res (2017) 77:53–61. doi: 10.1158/0008-5472.CAN-16-2372
20. Chimote AA, Balajthy A, Arnold MJ, Newton HS, Hajdu P, Qualtieri J, et al. A defect in KCa3.1 channel activity limits the ability of CD8(+) T cells from cancer patients to infiltrate an adenosine-rich microenvironment. Sci Signal (2018) 11:eaaq1616. doi: 10.1126/scisignal.aaq1616
21. Chimote AA, Gawali VS, Newton HS, Wise-Draper TM, Conforti L. A compartmentalized reduction in membrane-proximal calmodulin reduces the immune surveillance capabilities of CD8(+) T cells in head and neck cancer. Front Pharmacol (2020) 11:143. doi: 10.3389/fphar.2020.00143
22. Khodoun M, Chimote AA, Ilyas FZ, Duncan HJ, Moncrieffe H, Kant KS, et al. Targeted knockdown of Kv1.3 channels in T lymphocytes corrects the disease manifestations associated with systemic lupus erythematosus. Sci Adv (2020) 6:eabd1471. doi: 10.1126/sciadv.abd1471
23. Solé L, Roura-Ferrer M, Pérez-Verdaguer M, Oliveras A, Calvo M, Fernández-Fernández JM, et al. KCNE4 suppresses Kv1.3 currents by modulating trafficking, surface expression and channel gating. J Cell Sci (2009) 122:3738–48. doi: 10.1242/jcs.056689
24. Danaher P, Warren S, Dennis L, D’amico L, White A, Disis ML, et al. Gene expression markers of tumor infiltrating leukocytes. J ImmunoTherapy Cancer (2017) 5:18. doi: 10.1186/s40425-017-0215-8
25. Raudvere U, Kolberg L, Kuzmin I, Arak T, Adler P, Peterson H, et al. g:Profiler: a web server for functional enrichment analysis and conversions of gene lists, (2019 update). Nucleic Acids Res (2019) 47:W191–w198. doi: 10.1093/nar/gkz369
26. Shannon P, Markiel A, Ozier O, Baliga NS, Wang JT, Ramage D, et al. Cytoscape: a software environment for integrated models of biomolecular interaction networks. Genome Res (2003) 13:2498–504. doi: 10.1101/gr.1239303
27. Newton HS, Gawali VS, Chimote AA, Lehn MA, Palackdharry SM, Hinrichs BH, et al. PD1 blockade enhances k+ channel activity, Ca2+ signaling, and migratory ability in cytotoxic T lymphocytes of patients with head and neck cancer. J ImmunoTherapy Cancer (2020) 8:e000844. doi: 10.1136/jitc-2020-000844
28. Kalman K, Pennington MW, Lanigan MD, Nguyen A, Rauer H, Mahnir V, et al. ShK-Dap22, a potent Kv1.3-specific immunosuppressive polypeptide*. J Biol Chem (1998) 273:32697–707. doi: 10.1074/jbc.273.49.32697
29. Hajdu P, Chimote AA, Thompson TH, Koo Y, Yun Y, Conforti L. Functionalized liposomes loaded with siRNAs targeting ion channels in effector memory T cells as a potential therapy for autoimmunity. Biomaterials (2013) 34:10249–57. doi: 10.1016/j.biomaterials.2013.09.019
30. Sinha S, Rosin NL, Arora R, Labit E, Jaffer A, Cao L, et al. Dexamethasone modulates immature neutrophils and interferon programming in severe COVID-19. Nat Med (2022) 28:201–11. doi: 10.1038/s41591-021-01576-3
31. Paludan SR, Mogensen TH. Innate immunological pathways in COVID-19 pathogenesis. Sci Immunol (2022) 7:eabm5505. doi: 10.1126/sciimmunol.abm5505
32. Karki R, Lee S, Mall R, Pandian N, Wang Y, Sharma BR, et al. ZBP1-dependent inflammatory cell death, PANoptosis, and cytokine storm disrupt IFN therapeutic efficacy during coronavirus infection. Sci Immunol (2022) 7(74):eabo6294. doi: 10.1126/sciimmunol.abo6294
33. Feske S, Giltnane J, Dolmetsch R, Staudt LM, Rao A. Gene regulation mediated by calcium signals in T lymphocytes. Nat Immunol (2001) 2:316–24. doi: 10.1038/86318
34. Vig M, Kinet J-P. Calcium signaling in immune cells. Nat Immunol (2009) 10:21–7. doi: 10.1038/ni.f.220
35. Berry CT, May MJ, Freedman BD. STIM- and orai-mediated calcium entry controls NF-κB activity and function in lymphocytes. Cell calcium (2018) 74:131–43. doi: 10.1016/j.ceca.2018.07.003
36. Gustavson LE, Benet LZ. 11 - pharmacokinetics of natural and synthetic glucocorticoids. In: Anderson DC, Winter JSD, editors. Adrenal cortex. Butterworth-Heinemann (1985). p. 235–81. doi: 10.1016/B978-0-407-02275-1.50016-8
37. Gwack Y, Feske S, Srikanth S, Hogan PG, Rao A. Signalling to transcription: store-operated Ca2+ entry and NFAT activation in lymphocytes. Cell Calcium (2007) 42:145–56. doi: 10.1016/j.ceca.2007.03.007
38. Lucas C, Wong P, Klein J, Castro TBR, Silva J, Sundaram M, et al. Longitudinal analyses reveal immunological misfiring in severe COVID-19. Nature (2020) 584:463–9. doi: 10.1038/s41586-020-2588-y
39. Zhang JY, Wang XM, Xing X, Xu Z, Zhang C, Song JW, et al. Single-cell landscape of immunological responses in patients with COVID-19. Nat Immunol (2020) 21:1107–18. doi: 10.1038/s41590-020-0762-x
40. Kusnadi A, Ramírez-Suástegui C, Fajardo V, Chee SJ, Meckiff BJ, Simon H, et al. Severely ill COVID-19 patients display impaired exhaustion features in SARS-CoV-2-reactive CD8(+) T cells. Sci Immunol (2021) 6:eabe4782. doi: 10.1126/sciimmunol.abe4782
41. Ghosh S, Dellibovi-Ragheb TA, Kerviel A, Pak E, Qiu Q, Fisher M, et al. β-coronaviruses use lysosomes for egress instead of the biosynthetic secretory pathway. Cell (2020) 183:1520–1535.e1514. doi: 10.1016/j.cell.2020.10.039
42. Fang S, Zhang L, Liu Y, Xu W, Wu W, Huang Z, et al. Lysosome activation in peripheral blood mononuclear cells and prognostic significance of circulating LC3B in COVID-19. Briefings Bioinf (2021) 22:1466–75. doi: 10.1093/bib/bbab043
43. Cron RQ, Caricchio R, Chatham WW. Calming the cytokine storm in COVID-19. Nat Med (2021) 27:1674–5. doi: 10.1038/s41591-021-01500-9
44. Liu X, Zhang R, He G. Hematological findings in coronavirus disease 2019: indications of progression of disease. Ann Hematol (2020) 99:1421–8. doi: 10.1007/s00277-020-04103-5
45. Witkowski M, Tizian C, Ferreira-Gomes M, Niemeyer D, Jones TC, Heinrich F, et al. Untimely TGFβ responses in COVID-19 limit antiviral functions of NK cells. Nature (2021) 600:295–301. doi: 10.1038/s41586-021-04142-6
46. Thwaites RS, Sanchez Sevilla Uruchurtu A, Siggins MK, Liew F, Russell CD, Moore SC, et al. Inflammatory profiles across the spectrum of disease reveal a distinct role for GM-CSF in severe COVID-19. Sci Immunol (2021) 6:eabg9873. doi: 10.1126/sciimmunol.abg9873
47. Liu T, Zhang L, Joo D, Sun S-C. NF-κB signaling in inflammation. Signal Transduction Targeted Ther (2017) 2:17023. doi: 10.1038/sigtrans.2017.23
48. Todorović-Raković N, Whitfield JR. Between immunomodulation and immunotolerance: The role of IFNγ in SARS-CoV-2 disease. Cytokine (2021) 146:155637. doi: 10.1016/j.cyto.2021.155637
49. Karki R, Sharma BR, Tuladhar S, Williams EP, Zalduondo L, Samir P, et al. Synergism of TNF-α and IFN-γ triggers inflammatory cell death, tissue damage, and mortality in SARS-CoV-2 infection and cytokine shock syndromes. Cell (2021) 184:149–168.e117. doi: 10.1016/j.cell.2020.11.025
50. Levy DE, García-Sastre A. The virus battles: IFN induction of the antiviral state and mechanisms of viral evasion. Cytokine Growth Factor Rev (2001) 12:143–56. doi: 10.1016/S1359-6101(00)00027-7
51. Galani IE, Rovina N, Lampropoulou V, Triantafyllia V, Manioudaki M, Pavlos E, et al. Untuned antiviral immunity in COVID-19 revealed by temporal type I/III interferon patterns and flu comparison. Nat Immunol (2021) 22:32–40. doi: 10.1038/s41590-020-00840-x
52. Park A, Iwasaki A. Type I and type III interferons - induction, signaling, evasion, and application to combat COVID-19. Cell Host Microbe (2020) 27:870–8. doi: 10.1016/j.chom.2020.05.008
53. Song JW, Zhang C, Fan X, Meng FP, Xu Z, Xia P, et al. Immunological and inflammatory profiles in mild and severe cases of COVID-19. Nat Commun (2020) 11:3410. doi: 10.1038/s41467-020-17240-2
54. Zheng H-Y, Zhang M, Yang C-X, Zhang N, Wang X-C, Yang X-P, et al. Elevated exhaustion levels and reduced functional diversity of T cells in peripheral blood may predict severe progression in COVID-19 patients. Cell Mol Immunol (2020) 17:541–3. doi: 10.1038/s41423-020-0401-3
55. Shahbaz S, Xu L, Sligl W, Osman M, Bozorgmehr N, Mashhouri S, et al. The quality of SARS-CoV-2-Specific T cell functions differs in patients with Mild/Moderate versus severe disease, and T cells expressing coinhibitory receptors are highly activated. J Immunol (2021) 207:1099–111. doi: 10.4049/jimmunol.2100446
56. Yatim N, Boussier J, Tetu P, Smith N, Bruel T, Charbit B, et al. Immune checkpoint inhibitors increase T cell immunity during SARS-CoV-2 infection. Sci Adv (2021) 7(34):eabg4081. doi: 10.1126/sciadv.abg4081
57. Xia M, Gasser J, Feige U. Dexamethasone enhances CTLA-4 expression during T cell activation. Cell Mol Life Sci (1999) 55:1649–56. doi: 10.1007/s000180050403
58. Giles AJ, Hutchinson MND, Sonnemann HM, Jung J, Fecci PE, Ratnam NM, et al. Dexamethasone-induced immunosuppression: mechanisms and implications for immunotherapy. J Immunother Cancer (2018) 6:51. doi: 10.1186/s40425-018-0371-5
59. Hoffmann M, Kleine-Weber H, Schroeder S, Krüger N, Herrler T, Erichsen S, et al. SARS-CoV-2 cell entry depends on ACE2 and TMPRSS2 and is blocked by a clinically proven protease inhibitor. Cell (2020) 181:271–280.e278. doi: 10.1016/j.cell.2020.02.052
60. Gutman GA, Chandy KG, Grissmer S, Lazdunski M, Mckinnon D, Pardo LA, et al. International union of pharmacology. LIII. nomenclature and molecular relationships of voltage-gated potassium channels. Pharmacol Rev (2005) 57:473–508. doi: 10.1124/pr.57.4.10
61. Koshy S, Wu D, Hu X, Tajhya RB, Huq R, Khan FS, et al. Blocking KCa3.1 channels increases tumor cell killing by a subpopulation of human natural killer lymphocytes. PloS One (2013) 8:e76740–0. doi: 10.1371/journal.pone.0076740
62. Wang X, Li G, Guo J, Zhang Z, Zhang S, Zhu Y, et al. Kv1.3 channel as a key therapeutic target for neuroinflammatory diseases: State of the art and beyond. Front Neurosci (2020) 13. doi: 10.3389/fnins.2019.01393
63. Wulff H, Calabresi PA, Allie R, Yun S, Pennington M, Beeton C, et al. The voltage-gated Kv1.3 k(+) channel in effector memory T cells as new target for MS. J Clin Invest (2003) 111:1703–13. doi: 10.1172/JCI16921
64. Chiang EY, Li T, Jeet S, Peng I, Zhang J, Lee WP, et al. Potassium channels Kv1.3 and KCa3.1 cooperatively and compensatorily regulate antigen-specific memory T cell functions. Nat Commun (2017) 8:14644. doi: 10.1038/ncomms14644
65. Grifoni A, Weiskopf D, Ramirez SI, Mateus J, Dan JM, Moderbacher CR, et al. Targets of T cell responses to SARS-CoV-2 coronavirus in humans with COVID-19 disease and unexposed individuals. Cell (2020) 181:1489–1501.e1415. doi: 10.1016/j.cell.2020.05.015
66. Conforti L. The ion channel network in T lymphocytes, a target for immunotherapy. Clin Immunol (2012) 142:105–6. doi: 10.1016/j.clim.2011.11.009
67. Conforti L. Potassium channels of T lymphocytes take center stage in the fight against cancer. J Immunother Cancer (2017) 5:2. doi: 10.1186/s40425-016-0202-5
68. Stevens A, Yuasa M, Peckham D, Olsen C, Iadonato S, Probst P. AI-06 dalazatide, an inhibitor of the kv1.3 channel on activated effector memory T cells, has immunotherapy potential against systemic lupus erythematosus. Lupus Sci Med (2016) 3:A3–4. doi: 10.1136/lupus-2016-000179.6
Keywords: COVID-19, ion channels, interferon signaling, severe COVID-19, cytokine storm, dexamethasone, severe COVID-19 immune signaling
Citation: Chimote AA, Alshwimi AO, Chirra M, Gawali VS, Powers-Fletcher MV, Hudock KM and Conforti L (2023) Immune and ionic mechanisms mediating the effect of dexamethasone in severe COVID-19. Front. Immunol. 14:1143350. doi: 10.3389/fimmu.2023.1143350
Received: 12 January 2023; Accepted: 15 March 2023;
Published: 24 March 2023.
Edited by:
Yongjun Jiang, The Second Affiliated Hospital of Guangzhou Medical University, ChinaReviewed by:
Lv Jiadi, Chinese Academy of Medical Sciences and Peking Union Medical College, ChinaMikhail Pashenkov, Institute of Immunology, Russia
Copyright © 2023 Chimote, Alshwimi, Chirra, Gawali, Powers-Fletcher, Hudock and Conforti. This is an open-access article distributed under the terms of the Creative Commons Attribution License (CC BY). The use, distribution or reproduction in other forums is permitted, provided the original author(s) and the copyright owner(s) are credited and that the original publication in this journal is cited, in accordance with accepted academic practice. No use, distribution or reproduction is permitted which does not comply with these terms.
*Correspondence: Laura Conforti, laura.conforti@uc.edu