 Heidi Albert1*
 Benn Sartorius2,3Paul R. Bessell4
 Dziedzom K. de Souza4,5Sidharth Rupani6Karla Gonzalez6Simon Kayembe7,8Joseph Ndung’u4Rachel Pullan2Don Paul Makana9Maria Cecilia César de Almeida9†Naomi Awaca Uvon8†
- 1FIND South Africa, Cape Town, South Africa
- 2Department of Disease Control, London School of Hygiene and Tropical Medicine, London, United Kingdom
- 3Centre for Tropical Medicine and Global Health, Nuffield Department of Medicine, University of Oxford, Oxford, United Kingdom
- 4FIND, Neglected Tropical Diseases Programme, Geneva, Switzerland
- 5Noguchi Memorial Institute for Medical Research, College of Health Sciences, University of Ghana, Accra, Ghana
- 6Coupa Software Inc, San Mateo, CA, United States
- 7National Neglected Tropical Diseases Program, Ministry of Health, Kinshasa, Democratic Republic of Congo
- 8Département de Médecine Tropicale, Université de Kinshasa, Kinshasa, Democratic Republic of Congo
- 9National Neglected Tropical Diseases Program, Ministry of Health, Luanda, Angola
Background: Onchocerciasis (river blindness) is a filarial disease targeted for elimination of transmission. However, challenges exist to the implementation of effective diagnostic and surveillance strategies at various stages of elimination programs. To address these challenges, we used a network data analytics approach to identify optimal diagnostic scenarios for onchocerciasis elimination mapping (OEM).
Methods: The diagnostic network optimization (DNO) method was used to model the implementation of the old Ov16 rapid diagnostic test (RDT) and of new RDTs in development for OEM under different testing strategy scenarios with varying testing locations, test performance and disease prevalence. Environmental suitability scores (ESS) based on machine learning algorithms were developed to identify areas at risk of transmission and used to select sites for OEM in Bandundu region in the Democratic Republic of Congo (DRC) and Uige province in Angola. Test sensitivity and specificity ranges were obtained from the literature for the existing RDT, and from characteristics defined in the target product profile for the new RDTs. Sourcing and transportation policies were defined, and costing information was obtained from onchocerciasis programs. Various scenarios were created to test various state configurations. The actual demand scenarios represented the disease prevalence at IUs according to the ESS, while the counterfactual scenarios (conducted only in the DRC) are based on adapted prevalence estimates to generate prevalence close to the statistical decision thresholds (5% and 2%), to account for variability in field observations. The number of correctly classified implementation units (IUs) per scenario were estimated and key cost drivers were identified.
Results: In both Bandundu and Uige, the sites selected based on ESS had high predicted onchocerciasis prevalence >10%. Thus, in the actual demand scenarios in both Bandundu and Uige, the old Ov16 RDT correctly classified all 13 and 11 IUs, respectively, as requiring CDTi. In the counterfactual scenarios in Bandundu, the new RDTs with higher specificity correctly classified IUs more cost effectively. The new RDT with highest specificity (99.8%) correctly classified all 13 IUs. However, very high specificity (e.g., 99.8%) when coupled with imperfect sensitivity, can result in many false negative results (missing decisions to start MDA) at the 5% statistical decision threshold (the decision rule to start MDA). This effect can be negated by reducing the statistical decision threshold to 2%. Across all scenarios, the need for second stage sampling significantly drove program costs upwards. The best performing testing strategies with new RDTs were more expensive than testing with existing tests due to need for second stage sampling, but this was offset by the cost of incorrect classification of IUs.
Conclusion: The new RDTs modelled added most value in areas with variable disease prevalence, with most benefit in IUs that are near the statistical decision thresholds. Based on the evaluations in this study, DNO could be used to guide the development of new RDTs based on defined sensitivities and specificities. While test sensitivity is a minor driver of whether an IU is identified as positive, higher specificities are essential. Further, these models could be used to explore the development and optimization of new tools for other neglected tropical diseases.
Introduction
Onchocerciasis affects about 20.9 million people worldwide, with 99% of cases found in 31 countries in sub-Saharan Africa (1). The burden of this disease predominantly affects the poorest, most remotely located villages, with limited access to healthcare, and leads to low productivity and poor socio-economic development. The development of new diagnostic tools coupled with the effectiveness of control through community-directed treatment with ivermectin (CDTi), the elimination of onchocerciasis in 11 out of 13 foci in the Americas (2–4), and the successful interruption of transmission in many foci in Africa (5–7), led the World Health Organization (WHO) to include elimination of onchocerciasis in its roadmap for overcoming the global impact of neglected tropical diseases (NTDs) (8). The evolution of onchocerciasis management from control (in only hyper- and meso-endemic areas) to elimination (in all endemic areas) requires a more comprehensive understanding of the distribution of infection. As a result, onchocerciasis elimination mapping (OEM) needs to be undertaken in all areas not currently under treatment, to detect disease transmission and inform the implementation of CDTi (9).
For OEM it is imperative that the transmission status of all implementation units (IUs; the level at which each country determines that treatment should be conducted) is correctly identified, to avoid missing an IU requiring treatment or conducting extensive CDTi in an IU that does not require treatment. As low levels of infection can still support the transmission of onchocerciasis, a principal challenge to OEM programs is the poor sensitivity and specificity of current diagnostics tools (9–11). WHO recommends the use of an enzyme-linked immunosorbent assay (ELISA) or rapid diagnostic test (RDT) that detects antibodies to the parasite-specific Ov16 antigen (12–14). These tests give indication of past exposure to infection and are recommended for mapping hypo-endemic areas and detecting recent transmission in children (15). While they are currently the best tools for OEM, the RDT has shown variable performance in field conditions compared with laboratory-based settings (14), and the variety of in-house protocols and kit-based ELISAs available represents challenges to feasibility of wide-scale implementation of ELISA tests. Thus, improvements to the Ov16 tests are required to enhance their suitability for OEM, and as such, a number of new diagnostic tools are under development.
It is important to consider how best to efficiently implement the use of new test formats currently in development, particularly given that the rapid epidemiological mapping for onchocerciasis (16), previously used to identify villages that may be candidates for CDTi relied on nodule palpation and skin-snip microscopy in areas with high transmission. Diagnostic network optimization (DNO) is a method used to identify the best diagnostic network configuration from a set of available alternatives by integrating multiple data inputs, such as the physical configuration and infrastructure of the diagnostic network, including the number, locations, and capacity of facilities and testing sites, and referral linkages. Network optimization and strategic supply chain management using specialized software is common practice in the commercial sector (17), and these analytical modelling software approaches are now being applied increasingly to the optimization of diagnostic networks. The objective of network optimization is to balance the need for increased access to services with cost efficiency and feasibility of implementation in resource-constrained settings, and to help Ministries of Health identify gaps and misalignments in diagnostic service delivery that can be addressed through laboratory strengthening interventions. This approach has previously been applied to inform country-led decision-making processes for tuberculosis and HIV diagnosis (18, 19).
We adapted the DNO approach for OEM, in order to evaluate optimal implementation models based on the sensitivity and specificity of the existing Ov16 RDT. We also evaluated the impact of improved RDTs under development based on the target product profile (TPP) (20), and identified key cost drivers for the different testing strategies.
Materials and Methods
This study employed the DNO approach to model the implementation of the old Ov16 RDT and new Ov16 RDTs in development for OEM. Different scenarios with varying testing locations, test performance and disease prevalence were assessed. Data inputs used in the DNO model are summarized in Figure 1. Environmental suitability scoring (ESS) was used to select sites for OEM in areas identified as being at risk of transmission. Test sensitivity and specificity ranges were obtained from the literature for the existing RDT, and from characteristics defined in the TPP for the new tests. Information on the sourcing and transportation costs for running the activities was obtained from current onchocerciasis programs. Actual demand scenarios based on disease prevalence according to the ESS, and counterfactual scenarios based on adapted prevalence estimates to generate prevalence close to the statistical decision thresholds, were assessed to account for variability in field observations. Based on the results, the overall performance of testing strategies for OEM, the cost per correctly classified IU, and the decision drivers for different implementation models, all using current and improved tests, were determined.
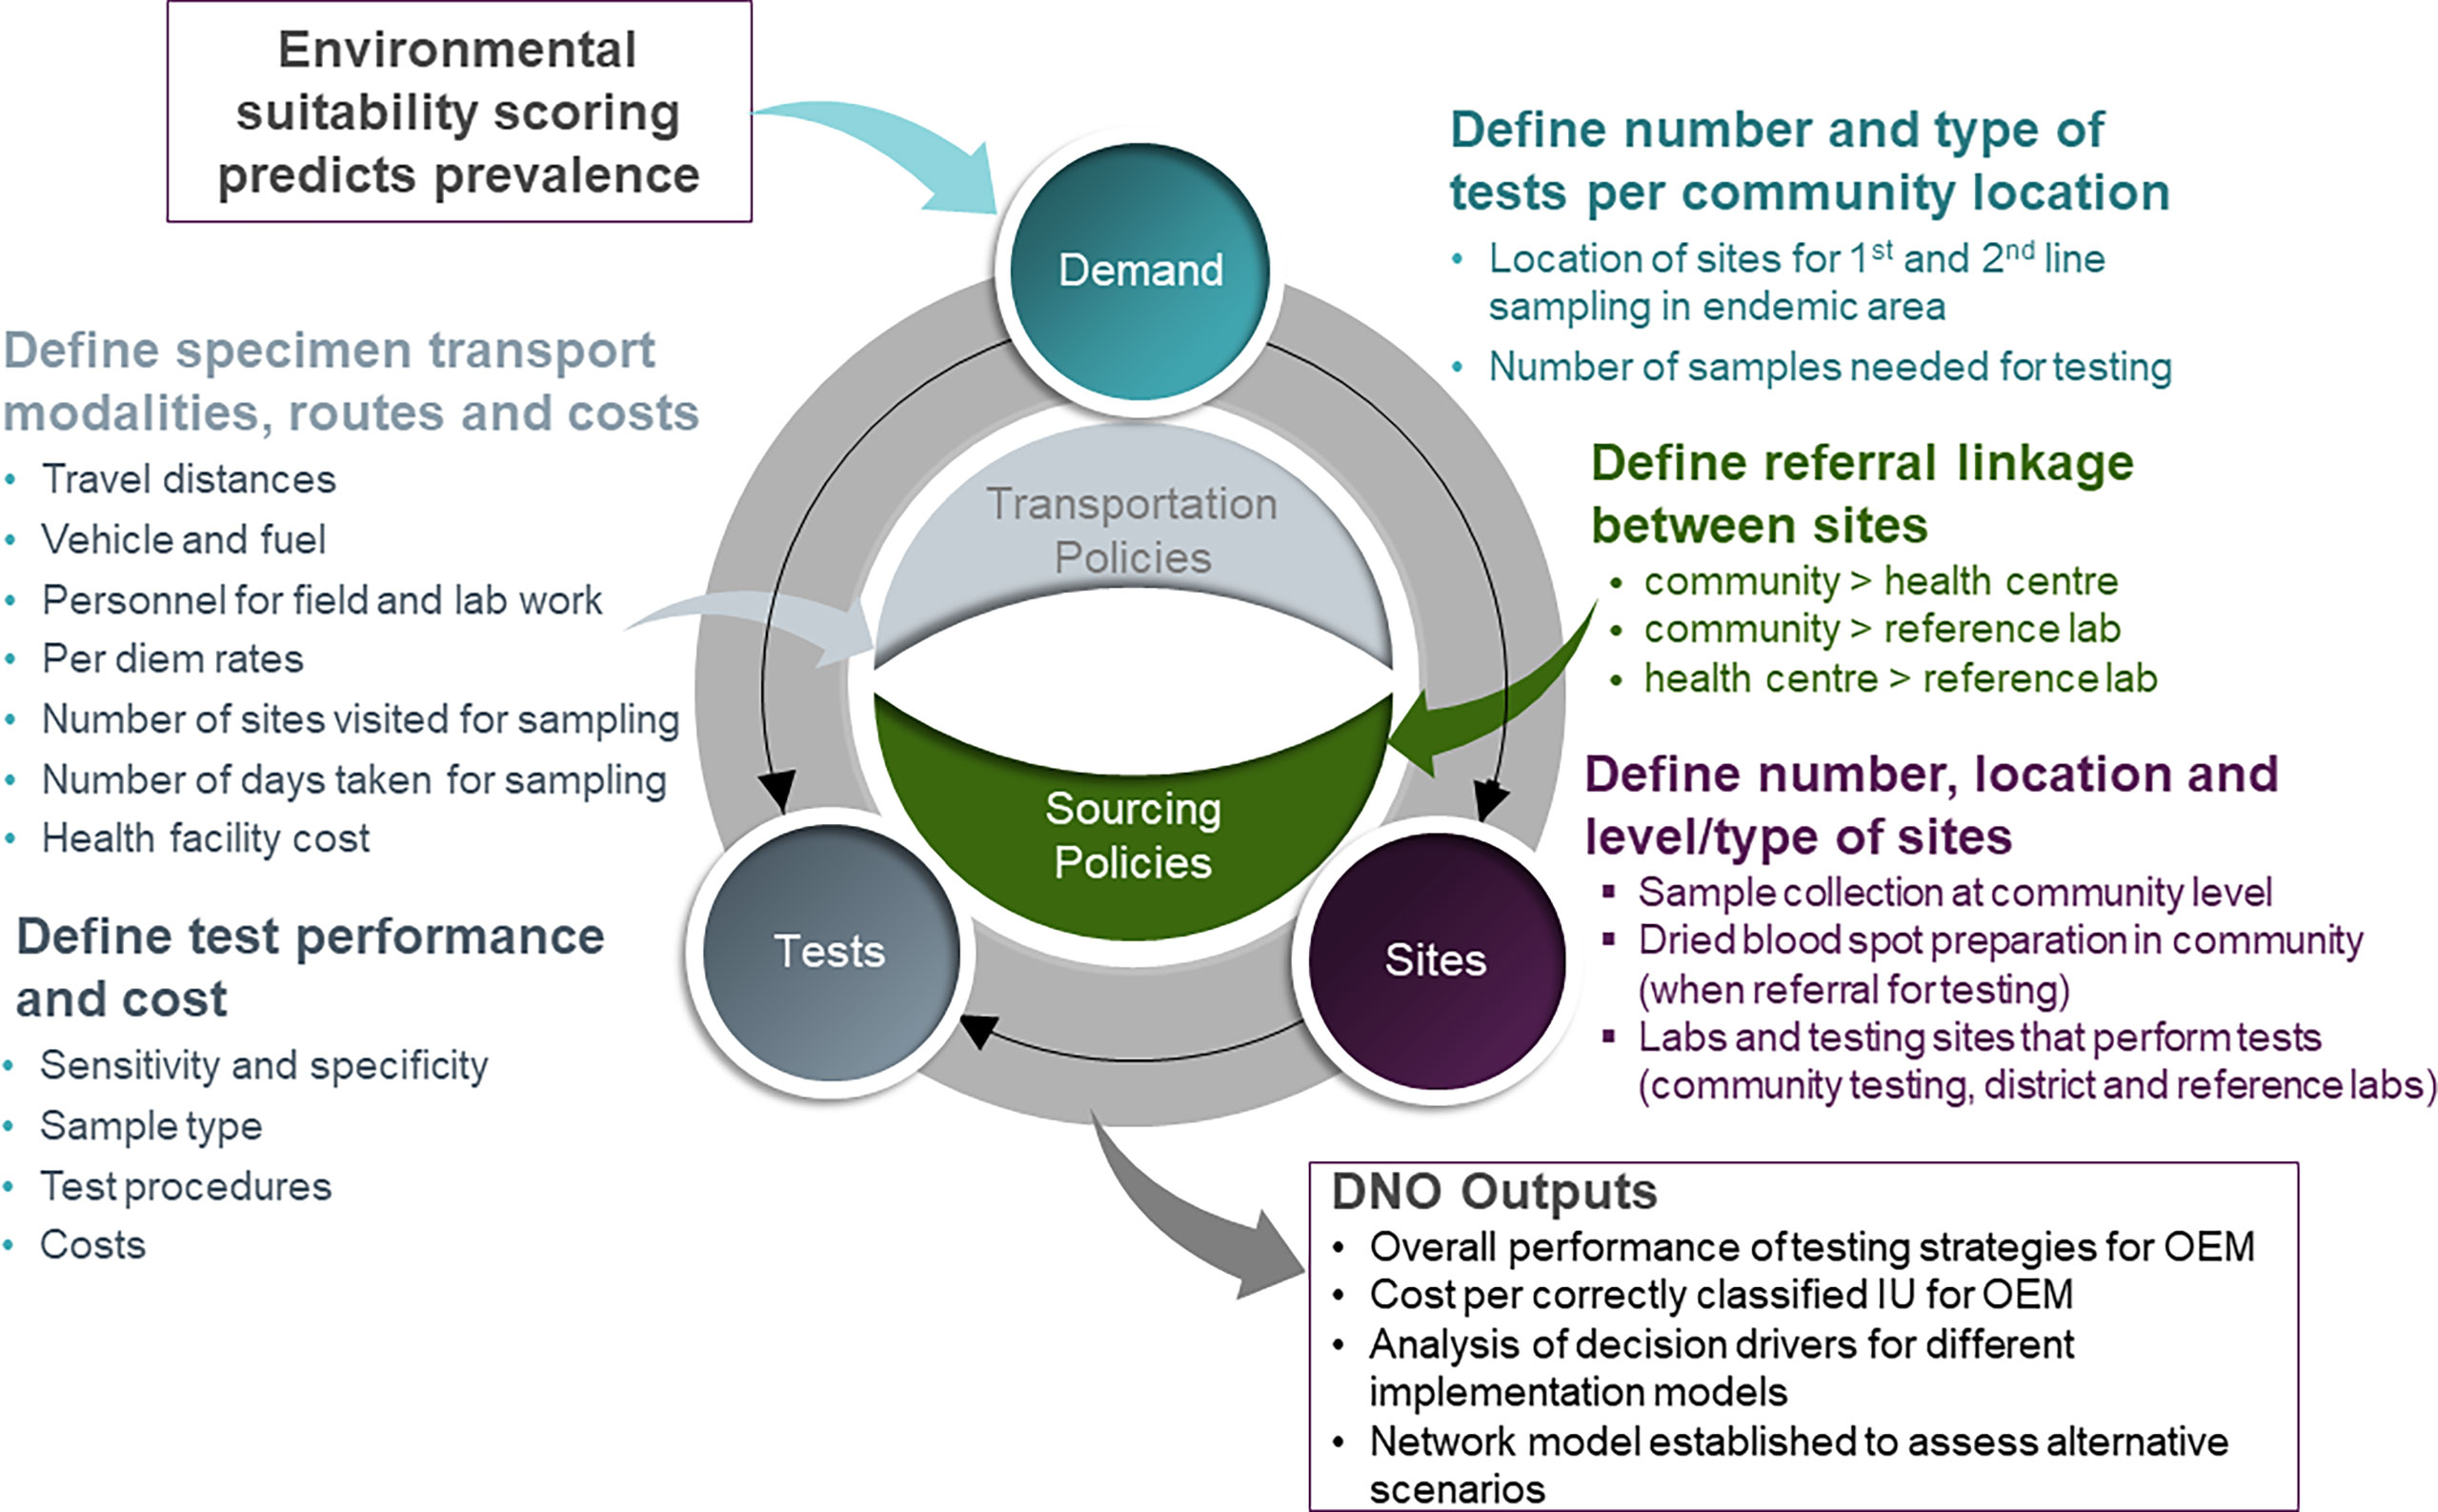
Figure 1 Illustration of the inputs and outputs of the DNO model for OEM.
Data Inputs
The DNO model included three main data inputs. First, the demand for testing informed the locations of the sites and testing procedures. Second, data on the tests, including performance, sample collection, number and type of tests required, testing procedures and cost. Third, sourcing and transportation policies to define the relationships between locations and testing sites. The data for the study were compiled from various sources including questionnaires administered to onchocerciasis program personnel (Supplementary File S1) and the ESS.
Sample Collection Site Selection
This work focused on regions in the Democratic Republic of Congo (DRC) and Angola requiring OEM. Following review of onchocerciasis data available on the ESPEN portal (21), the Bandundu region of DRC, with IUs in Kwilu, Kwango and Mayi Ndombe provinces (N=13), and the IUs in Uige province of Angola (N=11), were selected for inclusion (Figure 2).
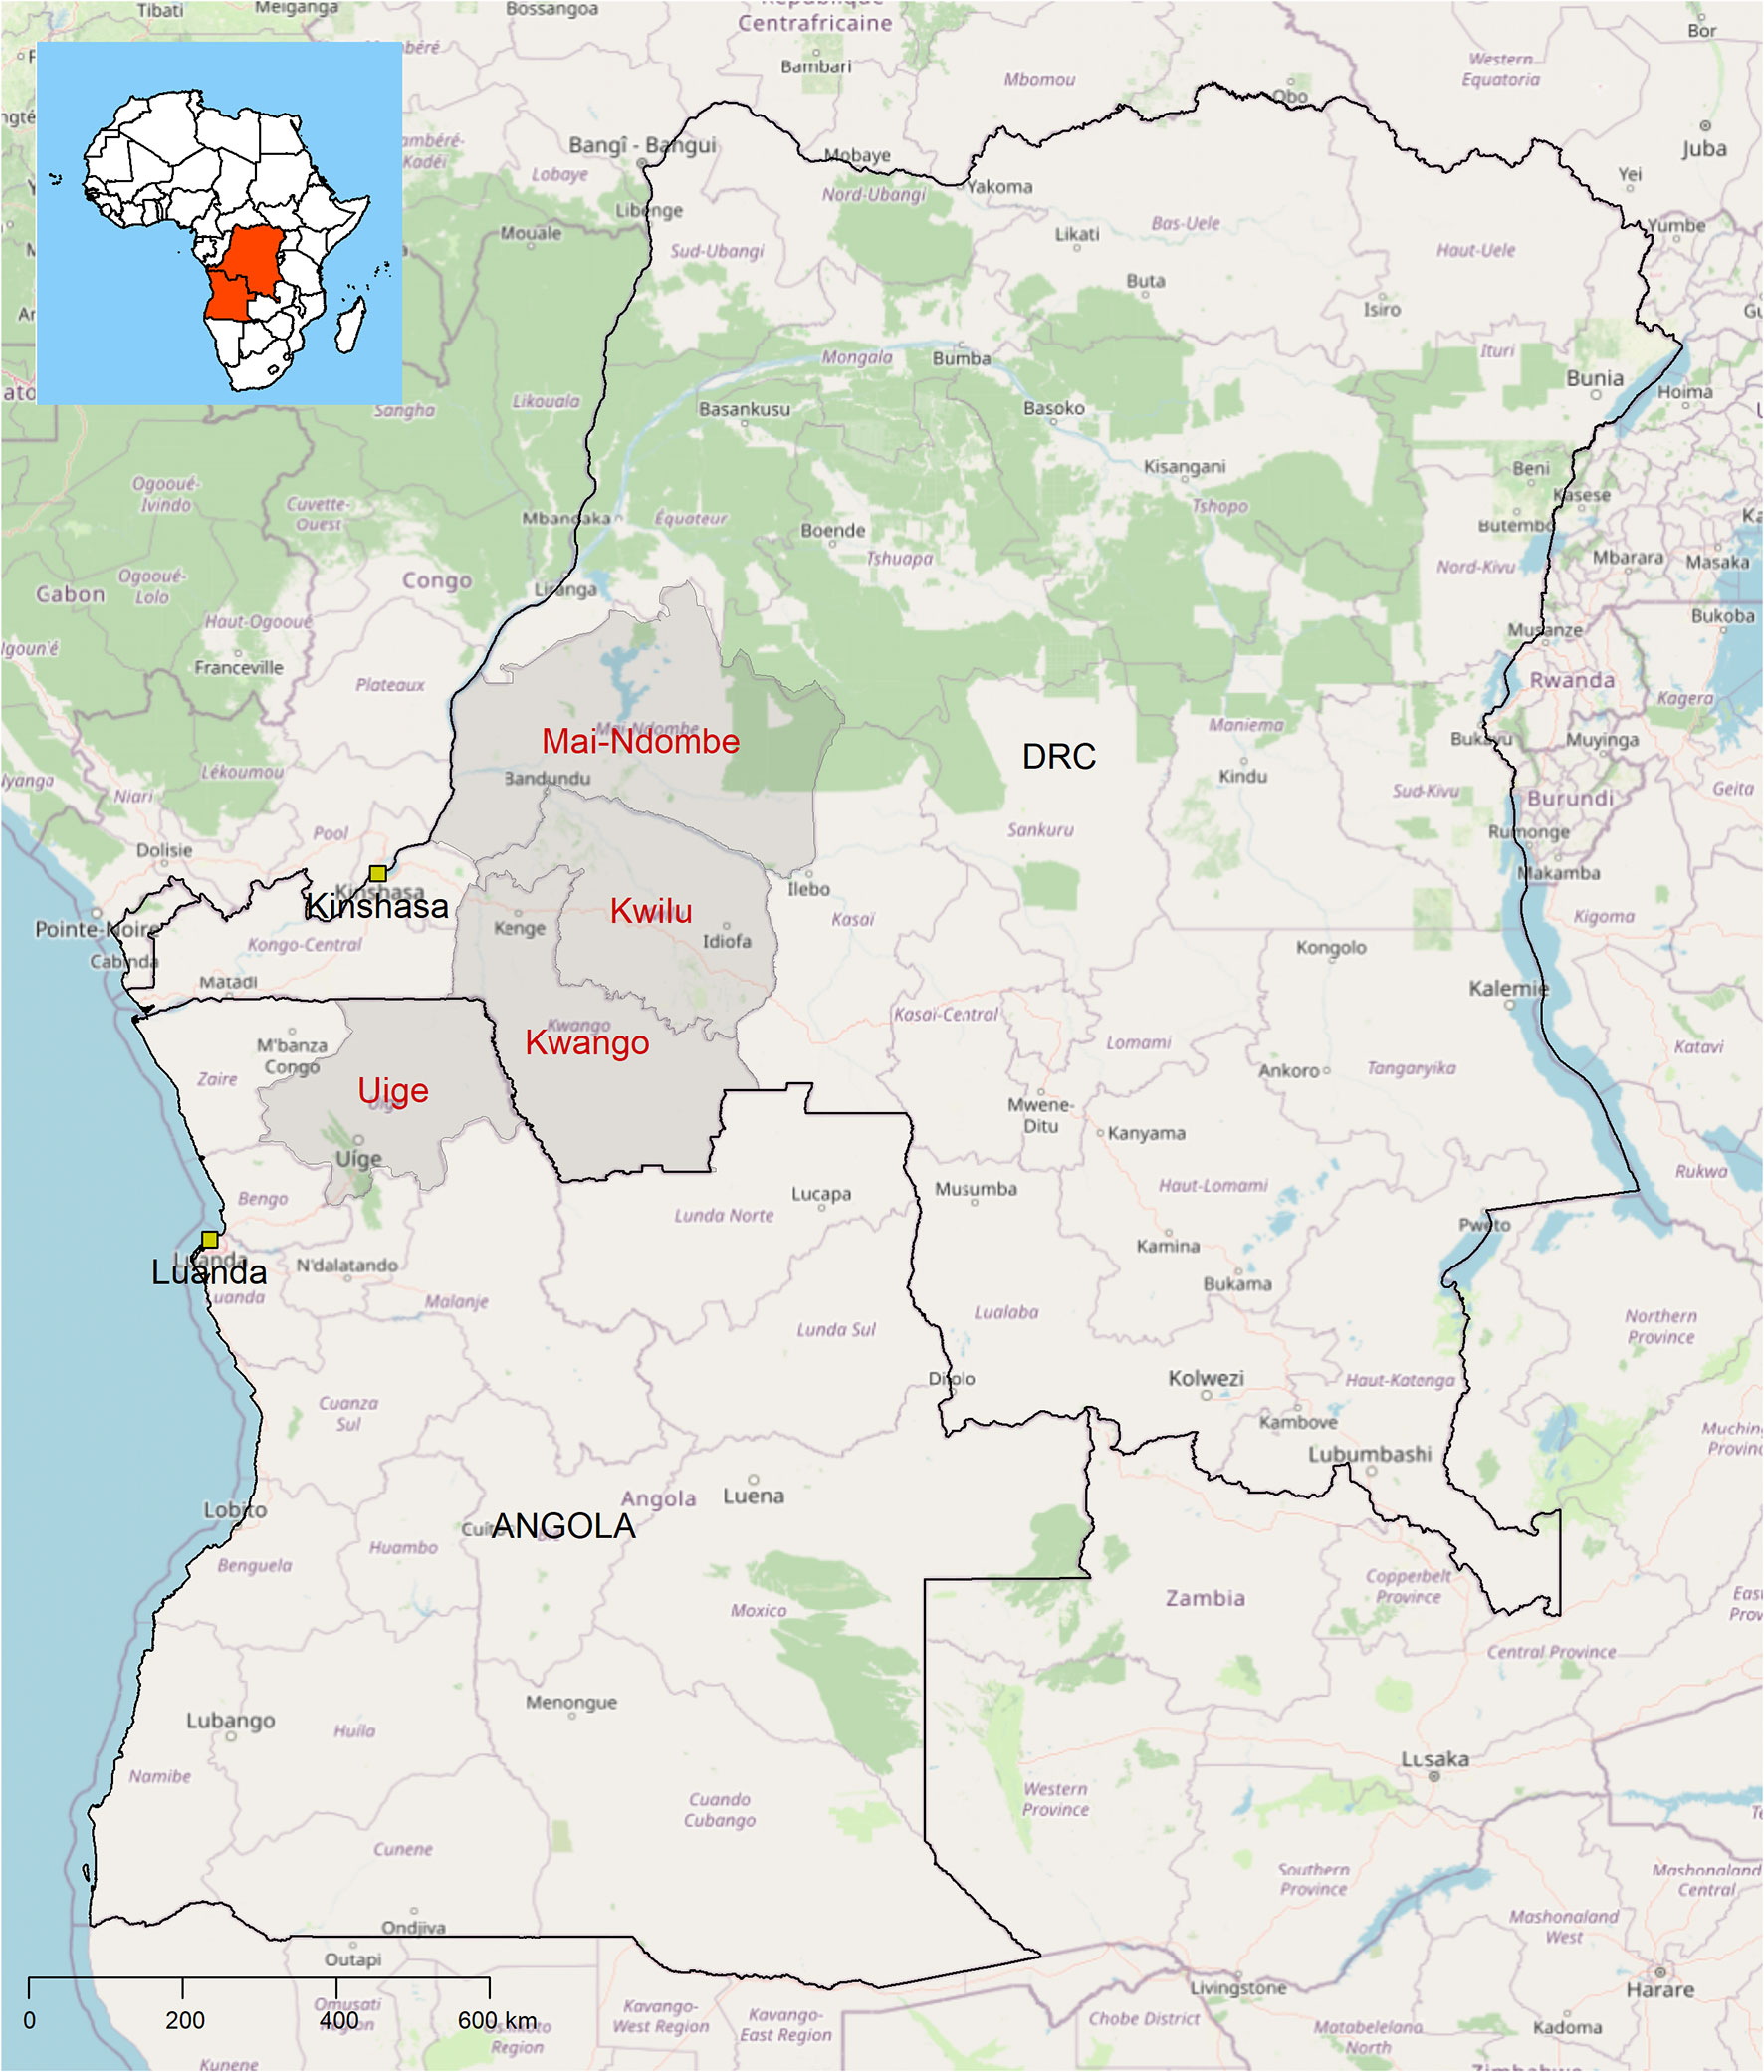
Figure 2 Maps of Angola (left) and the Democratic Republic of Congo (right) showing the study provinces included in the analysis.
To enable the selection of villages based on suitability for OEM at a given settlement, we employed ESS as a proxy for the current strategy for OEM. The current strategy recommends a two-step approach for identification of sites in need of treatment in each IU (14). The first step is the purposeful selection of five first line or high-risk villages and sampling of 100 adults per village to determine the prevalence of onchocerciasis using the Ov16 RDT. If the prevalence is ≥ 5% statistical threshold (the decision rule to start MDA) in one or more villages, CDTi is recommended for the IU. If the prevalence is <5% in all five first line villages, second stage sampling is required. For this second step, villages are ordered geographically, and 20 villages are systematically selected. Fifty adults are sampled and tested and if the prevalence is ≥ 5% in two or more villages or ≥ 10% in one village, CDTi is recommended. Otherwise, no treatment is needed in the IU (14). For the DNO analysis, ESS was used for the selection of the frontline villages as well as for the 20 villages if second stage sampling was indicated.
An ensemble of machine learning modelling algorithms was used to develop a high-resolution map of ESS for onchocerciasis. In this application the ensemble machine learning modelling approach (22) was based on 6 classification algorithms within the Biodiversity Modelling (BIOMOD) computational framework for modelling species distribution (23) (namely: random forest (RF), boosted regression trees (GBM), generalized linear regression (with quadratic terms for all predictors) (GLM), generalized additive models (GAM), artificial neural network (ANN) and multiple adaptive regression splines (MARS)) and using an array of environmental variables (predictors relating to climate, topography, human factors and hydrology, with selection of final predictors made using principal component analysis to reduce dimensionality) (24) against observed onchocerciasis survey data in the ESPEN data portal (21) to obtain the predicted environmental suitability score (and probability of occurrence) and binary occurrence of onchocerciasis using a cut-off that maximized sensitivity, specificity and proportion of IUs correctly classified. In this application the random forest approach outperformed the other algorithms tested (Supplementary File S2) (25). The final ensemble was constructed using a weighted mean of probability approach. Individual models were weighted based on their performance (receiver operating characteristic (ROC) statistic and the Hanssen-Kuipers discriminant (also known as true skill statistic, TSS) (26). Only models with ROC > 0.7 through internal validation were included). We obtained predicted environmental suitability model (probability of occurrence) and final binary occurrence map using a cut-off that maximized sensitivity, specificity and PCC (proportion correctly classified). The prevalence of occurrence was bivariate, estimated against the ESS to provide a measure of prevalence at a given ESS value for the purposes of the settlement sampling. In addition, the estimates from the ESS score were externally validated using recent survey data from Malawi and Burundi which were not included in the original input data to compare observed prevalence against the predicted prevalence based on ESS (Figure 3). The ESS analyses were conducted in R using the biomod2 package (27). For all prevalence estimates, the 95% confidence intervals are provided.
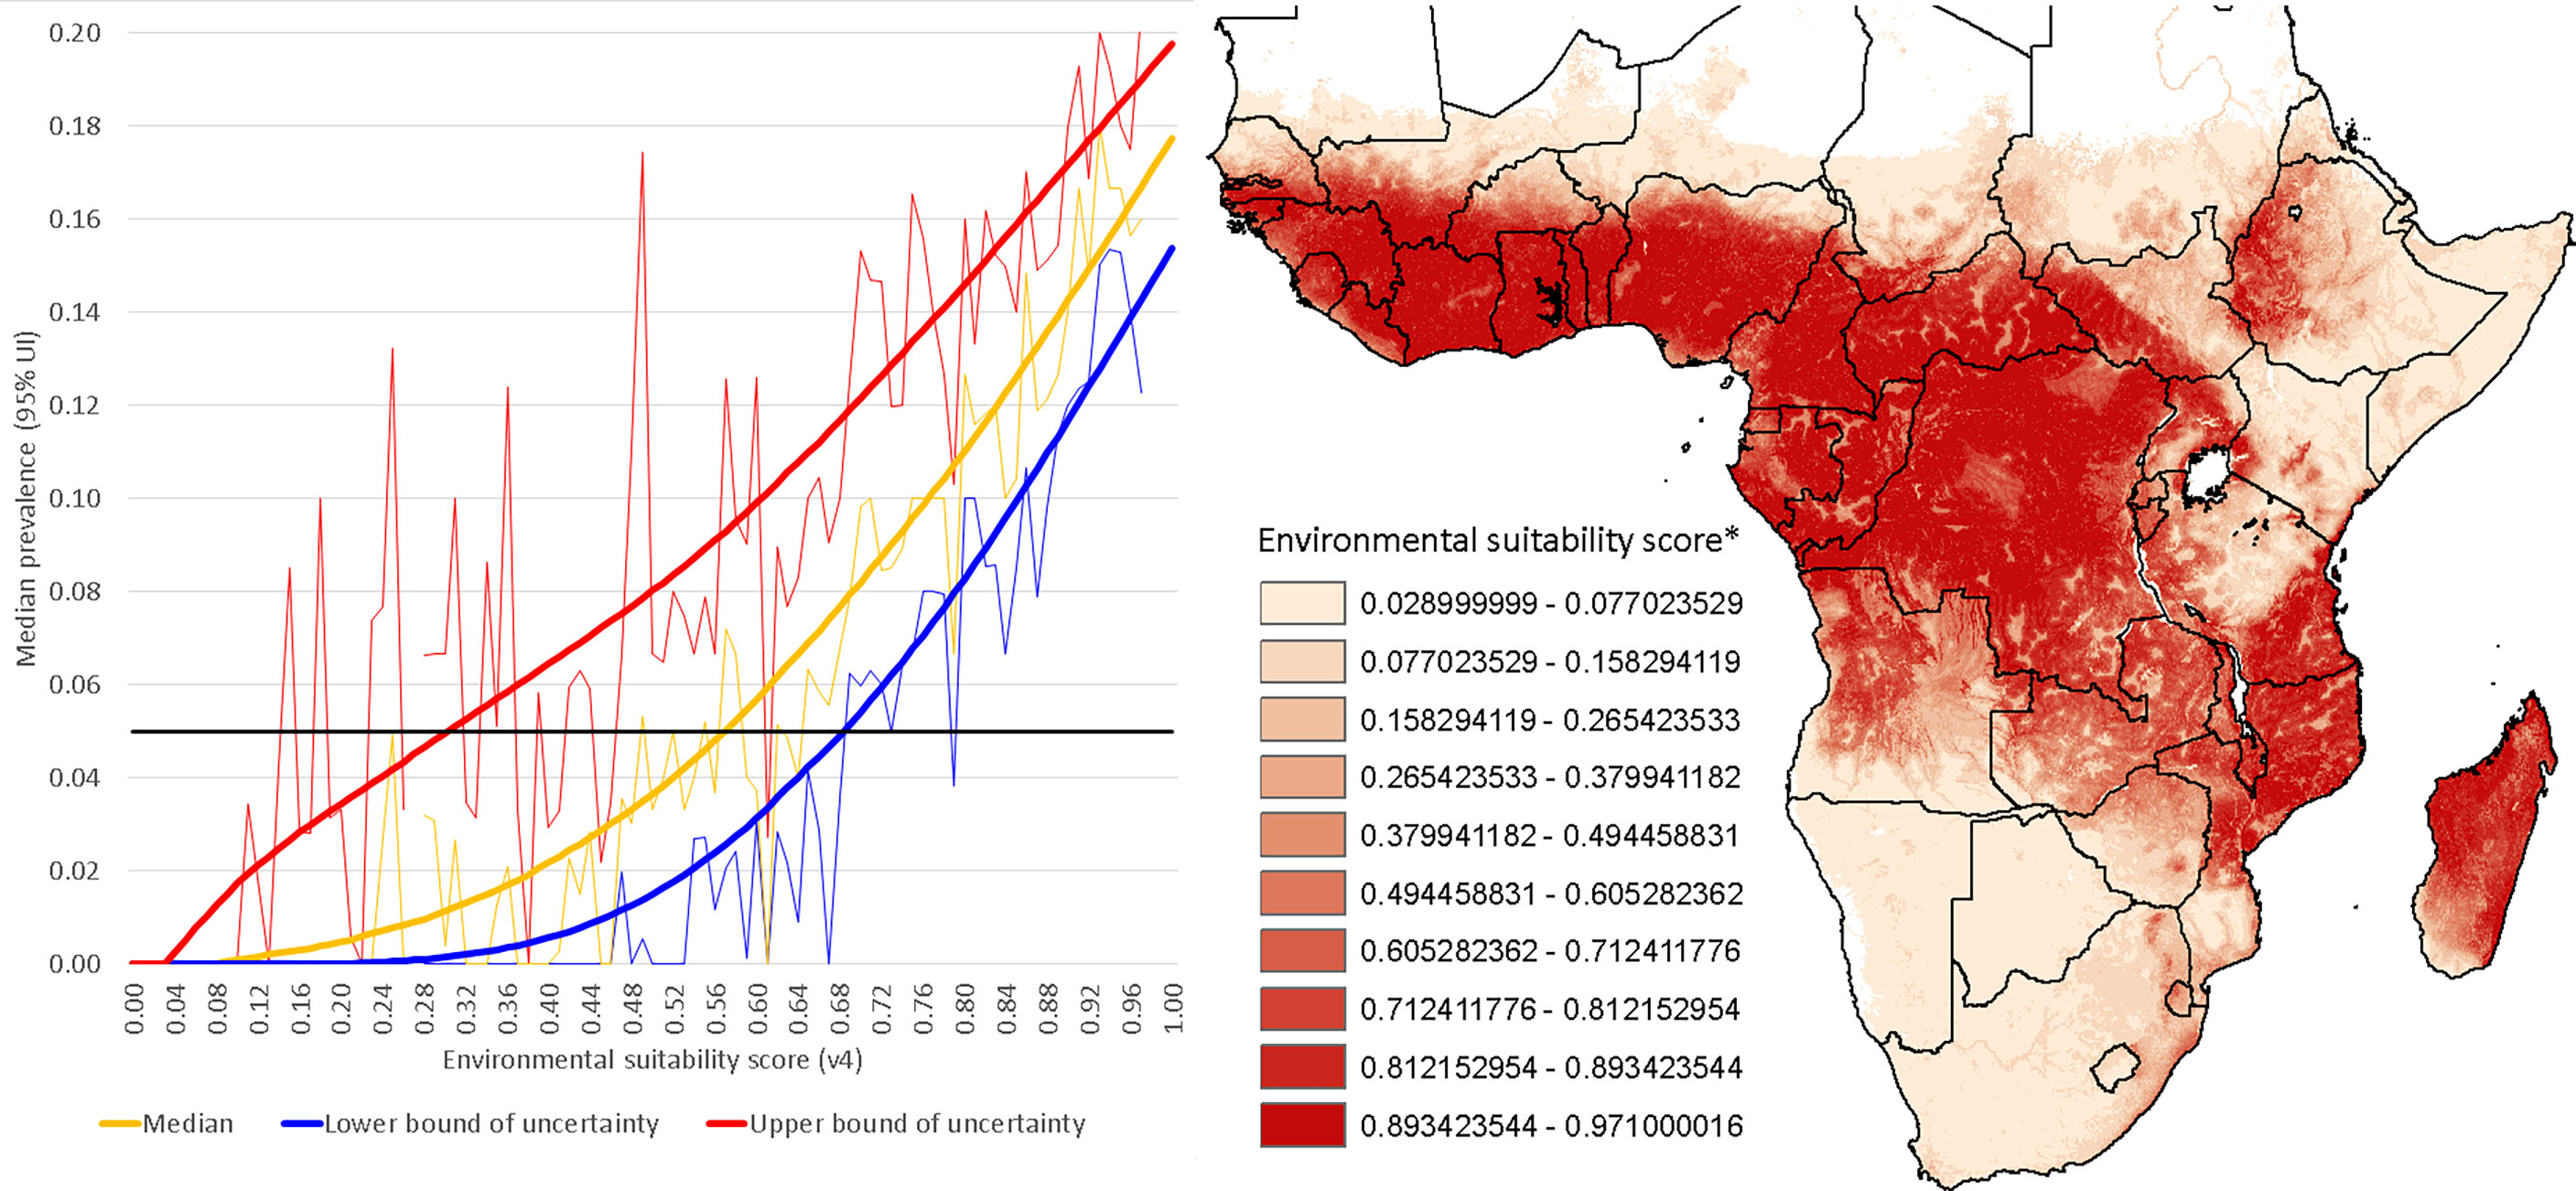
Figure 3 Observed prevalence versus predicted onchocerciasis prevalence based on environmental suitability scoring. The map and legend show the environmental suitability scores in sub-Saharan Africa. Observed prevalence is based on data from the ESPEN portal.
Testing Site Selection
Sample collection locations (villages identified using the ESS) and testing laboratories (28) were incorporated into the model. Some sites within the model included both referring and referral capacity, e.g., where sample collection and testing are performed in the community. Some sites required laboratory testing at the nearest district level hospital (28). These sites were linked for referral of samples for testing per the sourcing policies and transportation policies (described below). Site information included site type (facility or community), services available (sample collection, preparation and testing of dried blood spots [DBS]), capacity for service delivery, and geographic coordinate system (GIS) coordinates.
Diagnostic Tests
Product demand (i.e., the number of tests required) denoted the tests (or processes) required for OEM, and location of demand was split by sample collection, DBS or direct testing of blood in the community, and was expressed by test type, and estimated at each unique location (community or facility). Instrument costs and capacity constraints were included to ensure the results of the model accurately represent the realities of operating the diagnostic testing services within the network. Test performance parameters included in the model are shown in Table 1.
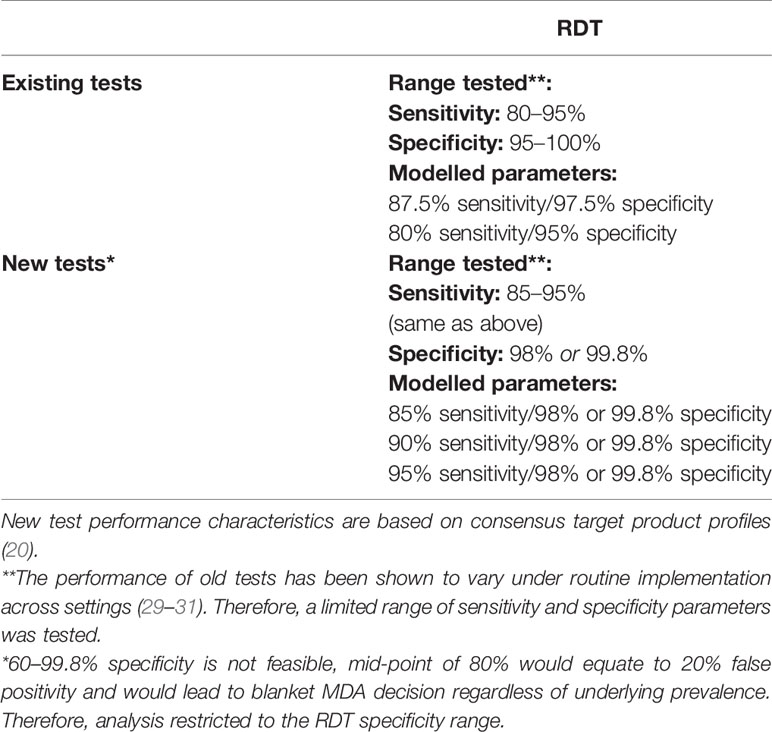
Table 1 Performance parameters of existing and new tests used for OEM.
Sourcing and Transportation Policies
Sourcing policies define the relationships within the network model between referring locations and the referral testing sites that perform the testing. Transportation policies define the actual route and mechanism by which samples travel from testing sites to referring facilities. For estimating distances between primary health care centers and district health facilities, actual distances were used where available (for existing transportation routes). Where actual distances between facilities and testing sites were not available, a distance adjustment factor was computed based on actual compared with straight line distances on the map for known transport lanes in the same district or region. For estimating unknown actual distances, the straight-line distance was multiplied by the average transport adjustment factor. Each transportation mode (e.g., motorbike, car, bus, courier service, human carrier etc.) is represented as a transportation policy. Each sourcing policy requires a corresponding transportation policy.
Diagnostic Network Optimization Modelling
The diagnostic network model was constructed using commercial supply chain management design software, Supply Chain Guru® 8.4 (SCG) (LLamasoft, Inc, Ann Arbor, MI). Data sources used to populate the model are shown in Supplementary File S3. These files were reviewed for completeness, plausibility and internal consistency of inputs, and were confirmed with the country Onchocerciasis program teams, before being merged and formatted into the SCG software’s model database schema. Various scenarios were created to test various state configurations for the network (Table 2). Scenarios 1.1 and 2.1 represent direct testing of the current Ov16 RDT in the community, which has been shown to produce poorer performance compared with testing in the laboratory (14). Scenarios 1.2/1.3 and 2.2/2.3 represent the recommended testing strategy for OEM [community sampling and DBS preparation, followed by DBS referral for RDT testing in a laboratory (14)]. The actual demand scenarios represent the disease prevalence at IUs according to the ESS (Supplementary File S4). The counterfactual demand scenarios 2.1/2.2/2./2.4 (conducted only in the DRC) are based on adapted prevalence estimates to generate prevalence close to the decision thresholds (5% statistical threshold for initiating CDTi, and 2% biological threshold [break point below which transmission cannot be sustained] (14) in some IUs, to account for variability in field observations (Supplementary File S5).
Table 2 Scenarios investigated in the models.
Cost Analysis
Cost analysis was performed on the incremental cost components that varied between scenarios. Thus, we did not consider complete program level costs as it was assumed that these would not vary between scenarios. The following costs were included:
1. The test cost (32)
2. The number of secondary screening rounds required (determined by the test performance parameters and village prevalences) (Table 1)
3. Human resource costs based on the numbers of days that different individuals remain in the field
4. Transport costs to and within the field
5. Field facilitation costs (including fees paid to supporting health facilities)
6. Human resource costs for processing samples.
Unless otherwise specified the costs were compiled in consultation with colleagues in the DRC and Angola and from relevant published literature (Supplementary File S1) and checked against other publications (33, 34). Costs are broken down in detail in Supplementary File S3.
Results
ESS and Route Mapping
The estimates from the best performing machine learning model suggested a high environmental suitability for Onchocerciasis across much of the DRC, with implied onchocerciasis prevalence of >2%. In Angola, the environmental suitability was highly variable, with a wide range of implied onchocerciasis prevalence from 0 to 15% (Figure 4). However, the sites selected for OEM using the ESS in DRC and Angola had high predicted onchocerciasis prevalence >10% (Supplementary Information S4). Based on the sites selected through the ESS, it was possible to predefine the most optimum and cost-effective travel routes for site visits and sample collection depending on the procedures employed by the country onchocerciasis program (Figure 5). Route mapping based on network modelling showed that a maximum of 10 days was required for OEM in each IU.
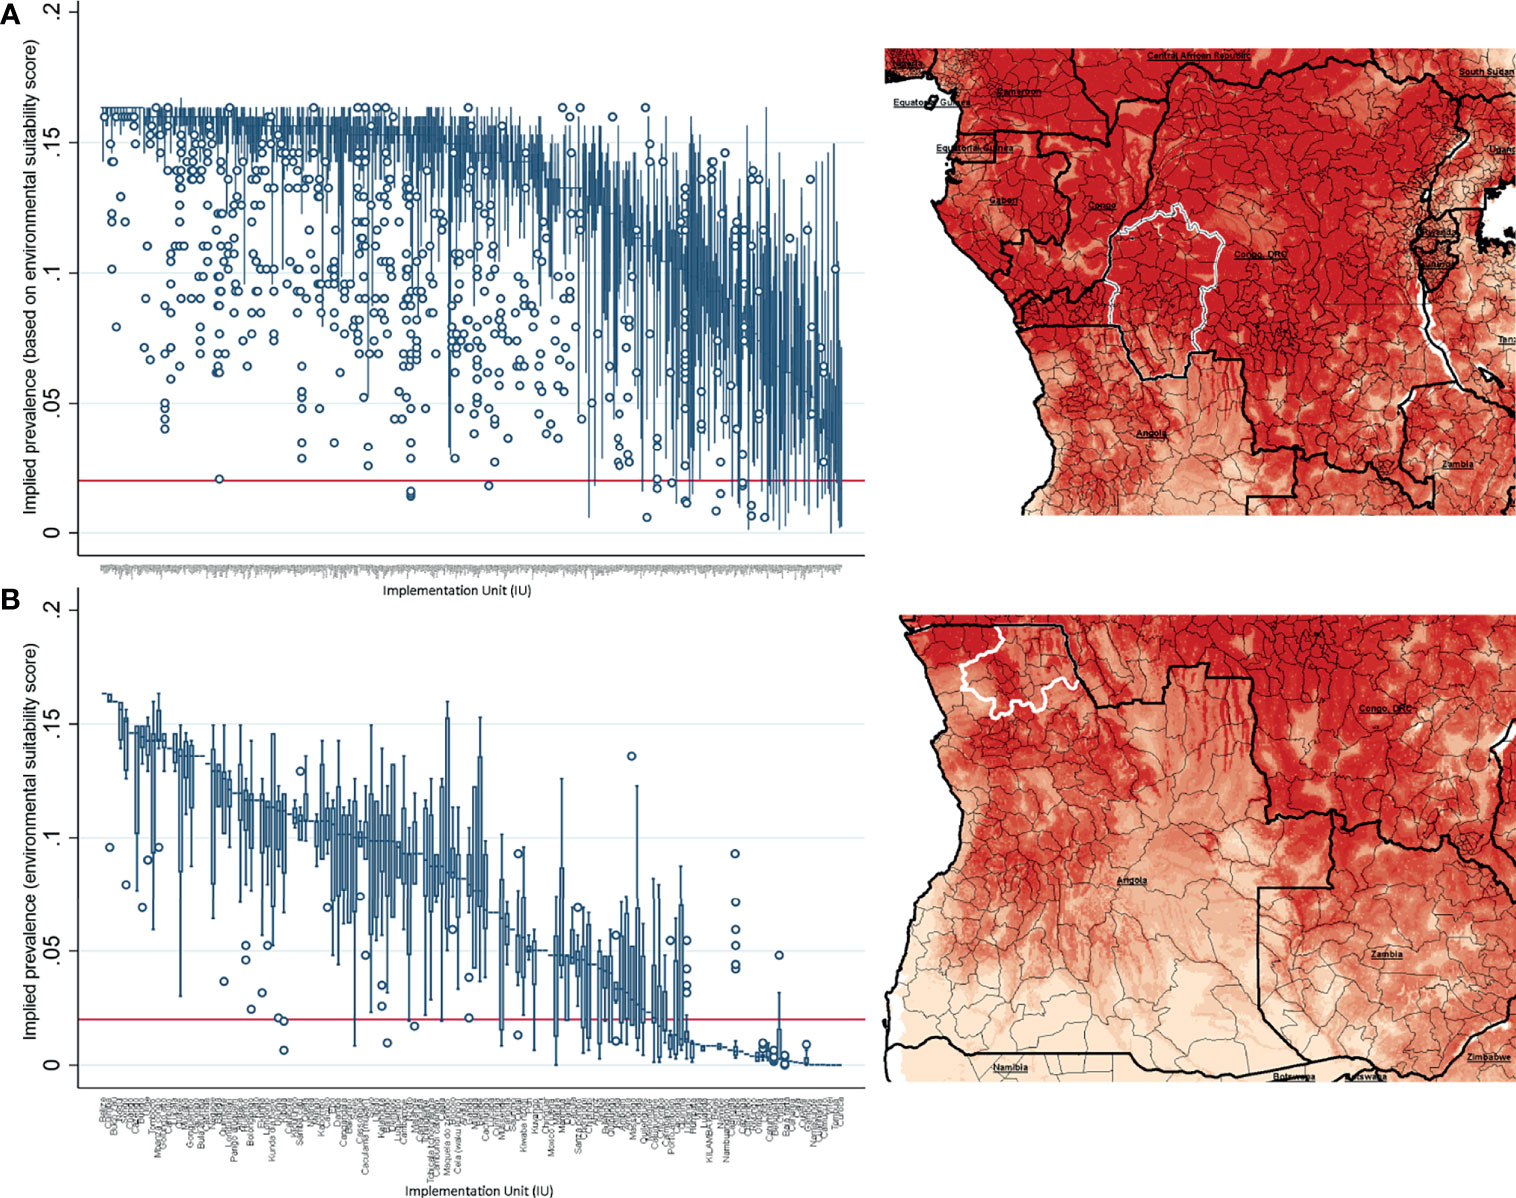
Figure 4 Environmental suitability and predicted onchocerciasis prevalence in (A) the Democratic Republic of Congo and (B) Angola.
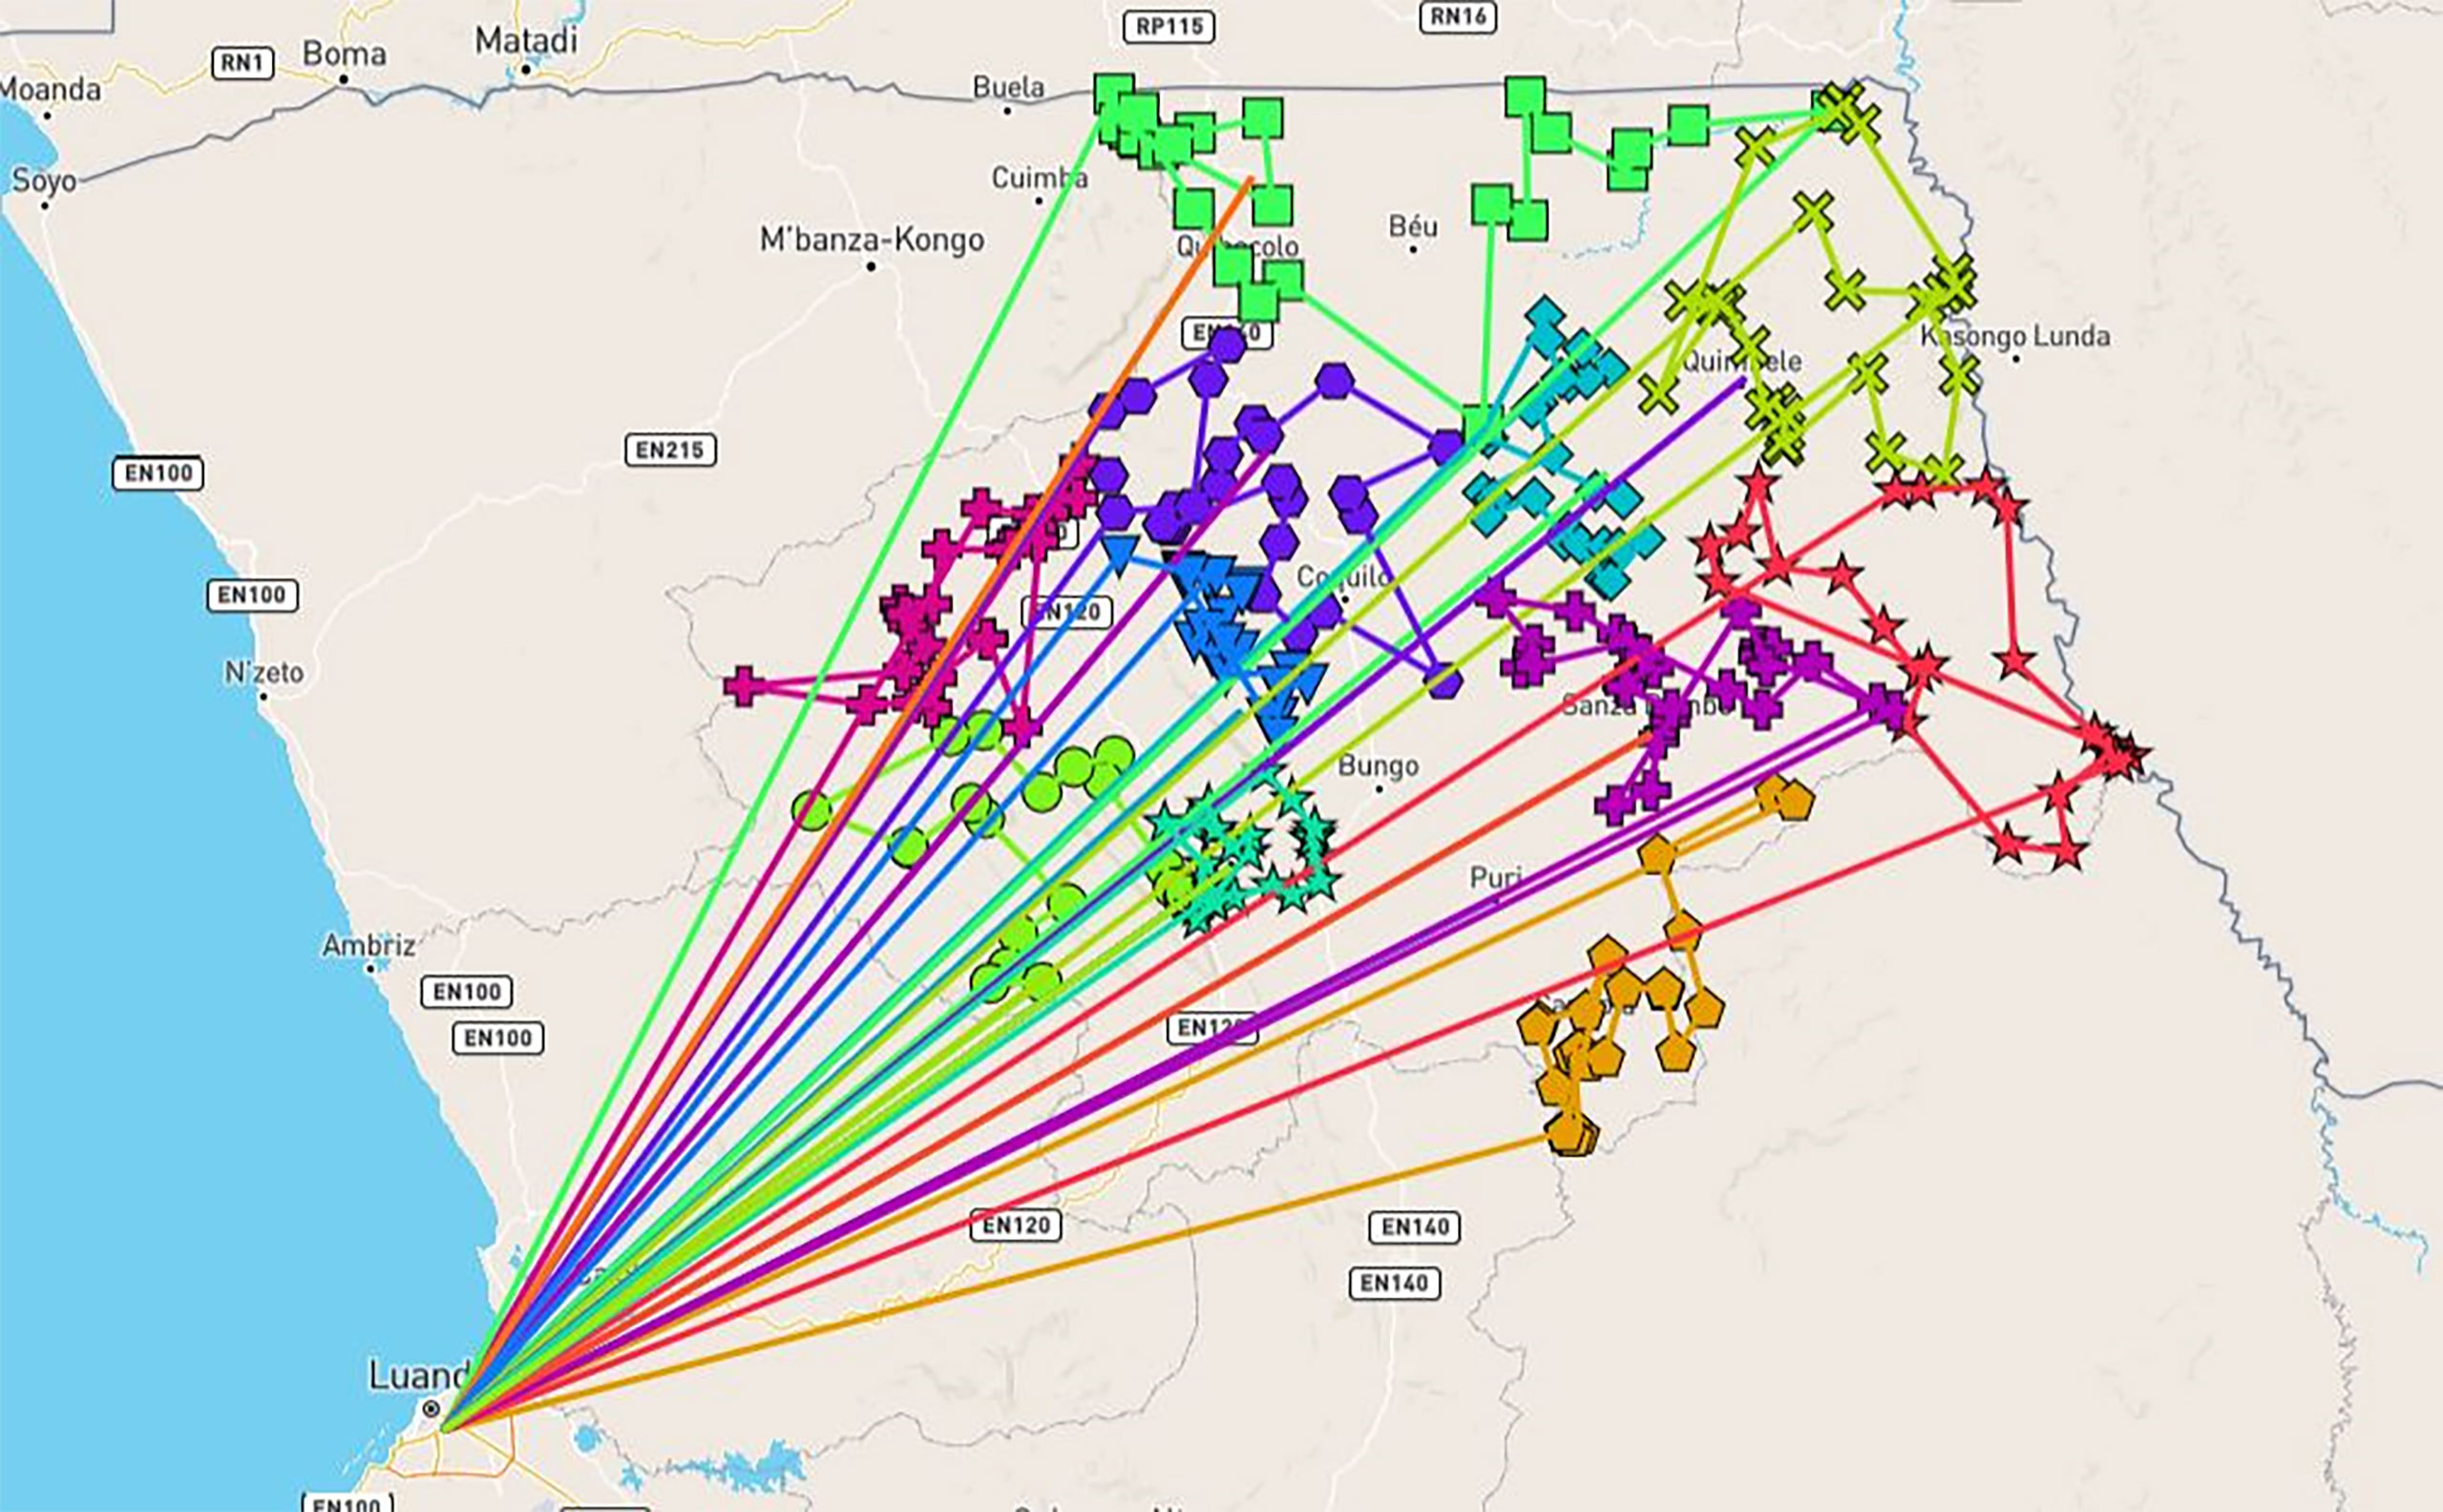
Figure 5 Travel routes based on sites selected using environmental suitability scores in Uige province, Angola. This assumes a return to Luanda after a visit to each IU. The figure is illustrative only, since second stage sampling was not required for any IUs in Uige province based on actual demand.
Actual Scenarios
Scenarios 1.1 and 2.1 were considered in preliminary analysis (old RDT with community testing). However, given inadequate performance of current tests in the community (14), these scenarios were excluded from final analysis and are not presented here. In the actual demand scenarios 1.2 and 1.3, in both Bandundu in DRC and Uige in Angola, both old and new Ov16 RDTs correctly classified all IUs based on the first stage sampling only, as the point prevalence estimates for onchocerciasis, based on ESS, were high (>10%) [Supplementary Information S4].
Counterfactual Scenarios and Sensitivity/Specificity Analysis
In the counterfactual demand scenarios, we modelled the performance of the old and new Ov16 RDTs with the sensitivity and specificity values provided in Table 1.
Assuming test performance of 87.5% sensitivity and 97.5% specificity, the old Ov16 RDT (scenario 2.2) enabled correct identification of 12/13 IUs in Bandundu, with a 92% accuracy (Table 3). Eight IUs were correctly classified at first stage sampling, and five required a second stage sampling, of which four were then correctly classified and one resulted in an incorrect decision to start CDTi. When the sensitivity and specificity were lowered to 80% and 95% respectively, the RDT resulted in a 69% accuracy with the first stage sampling leading to the decision to start CDTi in all 13 IUs (9 correct and 4 incorrect decisions).

Table 3 Impact of test sensitivity and specificity on correct classification of IUs based old RDTs in Bandundu, DRC.
We also evaluated the performance of the new RDTs (scenario 2.3) with improved specificities. A new RDT with 98% specificity enabled correct identification of 12/13 IUs in Bandundu (Table 4), with a 92% accuracy. One start CDTi decision is missed at first stage sampling and one overall decision is incorrect (irrespective of test sensitivity). All no CDTi decisions required a second stage sampling, with the correct decisions made. On the other hand, assuming a new RDT with 99.8% specificity enabled the correct identification of all IUs (100% accuracy). All start CDTi decisions can be made at first stage sampling, and all no CDTi decisions require a second stage sampling.
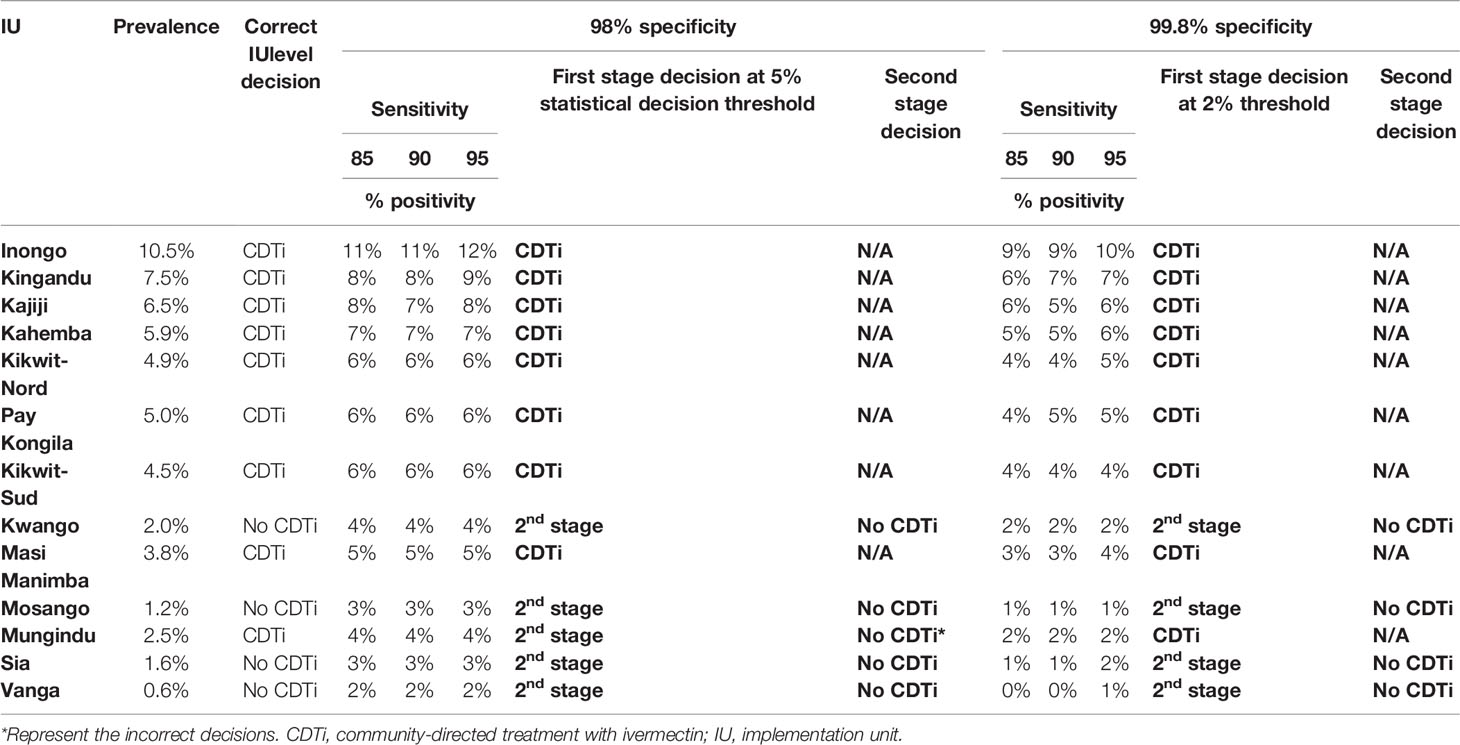
Table 4 Impact of test specificity on correct classification of IUs based new RDTs in Bandundu, DRC.
We further tested the decision-making process based on RDTs (both old and new) with different sensitivities and specificities, tested in the laboratory or community (Table 5). In scenario 2.2 in which samples are tested in a laboratory facility, the old RDT with 80% sensitivity and 95% specificity resulted in all 13 IUs being classified as requiring CDTi based on first stage sampling. However only 9 IUs truly required CDTi. The incorrect classification of 4 IUs as requiring CDTi resulted in costs above USD $1M to the program. In scenarios 2.3 and 2.4, where the sensitivity of a new RDT was between 85% and 95% with a specificity of 98% (with testing performed either in the community or laboratory), 8 IUs were correctly classified as requiring CDTi based on first stage sampling. The remaining 5 IUs required second stage sampling, out of which 4 IUs were correctly classified as not requiring CDTi (92% accuracy, irrespective of test sensitivity). When the specificity of the new RDT is increased to 99.8%, all 13 IUs were correctly classified. However, 4 IUs required second stage sampling. All CDTi decisions can be made during first line sampling, and all no CDTi decisions required second stage sampling. Nonetheless, very high specificity (e.g., 99.8%) when coupled with imperfect sensitivity, can result in many false negative results (missing decisions to start MDA) at the 5% statistical decision threshold. This effect can be negated by reducing the statistical decision threshold to 2%.
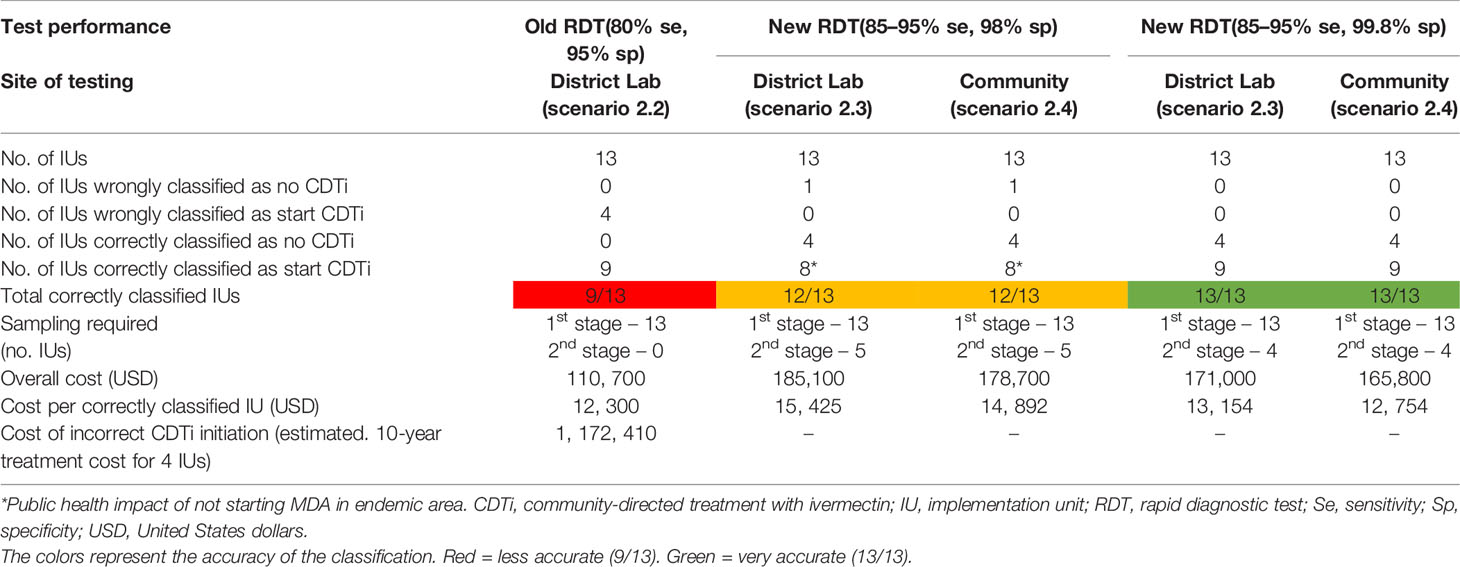
Table 5 Impact of test performance on correct classification of IUs based on laboratory or community testing in Bandundu, DRC (in counterfactual scenario).
Cost Drivers
The number of tests performed, and the time spent in the field by the survey team in terms of transportation and human resource were the key cost drivers. In DRC, the tests, transportation, laboratory and human resource costs represented 19.2%, 31.2%, 16.3% and 43.9% of the total costs, respectively (Figure 6). In Angola, the corresponding values were 14.9%, 25.7%, 5.0% and 64.5%. Variation in overall cost across countries was minimal.
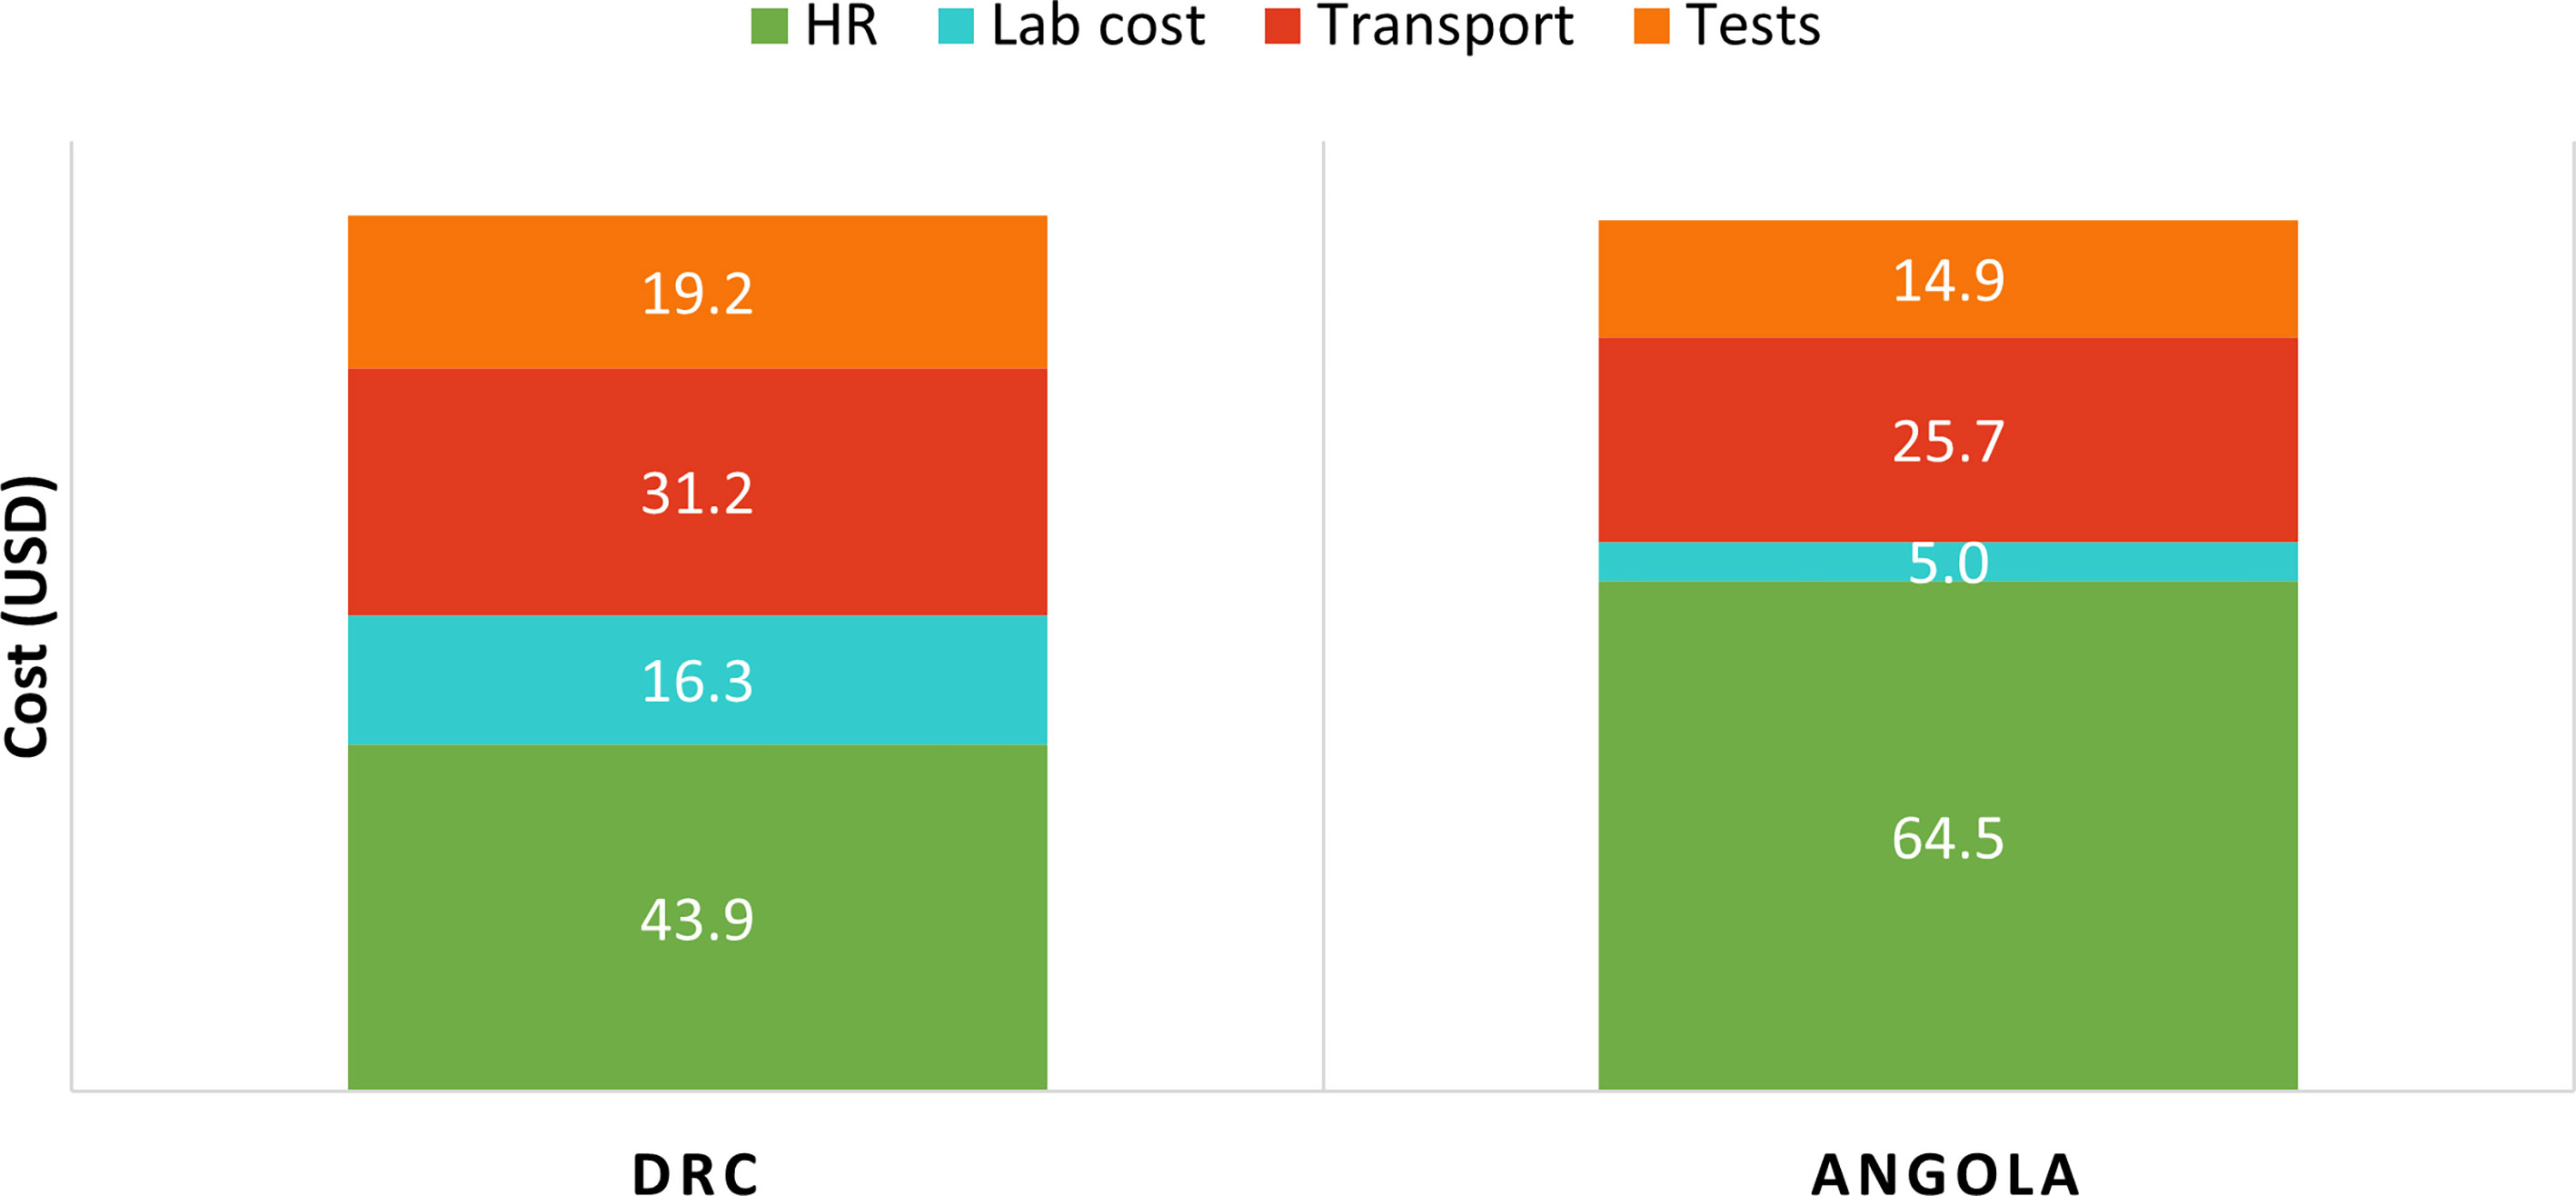
Figure 6 Cost breakdown for first stage sampling in DRC and Angola. HR, Human resource.
Second stage sampling (undertaken only in the counterfactual scenarios in DRC) represented over 50% of costs. The implementation costs of new RDTs were moderately higher than that of the old RDT. Figure 7 represents the estimated cost breakdown for a new RDT with 99.8% specificity, with testing performed in the laboratory. Costs of testing the new RDTs in the community were slightly lower than testing at a laboratory facility (Table 5).
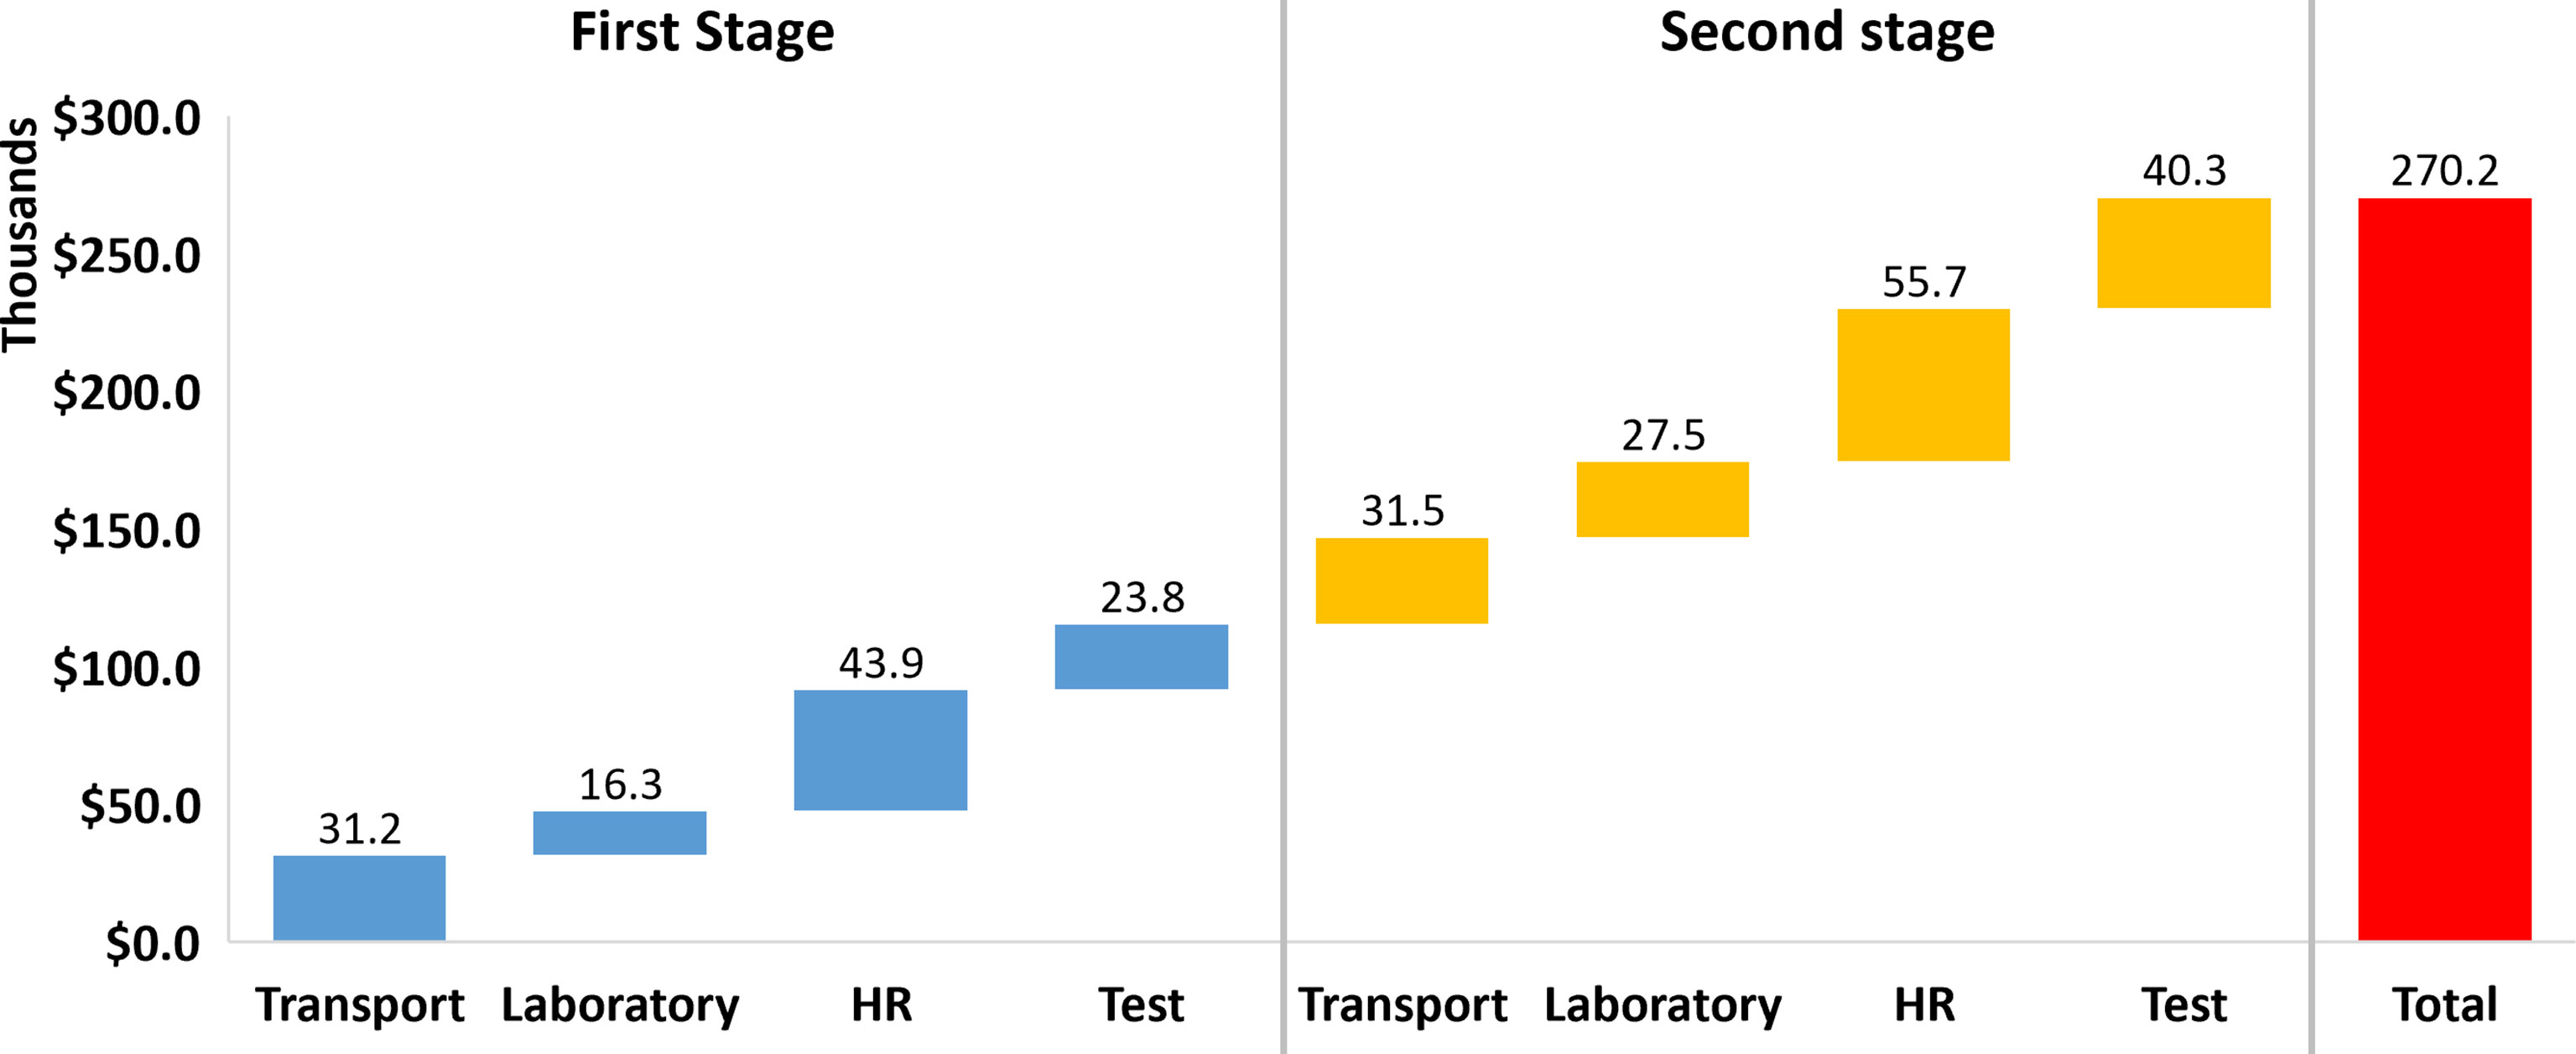
Figure 7 Cost breakdown for a new RDT with 99.8% specificity, with testing performed in the laboratory. In this scenario, second stage sampling is required in 4 IUs. The laboratory costs represent the additional personnel costs for running the samples, as well as support costs to the facility. HR, Human resource.
Discussion
This study aimed to evaluate the optimal use of the old Ov16 RDT for OEM. It also aimed to assess the impacts of improved diagnostic tools as recommended in target product profiles for the development of new tools for onchocerciasis (20). The results show that investment in new tests and design of context-specific implementation models are important to reduce costs and improve effectiveness of OEM, reducing both cost of testing and cost of unnecessary CDTi. Our evaluations also demonstrated that new RDTs will have greatest impact in areas with varying prevalence below and above 2%. However, these tests will be less useful in areas where the prevalence is uniformly above 5%. Where new tests with high specificity and imperfect sensitivity require lowering the statistical decision threshold to 2%, a reassessment of the statistical and biological threshold cut-offs recommended by the WHO onchocerciasis technical advisory subgroup (OTS) (14) will be warranted.
Environmental suitability and geospatial modelling scores predicting areas with the likelihood of onchocerciasis prevalence have been useful in defining areas requiring testing, and in selection of villages for first stage and second stage sampling as recommended by WHO (14). Model based predictions of onchocerciasis prevalence based on environmental predictors have been shown to be comparable with epidemiological mapping efforts to identify areas of transmission (35), and may be extended to areas with little or no available data. In Angola, the ESS was observed to be highly variable, with implied onchocerciasis prevalence ranging from 0 to 15%. On the other hand, in DRC the ESS was high, with implied prevalence >2%. These estimates of demand in DRC and Angola were shown to be representative of actual prevalence data, allowing generalizability of results. It could be argued that actual field evaluations may be required to ascertain the range of prevalence observed, especially given the reduction in the country following years of treatment. However, the ESS approach enables a desk assessment without the need for costly field visits. The use of ESS also allows for alternate sampling strategies such as truncated sampling (Supplementary File S1), once the initial field data or statistical decision thresholds from the first and second stage sampling indicate the need to start CDTi. Further exploration of these strategies is warranted.
The actual demand scenario enabled the correct classification of IUs based on the old Ov16 RDT. In both Bandundu in DRC and Uige in Angola, the old Ov16 RDT correctly classified all 13 and 11 IUs, respectively, based on the first stage villages. However, this was likely due to the uniformly high prevalence in these IUs (point prevalence estimates >10%). Thus, no difference in decisions were observed across low, medium and high-performance parameters for the old RDT. Nonetheless, the performance of old tests has been shown to vary under routine implementation across settings (29–31). Based on the results presented in Table 5, the old RDT with lower test performance may result in lower field costs by neglecting the need for second stage sampling. However, this is offset by the high operational cost to the program as a result of the incorrect treatment of villages for several years. On the other hand, new RDTs with very high specificities will result in correct decisions in all IUs, albeit with slightly higher testing costs resulting from the need for second stage sampling in some IUs. Improved specificity reduces the probability of incorrect decision and subsequent errors in treatment. These results show that varying and inconsistent RDT sensitivity and specificity within expected bounds could have a substantial impact on treatment decisions. Test performance therefore becomes an important differentiator for correct treatment decision with prevalence close to the statistical decision threshold.
The current TPPs for onchocerciasis RDTs for mapping require sensitivities > 60% and very high specificities above 99.8% (20). Our results show that improved specificity reduces the probability of incorrect treatment decisions. Also, tests with improved performance will add most value in areas with variable disease prevalence in select IUs that are near the statistical decision thresholds. However, very high specificity (e.g., 99.8%) when coupled with imperfect sensitivity, can result in many false negative results (missed decisions to start CDTi) at the 5% statistical decision threshold. New tests must therefore have acceptable suitability for use in OEM programs.
The number of tests performed, and the number of days spent in the field in terms of the transportation and personnel costs were the major key cost drivers of all testing strategies evaluated. As such, direct testing in the community was slightly cheaper than testing at laboratory facilities, presumably due to the additional cost of collecting dried blood spots and personnel cost at the testing facilities. However, it should be noted that evaluations of the old Ov16 RDT have shown improved performance when tested in the laboratory setting compared with use in the field (14).
From our findings, the best performing testing strategies with new RDTs are more expensive than testing with existing tests with poorer performance, due to the need for second stage sampling. In terms of cost effectiveness of existing or new RDTs, the need for second stage sampling drove overall OEM testing costs. The savings on second stage sampling are due to reduced time and personnel cost being spent in the field, lower travel costs with fewer villages to visit and lower testing costs as fewer people are tested. However, second stage sampling costs are significantly outweighed by cost savings of avoiding incorrect start CDTi decisions. Assuming US$0.5 as the CDTi cost per person (36–38), an overall cost saving of approximately US$117,000 per annum can be made for 4 IUs with incorrect CDTi decisions. This amounts to over US$1.17 million during a 10-year treatment period. Further, the public health impacts will be low to negligible, despite the possibility of treating some individuals who may be infected in those IUs.
Data Limitations
As both DRC and Angola are yet to undertake any OEM activities using the old Ov16 RDT, assumptions were made on the number of personnel, approximate travel distance, vehicle hire and cost, and testing costs, based on information on previous activities focusing on surveillance and mapping using skin-snip microscopy and nodule palpation provided by the onchocerciasis programs. Assumptions were also made based on WHO recommendations for OEM. Due to the selection of the sites using the ESS and the remoteness of onchocerciasis endemic villages, poor road networks and community scattering may also affect the accessibility and number of villages reached per day, thus impacting the time spent by the teams in the field. As such, while the average cost is presented per IU, the actual cost estimations may vary during field implementation. Nonetheless, there is no reason to assume that the costs reported for the IUs included in this study are not representative.
The 5% statistical decision threshold used in this study is a provisional recommendation of the WHO OTS (14). This was based on the trade-off between sample sizes, test specificity and the likelihood of identifying high numbers of false positives and wrongly classifying IUs as requiring MDA. The OTS acknowledges the need for this threshold to be validated or adjusted. As such, the accuracy of classification of IUs based on new Ov16 RDTs may differ depending on their confirmed specificity in the field, and the final approved thresholds for initiating MDA.
Conclusion
In conclusion, the use of DNO for onchocerciasis has shown that country data can be better harnessed to inform investment in field implementation strategies, new tests and design of context-specific implementation models, to reduce costs and improve effectiveness of OEM, as well as avoid the cost of unnecessary CDTi treatment. Further, new tests as recommended by the TPPs will have greatest impact in areas with varying prevalence below or above 2%, but with less value where prevalence is above 5%. Finally, network optimization models could be useful for evaluating alternate sampling strategies to bring opportunities for cost savings. Further, these models could be used to explore the development and optimization of new tools for other NTDs such as lymphatic filariasis and visceral leishmaniasis.
Data Availability Statement
The original contributions presented in the study are included in the article/Supplementary Material. Further inquiries can be directed to the corresponding author.
Author Contributions
HA, DS, and JN conceived the study. SK, DM, NU, and MC provided the data. BS, PB, SR, KG, RP, and HA analysed the data. DS wrote the first draft. HA, BS, PB, DS, SR, KG, SK, JN, RP, DM, MC, and NU reviewed the paper and approved its publication. All authors contributed to the article and approved the submitted version.
Funding
Funding for this study was provided by the Bill & Melinda Gates Foundation grant no. INV-018179.
Conflict of Interest
Authors SR and KG are employed by Coupa Software Inc, USA.
The remaining authors declare that the research was conducted in the absence of any commercial or financial relationships that could be construed as a potential conflict of interest.
Publisher’s Note
All claims expressed in this article are solely those of the authors and do not necessarily represent those of their affiliated organizations, or those of the publisher, the editors and the reviewers. Any product that may be evaluated in this article, or claim that may be made by its manufacturer, is not guaranteed or endorsed by the publisher.
Acknowledgments
We are grateful to the onchocerciasis program in DRC and Angola for their support towards this study. We are grateful to the Dr. Maria Rebollo Polo, Dr. Didier Bakajika and Dr. Jorge Cano, at ESPEN/WHO AFRO, for the support provided towards this study. Christy Hanson, Chris Hanna, Molly Mort and Jordan Tappero at the Bill & Melinda Gates Foundation, and Katie Gass at the Taskforce for Global Health provided technical inputs into conceptualization, review and feedback. Editorial assistance was provided by Rachel Wright, PhD, funded by FIND, according to Good Publication Practice guidelines.
Supplementary Material
The Supplementary Material for this article can be found online at: https://www.frontiersin.org/articles/10.3389/fitd.2021.707752/full#supplementary-material
Supplementary File S1 | Data requirements for network optimization modelling.
Supplementary File S2 | Environmental suitability model selection.
Supplementary File S3 | Cost and parameter inputs used for costing analysis.
Supplementary File S4 | Observed prevalence versus predicted onchocerciasis prevalence based on environmental suitability scoring (actual demand scenarios).
Supplementary File S5 | Observed prevalence versus predicted onchocerciasis prevalence based on environmental suitability scoring (counterfactual demand scenarios).
References
1. World Health Organization. Onchocerciasis (2019). Available at: https://www.who.int/news-room/fact-sheets/detail/onchocerciasis.
2. Sauerbrey M. The Onchocerciasis Elimination Program for the Americas (OEPA). Ann Trop Med Parasitol (2008) 102 Suppl:25–9. doi: 10.1179/136485908X337454
3. WHO. Progress Towards Eliminating Onchocerciasis in the WHO Region of the Americas: Verification by WHO of Elimination of Transmission in Colombia. Relev Epidemiol Hebd (2013) 88(36):381–5.
4. WHO. Elimination of Onchocerciasis in the WHO Region of the Americas: Ecuador’s Progress Towards Verification of Elimination. Wkly Epidemiol Rec (2014) 89(37):401–5.
5. Traore MO, Sarr MD, Badji A, Bissan Y, Diawara L, Doumbia K, et al. Proof-Of-Principle of Onchocerciasis Elimination With Ivermectin Treatment in Endemic Foci in Africa: Final Results of a Study in Mali and Senegal. PloS Negl Trop Dis (2012) 6(9):e1825. doi: 10.1371/journal.pntd.0001825
6. Katabarwa MN, Walsh F, Habomugisha P, Lakwo TL, Agunyo S, Oguttu DW, et al. Transmission of Onchocerciasis in Wadelai Focus of Northwestern Uganda has Been Interrupted and the Disease Eliminated. J Parasitol Res (2012) 2012:748540. doi: 10.1155/2012/748540
7. Zarroug IMA, Hashim K, ElMubark WA, Shumo ZAI, Salih KAM, ElNojomi NAA, et al. The First Confirmed Elimination of an Onchocerciasis Focus in Africa: Abu Hamed, Sudan. Am J Trop Med Hyg (2016) 95(5):1037–40. doi: 10.4269/ajtmh.16-0274
8. WHO. Accelerating Work to Overcome the Global Impact of Neglected Tropical Diseases - a Roadmap for Implementation. Geneva, Switzerland: World Health Organization (2012).
9. Rebollo MP, Zoure H, Ogoussan K, Sodahlon Y, Ottesen EA, Cantey PT. Onchocerciasis: Shifting the Target From Control to Elimination Requires a New First-Step-Elimination Mapping. Int Health (2018) 10(suppl_1):i14–9. doi: 10.1093/inthealth/ihx052
10. Thiele EA, Cama VA, Lakwo T, Mekasha S, Abanyie F, Sleshi M, et al. Detection of Onchocerca Volvulus in Skin Snips by Microscopy and Real-Time Polymerase Chain Reaction: Implications for Monitoring and Evaluation Activities. Am J Trop Med Hyg (2016) 94(4):906–11. doi: 10.4269/ajtmh.15-0695
11. Gass KM. Rethinking the Serological Threshold for Onchocerciasis Elimination. PloS Negl Trop Dis (2018) 12(3):e0006249–e0006249. doi: 10.1371/journal.pntd.0006249
12. Golden A, Stevens EJ, Yokobe L, Faulx D, Kalnoky M, Peck R, et al. A Recombinant Positive Control for Serology Diagnostic Tests Supporting Elimination of Onchocerca Volvulus. PloS Negl Trop Dis (2016) 10(1):e0004292. doi: 10.1371/journal.pntd.0004292
13. Golden A, Steel C, Yokobe L, Jackson E, Barney R, Kubofcik J, et al. Extended Result Reading Window in Lateral Flow Tests Detecting Exposure to Onchocerca Volvulus: A New Technology to Improve Epidemiological Surveillance Tools. PloS One (2013) 8(7):e69231. doi: 10.1371/journal.pone.0069231
14. World Health Organization. Report of the Third Meeting of the WHO Onchocerciasis Technical Advisory Subgroup: Geneva, 26-28 February 2019. Geneva, Switzerland: World Health Organization (2020). Available at: https://apps.who.int/iris/handle/10665/332257.
15. Vlaminck J, Fischer PU, Weil GJ. Diagnostic Tools for Onchocerciasis Elimination Programs. Trends Parasitol (2015) 31(11):571–82. doi: 10.1016/j.pt.2015.06.007
16. Noma M, Nwoke BEB, Nutall I, Tambala PA, Enyong P, Namsenmo A, et al. Rapid Epidemiological Mapping of Onchocerciasis (REMO): Its Application by the African Programme for Onchocerciasis Control (APOC). Ann Trop Med Parasitol (2002) 96(Suppl 1):29–39. doi: 10.1179/000349802125000637
17. Garcia D, You F. Supply Chain Design and Optimization: Challenges and Opportunities. Comput Chem Eng (2015) 81:153–70. doi: 10.1016/j.compchemeng.2015.03.015
18. Albert H, Purcell R, Wang YY, Kao K, Mareka M, Katz Z, et al. Designing an Optimized Diagnostic Network to Improve Access to TB Diagnosis and Treatment in Lesotho. PloS One (2020) 15(6):e0233620–e0233620. doi: 10.1371/journal.pone.0233620
19. Glencross DK, Coetzee LM, Cassim N. An Integrated Tiered Service Delivery Model (ITSDM) Based on Local CD4 Testing Demands can Improve Turn-Around Times and Save Costs Whilst Ensuring Accessible and Scalable CD4 Services Across a National Programme. PloS One (2014) 9(12):e114727–e114727. doi: 10.1371/journal.pone.0114727
20. World Health Organization. Public Consultation: Target Product Profiles for Diagnostic Tests to Meet Onchocerciasis Elimination Programme Needs. (2020). Available at: https://www.who.int/news-room/articles-detail/public-consultation-target-product-profiles-diagnostic-tests-meet-onchocerciasis-programme-needs [Accessed February 17, 2021].
21. Expanded Special Network for Elimination of Neglected Tropical Diseases, World Health Organization Regional Office for Africa. Tools and resources. (2020). Available at: https://espen.afro.who.int/tools-resources/download-data [Accessed February 17, 2021].
22. Zhang C, Ma Y. Ensemble Machine Learning: Methods and Applications. New York: Springer Science & Business Media (2012).
23. Thuiller W, Lafourcade B, Engler R, Araújo M. BIOMOD - a Platform for Ensemble Forecasting of Species Distributions. Ecography (Cop) (2009) 32:369–73. doi: 10.1111/j.1600-0587.2008.05742.x
24. Eneanya OA, Cano J, Dorigatti I, Anagbogu I, Okoronkwo C, Garske T, et al. Environmental Suitability for Lymphatic Filariasis in Nigeria. Parasit Vectors (2018) 11(1):513. doi: 10.1186/s13071-018-3097-9
25. Cano J. Environmental Suitability Modelling to Help Guide Country Programme’s Decision on the Implementation of Onchocerciasis Elimination Mapping. Unpublished. (2021).
26. Allouche O, Tsoar A, Kadmon R. Assessing the Accuracy of Species Distribution Models: Prevalence, Kappa and the True Skill Statistic (TSS). J Appl Ecol (2006) 43(6):1223–32. doi: 10.1111/j.1365-2664.2006.01214.x
27. Thuiller W, Georges D, Engler R. Biomod2: ensemble platform for species distribution modeling. R package version 3.0. 3. (2013). https://cran.r-project.org/web/packages/biomod2 [Accessed September 8, 2021].
28. Maina J, Ouma PO, Macharia PM, Alegana VA, Mitto B, Fall IS, et al. A Spatial Database of Health Facilities Managed by the Public Health Sector in Sub Saharan Africa. Sci Data (2019) 6(1):134. doi: 10.1038/s41597-019-0142-2
29. World Health Organization. Report of the 1st Meeting of the WHO Onchocerciasis Technical Advisory Subgroup. 10-12 October 2017. Geneva, Switzerland: World Health Organization (2017).
30. Lipner EM, Dembele N, Souleymane S, Alley WS, Prevots DR, Toe L, et al. Field Applicability of a Rapid-Format Anti-Ov-16 Antibody Test for the Assessment of Onchocerciasis Control Measures in Regions of Endemicity. J Infect Dis (2006) 194(2):216–21. doi: 10.1086/505081
31. Paulin HN, Nshala A, Kalinga A, Mwingira U, Wiegand R, Cama V, et al. Evaluation of Onchocerciasis Transmission in Tanzania: Preliminary Rapid Field Results in the Tukuyu Focus, 2015. Am J Trop Med Hyg (2017) 97(3):673–6. doi: 10.4269/ajtmh.16-0988
32. NTD Support Centre. Procurement Guide – Ov16 RDT. V1.0 (2019). Available at: https://www.ntdsupport.org/sites/default/files/uploads/docs/resources/Ov16 RDT Procurement guide_0.pdf.
33. Kim YE, Sicuri E, Tediosi F. Financial and Economic Costs of the Elimination and Eradication of Onchocerciasis (River Blindness) in Africa. PloS Negl Trop Dis (2015) 9(9):e0004056. doi: 10.1371/journal.pntd.0004056
34. Dieye Y, Storey HL, Barrett KL, Gerth-Guyette E, Di Giorgio L, Golden A, et al. Feasibility of Utilizing the SD BIOLINE Onchocerciasis IgG4 Rapid Test in Onchocerciasis Surveillance in Senegal. PloS Negl Trop Dis (2017) 11(10):e0005884. doi: 10.1371/journal.pntd.0005884
35. O’Hanlon SJ, Slater HC, Cheke RA, Boatin BA, Coffeng LE, Pion SDS, et al. Model-Based Geostatistical Mapping of the Prevalence of Onchocerca Volvulus in West Africa. PloS Negl Trop Dis (2016) 10(1):e0004328. doi: 10.1371/journal.pntd.0004328
36. Turner HC, Walker M, Pion SDS, McFarland DA, Bundy DAP, Basáñez M-G. Economic Evaluations of Onchocerciasis Interventions: A Systematic Review and Research Needs. Trop Med Int Heal (2019) 24(7):788–816. doi: 10.1111/tmi.13241
37. Turner HC, Osei-Atweneboana MY, Walker M, Tettevi EJ, Churcher TS, Asiedu O, et al. The Cost of Annual Versus Biannual Community-Directed Treatment of Onchocerciasis With Ivermectin: Ghana as a Case Study. PloS Negl Trop Dis (2013) 7:e2452. doi: 10.1371/journal.pntd.0002452
Keywords: diagnostic network optimization, onchocerciasis, Ov16 RDT, onchocerciasis elimination mapping, river blindness
Citation: Albert H, Sartorius B, Bessell PR, de Souza DK, Rupani S, Gonzalez K, Kayembe S, Ndung’u J, Pullan R, Makana DP, de Almeida MCC and Uvon NA (2021) Developing Strategies for Onchocerciasis Elimination Mapping and Surveillance Through The Diagnostic Network Optimization Approach. Front. Trop. Dis 2:707752. doi: 10.3389/fitd.2021.707752
Received: 10 May 2021; Accepted: 31 August 2021;
Published: 30 September 2021.
Edited by:
Martin Walker, Royal Veterinary College (RVC), United KingdomReviewed by:
Jonathan Hamley, Imperial College London, United KingdomKenneth Pfarr, University Hospital Bonn, Germany
Copyright © 2021 Albert, Sartorius, Bessell, de Souza, Rupani, Gonzalez, Kayembe, Ndung’u, Pullan, Makana, de Almeida and Uvon. This is an open-access article distributed under the terms of the Creative Commons Attribution License (CC BY). The use, distribution or reproduction in other forums is permitted, provided the original author(s) and the copyright owner(s) are credited and that the original publication in this journal is cited, in accordance with accepted academic practice. No use, distribution or reproduction is permitted which does not comply with these terms.
*Correspondence: Heidi Albert, heidi.albert@finddx.org
†These authors share last authorship