 Efiba Vidda Senkyire Kwarteng1*
 Frank Badu Osei2
 Samuel Ato Andam-Akorful1
 Alexander Kwarteng3
 Da-Costa Boakye Mensah Asare1
 Jonathan Arthur Quaye-Ballard1Alfred Allan Duker1
- 1Department of Geomatic Engineering, Kwame Nkrumah University of Science and Technology, Kumasi, Ghana
- 2Department of Earth Observation Science, University of Twenty, Enschede, Netherlands
- 3Department of Biochemistry and Biotechnology, Kwame Nkrumah University of Science and Technology, Kumasi, Ghana
Lymphatic filariasis (LF) is a public health menace, especially in developing countries. A periodic review of mass drug administration (MDA) performance is critical to monitoring elimination progress. However, investigating the spatial pattern of LF with respect to MDA intervention is yet to be documented. This is essential to appreciating the transmission dynamics across LF-endemic communities and how it is spatially impacted by MDA programs. The aim of this study was to map and explore the spatial variation and hotspots of LF infection among endemic communities and evaluate the impact of the MDA intervention program on its spatial pattern in Ghana. Relative risks, clustering and clusters, prevalence odds ratios, and their confidence intervals were studied with community-level LF data prior to intervention and post intervention periods. The overall risk of LF infection was 0.12% and 0.02% before and after MDA, respectively, suggesting reduced transmission. Using empirical Bayesian smoothing to map the relative risk, a substantial variation in the spatial distribution of the relative risk of LF among endemic communities was observed. Most of the excess prevalence communities were unexpectedly visible even after years of MDA. The Empirical Bayesian Moran’s Index for global clustering showed a reduction in clustering of LF prevalence after MDA with IM = 0.455 and 0.119 for before and after MDA, respectively. Furthermore, examining risks associated with ecological zones, it was observed that the Guinea Savannah and the Transition Zone were the most vulnerable zones for LF infection with prevalence odds ratios 18.70- and 13.20-fold higher than in the reference Moist evergreen zone, respectively. We observed a drastic reduction in risk in the Wet evergreen zone after MDA, while the Guinea Savannah sustained high levels of risk even after MDA. These findings should prompt public health officials to adopt stratified cluster sampling in LF-endemic regions to monitor the rate and density of microfilaria.
Introduction
Human filarial infections such as lymphatic filariasis (LF) and onchocerciasis continue to pose significant public health challenges in many developing countries. Of these infections, LF presents more severe disabling and disfiguring pathologies (1). Globally, an estimated 51 million (43–63 million) individuals as of 2018 were infected by lymphatic filariasis (2). LF is caused by three main types of filarial nematode worms, namely, Wuchereria bancrofti, Brugia timori, and Brugia malayi. These parasites are transmitted through bites by mosquitoes of the genera Aedes, Anopheles, Culex, and Mansonia. About 90% of lymphatic filariasis cases are caused by W. bancrofti with the widest geographical distribution in Africa, while the remaining cases are caused by Brugia spp. (3). In Ghana, most LF cases are caused by W. bancrofti and transmitted by different strains of Anopheles mosquito.
The Global Program to Eliminate Lymphatic Filariasis (GPELF) established by the World Health Organization (WHO) in 1997 proposed two aims to stop LF transmission and alleviate suffering among individuals presenting with pathology. This has been done through mass distribution of anti-filarial drugs. The primary aim of this strategy is to reduce antigenemia and microfilariae levels to a threshold less than 1% in the population with a coverage of >65% for up to 5–7 rounds of MDA. However, reports indicate that some foci in Africa and southeast Asia are yet to attain the infection prevalence thresholds proposed to achieve local elimination (2), of which Ghana is one of such countries.
In the past 20 years, Ghana has implemented mass distribution of microfilaricidal drugs constituting single doses of 400 mg of albendazole (ALB) plus either 150–200 mg/kg of ivermectin (IVM) or 6 mg/kg of diethylcarbamazine (DEC) administered together. Although there has been high coverage of MDA in endemic districts, this has not translated into interruption of transmission of the disease after all these years. There are reports of differences in the level of knowledge about the mass drug administration exercise as well as the exact cause of the LF disease among members in endemic areas (4). Further, while some areas adhere to the direct observation treatment strategy, others do not. As a result, the fear of the side effects of the drugs as the reason for the refusal to ingest the medicine is higher in some districts of Ghana (5). Poor community sensitization and social mobilization, in addition to inadequate education and communication before and during the MDA process, has negatively impacted the MDA program in certain parts of the country, especially in rural areas and among the less educated population (4). Coupled with the above challenges, the Ghana MDA program did not begin with all endemic communities at the same time (6). In addition, although the average annual coverage of MDA is high in Ghana, there are large community-level differences in coverage (6). The implication of this is currently unknown but could potentially prolong the MDA program since resurgence of infection may not be captured early enough.
In essence, the GPELF success depends on collective commitment and contributions from all LF-endemic countries. However, the inability of some countries to consistently monitor and evaluate prevalence levels of all implementation units (IUs) on an annual basis, as required by the GPELF program, continues to prolong the elimination schedule. Further, in attempts to collectively eliminate LF in the shortest time, the WHO recommends feasible, cost-effective, and community-specific approaches (7). While these proposed strategies have the potential to effectively contribute to eliminating LF, there appears to be inconsistent and non-uniform documentation of LF risk levels in communities within endemic countries to guide efficient distribution of limited resources to areas requiring immediate intervention measures.
Our objective is to study the geographical patterns and hotspots of LF in Ghana. Previous LF studies in Ghana have predominantly focused on studying the prevalence of the disease and assessment of MDA coverage and compliance over time (6). Others have studied the spatial distribution of LF infection across the country (8). However, till date the localized areas of higher-than-expected risk, including spatial patterns and hotspots of LF in Ghana, remain to be elucidated. While spatial clustering of LF has been studied elsewhere using Kulldorf’s spatial scan statistic (9), the impact of MDA on these clusters has not been explored. An additional purpose of the study is to examine risk of LF transmission associated with exposures in agroecological zones in Ghana. Odds ratios were used to determine whether Ghana’s agroecological characteristics are a risk factor for LF infection and to compare the magnitude of these ecological characteristics on LF transmission before and after MDA. Collectively, identifying risk levels of LF, cluster locations and size, and ecological zones of high risk could help to home in on areas requiring urgent intervention for consistent monitoring toward LF elimination in Ghana.
Materials and Methods
Study Area and Data
Ghana is located along the coast of the Gulf of Guinea and Atlantic Ocean, as shown in Figure 1. The country has a land mass of 238,533 sq. km (92,098 sq. miles) and is bordered to the south by the Atlantic Ocean, to the west by Ivory Coast, Burkina Faso in the north, and Togo in the East. The climate of Ghana is tropical, and there are two main seasons which include the wet and dry seasons. The northern part of the country experiences its rainy season from April to mid-October while the Southern starts from March to November (10). The country has grasslands mixed with south coastal shrublands, but the forests dominate, extending northward from the southwest coast of Ghana toward the eastern portion of Ghana, which serve as a hub for mining industrial minerals and timber (11).
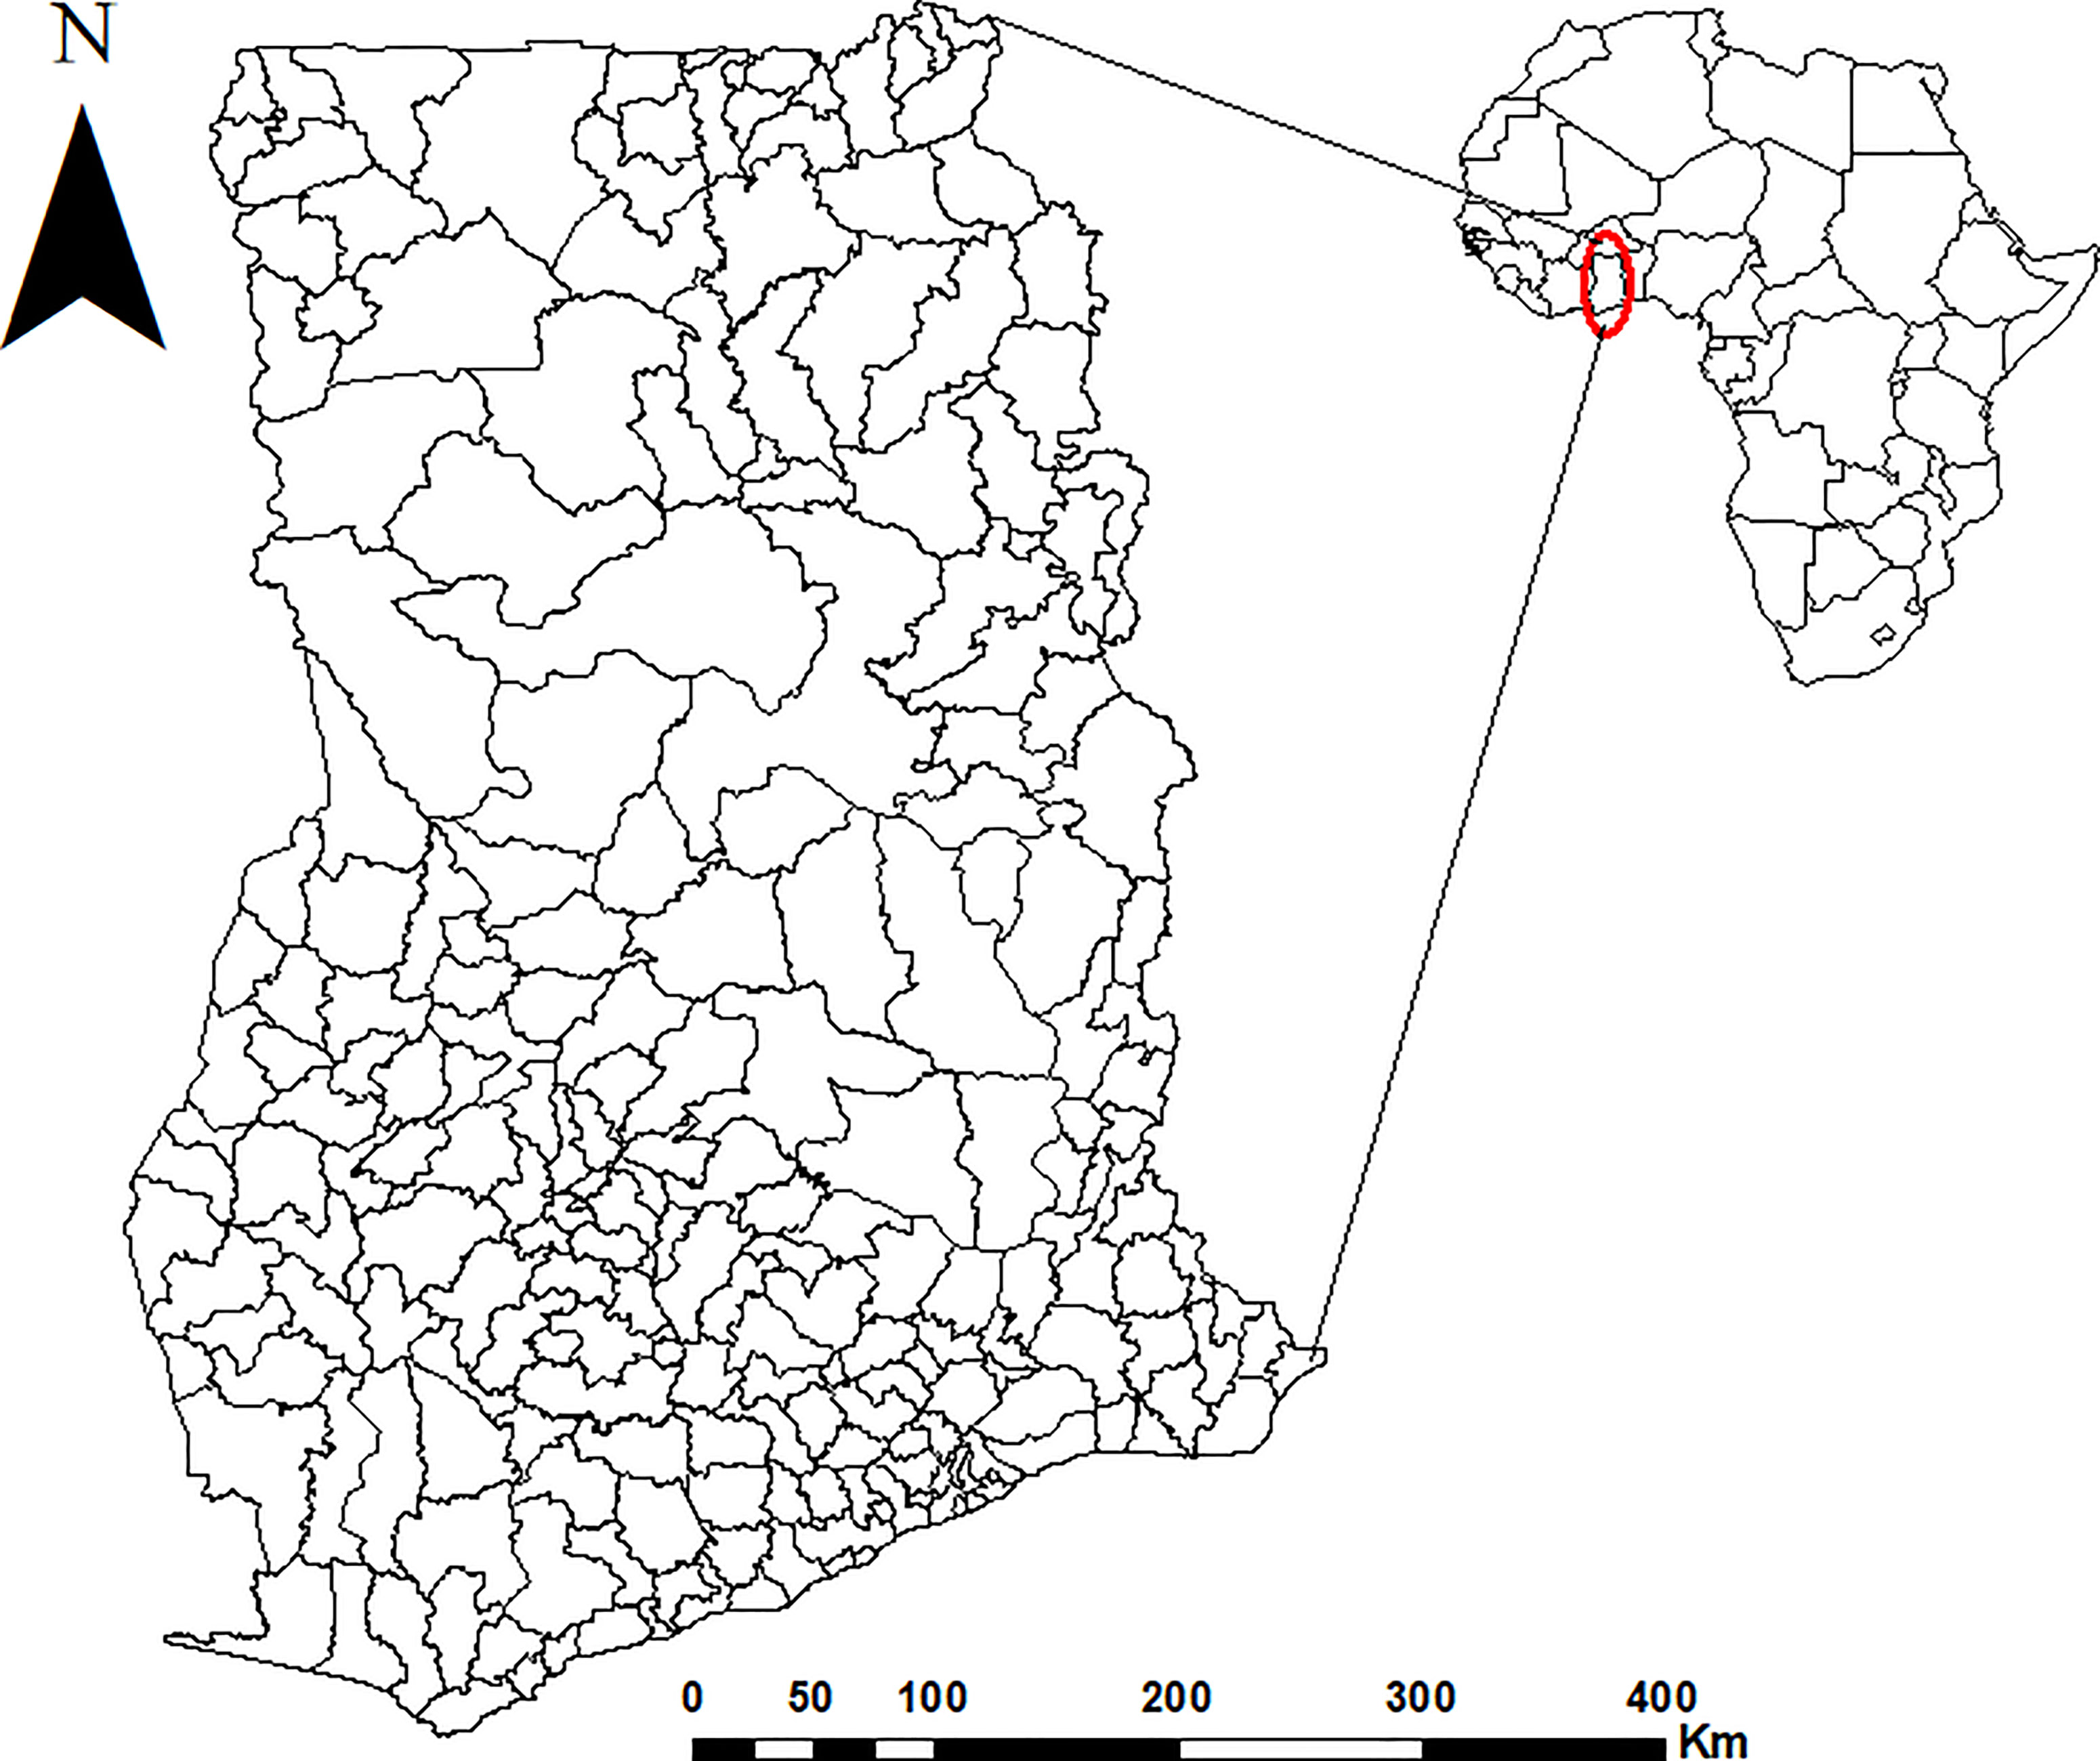
Figure 1 Map of Ghana showing the 216 districts. These districts represent the geographical level of sampling for LF also called the implementation unit (IU).
Lymphatic Filariasis Prevalence Data
LF occurrence data on both post- and pre-intervention was obtained from the Global Health Data Exchange website (GHDx) (12). These data were collated from reports by the Ghana’s Ministry of Health from 1997 to 2012 and peer-reviewed literature by stakeholders and other subnational programs for elimination of NTDs (13, 14). In addition, data from 2013 to 2014 were obtained from the work by N. K. Biritwum et al. (6). All these surveys were performed according to the guidelines for rapid mapping of Bancroftian filariasis in Africa (15). A list of all the papers whose data were used in this study is found in Supplementary Table 1.
Prior to the implementation of MDA for the elimination of LF, baseline surveys were conducted across Ghana with records from 1994 to 2002. Sentinel sites are selected at the start of the program based on communities with frequent reports of hydrocele and lymphedema and, thus, are strongly suspected to have high endemicity for LF (16). The geographical level of sampling for LF, i.e., the implementation unit (IU), is the district level, which is the second level of administrative unit in Ghana. Within each district, sentinel sites were randomly selected, located at least 50 km apart from each other. Districts with at least one sampled community yielding a prevalence equal to or more than 1% were considered endemic for LF and subsequently targeted for MDA (17). After MDA implementation, routine monitoring and evaluation activities were carried out according to recommendations by GPELF in order to measure the impact and success of the National LF Program over time (18). Previously selected sentinel sites per district were repeatedly surveyed usually once every 2 or 3 years. Additional surveys were done in spot-check sites (similar characteristics to sentinel). These are often selected randomly from the same district where the sentinel site is located but change over the course of the program.
In the end, community-level LF cases were obtained from 56,804 individuals tested from 525 survey sites, with the majority of data collected in 2000, 2001, and 2007, and no data in 2006. Online Supplementary Figure 1 shows maps by year indicating the spatial distribution of the data used for this study. To assess the impact of MDA, the data were aggregated into pre- (1994 to 2002) and post-intervention periods (2003–2014). However, since MDA implementation was delayed in some districts until 2004, communities in such districts were added to the pre-intervention study. The data used in this study have been attached as online supplementary files. To determine LF infection rates for surveyed communities at pre-intervention, the total number of positive LF cases observed for a survey location with repeated assessment was divided by the total sampled population at that location. Post-intervention rates were also obtained using the same method. MDA rounds were calculated as the maximum number of rounds in which each community had been involved in the intervention program.
Mapping the Spatial Distribution of LF Risk
Disease rates often serving as estimates for an underlying risk represent the probability for a particular event to occur. Here, interest lies in measuring the risk of getting infected with LF in Ghana and the extent to which this risk varies across space. To obtain a benchmark for risk comparison, the spatial distribution of the relative risk was rather mapped. This is given as where i= 1,2,… .m, represent random variables of positive LF cases o1, o2… om in m communities, and ei is the expected number of events. The expected number of events is computed as , where is a reference estimate given by , and Piis the sampled population in community i. To account for the possible uncertainty as a result of the heterogeneous sampling sizes, the raw relative risks were smoothed using the Empirical Bayesian Smoothing (EBS) technique. The EBS technique consists of computing a weighted average between the raw risk for each community and the neighboring average with weights proportional to the underlying sampling sizes. In effect, communities with a relatively small population sample size had their relative risks adjusted, whereas communities with a relatively larger sample size barely had their relative risks changed. For pleasant cartographic display, the smoothed rates of point features were then mapped using the Thiessen polygons. The cutoff points for classification were based on the Jenks optimal classification technique (19). This classification technique minimizes the total within-group variations and is based solely on the statistical distribution of the variable to be classified.
Spatial Autocorrelation Analyses
In this study, a spatial autocorrelation statistic was used to assess the clustering of endemic and non-endemic communities. The global Moran’s Index (MI) statistic was used (20, 21). To describe neighbors, a threshold distance was used to compute the spatial weight matrix that contains information on the neighborhood structure for each location. A binary code of 1 indicates spatial dependence based on the threshold distance and 0 otherwise. Without any knowledge of the spatial extent of correlation, different distance bands were tested.
Cluster Analysis
The presence of spatial clusters or hotspots of LF was investigated with the spatial scan statistics developed by Kulldorff’s (22). Spatial clusters were defined as zones with higher-than-expected or elevated risk. The spatial scan statistic is a widely used cluster detection tool for evaluating geographical areas of excess risk against the null hypothesis of random distribution. Kulldorff’s spatial scan statistic has an advantage over other tests for spatial clustering [i.e., (20, 23), etc] in that it is able to detect the location and size of clusters and to test the significance of these clusters (22).
To detect the presence of spatial clustering of LF at two time points, a nationwide assessment of the distribution of LF was performed using the spatial scan statistic. We chose a default window size of 50% of the population at risk as previously described (24, 25). The purely spatial scanning for clusters with high rates was performed with the Bernoulli model. The test of significance level was by means of the Monte Carlo hypothesis testing (26). The null hypothesis of no clustering was rejected when the simulated p-value was ≤0.05 for most likely hotspots and 0.1 for secondary hotspots (27).
Agroecological Stratified Prevalence Odds Ratios
Given that LF infections are driven by environmental factors as demonstrated by previous studies (28), we investigated whether ecological characteristics contribute to the risk of LF infection. The odds ratio was used to quantify the strength of association between LF prevalence and Ghana’s agroecological zones. Population-based rate ratios were computed for strata of districts grouped under the agroecological zones. Seven categories of ecological zones have been identified in Ghana: Sudan Savannah, Guinea Savannah, Transition Zone, Deciduous Forest, Moist Evergreen, Wet Evergreen, and the Coastal Forest Zones. This zoning system is used by the Ghana Food and Agriculture Organization for agricultural production. The division is based on remotely sensed climate data (i.e., radiation, temperature and precipitation intensity, variability, and annual amounts), soil type, and terrain characteristics (29). The map adopted was developed in 2000 since it was fit for the purpose of this study and because updated ones over the years did not change much. Supplementary Table 2 describes the characteristics of these zones. It should be noted that the agroecological boundaries delineated in this study, as shown in Figure 2, do not exactly follow those depicted by Asravor et al. (29), as the interest here was to have each district completely situated within a specific zone. The moist evergreen zone was used as the reference given the few LF cases in this zone. Areas of such small number of LF cases are usually believed to have been imported (30).
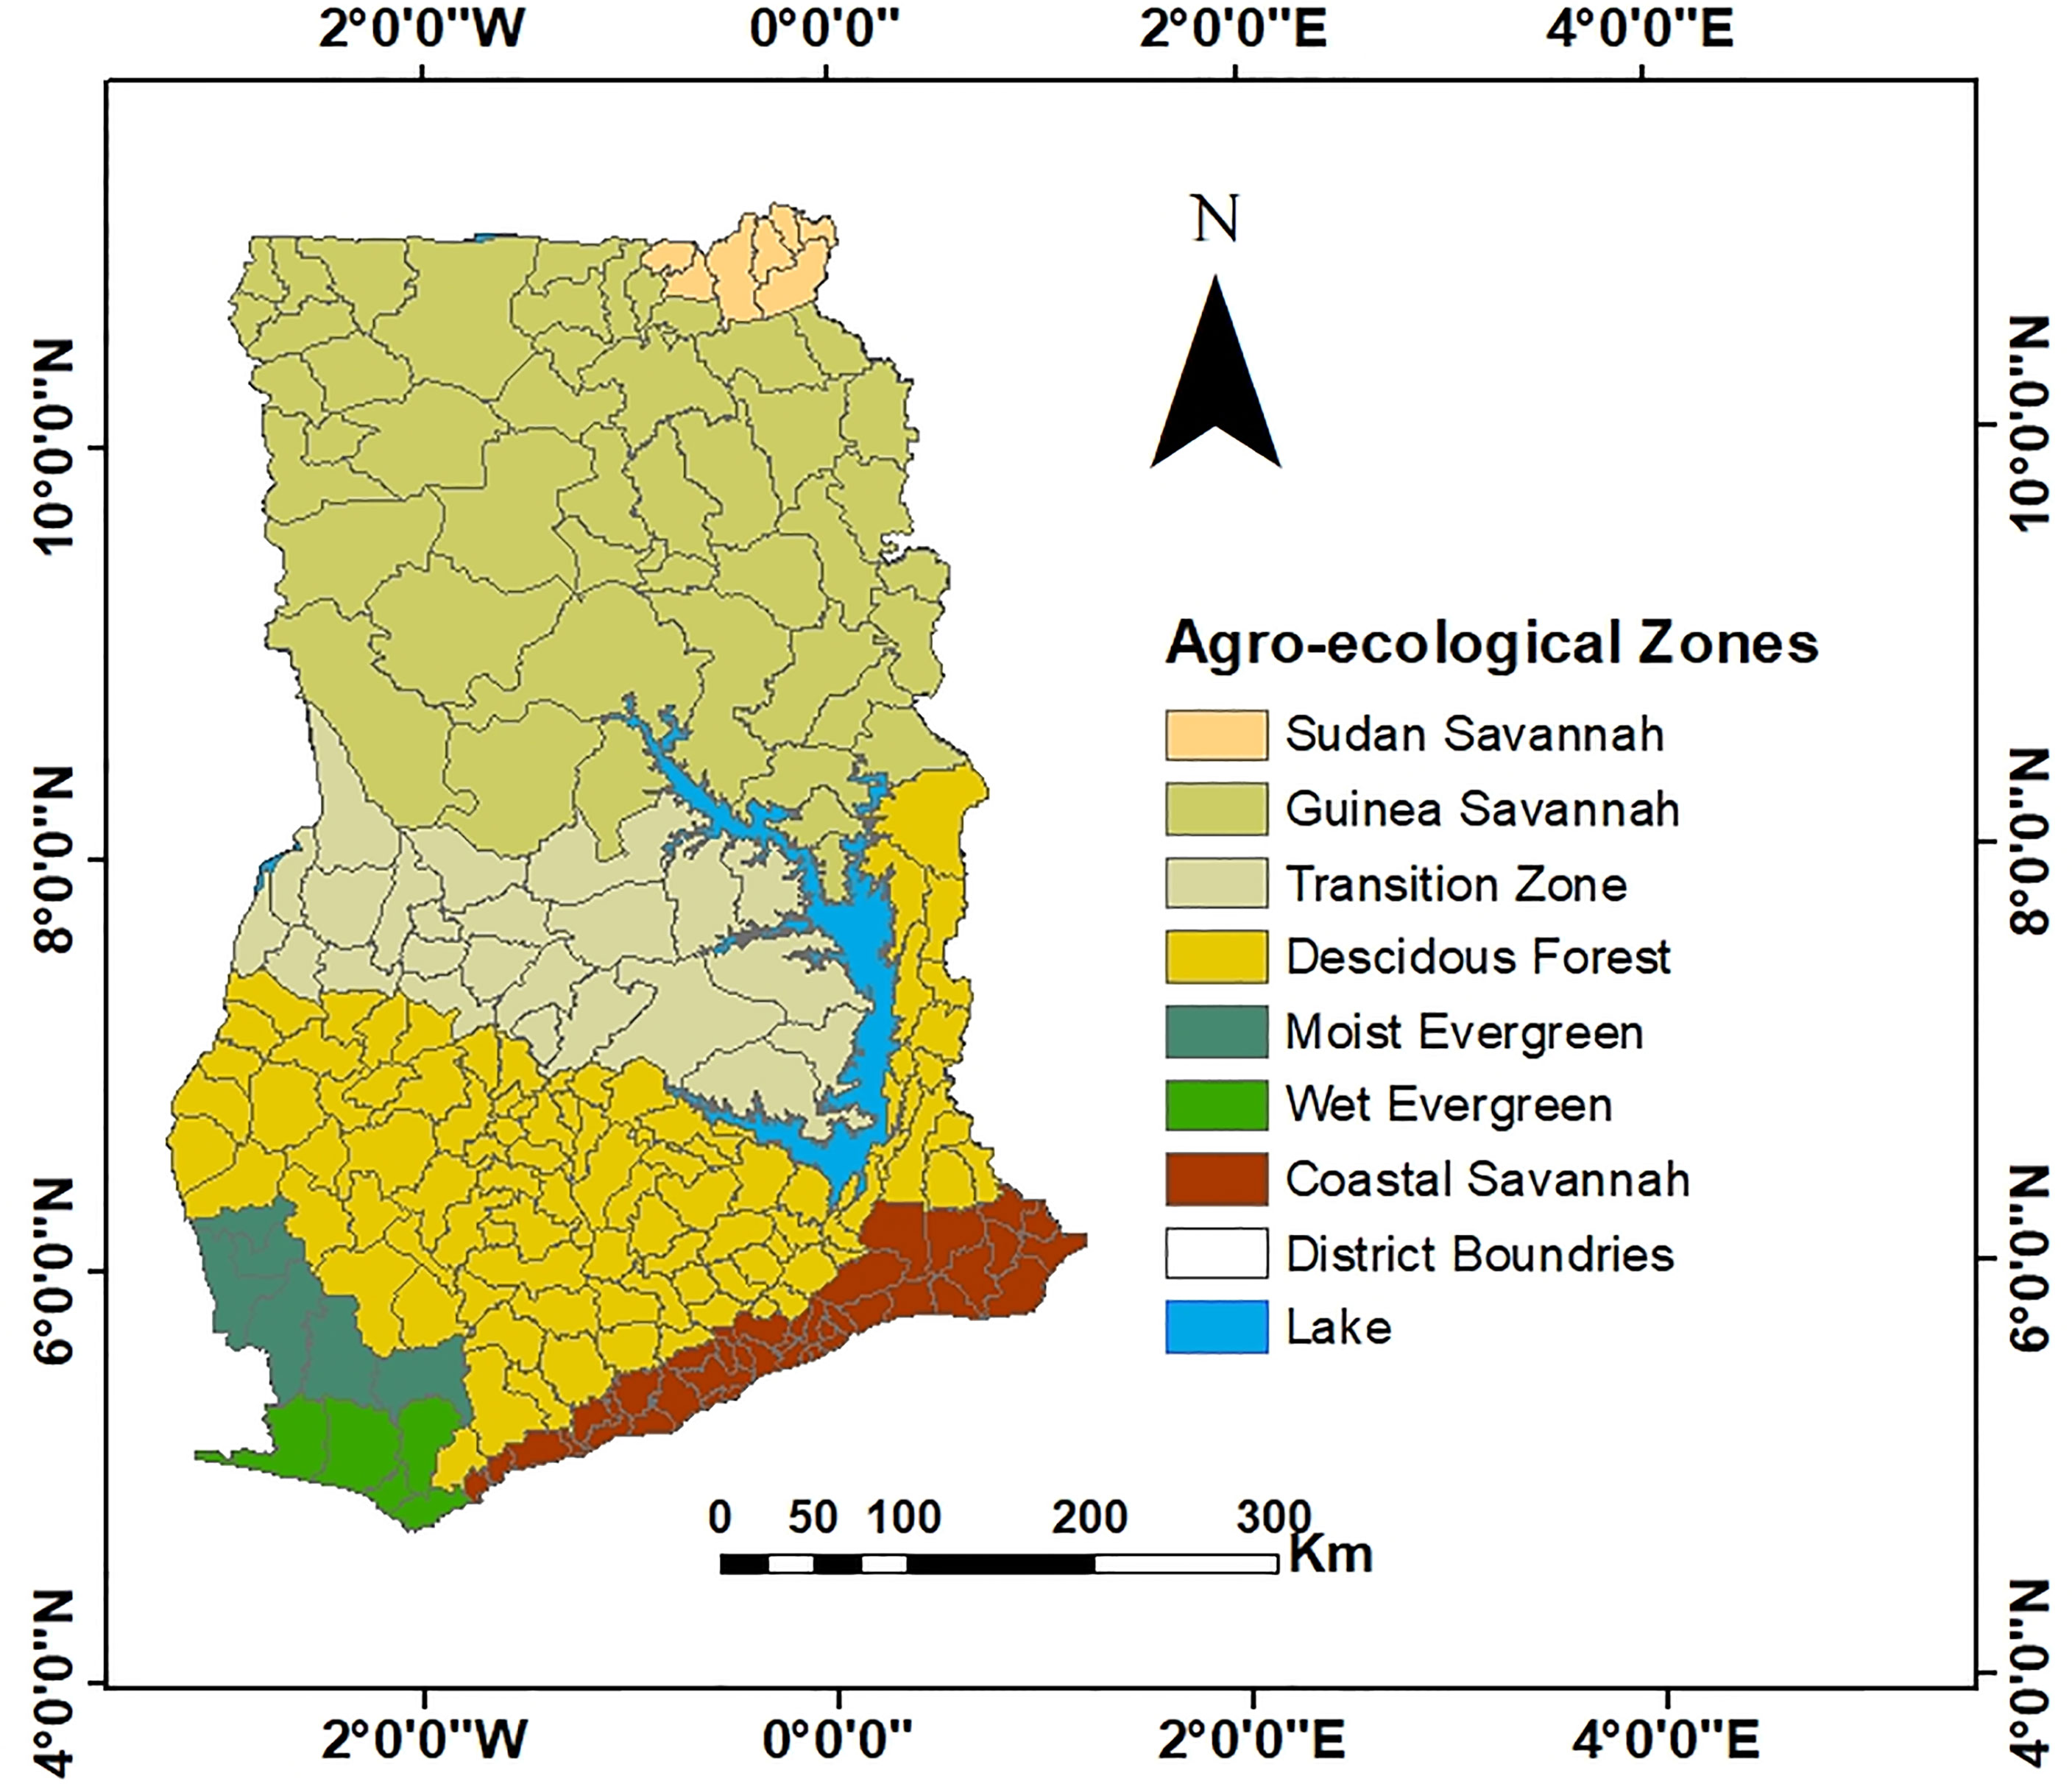
Figure 2 Map of districts in Ghana grouped into the seven agroecological zones. The agroecological boundaries delineated in this map is a slightly revised version of the original by Asravor et al. (29) to ensure that each district is completely situated within a specific zone.
Results and Analyses
Mapping Relative Risk
The overall risk before MDA intervention (i.e., 1994 to 2002) was 0.12%, while the risk after intervention was 0.02%. Figures 3A, B show the empirical Bayesian smoothed maps with remarkable spatial variations. The minimum and maximum relative risks (RR) before intervention were 0.008 and 7.188 (Figure 3A), while those of post-intervention was observed to be 0.023 and 14.84 (Figure 3B). Given that risk may increase or decrease with time, there was the need to establish a common baseline for risk comparison; thus, communities common to both study periods were compared. Here, it was observed that, whereas the RR of LF decreased in some communities that received intervention, the same was not true in other communities, as shown in Figure 3C. For instance, out of the 34 communities that were common in both pre- and post-MDA survey, a decline in RR in 15 communities was observed, whereas the remaining 19 showed an increase in RR of LF prevalence. The relative risk of communities within the northwest parts remained pronounced and consistent at pre- and post-interventions.
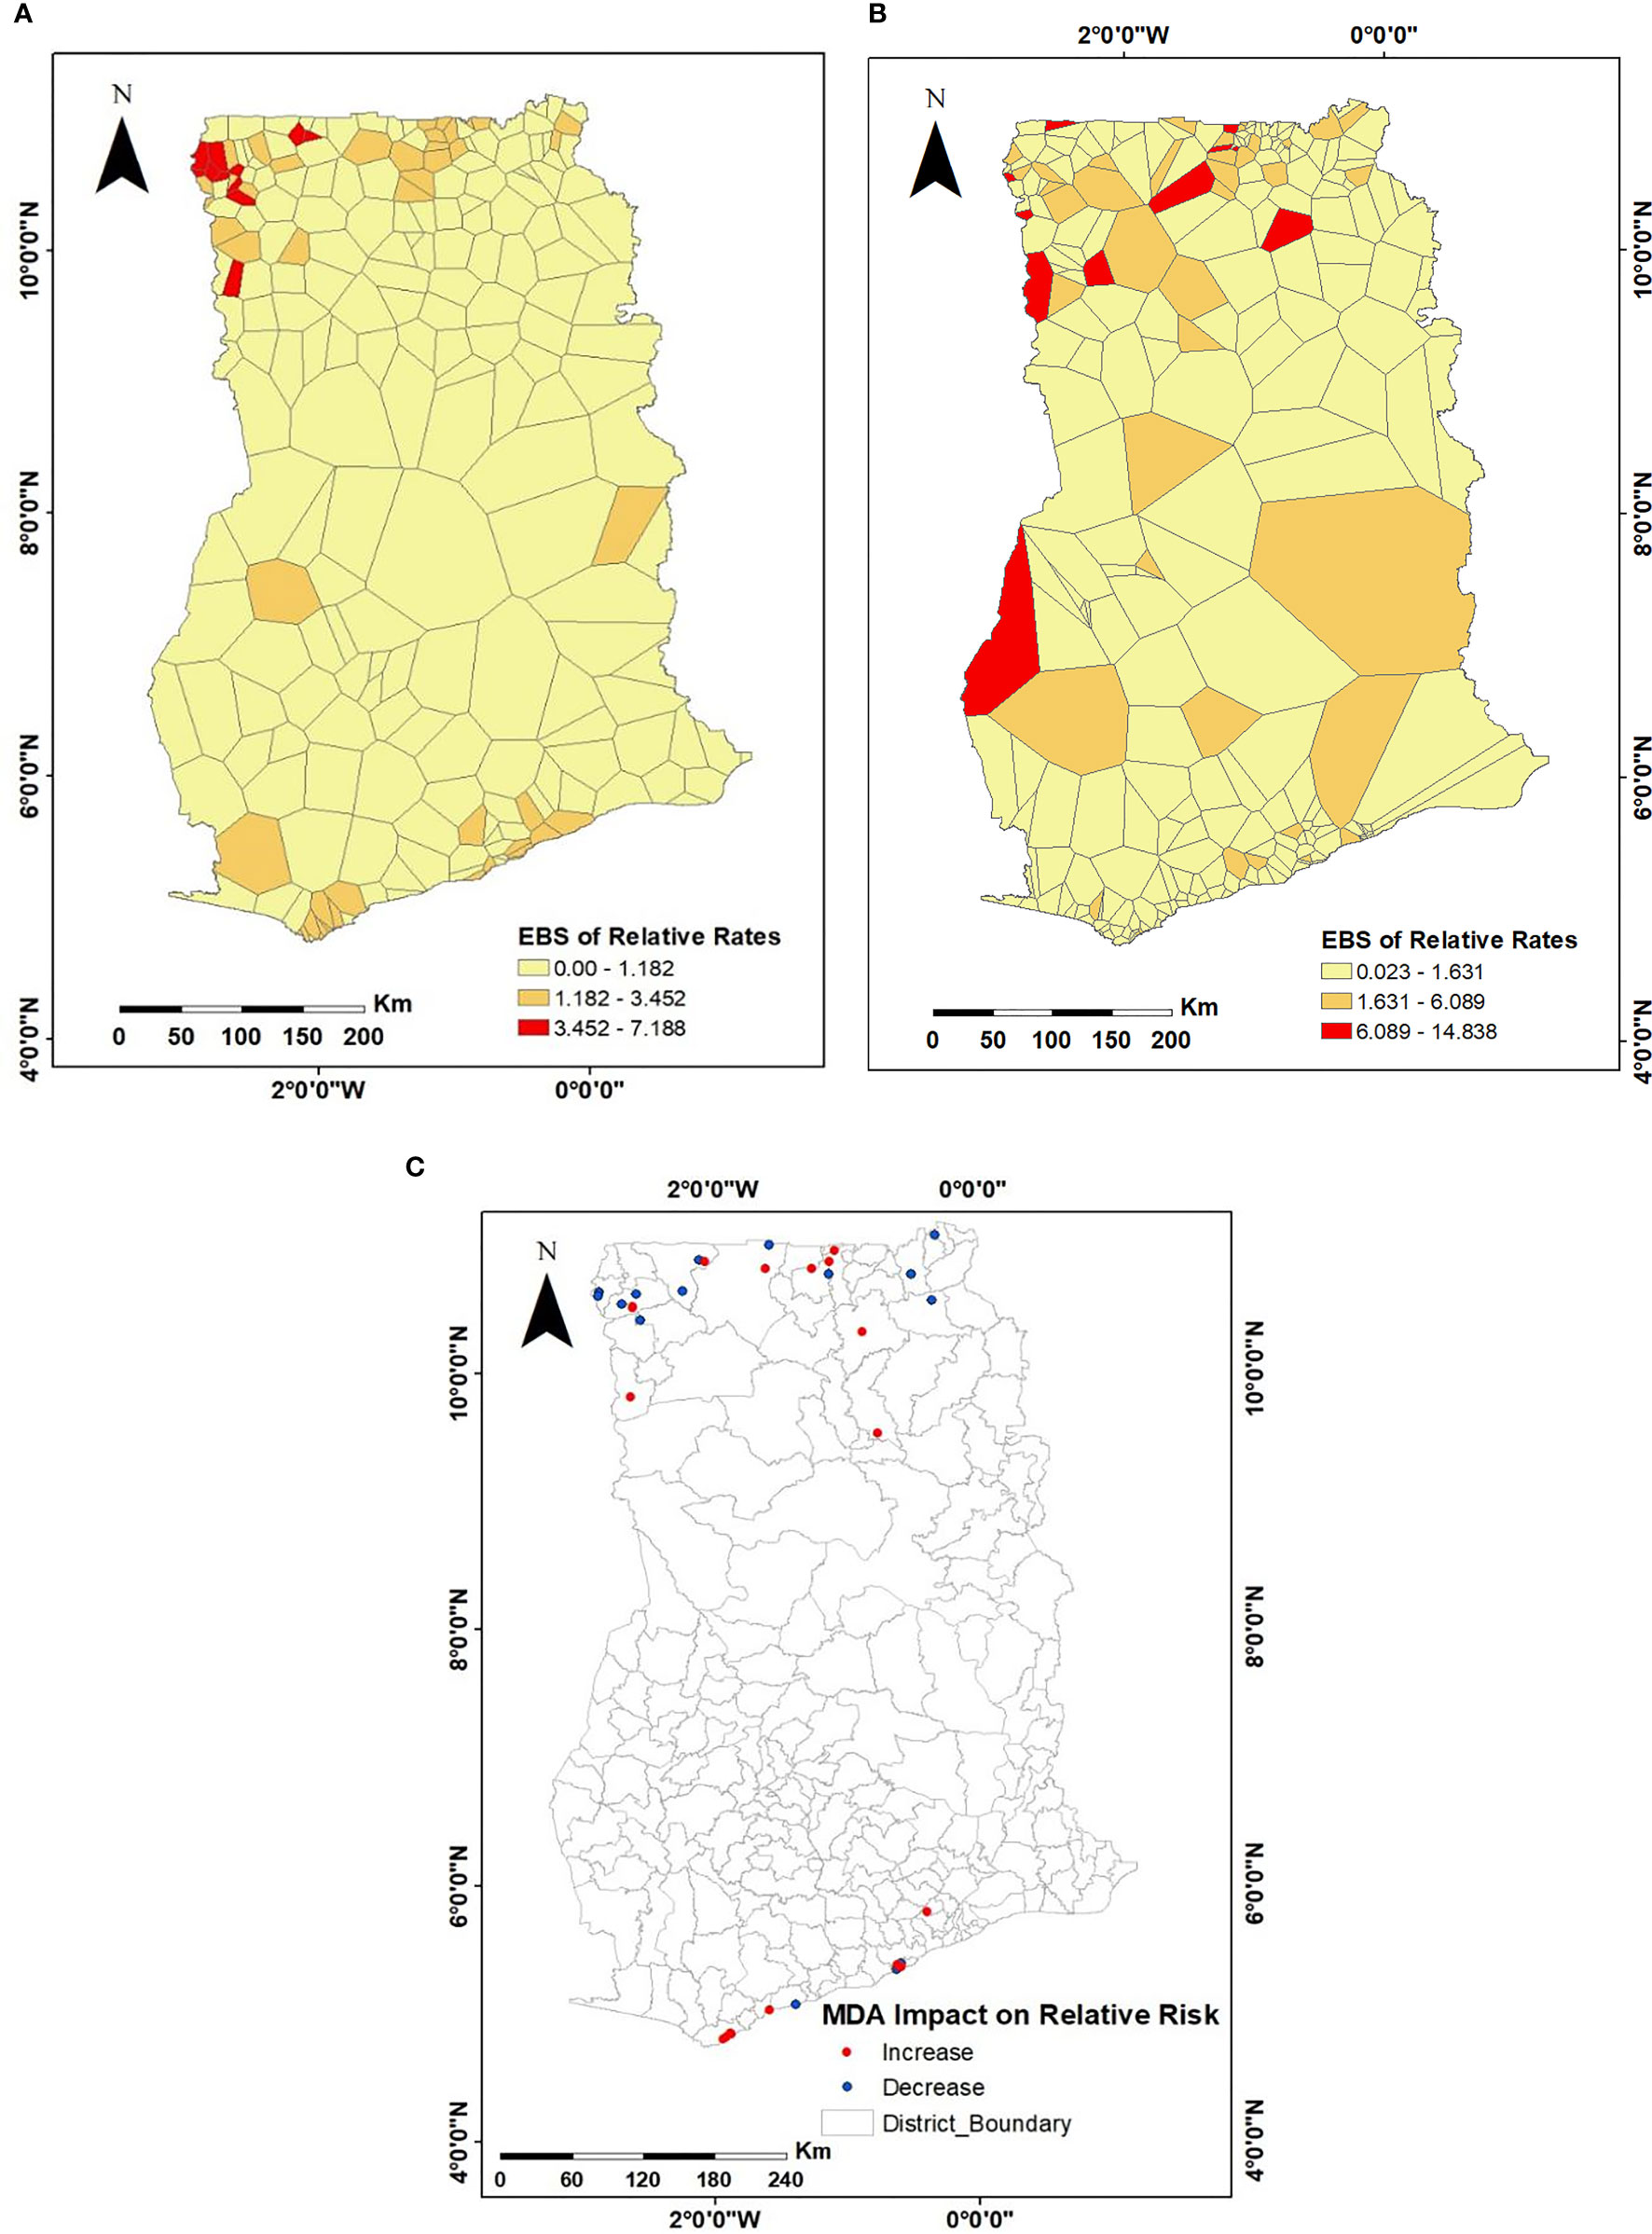
Figure 3 Spatial distributions of the empirical Bayesian smoothed estimates of the relative risks of LF infection for (A) 1994–2002, representing pre-MDA; (B) 2003–2014, representing post-MDA; (C) compares communities common to both pre- and post-MDA surveys to assess the changes in relative risk over the years.
Test for Spatial Autocorrelation
A test for spatial autocorrelation was performed using the Global Moran’s Index of different distance bandwidths. A distance of 60 km yielded the highest positive Moran’s Index of 0.49 at p < 0.0001 for pre-intervention data demonstrating the evidence of aggregation of communities with similar values of LF cases (Table 1). Results for post-intervention data yielded a highest Moran’s Index of 0.12 at p = 0.01 at a distance band of 84 km beyond, whose systematic spatial variation pattern begins to fade off. Increased distances showed a non-significant spatial autocorrelation, and therefore results were not shown. For the purpose of comparison, the same distance weight matrix of 84 km was used for both datasets and is shown in Tables 2, 3. Univariate global Moran’s Index revealed a spatial clustering of LF prevalence before MDA intervention but a very weak and non-significant clustering after MDA intervention. However, adjusting for varying population densities across the communities, we observed a positive and statistically significant spatial autocorrelation for LF prevalence before and after MDA intervention (I = 0.455, p < 0.001) and (I = 0.119, p = 0.014), respectively. The result, however, shows a reduction in the strength of clustering after MDA.
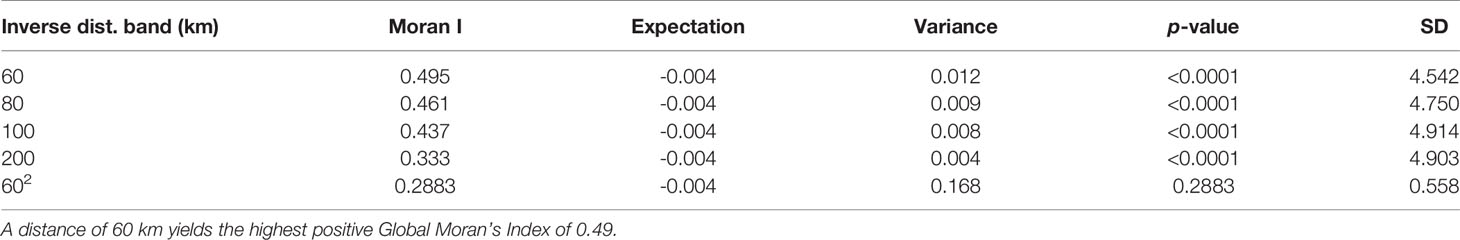
Table 1 A test for global spatial autocorrelation of LF distribution before MDA with increasing distance weight matrix.
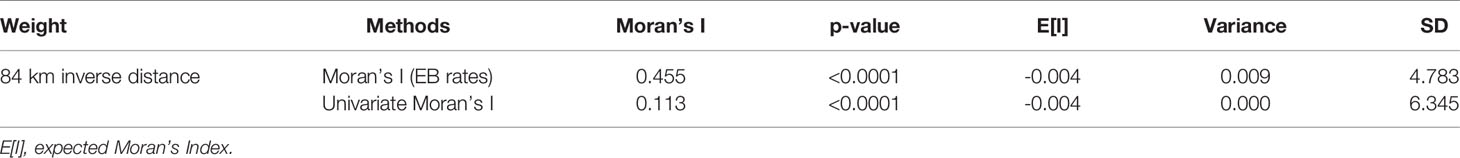
Table 2 A test for spatial autocorrelation of LF distribution before MDA using population-adjusted and univariate Global Moran’s Index for the pre-MDA intervention dataset.
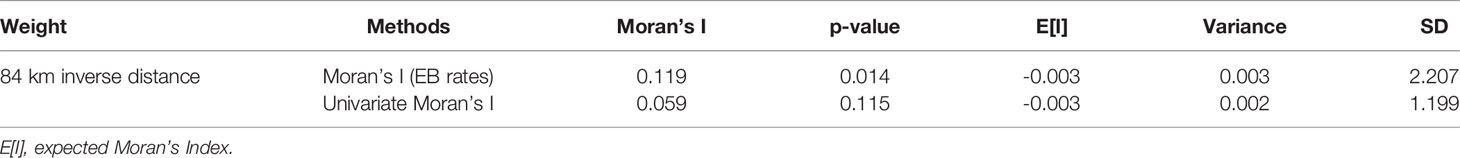
Table 3 A test for spatial autocorrelation of LF distribution before MDA using population-adjusted and univariate Global Moran’s Index for the post-MDA intervention dataset.
Cluster Analysis or Hotspot Detection
For the pre-intervention survey, the primary hotspot encompassed 35 communities with a higher-than-expected relative risk of 4.74 (p < 0.001). This hotspot had 1,082 observed cases compared with 334 expected cases covering almost 38% of the population sampled. In addition, 3 statistically significant secondary hotspots were also observed. Table 4 presents the characteristics of the first 4 spatial hotspots of LF, while Figures 4A, B show the spatial distribution of these hotspots. Similarly, for the post-intervention survey, the primary cluster encompassed 63 communities with a relative risk of 3.66 (p < 0.001). There were 2 secondary clusters with relative risks of 3.09 and 4.18 both with statistically significant p < 0.001, as shown in Table 4.
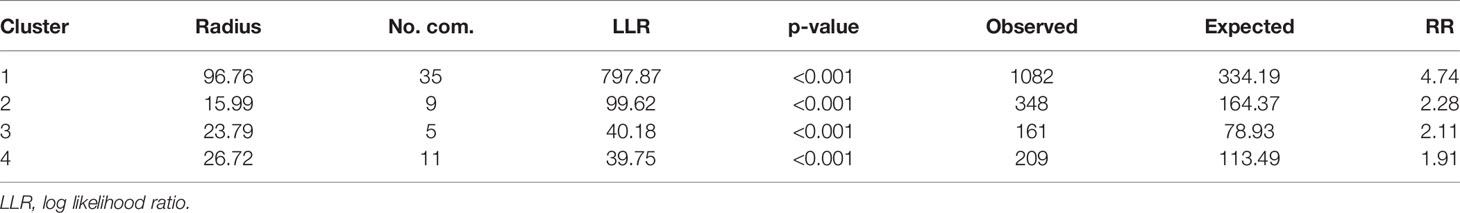
Table 4 Characteristics of the first four (4) spatial hotspots of LF before MDA intervention analysis using a spatial window that could include up to 50% of the population at risk in Ghana, during 1994–2002.
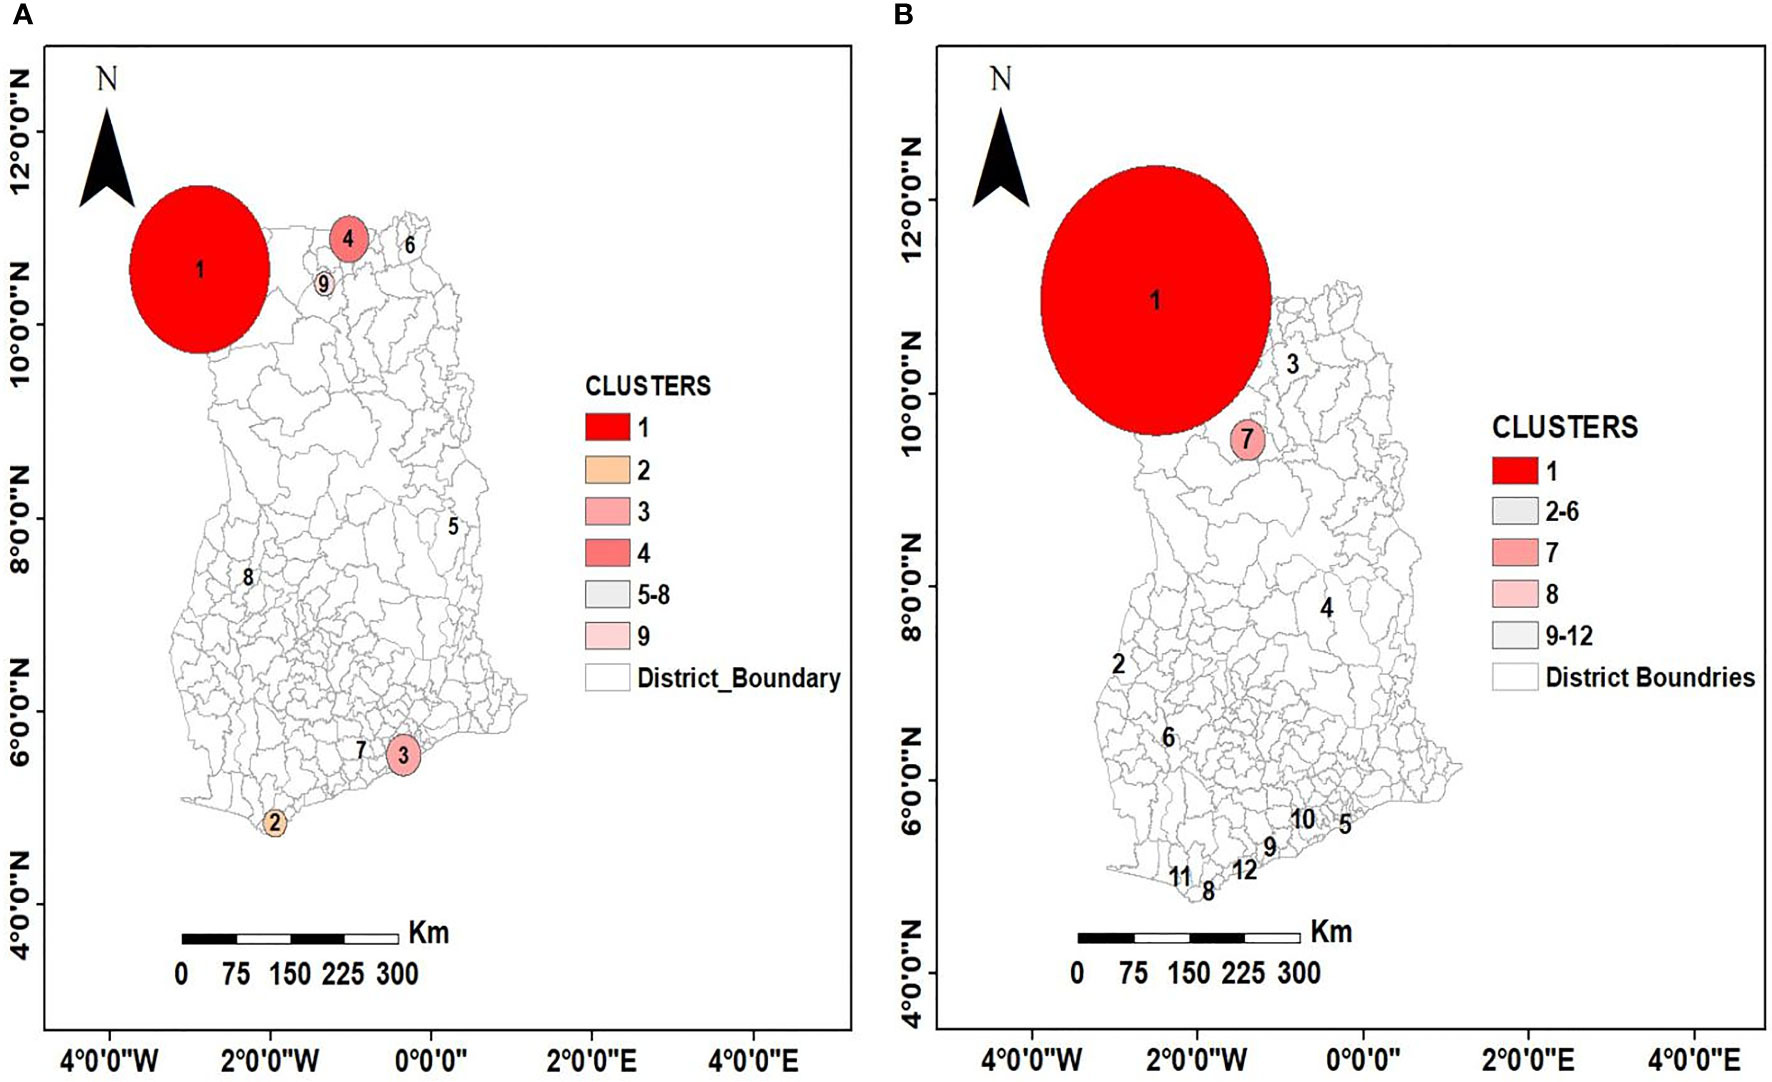
Figure 4 Spatial distribution of purely spatial clusters at two time points (A) pre-intervention (B) post-intervention. This non-random distribution suggests spatial clustering of high prevalence of LF at North-West and along the coast of Ghana and low prevalence at the middle belt. The circles indicate the location and size of the clusters.
Given the large size of the most likely cluster (encompassing 63 communities) (Table 5), with the possibility of missing out relatively important but small-sized clusters, it was important to investigate whether there existed smaller clusters that are statistically significant. A maximum reported cluster window size of 15% of the population at risk was tested. A statistically significant (p< 0.001) cluster of high rates of LF was again found to exist among communities in the Upper West and the Northern Regions as previously observed in addition to clusters in the Upper East Region that were submerged in the previous analysis (Table 6 and Figure 5).
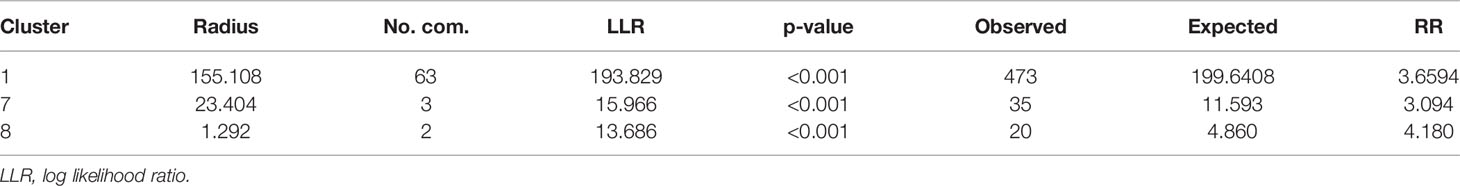
Table 5 Characteristics of three (3) spatial hotspots of LF after MDA intervention using a spatial window that could include up to 50% of the population at risk in Ghana, during 2003–2014.
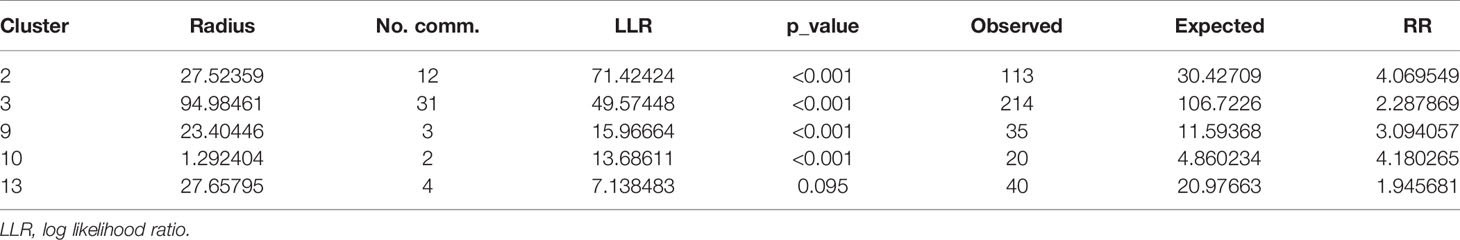
Table 6 Characteristics of five (5) spatial hotspots of LF after MDA intervention using a cluster of 15% maximum reported window size and 50% cluster window size during 2003–2014.
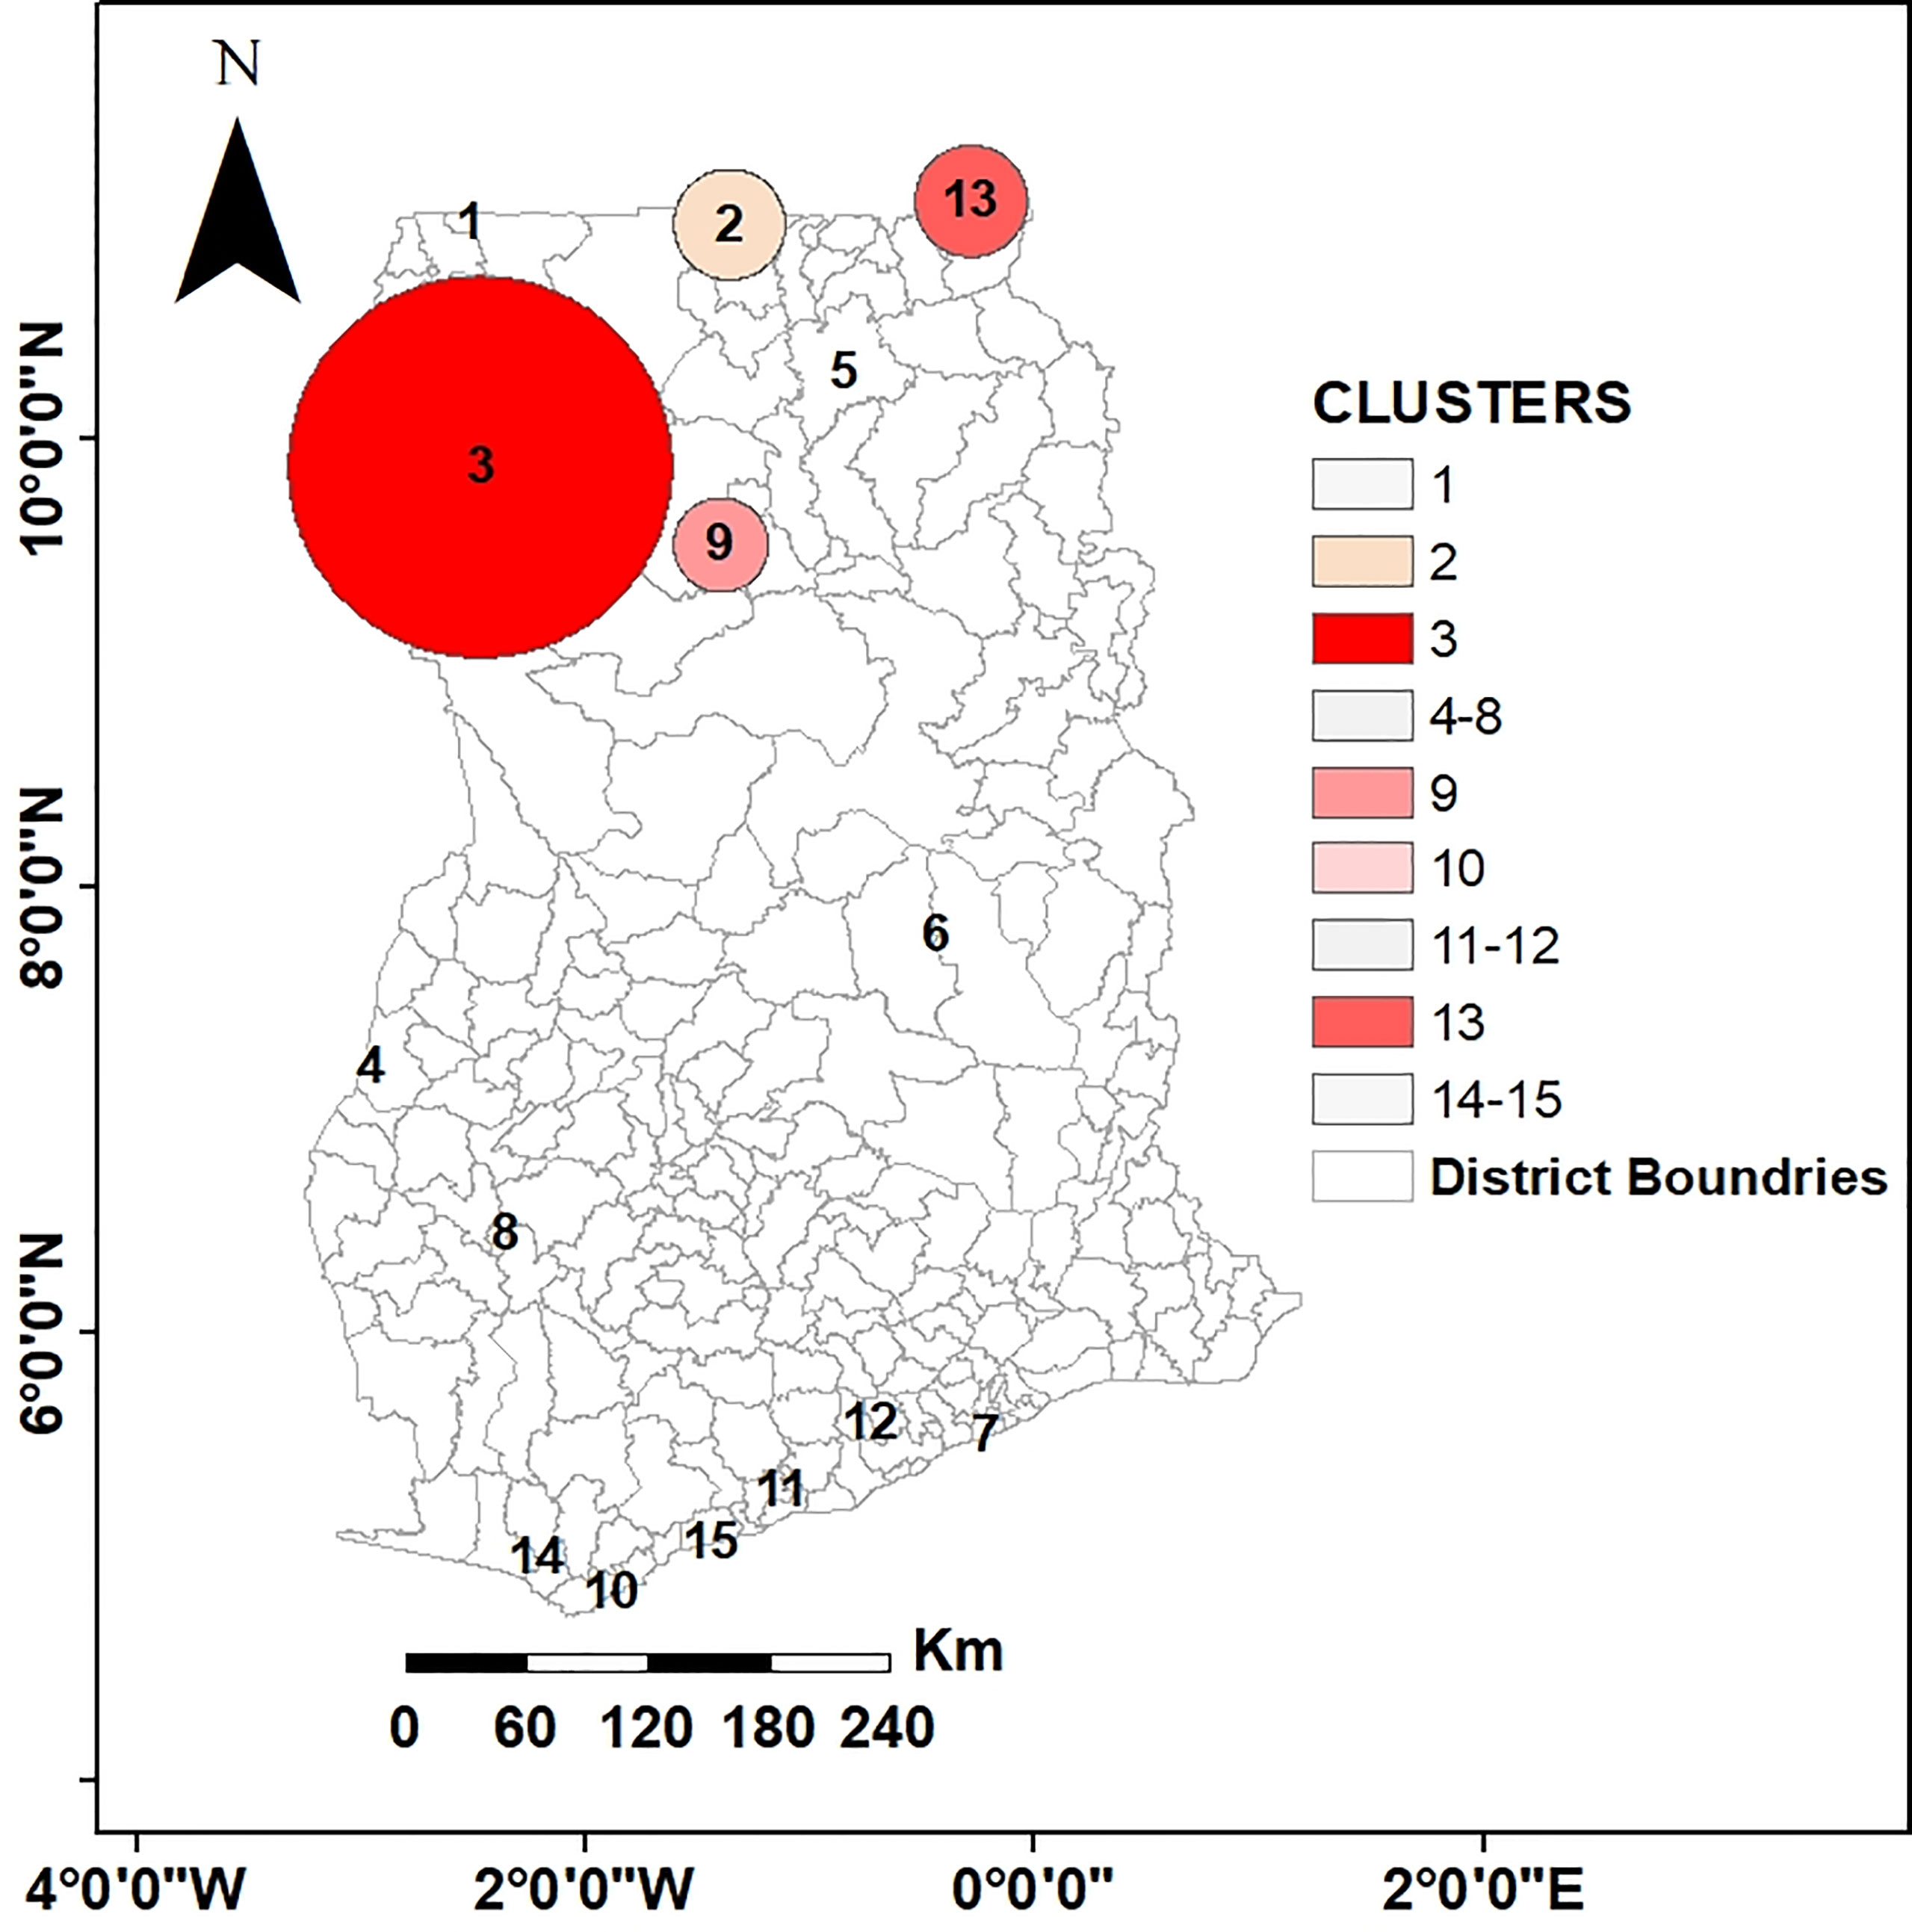
Figure 5 Spatial distribution of purely spatial clusters using 15% maximum reported window size.
Cluster Comparison at Pre- and Post-Intervention in LF-Endemic Communities
MDA is one of the mainstay control strategies against LF elimination in most endemic countries. Therefore, to determine the effect of MDA on clusters of LF-endemic communities and the size of these clusters, an overlay analysis of the pre- and post-intervention clusters was performed (see Figure 6). The result showed that, while clustering of LF-endemic communities dissolved in southern Ghana as shown in Figures 4B and 5, emerging clusters and a spatial shifting of clustering were observed in northern Ghana.
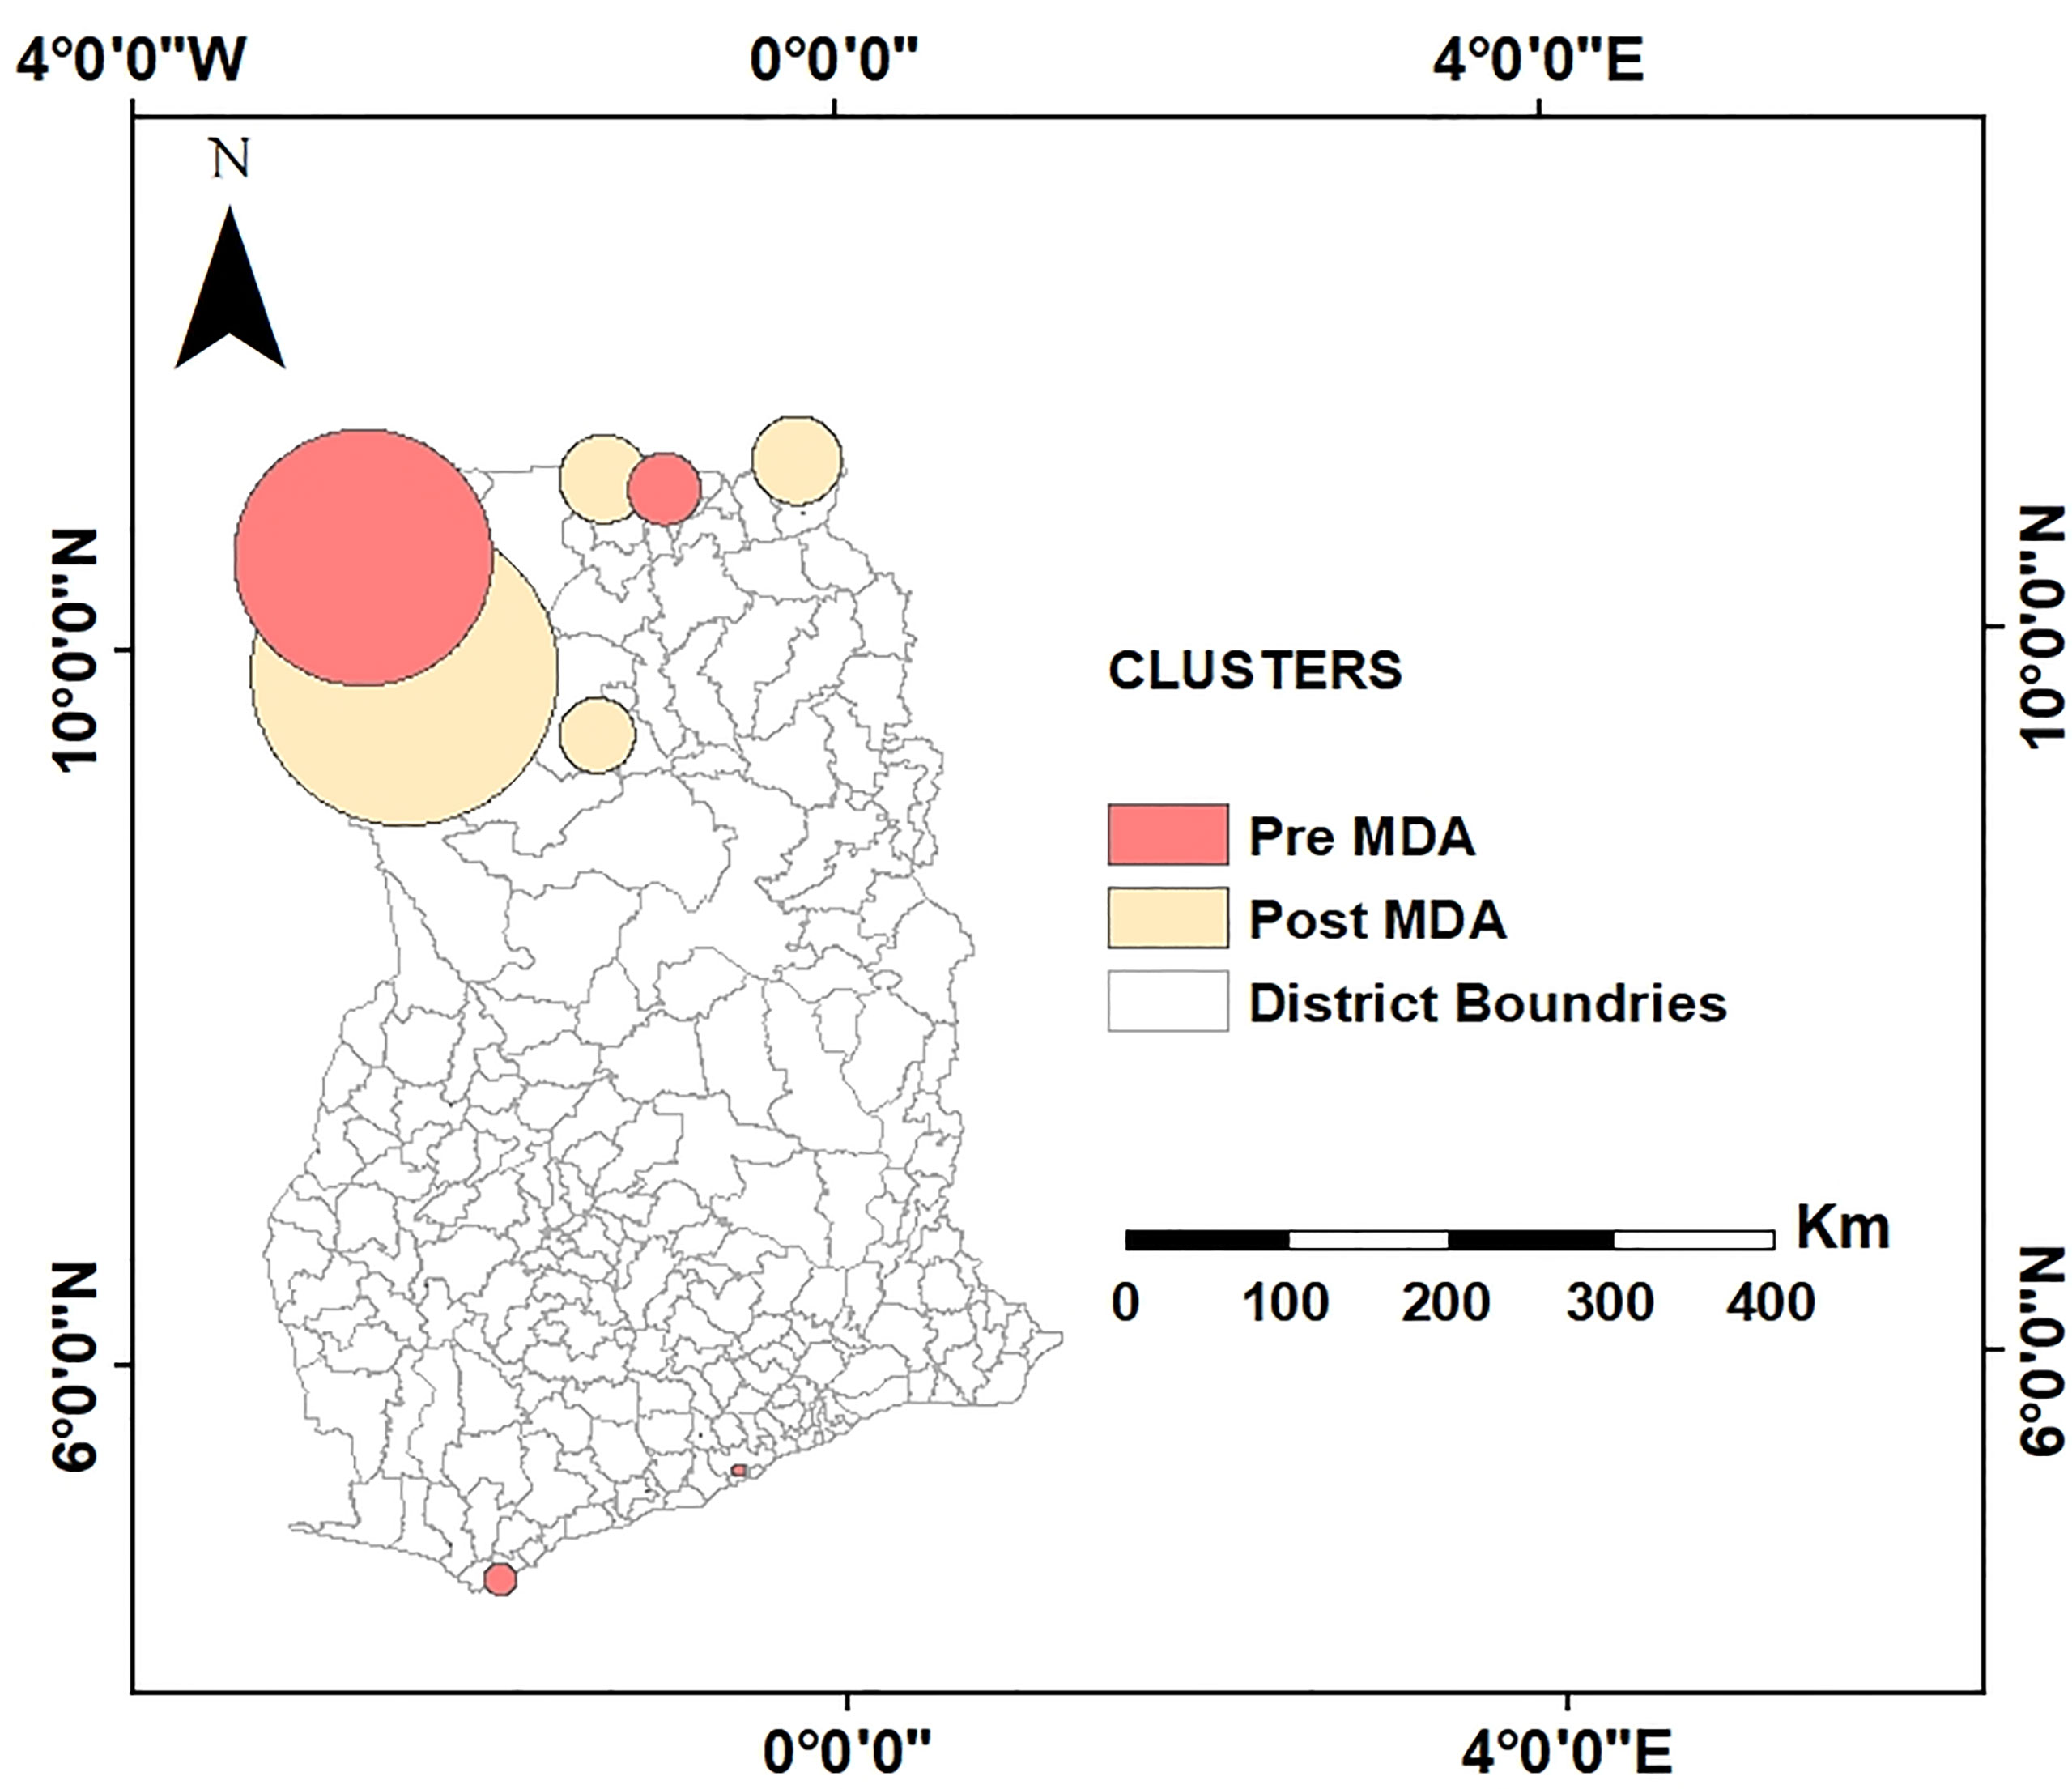
Figure 6 Comparison of spatial clusters to assess the behavior of clusters before and after MDA interventions. This overlay analysis shows, while clustering of LF-endemic communities dissolved in southern Ghana, emerging clusters and spatial shifting of clustering occurred in northern Ghana at post-MDA.
Odds Ratios of LF Risk and Agroecological Zones
It was observed that before MDA, the chances of LF infection were 12.56 times higher in the Wet Evergreen zone than in the Moist Evergreen, followed by Guinea and Sudan Savannah with odds ratios of 10.54 and 7.74, respectively (see Table 7). On the other hand, ecological characteristics in the Deciduous Forest and Transition Zones did not reach statistical significance with a 95% CI of 0.85 to 4.67 and 0.67 to 4.11, respectively. Contrary to the pre-MDA observation, the Wet Evergreen showed reduced odds of LF infection (7.18), while the Transition Zone obtained the second highest odds ratio of (13.20) following the Guinea Savannah with 18.70 area after MDA intervention (Table 8).
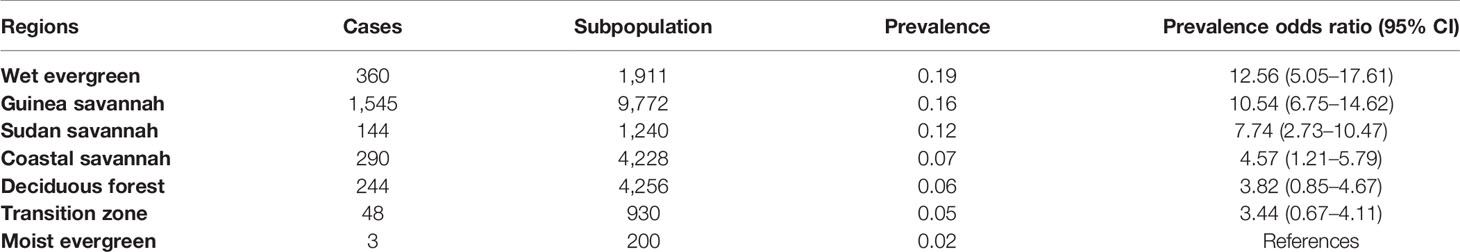
Table 7 LF prevalence rate and population-based odds ratios by strata of communities classified according to ecological zones, 1994–2002.
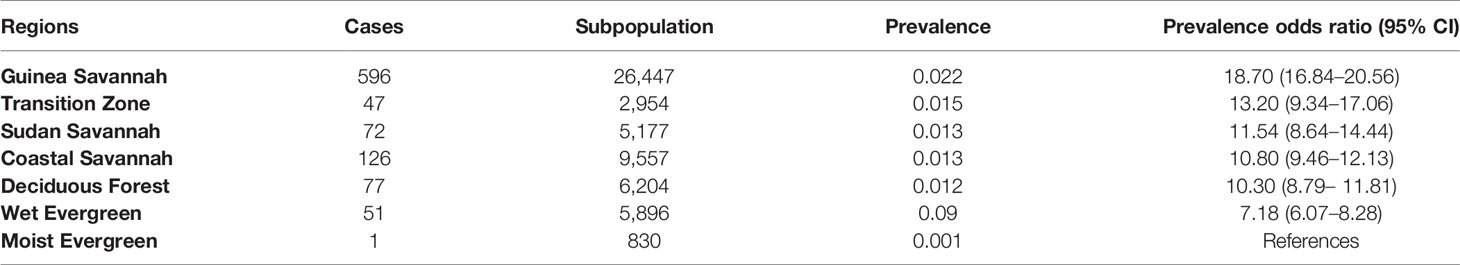
Table 8 LF prevalence rate and population-based odds ratios by strata of communities classified according to ecological zones, 2003–2014.
Discussion
LF continues to pose huge health challenges to endemic countries, which are already burdened with poor health systems. To meet elimination deadlines in LF-endemic countries, there is the need for new tools to complement existing strategies. On the basis of this, the current study aimed to explore and map the spatial variation and hotspots of community-level LF incidences in Ghana. One of the key observations in this study was the high overall risk at the pre-intervention period compared to post-intervention. This was expected and is in line with several studies where intervention significantly reduced the risk of acquiring infection, as previously documented (3, 31). MDA, which is the mainstay intervention for the elimination of LF in endemic countries in sub-Saharan Africa, consists of ivermectin and albendazole. Ivermectin has a microfilaricidal activity, i.e., it kills the microfilariae and thus significantly reduces their levels after consumption (32). Identifying the community-level risk of LF is key toward its elimination in endemic countries. In this study, the maps of the empirical Bayesian smoothed RR show substantial spatial variation in community-level risk of LF. A maximum RR of 14.8 at post-MDA compared to 7.188 at pre-MDA was observed. While this finding was uncommon, it could be due to several reasons. For instance, the Global Program for Elimination of Lymphatic Filariasis had a modest start in Ghana with only 235 endemic communities surveyed in the first year of operation constituting a target population of 22,796. This increased to 290 communities with a population of 57,775 by the end of 2014. Typically, some communities such as Biro and Kunku in the Upper East and West Regions, respectively, which were not surveyed in the pre-intervention period constituted areas of high relative risk in the post-intervention period. In addition, a suboptimal response to ivermectin for the treatment of onchocerciasis, another filarial infection, has been reported in northern Ghana (33). In their study, they observed a faster repopulation of microfilarial rate following ivermectin treatment. A similar phenomenon could account for the increased risk of LF at post-MDA intervention, although this should be further investigated.
Generally, it was observed that the distribution pattern of LF infection was spatially clustered and persisted though with less significance after MDA intervention. This represents shared common possible risk factors among LF-endemic communities and sustained transmission of the disease as reported elsewhere (34). In other words, the spatial process that facilitated the transmission persisted even after MDA intervention. The spread of the disease is significantly influenced by several heterogeneous factors, among which the environment is paramount. Another plausible reason that could support this observation (i.e., increased risk at post-MDA) could be non-compliance of MDA as well as issues of MDA coverage (35). WHO recommends a coverage of >65% continuously for 6 years to completely eliminate LF in endemic countries (WHO, 2018). While some LF-endemic communities are known to have achieved this, there are reports that factors including but not limited to logistics, personnel, ethnic conflicts, and hard-to-reach populations (36) continue to frustrate LF elimination.
In a complementary analysis, statistical inference of patterns using the spatial scan statistics detected both primary and secondary hotspots, with the primary hotspot detected in the northwestern part of Ghana. There was a mutual occurrence between the empirical Bayesian smoothed maps and the hotspots detected by the spatial scan statistics. For example, the communities within the primary hotspot had higher-than-expected relative risk. However, a few of the communities with higher-than-expected relative risk were not identified as hotspots, thus indicating the significance of formal testing and inference in cluster analysis. The spatially moving clusters observed indicated that while some communities were falling out of the cluster as a result of MDA intervention, new ones were joining, indicating cross-community transmission. These identified hotspot communities could be targeted for intensive campaign activities to raise MDA awareness and compliance toward elimination of LF and co-endemic neglected tropical diseases.
The impacts of ecology on the risk of LF infection or transmission were diverse among the seven identified ecological strata in Ghana. Before MDA intervention, the Wet Evergreen zone had the highest odds of LF prevalence followed by the Guinea Savannah. However, a drastic reduction in risk in the Wet Evergreen zone was observed at post-intervention while the Guinea Savannah remained. This is consistent with observations by de Souza et al. (37), who found lower-than-expected microfilaria (mf) levels in districts within the Wet Evergreen zone after MDA except for the Ahanta West District which had a prevalence level above the 1% threshold. The persistent high level of LF risk in the Guinea Savannah could be attributed to suitable climatic and environmental conditions such as high temperatures and irrigated agroecosystems. These create conducive mosquito breeding habitat diversity, supporting vector breeding (38). As compared to southern Ghana, the presence of rainforest with tall trees forming thick canopies (continuous vegetation structure) prevents sunlight from reaching the ground, hence reducing the conditions suitable for mosquito breeding. Admittedly, socioeconomic and environment determinants (38, 39) have been implicated in the transmission of infectious diseases. Some villages in the north and south of Ghana are victims of poor environmental sanitation and housing (40).
A major limitation in this study was the modest beginning of the baseline endemicity survey, which resulted in absence of information on some endemic communities. This made it impossible for a comparison of the impact of MDA in all endemic communities in Ghana. Again, although this study provides very important baseline information and insight that could influence LF control programs, the data used spanned 1994 to 2014. The results may be further improved if more resent data were used. Thus, further studies with current data are required to build on the knowledge obtained from this study. Furthermore, there were differences in the number of MDA rounds among the surveyed communities which could impact observations in this study. However, this was circumvented by obtaining average prevalence over the years. In addition, spatiotemporal analysis could not be performed given the sparse temporal nature of community-level data. This is usually as a result of high cost of surveillance and/or limited logistics. Thus, the observed spatial pattern herein reported should be interpreted with caution given the varying sampling periods. Similarly, the observed effect of MDA on LF infection at the various communities could be impacted by the same limitation. However, this effect may be minimal given consistency with results of other studies in some selected communities in Ghana (4). This study reveals that although MDA coverage has been high in certain parts of the Northern region of Ghana, LF transmission is still persistent. Finally, the possibility of correlated data may influence the association between agroecological zones and the rate of LF occurrence and should be further investigated. Future surveillance should be guided by hotspot areas and clusters identified in this study for effective intervention in communities which still require MDA and consistent monitoring of communities in proximity.
Conclusions
This study has investigated the spatial variation of community-level LF risk in Ghana by mapping and detecting hotspots. It can be concluded that the overall risk of LF has reduced since the inception of MDA; however, risk of LF still remains high mostly in the north and parts of the coastal areas in southern Ghana. Spatial distribution of LF infection in Ghana is clustered, with evidence of sustained hotspots in some areas even after several years of MDA. The findings infer that large clusters in ecological zones such as the Guinea and Sudan Savannah seem to share common risk factors. This study also demonstrated that the use of spatial statistics and cluster detection methods can aid health planners in appropriately assessing and identifying spatial disparities in risk in populations so as to better guide evidence-based health planning decisions.
Data Availability Statement
The raw data supporting the conclusions of this article will be made available by the authors, without undue reservation.
Author Contributions
EK: conceptualization, methodology, data curation, software, writing—original draft preparation, visualization. SA-A: supervision, conceptualization, methodology, validation, writing—reviewing and editing. AK: conceptualization, methodology, writing—reviewing and editing. JA: supervision, writing—reviewing and editing. FO: conceptualization, methodology, software, validation, writing—reviewing and editing. AD: conceptualization, supervision, writing—reviewing and editing. All authors contributed to the article and approved the submitted version.
Conflict of Interest
The authors declare that the research was conducted in the absence of any commercial or financial relationships that could be construed as a potential conflict of interest.
Publisher’s Note
All claims expressed in this article are solely those of the authors and do not necessarily represent those of their affiliated organizations, or those of the publisher, the editors and the reviewers. Any product that may be evaluated in this article, or claim that may be made by its manufacturer, is not guaranteed or endorsed by the publisher.
Supplementary Material
The Supplementary Material for this article can be found online at: https://www.frontiersin.org/articles/10.3389/fitd.2022.811909/full#supplementary-material
References
1. Taylor MJ. Current Practices in the Management of Lymphatic Filariasis. Expert Rev Anti Infect Ther (2009) 7:595–605. doi: 10.1586/eri.09.36
2. Cromwell EA. Articles The Global Distribution of Lymphatic Filariasi 2000 – 18: A Geospatial Analysis. Articles (2020) 8(9):1186–94. doi: 10.1016/S2214-109X(20)30286-2
3. Ramaiah KD, Ottesen EA. Progress and Impact of 13 Years of the Global Programme to Eliminate Lymphatic Filariasis on Reducing the Burden of Filarial Disease. PloS Neglected Trop Dis (2014) 8(11):e3319. doi: 10.1371/journal.pntd.0003319
4. Manyeh AK, Ibisomi L, Ramaswamy R, Baiden F, Chirwa T. Exploring Factors Affecting Quality Implementation of Lymphatic Filariasis Mass Drug Administration in Bole and Central Gonja Districts in Northern Ghana. PloS Neglected Trop Dis (2020) 14(8):1–23. doi: 10.1371/journal.pntd.0007009
5. Ahorlu CSK, Koka E, Adu-Amankwah S, Otchere J, De Souza DK. Community Perspectives on Persistent Transmission of Lymphatic Filariasis in Three Hotspot Districts in Ghana After 15 Rounds of Mass Drug Administration: A Qualitative Assessment. BMC Public Health (2018) 18(1):1–10. doi: 10.1186/s12889-018-5157-7
6. Biritwum NK, Frempong KK, Verver S, Odoom S, Alomatu B, Asiedu O, et al. Progress Towards Lymphatic Filariasis Elimination in Ghana From 2000-2016: Analysis of Microfilaria Prevalence Data From 430 Communities. PloS Neglected Trop Dis (2019) 13(8):1–15. doi: 10.1371/journal.pntd.0007115
7. WHO. The Global Programme To Eliminate Lymphatic Filariasis: Progess Repor (2018). Available at: http://www.who.int/wer.
8. Gyapong JO, Kyelem D, Kleinschmidt I, Agbo K, Ahouandogbo F, Gaba J, et al. The Use of Spatial Analysis in Mapping the Distribution of Bancroftian Filariasis in Four West African Countries. Ann Trop Med Parasitol (2002) 96(7):695–705. doi: 10.1179/000349802125001735
9. Joseph H, Moloney J, Maiava F, McClintock S, Lammie P, Melrose W. First Evidence of Spatial Clustering of Lymphatic Filariasis in an Aedes Polynesiensis Endemic Area. Acta Tropica (2011) 120(SUPPL. 1):S39–47. doi: 10.1016/j.actatropica.2010.12.004
10. Owusu K, Waylen PR. The Changing Rainy Season Climatology of Mid-Ghana. Theor Appl Climatol (2013) 112(3–4):419–30. doi: 10.1007/s00704-012-0736-5
11. Asante FA, Amuakwa-Mensah F. Climate Change and Variability in Ghana: Stocktaking. Climate (2015) 3(1):78–99. doi: 10.3390/cli3010078
12. IHME. Global Health Data Excahnge. Retrieved From Institute for Health Metrics and Evaluation Website (2020). Available at: http://ghdx.healthdata.org.
13. Gyapong JO, Omane-Badu K, Webber RH. Evaluation of the Filter Paper Blood Collection Method for Detecting Og4C3 Circulating Antigen in Bancroftian Filariasis. Trans R Soc Trop Med Hygiene (1998) 92(4):407–10. doi: 10.1016/S0035-9203(98)91068-9
14. Dunyo SK, Appawu M, Nkrumah FK, Baffoe-Wilmot A, Pedersen EM, Simonsen PE. Lymphatic Filariasis on the Coast of Ghana. Trans R Soc Trop Med Hygiene (1996) 90(6):634–8. doi: 10.1016/S0035-9203%2896%2990414-9
15. WHO. Operational Guidelines for Rapid Mapping of Bancroftian Filariasis in Africa. Ouagadougou: World Health Organization (2000) p. 8–12. Available at: https://apps.who.int/iris/handle/10665/68709.
16. Burgert-Brucker CR, Zoerhoff KL, Headland M, Shoemaker EA, Stelmach R, Karim MJ, et al. Risk Factors Associated With Failing Pre-Transmission Assessment Surveys (pre-TAS) in Lymphatic Filariasis Elimination Programs: Results of a Multi-Country Analysis. PLoS Negl Trop Dis (2020) 14(6):1–17. doi: 10.1371/journal.pntd.0008301
17. WHO. Global Programme to Eliminate Monitoring and of Mass Drug Administration. WHO Website (2019).
18. World Health Organization. Monitoring, Evaluation and Review of National Health Strategies a Country-Led Platform for Information and Accountability. Geneva: World Health Organization. International Health Partnerships (2011). Available at: https://apps.who.int/iris/handle/10665/85877.
19. North MA. A Method for Implementing a Statistically Significant Number of Data Classes in the Jenks Algorithm. 6th Int Conf Fuzzy Syst Knowl Discovery FSKD 2009 (2009) 1:35–8. doi: 10.1109/FSKD.2009.319
20. Moran P. Notes on Continuous Stochastic Phenomena Published by: Biometrika Trust Stable. In: Biometrika, vol. 37. Oxford, England: Oxford University Press (1950). p. 17–23. Available at: http://www.jstor.org/stable/2332142.
21. Getis A. Cliff, ad and ord, jk 1973: Spatial Autocorrelation. London: Pion. Progress in Human Geography (1995) 19(2):245–9. doi: 10.1177/030913259501900205
22. Kulldorff M. Theory and Methods A Spatial Scan Statistic. Commun Stat (1997) 26(6):1481–96. doi: 10.1080/03610929708831995
23. Diggle PJ, Chetwynd AG. Second-Order Analysis of Spatial Clustering for Inhomogeneous Populations. Int Biometric Soc (1991) 47(3):1155–63. doi: 10.2307/2532668
24. Han J, Feuer R, Stinchcomb D. Optimizing Maximum Window Size for Scan Statistics. Graduate School of Yonsei University (2011).
25. Mirghani SE, Nour BY, Bushra SM, Hassan I, Snow RW, Noor AM. The Spatial-Temporal Clustering of Plasmodium Falciparum Infection Over Eleven Years in Gezira State, The Sudan. Malaria J (2010) 9(S2):1–9. doi: 10.1186/1475-2875-9-s2-p65
26. Jung I. Spatial Scan Statistics for Matched Case- Control Data. Plos One (2019) 14(8):1–10. doi: 10.1371/journal.pone.0221225
27. Gangnon RE. Local Multiplicity Adjustment for the Spatial Scan Statistic Using the Gumbel Distribution. Biometrics (2012) 68(1):174–82. doi: 10.1111/j.1541-0420.2011.01643.x
28. Cano J, Rebollo MP, Golding N, Pullan RL, Crellen T, Soler A, et al. The Global Distribution and Transmission Limits of Lymphatic Filariasis: Past and Present. Parasites Vectors (2014) 7(1):1–19. doi: 10.1186/s13071-014-0466-x
29. Asravor J, Wiredu AN, Siddig K, Onumah EE. Evaluating the Environmental-Technology Gaps of Rice Farms in Distinct Agro-Ecological Zones of Ghana. Sustainability (Switzerland) (2019) 11(7):1–16. doi: 10.3390/su11072072
30. Herricks JR, Hotez PJ, Wanga V, Coffeng LE, Buckle G, Budke CM, et al. The Global Burden of Disease Study 2013: What Does it Mean for the NTDs? PloS Neglected Trop Dis (2017) 1–21. doi: 10.1371/journal.pntd.0005424
31. Loukouri A, Méité A, Koudou BG, Goss CW, Lew D, Weil GJ, et al. Impact of Annual and Semi-Annual Mass Drug Administration for Lymphatic Filariasis and Onchocerciasis on Hookworm Infection in Côte D’ivoire. PloS Neglected Trop Dis (2020) 14(9):e0008642. doi: 10.1371/journal.pntd.0008642
32. Nicolas L, Plichart C, Nguyen LN, Moulia-Pelat J-P. Reduction of Wuchereria Bancrofti Adult Worm Circulating Antigen After Annual Treatments of Diethylcarbamazine Combined With Ivermectin in French Polynesia. J Infect Dis (1997) 175(2):489–92. doi: 10.1093/infdis/175.2.489
33. Churcher TS, Pion SDS, Osei-Atweneboana MY, Prichard RK, Awadzi K, Boussinesq M, et al. Identifying Sub-Optimal Responses to Ivermectin in the Treatment of River Blindness. Proc Natl Acad Sci USA (2009) 106(39):16716–21. doi: 10.1073/pnas.0906176106
34. Biritwum N, Yikpotey P, Marfo BK, Odoom S, Mensah EO. Persistent ‘Hotspots’ of Lymphatic Fi Lariasis Micro Fi Laraemia Despite 14 Years of Mass Drug Administration in Ghana. Transact Royal Socf Trop Med Hyg (2017) 110(12):690–5. doi: 10.1093/trstmh/trx007
35. Specht S, Suma TK, Pedrique B, Hoerauf A. Elimination of Lymphatic Filariasis in South East Asia. BMJ (Online) (2019) 364:1–4. doi: 10.1136/bmj.k5198
36. Dean L, Ozano K, Adekeye O, Dixon R, Fung EG, Gyapong M, et al. Neglected Tropical Diseases as a “Litmus Test” for Universal Health Coverage? Understanding Who is Left Behind and Why in Mass Drug Administration: Lessons From Four Country Contexts. PloS Neglected Trop Dis (2019) 13(11):1–26. doi: 10.1371/journal.pntd.0007847
37. de Souza D, Otchere J, Ahorlu C, Adu-Amankwah S, Larbi I, Dumashie E, et al. Low Microfilaremia Levels in Three Districts in Coastal Ghana With at Least 16 Years of Mass Drug Administration and Persistent Transmission of Lymphatic Filariasis. Trop Med Infect Dis (2018) 3(4):105. doi: 10.3390/tropicalmed3040105
38. Ahmed T, Hyder MZ, Liaqat I, Scholz M. Climatic Conditions: Conventional and Nanotechnology-Based Methods for the Control of Mosquito Vectors Causing Human Health Issues. Int J Environ Res Public Health (2019) 16(17):1–25. doi: 10.3390/ijerph16173165
39. Tustingi LS, Gething PW, Gibsoni HS, Greenwoodi B, Knudseni J, Lindsayi SW, et al. Housing and Child Health in Sub-Saharan Africa: A Cross-Sectional Analysis. PloS Med (2020) 17(3):1–18. doi: 10.1371/JOURNAL.PMED.1003055
Keywords: Kulldorff’s SatScan, spatial relative risk, lymphatic filariasis, odds ratios, cluster analysis
Citation: Kwarteng EVS, Osei FB, Andam-Akorful SA, Kwarteng A, Asare D-CBM, Quaye-Ballard JA and Duker AA (2022) Mapping Spatial Variation and Impact of the National MDA Program on Lymphatic Filariasis Elimination in Ghana: An Initial Study. Front. Trop. Dis 3:811909. doi: 10.3389/fitd.2022.811909
Received: 09 November 2021; Accepted: 01 February 2022;
Published: 18 March 2022.
Edited by:
Julian Ruiz-Saenz, Cooperative University of Colombia, ColombiaReviewed by:
Dziedzom Komi de Souza, University of Ghana, GhanaEmmanuel Abraham Mpolya, Nelson Mandela African Institution of Science and Technology, Tanzania
Copyright © 2022 Kwarteng, Osei, Andam-Akorful, Kwarteng, Asare, Quaye-Ballard and Duker. This is an open-access article distributed under the terms of the Creative Commons Attribution License (CC BY). The use, distribution or reproduction in other forums is permitted, provided the original author(s) and the copyright owner(s) are credited and that the original publication in this journal is cited, in accordance with accepted academic practice. No use, distribution or reproduction is permitted which does not comply with these terms.
*Correspondence: Efiba Vidda Senkyire Kwarteng, lynnvid@yahoo.com