Dissolved inorganic nitrogen and phosphorus dynamics in seawater following an artificial Saharan dust deposition event
 Justine Louis
 Matthieu Bressac
 Maria L. Pedrotti
 Cécile Guieu
- 1Sorbonne Universités, Université Pierre et Marie Curie, UMR 7093, Observatoire Océanologique de Villefranche, Laboratoire d'Océanographie de Villefranche-sur-Mer, Villefranche-sur-Mer, France
- 2Centre National de la Recherche Scientifique, UMR 7093, Observatoire Océanologique de Villefranche-sur-Mer, Laboratoire d'Océanographie de Villefranche-sur-Mer, Villefranche-sur-Mer, France
The dynamics of dissolved inorganic nitrogen and phosphorus in seawater after a dust event were followed to better understand the impact of dust deposition in low nutrient waters of the Mediterranean Sea. Three independent abiotic experiments were performed over three seasons (winter, spring, end of summer) characterized by contrasted biogeochemical conditions. Experiments consisted of seeding evapocondensed Saharan dust at the surface of a polyethylene tank filled with filtered surface seawater. Phosphate (PO3−4), nitrate (NO−3), size and number of particles and transparent exopolymeric particles production (TEP) were measured over the course of 1 week following seeding. Dust deposition was followed by a transient increase in [PO3−4] during the first 3 h with a maximum input of 33, 9, and 39 nM, respectively in May, October and February. The removal of almost all the PO3−4 initially released suggests a scavenging process of PO3−4 back onto ferric oxide-rich particles leading to concentrations at the end of the experiment close to the initial values (7 nM in May and October, and 6 nM in February). NO−3 released from dust was high especially in May and October (maximum input of 23 and 11 μM, respectively) and was attributed to nitrogen dissolution from the large amount of small particles (<1 μm) rich in nitrogen in the evapocondensed dust. [NO−3] remained high until the end of the experiment (16 μM in May and 11 μM in October), indicating that NO−3 from dust is likely to be bioavailable for a longer period compared to PO3−4 from dust. The release of PO3−4 and NO−3 was intrinsically linked to particle dynamics, governed by the quality/quantity of dissolved organic matter.
Introduction
Studying the interactions between atmosphere and ocean is essential for better understanding biogeochemical cycles in the ocean, a critical step toward accurate modeling of ocean dynamics under climate and anthropogenic changes (e.g., Law et al., 2013; Liss and Johnson, 2014). With 500 Mt per year of dust deposited to the surface ocean (Law et al., 2013), the atmosphere is a significant pathway for the transport of material from natural and anthropogenic sources to the coastal and open ocean. Atmospheric deposition is a source of external new nutrients to the ocean (i.e., Duce et al., 1991). Over the past decade, a number of studies have investigated post-depositional processes (dissolution, adsorption) of atmospheric nutrients in seawater and the impact of atmospheric deposition on biological activity (i.e., Guieu et al., 2014b). Most of the so-called “dissolution experiments” have been performed in bottles with a constant and homogeneous concentration of particles over the course of the experiment. As exchanges between dissolved and particulate phases occur while the atmospheric particles are sinking in the ocean, results from such “batch” approaches, that do not take into account the vertical dimension, could lead to incorrect quantifications of dissolution/scavenging processes involving atmospheric particles (de Leeuw et al., 2014). Additionally, most studies do not take into consideration the biogeochemical characteristics of the water used in experiments, such as the amount of dissolved organic matter.
Mineral aerosol particles are a dominant source of phosphorus (P) and iron (Fe) to the open ocean as they represent 83% of atmospheric total P and 95% of atmospheric total Fe globally (Jickells et al., 2005; Mahowald et al., 2008, 2009; Krishnamurthy et al., 2010; Liss and Johnson, 2014). Contrary to P and Fe, nitrogen (N) is dominated by anthropogenic emissions in gaseous form which represent 80% of the annual N deposition (67 Tg N yr−1 in 2000) to the global ocean (Duce et al., 2008). Such input could support up to 3% of all oceanic annual new production (Duce et al., 2008) and 20% in regional seas subject to high anthropogenic N deposition such as the South China Sea (Kim et al., 2014). During the transport of dust, in particular in the marine atmosphere where the relative humidity is high, the atmospheric gas HNO3 reacts with mineral particles rich in carbonates and leads to coating of dust by nitrates (Krueger et al., 2004; Formenti et al., 2011). A strong mixing of dust in polluted air masses can allow an enrichment of anthropogenic N on mineral particles that may also become a significant source of N.
New nutrients from the atmosphere such as N, P, and Fe have the potential to impact marine biogeochemistry in Low Nutrient Low Chlorophyll waters (i.e., Guieu et al., 2014a); as is the case in tropical waters where N2 fixation can be co-limited by Fe and P (Mills et al., 2004) and in the Mediterranean Sea where the pelagic community can be limited by the bioavailability of P and N during the stratified period (Tanaka et al., 2011; Ridame et al., 2014).
The Mediterranean Sea, an oligotrophic basin characterized by an unusual high N/P ratio [about 21–23 in Western basin, (Bethoux et al., 1992)] is subjected to high Saharan dust deposition, which can serve as a significant source of new P and Fe to this semi-enclosed basin. Additionally, a strong internal mixing of dust and nitrate from polluted European and North African air masses (e.g., Putaud et al., 2004) by cloud processes implies that Saharan dust events are likely a source of anthropogenic N.
A previous study taking into account the vertical dimension necessary for the study of the fate of atmospheric nutrients in the ocean was carried out in the framework of the DUNE project. Dust seeding over large, clean in situ mesocosms (Guieu et al., 2010, 2014b) showed that a wet deposition event resulted in a strong increase in the N/P ratio in surface waters due to the higher input of NO−3 relative to PO3−4 in the evopocondensed dust used for the experiment (Ridame et al., 2014). Such dust input can either be a source or a sink of dissolved iron (DFe) depending on the biogeochemical conditions of the seawater (Wagener et al., 2010; Ye et al., 2011; Wuttig et al., 2013). Phosphate turnover time (TPO3−4), which represents the ratio between natural concentration and uptake by plankton (Thingstad et al., 1993), are very short in the surface waters of the Mediterranean Sea (e.g., Thingstad et al., 1996; Moutin et al., 2002) making it difficult to observe and follow the fate of new nutrients and to deconvolute biological processes from post-deposition abiotic processes onto dust (i.e., dissolution/adsorption). Therefore, this previously overlooked differentiation is crucial for future modeling of atmospheric nutrients inputs.
A logical follow-up to the DUNE project was to study the fate of new nutrients after a dust deposition in abiotic conditions. As with the previous project, the strategy involved simulated dust depositions, but was performed on top of seawater volumes large enough to take into account the vertical dimension of particle sinking while also eliminating the processes involving living organisms. We performed three experiments in clean “minicosms” filled with 300 L filtered seawater (<0.2 μm). The seawater was collected in the bay of Villefranche-sur-mer during 3 contrasting seasonal scenarios: (1) during winter mixing, (2) immediately after the spring phytoplankton bloom, and (3) at the end of the stratification period during the end of summer. The behavior of the DFe in these experiments, conducted inside a clean room, have been previously presented in Bressac and Guieu (2013). This study revealed contrasted post-deposition processes affecting the DFe concentration [DFe]: during the spring and summer experiments, the rapid formation of aggregates induced a negative feedback on [DFe] through scavenging, while a fraction of DFe was likely organically complexed. During the winter experiment, the absence of aggregation processes led to a large transient increase in [DFe] before being removed by adsorption onto settling particles. These contrasting behaviors were attributed to differences in the quantity and quality of the dissolved organic matter (DOM) in the seawater utilized. This study confirmed that atmospheric iron dissolution in seawater is not controlled by similar processes throughout the year, as it depends on seasonal in situ conditions such as DOM concentration, an outcome previously shown by Wagener et al. (2008). Indeed, during the spring bloom, DOM is more abundant than during winter. It accumulates in the euphotic zone from spring to late summer following the increase in primary and secondary production (Copin-Montégut and Avril, 1993). This fresh DOM is assumed to be labile and mainly composed of acid polysaccharides and sugars thought to serve as precursors to transparent exopolymeric particles (TEP). TEP acts as an organic glue and is required for the formation of sinking aggregates (Kepkay, 2000; Passow, 2000; Beauvais et al., 2003). During summer in the study area, the increase in TEP concentration is consistent with the accumulation of carbon-rich DOM (Avril, 2002), with TEP-C concentrations corresponding to 25% of the total organic carbon (Mari et al., 2001).
We measured the concentration of NO−3 and PO3−4 from samples collected during the same experiments as described in Bressac and Guieu (2013). The objectives of this study are (1) to present PO3−4 and NO−3 results using nanomolar sensitivity analytical techniques and (2) to link the dynamics of PO3−4 and NO−3 to the physical-chemical processes (dissolution, adsorption, and aggregation) (taking into consideration the DOM pool by measuring concentrations of TEP and absorption of the chromophoric DOM) occurring in low-nutrient waters after a dust event in contrasting biogeochemical conditions and, (3) to discuss the potential biogeochemical effect of such atmospheric input in LNLC waters.
Material and Method
Minicosm Experiment
The experimental setup is fully described in Bressac and Guieu (2013). A short summary is given here. A polyethylene (PE) tank (height = 1.09 m; diameter = 0.68 m; surface area = 0.36 m2; volume = 0.31 m3), hereafter called a “minicosm,” was installed in a clean room under controlled light and temperature settings (constant temperature of 20°C). A cover made of high density polyethylene (HDPE) was used to seal the minicosm tightly to avoid light penetration. The minicosm was conical at the bottom, and ended with a sediment trap from which exported material was collected at the end of each experiment. The minicosm was filled with filtered surface seawater collected at 5 m depth from the Bay of Villefranche (Mediterranean Sea) using three trace metal clean Teflon pumps connected to PE tubes. Inline filtration was performed using a 0.2 μm cartridge (Sartorius Sartrobran-P-capsule with a 0.45 μm prefilter and a 0.2 μm final filter) and allowed to directly fill 25 L trace-metal clean HDPE containers that were kept in the dark until the seawater was transferred into the minicosm (less than 4 h for the entire operation). Seawater sampling and subsequent minicosm experiments were performed (1) in May 2011, at the beginning of the water column stratification while the phytoplankton bloom was ending (hereafter referred to as “May”), (2) in October 2011, at the end of the stratification period (“October”), and (3) in February 2012 during winter mixing (“February”) (Figure 1).
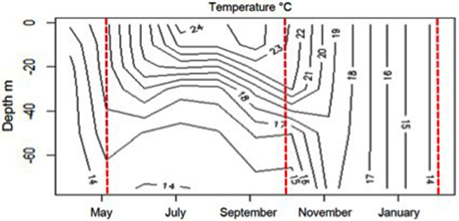
Figure 1. Vertical distribution of temperature (°C) in the 0–70 m depth layer between April 2011 and February 2012 at Bay of Villefranche sur mer (data SOMLIT, http://somlit.epoc.u-bordeaux1.fr/fr/). The red lines correspond to the day when the water was collected in May, October, and February.
The same dust analog used during the DUNE experiments (see details in Guieu et al., 2010) was used to mimic a Saharan dust deposition at the surface of the minicosm. Briefly, the <20 μm fraction of soil collected in Tunisia was used after appropriate physico-chemical treatments in the laboratory, including dust processing with model cloud water to simulate processes during the atmospheric transport of aerosols. The particle number size distribution showed that 99% of particles had a size smaller than 1 μm. The dust analog, mostly made of quartz (40%), calcite (30%), and clay (25%), had the same P (and Fe) content with or without a chemical artificial aging, while concentration content of N was one order of magnitude higher after the dust was chemically processed due to the addition of HNO3 in the simulated cloud water. Fe, N, and P represented 2.31, 1.15, and 0.05% (w/w) of the dust analog (Guieu et al., 2010).
To mimic a Saharan dust wet deposition flux of 10 g m−2 at the minicosm surface (the same flux as during the DUNE experiment), 3.6 g of dust analog was diluted into 2 L of ultrapure water and sprayed at the surface of the minicosm. Sampling was done prior to the seeding, and 1, 3, 6, 12, 16, 24, 31, 48, 72, 96, 120, and 144 h after the seeding. At the end of each experiment, less than 15% of the initial volume of the minicosm (300 L) had been removed for sampling over the course of the experiment. At each sampling time, samples were taken at 0.1, 0.3, and 0.6 m-depths through three sampling tubes with inlets at the center of the minicosm. A system of “float and weight” was linked to the three tubes to keep the sampling depths consistent throughout the experiment (Bressac and Guieu, 2013). Aliquots for the measurements of PO3−4 and NO−3 concentrations ([PO3−4] and [NO−3]) were immediately filtered with acid-cleaned 0.2 μm polycarbonate membrane filters (Nucleopore, Whatman). Filtrates were stored in 60 mL HDPE bottles and acidified to pH 2 (quartz-distilled HCl). The evolution of the particle size distributions, absorption of the chromophoric dissolved organic matter (aCDOM), concentration of TEP [TEP] and [DFe] were also measured in the minicosm over the course of 1 week following seeding; in addition particulate organic carbon (POC) was measured in the material collected from the sediment trap of the minicosms. All those data are available in Bressac and Guieu (2013).
Nano-Molar Levels of Nutrients
PO3−4 and NO−3 were analyzed using two different Liquid Waveguide Capillary Cells (LWCC) made of quartz capillary tubing.
Dissolved Inorganic Phosphorus
We used the same protocol (and equipment), based on Murphy and Riley's molybdenum blue method, as described by Pulido-Villena et al. (2010). Briefly LWCC was connected to a spectrophotometer and the measurements were performed in the visible spectrum at 710 nm. The 2-m length LWCC allowed for a detection limit of 1 nM and a relative standard deviation of less than 10%. The reagents were prepared daily according to the same protocol as in Zhang and Chi (2002) and Zimmer and Cutter (2012).
Dissolved Inorganic Nitrogen
Dissolved inorganic nitrogen (DIN) in seawater is the sum of nitrate (NO−3) plus nitrite (NO−2) and was measured using a 1-m long LWCC. Here, we focus solely on [NO−3] as NO−2 concentrations ([NO−2]) were close to the detection limit in May and October. The analytical setup used was based on several studies (Yao et al., 1998; Zhang, 2000; Adornato et al., 2007; Li et al., 2008). The analysis of NO−3 + NO−2 is based on the spectrophotometric Griess method (Chen et al., 2008). NO−2 absorbance was measured at 540 nm. A further reduction of NO−3 to NO−2 by a copperized cadmium column (Gal et al., 2004) was necessary to quantify NO−3 present in the sample.
The calibration curves were performed using standard solutions in ultrapure water diluting NaNO2 and KNO3 (“high purity” quality), which were previously dried at 60°C for 2 h. We obtained (1) a reduction efficiency between 90 and 96%, (2) a repeatability standard deviation (RSD) of 3% for the reduction process, (3) a detection limit for [NO−2] and [NO−2 + NO−3] of 2 and 9 nmol L−1 after 10 blanks measurements, and (4) a p < 0.01 for Tstudent and ANOVA tests to verify the accuracy and the linear regression of this analytical method. Samples with [NO−3] > 500 nM (outside of the linear range of the calibration curve) were diluted with low [NO−3] seawater.
In the absence of reference seawater at nanomolar concentrations, the reproducibility and the repeatability of the analysis of PO3−4 and NO−3 were controlled by an internal standard (the seawater collected during the experiment of May in the bay of Villefranche sur mer with [PO34] = 3 nM and [NO−3] = 28 nM).
Particle Size Distributions
Particle size distributions of the 0.7–18 μm size range were determined by Coulter Counter (Beckman) using a 30 μm aperture tube. The particle size distribution in number concentration N(D) (part L−1 μm−1) was obtained after 5 replicate measurements and normalized using the extent of each size class as described by Bressac and Guieu (2013). To follow the size evolution of the particles settling, the average particle diameter Davg (μm) was calculated as follows:
where the symbol i corresponds to the different size classes over the 0.7–18 μm size range, Di is the mid-point diameter of a given size class, and nPc = ∑i N(Di) is the total particle concentration over the 0.7–18 μm size range (part L−1 μm−1).
TEP Determination
Transparent exopolymeric particles (TEP) are acidic exopolysaccharides. This fraction can be quantified by spectrophotometry using Alcian blue stain. Samples (300 mL) were filtered through a 0.4 μm polycarbonate filter (Poretic) at low and constant vacuum (<150 mmHg) to preserve cells. Material retained on the filter was stained with 500 μL of an aqueous solution of 0.06% acetic acid (pH 2.5) and 0.02% Alcian blue (Sigma, 8GX). After a few seconds, the filter was dried and rinsed with 1 mL milliQ water, and subsequently stored at –20°C until analysis. TEP concentration was measured according to the dye-binding assay (Passow and Alldredge, 1995), 6 mL of 80% sulfuric acid was added to samples, followed by immediate vortexing. Following incubation at room temperature for 20 h, absorption was measured at 787 nm. TEP values are expressed as xanthan gum weight equivalent (Xequival L−1) calculated by means of a calibration curve. The carbon content of TEP (TEP-C) was estimated from colorimetric determinations according to Engel and Passow (2001).
TEP-C was measured in situ for the 3 experiments. The evolution of the TEP-C after dust addition in the minicosm was followed in samples collected at 0.3 m depth in October and February. No minicosm data is available for the May experiment.
Results
To better understand the relationship between the dynamics of the nutrients and the particles, we took the average values of the 3-depths for each parameter (nPc, Davg, [NO−3], [PO3−4], Δ[NO−3], Δ[PO3−4]); these averages were used for clarity and consistency with Bressac and Guieu (2013). Δ[NO−3] and Δ[PO3−4] represent the release of NO−3 (μM) and PO3−4 (nM) from dust. In effect, these correspond to the difference between [NO−3] and [PO3−4] after dust addition and before dust addition. The 3-depth averages [NO−3] and [PO3−4] are hereafter referred to as [NO−3]avg and [PO3−4]avg.
Initial Conditions at the Three Different Seasons in the Bay of Villefranche
The evolution of the seawater temperature from April 2011 to February 2012 (Figure 1) clearly identifies the stratified period (May and October experiments) and winter mixing (February experiment). In May (Table 1), the seawater was typical of the post-bloom conditions with [Chla] = 0.28 μg L−1, a nutrient depletion ([NO−3] = 28 nM; [PO3−4] = 3 nM) and a high value of [TEP-C] (27.1 μmol C L−1). In October, [NO−3] and [PO3−4] remained very low whereas [Chla] and [TEP-C] decreased (0.13 μg L−1 and 15.4 μmol C L−1, respectively). In February when the whole water column was well-mixed, [NO−3] was one order of magnitude higher compared to May and October (327 nM) whereas [PO3−4] was still low (7 nM). In February, TEP-C had the lowest concentration (2.7 μmol C L−1).
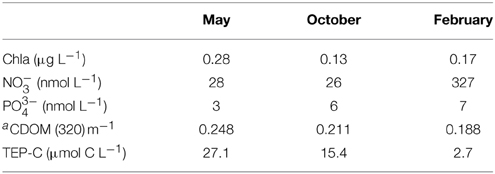
Table 1. Initial conditions (unfiltered water: chlorophyll a, TEP-C; filtered water: nitrate, phosphate) for the three minicosm experiments in May, October and February (in situ values at 5-m depth).
Particle Size Distribution
The evolution of nPc (Figures 2A,B,C) and Davg (Figures 2D,E,F) are presented as the average of the values measured at the three sampling depths. Briefly, a maximum Davg was observed during the first 3 h of the three experiments [1.9 μm at T3 (May), 1.4 μm at T1 (October), and 1.8 μm at T3 (February)], before decreasing and reaching the lowest values at T144 (0.98, 0.95, and 0.91 μm in May, October, and February, respectively). The decreases in Davg were concomitant with marked increases in nPc, which were observed particularly in May and October (Figures 2A,B,D,E). In May between T12 and T31, nPc increased from 6.4 × 10⁸ to 1.9 × 10¹⁰ part L−1 μm−1, and in October nPc increased from 2.9 × 10⁹ to 3.7 × 10¹⁰ part L−1 μm−1 between T6 and T12. After reaching a maximum, nPc decreased slightly but remained high until the end of both experiments (1.1 × 10¹⁰ and 1.5 × 10¹⁰ in May and October, respectively at T144). In February, a one order of magnitude increase in nPc was observed at the end of the experiment between T96 and T144 (4.5 × 10⁹ to 3.5 × 10¹⁰) whereas Davg was ~1 μm. This pool of submicron particles corresponding to the lower size range of the dust population, are numerically dominant (cf. Section Minicosm Experiment).
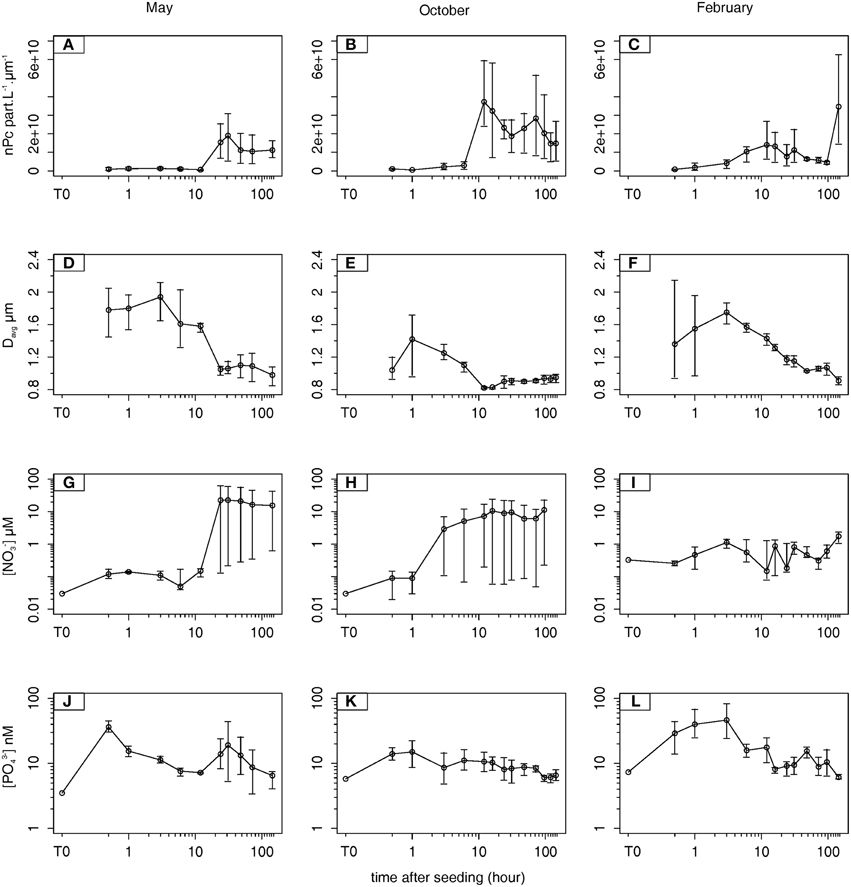
Figure 2. Temporal evolution of the 3-depths averaged number of particles (nPc, part L−1 μm−1) (A, B, C), the 3-depths averaged diameter of particles (Davg, μm) (D, E, F), the 3-depths averaged nitrate concentrations ([NO−3]avg, μmol L−1) (G, H, I), and the 3-depths averaged phosphate concentrations ([PO3−4]avg, nmol L−1) (J, K, L) during May, October, and February. The error bars correspond to the maximum (top) and minimum (bottom) value (see Supplementary Material).
Evolution of Nitrate Concentrations
In May, [NO−3]avg increased from 0.03 to 0.12 μM between T0 and T0.5, and the largest increase was observed at T31 (Figure 2G) with Δ[NO−3]max ([NO−3]avg max – [NO−3]avg T0) reaching 23 μM. This increase was concomitant with the increase in nPc (Figure 2A). [NO−3]avg released from dust was high with Δ[NO−3]end ([NO−3]avg T144 – [NO−3]avg T0) = 16 μM. In October the release of NO−3 was faster but lower than in May (Figure 2H), with a large increase in [NO−3]avg that started 1 h after dust addition and a Δ[NO−3]max of 11 μM measured at T16. Simultaneously, Davg decreased between T1 and T12 (Figure 2E). As in May, [NO−3]avg remained stable until the end of the experiment (Δ[NO−3]end = 11 μM). In February Δ[NO−3]max was the lowest among the three experiments (1.4 μM) and occurred at the end of the experiment when nPc was maximum (Figures 2C,I).
The dust addition allowed a maximum change in NO−3 stock of +19.2, +9.2, and +1.2 mmol m−2 in May, October, and February, respectively (Figure 3).
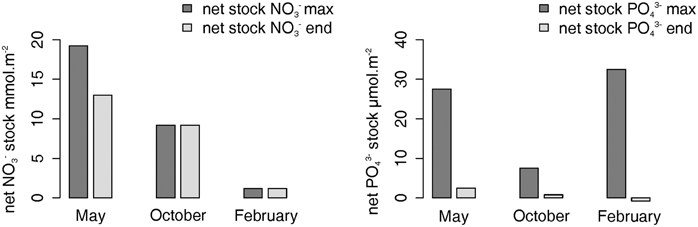
Figure 3. Mean integrated [NO−3] in mmol m−2 (left) and mean integrated [PO3−4] in μmol m−2 (right) over minicosm in May, October, and February. The dark gray bar represents the maximum change in NO−3 and PO3−4 stocks (= the difference in nutrient stock when the nutrient release was maximum compared to the initial stock); the light gray bar represents the change in NO−3 and PO3−4 stocks at the end of each experiment (= the difference in nutrient stock between the final and the initial stock).
Evolution of Phosphate Concentrations
For all seasons, the release of PO3−4 occurred mainly during the first 3 h after dust addition following the Davg pattern (Figures 2D,E,F,J,K,L). Δ[PO3−4]max ([PO3−4]avg max – [PO3−4]avg T0) were 33, 9, and 39 nM in May (T0.5), October (T1), and February (T3), respectively. In October and February, [PO3−4]avg released from dust was totally removed since [PO3−4]avg at the end of both experiments (7 and 6 nM, respectively) was close to the initial value (±1 nM). In May, after a decrease in [PO3−4]avg between T0.5 and T12 (from 36 to 7 nM), a second increase in [PO3−4]avg was observed at T31 (19 nM) and then continually decreased until the end of the experiment when Δ[PO3−4]end ([PO3−4]avg T144 – [PO3−4]avg T0) was 4 nM.
The dust addition allowed a maximum change in PO3−4 stock of +27.2, +7.5, and +32.5 μmol m−2 in May, October, and February, respectively (Figure 3). Six days after seeding, the PO3−4 stock was +2.5 μmol m−2 (May), +0.8 μmol m−2 (October), and –0.8 μmol m−2 (February) compared with the initial PO3−4 stock (Figure 3).
Evolution of TEP-C Concentrations
In October, after the dust addition, the TEP-C concentration increased from 0.4 to 5.0 μmol C L−1 between T0 and T0.5 and the largest increase (10.3 μmol C L−1) was observed 24 h after, with concentrations close to the level of those observed in situ (15.4 μmol C L−1). After TEP was completely removed by filtration, almost the same amount of TEP was formed by precursors 1 day after the dust addition. Afterward the TEP concentration decreased to ~3.2 μmol C L−1 until the end of the experiment (Figure 4). In February, the rate of TEP formation was slower than in October with an increase in production (6.9 μmol C L−1) 6 h after dust addition (Figure 4), then the TEP concentration decreased until the end of the experiment.
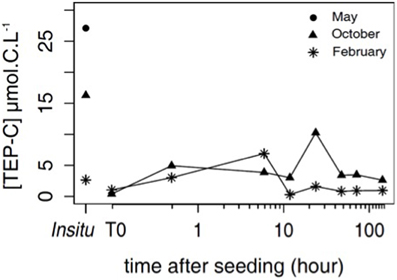
Figure 4. TEP-C concentration [TEP-C] (μmol C L−1) in situ in May (circle), October (triangle), and February (star), and temporal evolution of [TEP-C] in October and February after dust seeding.
Discussion
Release of Phosphate and Nitrate Controlled by Particle Dynamics
99% of the number of dust particles used to seed the minicosm were submicronic particles (Guieu et al., 2010). According to Stokes' law, the settling velocities of particles are a function of their diameter and we expected the settling of largest particles rapidly after dust addition, followed by a numerically dominant slowly settling particle population with a diameter smaller than 1 μm. This is illustrated by Figures 2A,B,C,D,E,F as an increase in Davg during the first 3 h after dust addition, followed by a decrease in Davg until the end of the three experiments, while a concomitant increase in nPc was also observed.
Nitrate vs. Particle Size Dynamics
For all seasons, Δ[NO−3]max was measured when the submicron mineral particles were abundant, i.e., high nPc and Davg smaller than 1 μm. This is in agreement with heterogeneous reactions on the surface of mineral particles in the atmosphere. Indeed, during the atmospheric transport of Saharan dust, heterogeneous reactions with compounds such as gaseous nitric acid occur on particle surfaces rich in calcium carbonate (Usher et al., 2003; de Leeuw et al., 2014). These reactions facilitate formation of nitrate coatings on particle surfaces (Laskin, 2005). The observed decrease in Davg led to an increase in the overall surface area to volume ratio, and thus an increase in the relative amount of NO−3 on the dust surface (Vlasenko et al., 2005).
Phosphate vs. Particle Size Dynamics
An increase in [PO3−4]avg occurred during the first 3 h after dust addition while the largest mineral particles were settling down. Such a fast release is in agreement with previous batch experiments indicating that 65% of the PO3−4 release occurred within the first 6 h (Ridame and Guieu, 2002). Despite a similar simulated dust flux of 10 g m−2 for each experiment, the maximum increase in PO3−4 stock was lower in October than in May and February (Figure 3). The lowest Davg in October (Figure 2E) suggests that the non-homogeneous distribution of mineral particles controlled the release of PO3−4 from dust.
Adsorption of Phosphate onto Ferric Oxide-Rich Particles and Link between DFe and PO3−4
After the dust addition, there was a sudden transient increase in [PO3−4]avg attributed to a release from the largest particles, followed by a decrease in [PO3−4]avg for the three experiments corresponding to the decrease in Davg (Figures 2D,E,F,J,K,L). In abiotic conditions, such a decrease can be attributed to the removal process of adsorption of freshly released PO3−4 onto the submicron sinking particles. Almost all [PO3−4] released from dust was scavenged-back onto sinking particles within few days.
Correlation between DFe and PO3−4
When comparing the respective evolutions of [DFe] (Bressac and Guieu, 2013) and [PO3−4] (Figure 5), a good correlation (R2 = 0.91, p < 0.001) was observed in February indicating that the post-depositional processes (both dissolution and removal processes) could be similar for the two elements. In February, DFe dissolution was very fast (occurring during the first 3 h after seeding) and was followed by DFe adsorption onto the submicron mineral particles (Bressac and Guieu, 2013). Strong correlation between DFe and PO3−4 in February indicates that both DFe and PO3−4 removal from seawater was due to their adsorption back onto the submicron mineral particles.
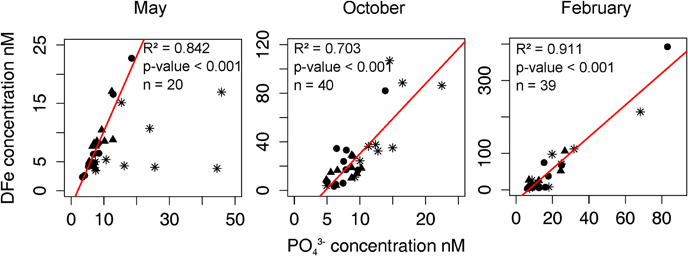
Figure 5. Linear regression (red line) between the phosphate concentration [PO3−4] and the concentration of dissolved iron [DFe] in May, October, and February (DFe data from Bressac and Guieu, 2013). The p-value is determined by ANOVA. The star, triangle, and circle symbols represent, respectively the concentration of PO3−4 and DFe at 0.1, 0.3, and 0.6 m depths.
In May, a good linear relationship (R2 = 0.84) between [DFe] and [PO3−4] was only observed at 0.3 and 0.6 m but not at 0.1 m-depth. At 0.1 m, DFe release in seawater was found to be controlled by a dust-DOM aggregation process (Bressac and Guieu, 2013). The aggregation process likely resulted in a decrease in accessibility to surface adsorption sites. While DFe, for which some dissolved organic compounds have a strong affinity (Van den Berg, 1995; Barbeau, 2006), was removed from the dissolved phase, PO3−4 was likely not affected by the aggregation process. At 0.3 and 0.6 m, the positive linear correlation seems to indicate that the removal of both PO3−4 and DFe from seawater was independent of dust-DOM aggregation but rather controlled by adsorption processes onto the submicron mineral particles, similar to what was hypothesized for February.
In October, the correlation between the two nutrients (at the 3-depths) was weaker than in February (R2 = 0.70), but still significant (p < 0.001). This could be explained by the dust-DOM aggregation process still present but weaker than in May (Bressac and Guieu, 2013).
Adsorption of PO3−4 onto the Submicron Particles Rich in Iron Oxide
Based on previous studies of the interaction between iron oxides and PO3−4, the observed removal of PO3−4 was likely due to the strong PO3−4 adsorption capacity at the surface of the mineral particles rich in iron oxides. Berner (1973) focused on the PO3−4 removal from seawater by the adsorption capacity of the volcanogenic iron oxides and suggested PO3−4 can react with poorly crystallized hydrous iron oxides. Sei et al. (2002) showed the presence of iron oxides in kaolinite with a large specific surface area enhanced PO3−4 adsorption, while Parfitt and Atkinson (1976) confirmed the complex involved in PO3−4 adsorption on goethite was of the type Fe-O-P-O-Fe.
The dissolved-particulate exchanges of phosphorus from dust are controlled by iron oxide rich particles. We assume that the dust-DOM aggregation process, occurring particularly in May, could prevent the interaction between PO3−4 and iron oxide at the surface of mineral particles, and could explain the second transient increase in [PO3−4] (Figure 2J).
The Seasonal Variability of Nitrate Input from Saharan Dust: Does the DOM Matter?
By taking into account the vertical dimension and thus the temporal variability of the distribution of mineral particles, our minicosm approach showed that the release of NO−3 was not instantaneous or total after dust addition. This differs from results presented by Ridame et al. (2014) who conducted a batch dissolution experiment using the same dust analog but in artificial DOM-free seawater. This study showed a complete dissolution of NOx occurred within 3 h after dust addition (Ridame et al., 2014).
Here we found a strong variability of NO−3 dissolution from dust at the 3 explored seasons (the difference between nutrient stock when NO−3 release was maximum and initial stock were 19.2, 9.2, and 1.2 mmol m−2 in May, October, and February, respectively) (Figure 3). One possibility for the observed variability could be a link between NO−3 dissolution and the quantity and quality of DOM described by Bressac and Guieu (2013). Indeed, it was quite variable according to the season: in May (post-bloom condition), the seawater was characterized by an abundant and newly produced DOM, whereas in February (winter mixing), the DOM was less abundant and likely older (Table 1). Although to our knowledge such link has not been proposed in the ocean, some interesting hypotheses can be made. Bressac and Guieu (2013) showed that [DFe] resulted from contrasted post-deposition processes linked to the DOM pool. In May and October, with abundant and newly produced DOM conditions, the rapid formation of aggregates inducing a negative feedback on the [DFe] through scavenging, while a fraction of the DFe was likely organically complexed. In February, the low DOM content strongly limited aggregation allowing a strong iron dissolution that was followed by the (re)adsorption of DFe onto the submicron dust particles. This suggests that in February the submicron mineral particles would be richer in iron oxides than in May in the first few hours after seeding. The same particles would release 10–20 times less NO−3 compared to any other season (see above Section). One possible explanation could be that some reactions involving iron and DOM could transform the chemical form of N following “the ferrous wheel hypothesis” as defined Davidson et al. (2003) to explain abiotic immobilization of N in mineral soils rich in iron. This would involve a reduction of NO−3 to NO−2 by a redox reaction with Fe(III) and a nitration reaction with DOM to transform NO−2 to dissolved organic nitrogen (DON). This is speculative, however, because DON was not measured in our study. Nevertheless, the link between NO−3 and DOM in the ocean still need further investigations to explore these potentially important dynamics.
Biogeochemical Effects
Bioavailability of Atmospheric Nutrients
At initial conditions, the NO−3/PO3−4 ratio suggests P-limitation conditions for phytoplankton activity in February (NO−3/PO3−4 >> 16) and a NP co-limitation in May and October (NO−3/PO3−4 << 16 with low [PO3−4]) (Table 1). These results are in agreement with the results presented by Tanaka et al. (2011) for summer conditions at “station A” (39°5.96′N, 5°21.00′E) in the North Western Mediterranean basin.
A N or NP co-limitation with initial NO−3/PO3−4 < 6 and low [PO3−4] was also found in June 2010 [DUNE 2 (R1), (Ridame et al., 2014)] and is comparable to our initial conditions in May and October. At the end of the DUNE 2 (R1) mesocosms experiment, the NO−3/PO3−4 ratio was >150 which led to P limitation conditions. In the present study, we also observed a strong increase in the NO−3/PO3−4 ratio along the course of the experiments in May and October due to the higher input of NO−3 relative to PO3−4 in the evapocondensed dust used for the experiment.
This is in good agreement with higher NO−3/PO3−4 in atmospheric deposition compared to the classical Redfield Ratio (i.e., Herut et al., 1999, 2002; Baker et al., 2010; Markaki et al., 2010). In the Mediterranean Sea ratio up to 87 were found in seawater leachable dust samples (Herut et al., 2002) and ratio in total atmospheric deposition ranging 46–161 were found over the whole Mediterranean Sea (Markaki et al., 2010). Much higher ratio have even been found in the NW Mediterranean Sea for very intense anthropogenic episodes (soluble inorganic N/soluble inorganic P > 1000; Sandroni et al., 2007). Such unbalanced NO−3/PO3−4 in the atmospheric deposition, including dust deposition, likely contribute to the unusual NO−3/PO3−4 found in the Mediterranean Sea as hypothesized by many authors (i.e., Herut et al., 1999; Markaki et al., 2010).
The results obtained in this abiotic study along with those obtained from mesocosm experiments representing the natural environmental assemblage can facilitate a better understanding of the fate of atmospheric nutrients in LNLC waters. For example, our May experiment can be compared to in situ results obtained during the DUNE-1-P and DUNE-2 (R1) mesocosm experiments (Pulido-Villena et al., 2014; Ridame et al., 2014). This mesocosm experiment was conducted in a nutrient-depleted system during the stratification period. NO−3 and PO3−4 released from dust after the simulation of a wet deposition, was followed by an increase in bacteria respiration (Pulido-Villena et al., 2014) and primary production (Ridame et al., 2014). The phytoplankton PO3−4requirements estimated in DUNE-1-P and DUNE-2 (R1) were +25 and +18 μmol m−2, respectively (Ridame et al., 2014). The increase in PO3−4 stock in May (+27 μmol m−2, Figure 3) was of the same order of magnitude as for the transient increase observed in DUNE-1-P (+21 μmol m−2) and DUNE-2 (R1) (+24 μmol m−2) experiments (Ridame et al., 2014). This indicates first that PO3−4 release from dust can fulfill the phytoplankton requirement. Second, the fast disappearance of the PO3−4 following its release from dust in the mesocosm experiment was due to the rapid uptake (PO3−4 turnover times were estimated to be ~1 h using a 33P uptake technique on the upper stratified water of the Mediterranean sea, Moutin et al. 2002) resulting in a fast increase (within 2 days) in bacteria respiration and primary production by heterotroph/autotroph communities that characterize this oligotrophic system. This suggests that biological uptake was faster than the adsorption of PO3−4 back onto the submicron particles rich in iron oxide observed in abiotic conditions (Section Adsorption of Phosphate onto Ferric Oxide-Rich Particles and Link between DFe and PO3−4). The large increase in NO−3 stock after dust addition [+19.2 and +10.2 mmol m−2, respectively in May and DUNE-2 (R1) experiments] was much higher than the phytoplankton NO−3 requirement [0.7 and 0.8 μmol m−2 in DUNE-1-P and DUNE-2 (R1), respectively, (Ridame et al., 2014)] and this explains that a large amount of NO−3 released from dust remained bioavailable until the end of the DUNE experiments.
In February, phytoplankton growth is primarily limited by the light availability (Bonilla-Findji et al., 2010), and PO3−4 released from a dust event would rapidly be removed by the adsorption process onto sinking mineral particles. Nevertheless, with favorable weather conditions the rapid release of PO3−4 and DFe (Bressac and Guieu, 2013) from dust could stimulate biological activity during months characterized by low irradiance.
Abiotic Formation of TEP
Owing to their surface-reactive nature, the abiotic formation of TEP is an important pathway to convert dissolved into POC (Figure 4) increasing the possibility to aggregate DOM. The organic aggregates can interact with the mineral particles and lead to “abiotic POC export” that influences carbon export to the deep ocean (Ternon et al., 2010). The highest flux of abiotic POC was found in May [20.0 mg m−2.d−1, compared to 9.6 and 6.1 mg m−2.d−1 in October and February, respectively (Bressac and Guieu, 2013)] and suggests that this month has the largest abiotic formation of TEP. The consequences of such strong aggregation and export, in particular on the microbial food web, are unknown.
Conclusion
Minicosm experiments mimicking artificial dust deposition in abiotic conditions were performed during three seasons representing contrasted biogeochemical conditions. Monitoring [NO−3] and [PO3−4] during particle settling highlighted the link between dissolved-particulate exchanges of P and N and particle dynamics. A transient increase in [PO3−4] occurred during the first 3 h after dust addition while the larger particles were still settling. The maximum 3-depths averaged PO3−4 release was 33, 9, and 39 nM in May, October, and February, respectively.
The maximum 3-depths averaged NO−3 release was 23, 11, and 1.4 μM in May, October, and February experiments, respectively. [NO−3] released from dust remained relatively stable and will be likely bioavailable over a 1 week scale at minimum in surface waters. This could be important because in May and October this represents 10–30 times the maximum [NO−3] concentrations observed in the North Mediterranean Sea (2–3 μmol L−1 in winter) (Marty et al., 2002). The seasonal variability of [NO−3] released from dust suggests that freshly produced DOM would enhance the dissolution process of NO−3 (as is the case for the May experiment after the spring bloom). This link between atmospheric NO−3 and DOM will require further exploration.
The adsorption back onto ferric oxide-rich particles of PO3−4 released from dust leads to short-term bioavailability. The dust-DOM aggregation process could hinder the interaction between PO3−4 and iron oxide at the surface of mineral particles. The input of new nutrients and the possible shift toward higher NO−3/PO3−4 ratios induced by a Saharan dust event mixed with anthropogenic nitrogen have a potential impact on the autotrophic and heterotrophic communities in Mediterranean Sea and other oligotrophic areas receiving such inputs.
This work demonstrates the importance of taking into account the settling of particles while the dissolved/particulate phase reactions occur, as these new nutrient dynamics are intrinsically linked to particle dynamics. Additionally, particle dynamics are conditioned by the quality/quantity of DOM, suggesting that the post-deposition processes of NO−3 and PO3−4 are likely indirectly linked to the quality/quantity of DOM. Consequently, the seasonality of the quality/quantity of DOM implies a non-constant potential impact of atmospheric new nutrients in the surface waters over the course of the year. The next step of this work will be to consider how on-going environmental changes (such as temperature increase and pH decrease) affect the release of atmospheric nutrients, including organic forms.
Conflict of Interest Statement
The authors declare that the research was conducted in the absence of any commercial or financial relationships that could be construed as a potential conflict of interest.
Acknowledgments
This work was funded by the MISTRALS/MERMEX project and the CHIPIE-EMERGENCE-UPMC project. A grant provided by the University of Paris 6 supported JL. A grant provided by the ACRI-ST company and the French National Association for Research and Technology (ANRT) supported MB. The authors thank K. Desboeufs and F. Dulac for providing the Saharan dust analog. J.-Y. Carval from the Observatoire d'Océanologie de Villefranche sur mer is acknowledged for his helpful work at sea. We thank our colleagues from SOMLIT (http://somlit.epoc.u-bordeaux1.fr/fr/) for providing the in situ temperature and Chla data. The authors thank C. Ridame for her constructive comments on a previous version of the manuscript and K. Frischkorn for kindly editing the manuscript.
Supplementary Material
The Supplementary Material for this article can be found online at: https://www.frontiersin.org/article/10.3389/fmars.2015.00027/abstract
References
Adornato, L. R., Kaltenbacher, E. A., Greenhow, D. R., and Byrne, R. H. (2007). High-resolution in situ analysis of nitrate and phosphate in the oligotrophic ocean. Environ. Sci. Technol. 41, 4045–4052. doi: 10.1021/es0700855
Avril, B. (2002). DOC dynamics in the northwestern Mediterranean Sea (DYFAMED site). Deep-sea Res. II Top. Stud. Oceanogr. 49, 2163–2182. doi: 10.1016/S0967-0645(02)00033-4
Baker, A. R., Lesworth, T., Adams, C., Jickells, T. D., and Ganzeveld, L. (2010). Estimation of atmospheric nutrient inputs to the Atlantic Ocean from 50 N to 50 s based on large-scale field sampling: fixed nitrogen and dry deposition of phosphorus. Global. Biogeochem. Cycles 24, GB3006. doi: 10.1029/2009GB003634
Barbeau, K. (2006). Photochemistry of organic iron (III) complexing ligands in oceanic systems. Photochem. Photobiol. 82, 1505–1516. doi: 10.1111/j.1751-1097.2006.tb09806.x
Beauvais, S., Pedrotti, M. L., Villa, E., and Lemée, R. (2003). Transparent exopolymer particle (TEP) dynamics in relation to trophic and hydrological conditions in the NW Mediterranean Sea. Mar. Ecol. Prog. Ser. 262, 97–109. doi: 10.3354/meps262097
Berner, R. A. (1973). Phosphate removal from sea water by adsorption on volcanogenic ferric oxides. Earth Planet. Sci. Lett. 18, 77–86. doi: 10.1016/0012-821X(73)90037-X
Bethoux, J. P., Morin, P., Madec, C., and Gentili, B. (1992). Phosphorus and nitrogen behaviour in the Mediterranean Sea. Deep Sea Res. A Oceanogr. Res. Pap. 39, 1641–1654. doi: 10.1016/0198-0149(92)90053-V
Bonilla-Findji, O., Gattuso, J. P., Pizay, M.D., and Weinbauer, M. G. (2010). Autotrophic and heterotrophic metabolism of microbial planktonic communities in an oligotrophic coastal marine ecosystem: seasonal dynamics and episodic events. Biogeosciences 7, 3491–3503. doi: 10.5194/bg-7-3491-2010
Bressac, M., and Guieu, C. (2013). Post-depositional processes: what really happens to new atmospheric iron in the ocean's surface? Global Biogeochem. Cycles 27, 859–70. doi: 10.1002/gbc.20076
Chen, G., Yuan, D., Huang, Y., Zhang, M., and Bergman, M. (2008). In-field determination of nanomolar nitrite in seawater using a sequential injection technique combined with solid phase enrichment and colorimetric detection. Anal. Chim. Acta 620, 82–88. doi: 10.1016/j.aca.2008.05.019
Copin-Montégut, G., and Avril, B. (1993). Vertical distribution and temporal variation of dissolved organic carbon in the North-Western Mediterranean Sea. Deep Sea Res. Part I Oceanogr. Res. Pap. 40, 1963–1972. doi: 10.1016/0967-0637(93)90041-Z
Davidson, E.A., Chorover, J., and Dail, D. B. (2003). A mechanism of abiotic immobilization of nitrate in forest ecosystems: the ferrous wheel hypothesis. Glob. Change Biol. 9, 228–236. doi: 10.1046/j.1365-2486.2003.00592.x
de Leeuw, G., Guieu, C., Arneth, A., Bellouin, N., Bopp, L., Boyd, P. W., et al. (2014). “Ocean–atmosphere interactions of particles,” in Ocean-Atmosphere Interactions of Gases and Particles, eds S. Peter Liss and T. Martin Johnson (Berlin; Heidelberg: Springer Earth System Sciences Springer), 171–246. Available online at: http://link.springer.com/chapter/10.1007/978-3-642-25643-1_4
Duce, R. A., LaRoche, J., Altieri, K., Arrigo, K. R., Baker, A. R., Capone, D. G., et al. (2008). Impacts of atmospheric anthropogenic nitrogen on the open ocean. Science 320, 893–897. doi: 10.1126/science.1150369
Duce, R. A., Liss, P. S., Merrill, J. T., Atlas, E. L., Buat-Menard, P., Hicks, B. B., et al. (1991). The Atmospheric input of trace species to the World Ocean. Global Biogeochem. Cycles 5, 193–259. doi: 10.1029/91GB01778
Engel, A, and Passow, U. (2001). Carbon and Nitrogen Content of Transparent Exopolymer Particles (TEP) in relation to their alcian blue adsorption. Mar. Ecol. Prog. Ser. 219, 1–10. doi: 10.3354/meps219001
Formenti, P., Schütz, L., Balkanski, Y., Desboeufs, K., Ebert, M., Kandler, K. A., et al. (2011). Recent progress in understanding physical and chemical properties of African and Asian mineral dust. Atmos. Chem. Phys. 11, 8231–8256. doi: 10.5194/acp-11-8231-2011
Gal, C., Frenzel, W., and Mïller, J. (2004). Re-examination of the cadmium reduction method and optimisation of conditions for the determination of nitrate by flow injection analysis. Microchimica Acta 146, 155–164. doi: 10.1007/s00604-004-0193-7
Guieu, C., Aumont, O., Paytan, A., Bopp, L., Law, C. S., Mahowald, N., et al. (2014a). The significance of the episodic nature of atmospheric deposition to low nutrient low chlorophyll regions. Global Biogeochem. Cycles 28, 1179–1198. doi: 10.1002/2014GB004852
Guieu, C., Dulac, F., Desboeufs, K., Wagener, T., Pulido-Villena, E., Grisoni, J.-M., et al. (2010). Large clean mesocosms and simulated dust deposition: a new methodology to investigate responses of marine Oligotrophic Ecosystems to atmospheric inputs. Biogeosciences 7, 2765–2784. doi: 10.5194/bg-7-2765-2010
Guieu, C., Dulac, F., Ridame, C., and Pondaven, P. (2014b). Introduction to Project DUNE, a DUst experiment in a low nutrient, Low Chlorophyll Ecosystem. Biogeosciences 11, 425–442. doi: 10.5194/bg-11-425-2014
Herut, B., Collier, R., and Krom, M. D. (2002). The role of dust in supplying nitrogen and phosphorus to the Southeast Mediterranean. Limnol. Oceanogr. 47, 870–878. doi: 10.4319/lo.2002.47.3.0870
Herut, B., Krom, M. D., Pan, G., and Mortimer, R. (1999). Atmospheric input of nitrogen and phosphorus to the Southeast Mediterranean: sources, fluxes, and possible impact. Limnol. Oceanogr. 44, 1683–1692. doi: 10.4319/lo.1999.44.7.1683
Jickells, T. D., An, Z. S., Andersen, K. K., Baker, A. R., Bergametti, G., Brooks, N., et al. (2005). Global iron connections between desert dust, ocean biogeochemistry, and climate. Science 308, 67–71. doi: 10.1126/science.1105959
Kepkay, P. E. (2000). “Colloids and the Ocean carbon cycle,” in Marine Chemistry. The Handbook of Environmental Chemistry 5D, ed P. J.Wangersky (Berlin Heidelberg: Springer) 35–56. Available online at: http://link.springer.com/chapter/10.1007/10683826_2
Kim, T.-W., Lee, K., Duce, R., and Liss, P. (2014). Impact of atmospheric nitrogen deposition on phytoplankton productivity in the South China Sea. Geophys. Res. Lett. 41, 3156–3162. doi: 10.1002/2014GL059665
Krishnamurthy, A., Moore, J. K., Mahowald, N., Luo, C., and Zender, C. S. (2010). Impacts of atmospheric nutrient inputs on Marine biogeochemistry. J. Geophys. Res. 115, G01006. doi: 10.1029/2009JG001115
Krueger, B. J., Grassian, V. H., Cowin, J. P., and Laskin, A. (2004). Heterogeneous chemistry of individual mineral dust particles from different dust source regions: the importance of particle mineralogy. Atmos. Environ. 38, 6253–6261. doi: 10.1016/j.atmosenv.2004.07.010
Laskin, A. (2005). Heterogeneous Chemistry of individual mineral dust particles with Nitric Acid: a combined CCSEM/EDX, ESEM, and ICP-MS Study. J. Geophys. Res. 110, D10208. doi: 10.1029/2004JD005206
Law, C. S., Brévière, E., de Leeuw, G., Garçon, V., Guieu, C., Kieber, D. J., et al. (2013). Evolving Research Directions in Surface Ocean - Lower Atmosphere (SOLAS) Science. Environ.Chem. 10, 1. doi: 10.1071/EN12159
Li, Q. P., Hansell, D. A., and Zhang, J.-Z. (2008). Underway monitoring of nanomolar nitrate plus nitrite and phosphate in oligotrophic seawater. Limnol. Oceanogr. Methods 6, 319–326. doi: 10.4319/lom.2008.6.319
Liss, P. S., and Johnson, M. T. (eds.). (2014). Ocean-Atmosphere Interactions of Gases and Particles. (Berlin, Heidelberg: Springer Berlin Heidelberg). Available online at: http://link.springer.com/10.1007/978-3-642-25643-1
Mahowald, N., Jickells, T. D., Baker, A. R., Artaxo, P., Benitez-Nelson, C. R., Bergametti, G., et al. (2008). Global distribution of atmospheric phosphorus sources, concentrations and deposition rates, and anthropogenic impacts. Global Biogeochem.Cycles 22, GB4026. doi: 10.1029/2008GB003240
Mahowald, N. M., Engelstaedter, S., Luo, C., Sealy, A., Artaxo, P., Benitez-Nelson, C., et al. (2009). Atmospheric iron deposition: global distribution, variability, and human perturbations. Ann. Rev. Mar. Sci. 1, 245–278. doi: 10.1146/annurev.marine.010908.163727
Mari, X., Beauvais, S., Lemée, R., and Pedrotti, M. L. (2001). Non-Redfield C: N ratio of transparent exopolymeric particles in the northwestern Mediterranean Sea. Limnol. Oceanogr. 46, 1831–1836. doi: 10.4319/lo.2001.46.7.1831
Markaki, Z., Loÿe-Pilot, M. D., Violaki, K., Benyahya, L., and Mihalopoulos, N. (2010). Variability of Atmospheric deposition of dissolved Nitrogen and Phosphorus in the Mediterranean and Possible Link to the Anomalous Seawater N/P Ratio. Mar. Chem. 120, 187–194. doi: 10.1016/j.marchem.2008.10.005
Marty, J.-C., Chiavérini, J., Pizay, M.-D., and Avril, B. (2002). Seasonal and interannual dynamics of nutrients and phytoplankton pigments in the western Mediterranean Sea at the DYFAMED time-series station (1991–1999). Deep Sea Res. Part II Top. Stud. Oceanogr. 49, 1965–1985. doi: 10.1016/S0967-0645(02)00022-X
Mills, M. M., Ridame, C., Davey, M., La Roche, J., and Geider, R. J. (2004). Iron and Phosphorus Co-Limit Nitrogen fixation in the Eastern Tropical North Atlantic. Nature 429, 292–294. doi: 10.1038/nature02550
Moutin, T., Thingstad, T. F., Van Wambeke, F., Marie, D., Slawyk, G., Claustre, H., et al. (2002). Does competition for nanomolar phosphate supply explain the predominance of the cyanobacterium Synechococcus?. Limnol. Oceanogr. 47, 1562–1567. doi: 10.4319/lo.2002.47.5.1562
Parfitt, R. L., and Atkinson, R. J. (1976). Phosphate Adsorption on Goethite (α-FeOOOH). Nature 264, 740–742. doi: 10.1038/264740a0
Passow, U. (2000). Formation of transparent exopolymer particles, TEP, from dissolved precursor material. Mar. Ecol. Prog. Ser. 192, 1–11. doi: 10.3354/meps192001
Passow, U., and Alldredge, A. L. (1995). A dye-binding assay for the spectrophotometric measurement of transparent exopolymer particles (TEP). Limnol. Oceanogr. 40, 1326–1335. doi: 10.4319/lo.1995.40.7.1326
Pulido-Villena, E., Baudoux, A.-C., Obernosterer, I., Landa, M., Caparros, J., Catala, P., et al. (2014). Microbial food web dynamics in response to a Saharan Dust event: results from a mesocosm study in the Oligotrophic Mediterranean Sea. Biogeosciences 11, 5607–5619. doi: 10.5194/bg-11-5607-2014
Pulido-Villena, E., Rérolle, V., and Guieu, C. (2010). Transient fertilizing effect of dust in P-deficient LNLC surface ocean. Geophys. Res. Lett. 37, L01603. doi: 10.1029/2009GL041415
Putaud, J.-P., van Dingenen, R., Dell'Acqua, A., Raes, F., Matta, E., Decesari, S., et al. (2004). Size-segregated aerosol mass closure and chemical composition in Monte Cimone (I) during MINATROC. Atmos. Chem. Phys. 4, 889–902. doi: 10.5194/acp-4-889-2004.
Ridame, C., Dekaezemacker, J., Guieu, C., Bonnet, S., L'Helguen, S., and Malien, F. (2014). Contrasted saharan dust events in LNLC environments: impact on nutrient dynamics and primary production. Biogeosciences 11, 4783–4800. doi: 10.5194/bg-11-4783-2014.
Ridame, C., and Guieu, C. (2002). Saharan input of phosphate to the oligotrophic water of the open western Mediterranean Sea. Limnol. Oceanogr. 47, 856–869. doi: 10.4319/lo.2002.47.3.0856
Sandroni, V., Raimbault, P., Migon, C., Garcia, N., and Gouze, E. (2007). Dry atmospheric deposition and diazotrophy as sources of new nitrogen to northwestern Mediterranean oligotrophic surface waters. Deep Sea Res. Part I Oceanogr. Res. Pap. 54, 1859–1870. doi: 10.1016/j.dsr.2007.08.004
Sei, J., Jumas, J. C., Olivier-Fourcade, J., Quiquampoix, H., and Staunton, S. (2002). Role of iron oxides in the phosphate adsorption properties of kaolinites from the Ivory Coast. Clays Clay Miner. 50, 217–222. doi: 10.1346/000986002760832810
Tanaka, T., Thingstad, T. F., Christaki, U., Colombet, J., Cornet-Barthaux, V., Courties, C., et al. (2011). Lack of P-limitation of phytoplankton and heterotrophic prokaryotes in surface waters of three anticyclonic eddies in the stratified Mediterranean Sea. Biogeosciences 8, 525–538. doi: 10.5194/bg-8-525-2011
Ternon, E., Guieu, C., Loÿe-Pilot, M.-D., Leblond, N., Bosc, E., Gasser, B., et al. (2010). The impact of Saharan dust on the particulate export in the water column of the North Western Mediterranean Sea. Biogeosciences 7, 809–826. doi: 10.5194/bg-7-809-2010
Thingstad, T. F., Dolan, J. R., and Fuhrman, J. A. (1996). Loss rate of an oligotrophic bacterial assemblage as measured by H-thymidine and PO4: good agreement and near-balance with production. Aquat. Microb. Ecol. 10, 29–36. doi: 10.3354/ame010029
Thingstad, T. F., Skjoldal, E. F., and Bohne, R. A. (1993). Phosphorus cycling and algal-bacterial competition in Sandsfjord, western Norway. Mar. Ecol. Progr. Ser. 99, 239–239. doi: 10.3354/meps099239
Usher, C. R., Michel, A. E., and Grassian, V. H. (2003). Reactions on mineral dust. Chem. Rev. 103, 4883–4940. doi: 10.1021/cr020657y
Van den Berg, C. M. G. (1995). Evidence for organic complexation of iron in seawater. The chemistry of iron in seawater and its interaction with phytoplankton. Mar. Chem. 50, 139–157. doi: 10.1016/0304-4203(95)00032-M
Vlasenko, A., Sjogren, S., Weingartner, E., Stemmler, K., Gäggeler, H. W., and Ammann, M. (2005). Effect of humidity on nitric acid uptake to mineral dust aerosol particles. Atmos. Chem. Phys. Discuss. 5, 11821–11860. doi: 10.5194/acpd-5-11821-2005
Wagener, T., Guieu, C., and Leblond, N. (2010). Effects of dust deposition on iron cycle in the surface mediterranean sea: results from a mesocosm seeding experiment. Biogeosciences 7, 3769–3781. doi: 10.5194/bg-7-3769-2010
Wagener, T., Pulido-Villena, E., and Guieu, C. (2008). Dust iron dissolution in seawater: results from a one-year time-series in the Mediterranean Sea. Geophys. Res. Lett. 35, L16601. doi: 10.1029/2008GL034581
Wuttig, K., Wagener, T., Bressac, M., Dammshäuser, A., Streu, P., Guieu, C., et al. (2013). Impacts of dust deposition on dissolved trace metal concentrations (Mn, Al and Fe) during a mesocosm experiment. Biogeosciences 10, 2583–2600. doi: 10.5194/bg-10-2583-2013
Yao, W., Byrne, R. H., and Waterbury, R. D. (1998). Determination of nanomolar concentrations of nitrite and nitrate in natural waters using long path length absorbance spectroscopy. Environ. Sci. Technol. 32, 2646–2649. doi: 10.1021/es9709583
Ye, Y., Wagener, T., Völker, C., Guieu, C., and Wolf-Gladrow, D. A. (2011). Dust Deposition: iron source or sink? a case study. Biogeosciences 8, 2107–2124. doi: 10.5194/bg-8-2107-2011
Zhang, J.-Z. (2000). Shipboard automated determination of trace concentrations of nitrite and nitrate in oligotrophic water by gas-segmented continuous flow analysis with a liquid waveguide capillary flow cell. Deep Sea Res. Part I Oceanogr. Res. Pap. 47, 1157–1171. doi: 10.1016/S0967-0637(99)00085-0
Zhang, J. Z., and Chi, J. I. E. (2002). Automated analysis of nanomolar concentrations of phosphate in natural waters with liquid waveguide. Environ. Sci. Technol. 36, 1048–1053.
Zimmer, L. A., and Cutter, G. A. (2012). High resolution determination of nanomolar concentrations of dissolved reactive phosphate in ocean surface waters using long path liquid waveguide capillary cells (LWCC) and spectrometric detection. Limnol. Oceanogr. Methods 10, 568–580. doi: 10.4319/lom.2012.10.568
Keywords: atmospheric nutrients, dissolution, adsorption, particle size distribution, TEP, dissolved organic matter, Saharan dust, Mediterranean Sea
Citation: Louis J, Bressac M, Pedrotti ML and Guieu C (2015) Dissolved inorganic nitrogen and phosphorus dynamics in seawater following an artificial Saharan dust deposition event. Front. Mar. Sci. 2:27. doi: 10.3389/fmars.2015.00027
Received: 06 January 2015; Accepted: 06 May 2015;
Published: 26 May 2015.
Edited by:
Claire Mahaffey, University of Liverpool, UKReviewed by:
Andrew King, Norwegian Institute for Water Research, NorwayArvind Singh, GEOMAR Helmholtz Centre for Ocean Research Kiel, Germany
Copyright © 2015 Louis, Bressac, Pedrotti and Guieu. This is an open-access article distributed under the terms of the Creative Commons Attribution License (CC BY). The use, distribution or reproduction in other forums is permitted, provided the original author(s) or licensor are credited and that the original publication in this journal is cited, in accordance with accepted academic practice. No use, distribution or reproduction is permitted which does not comply with these terms.
*Correspondence: Cécile Guieu, OOV-Centre National de la Recherche Scientifique, UMR 7093, Observatoire Océanologique de Villefranche, Laboratoire d'Océanographie de Villefranche/Mer, Bat. Jean Maetz, Chemin du Lazaret, 06234 Villefranche/Mer, France, guieu@obs-vlfr.fr
†Present Address: Matthieu Bressac, Institute for Marine and Antarctic Studies, University of Tasmania, Hobart, TAS, Australia