Analysis of multi-scale morphodynamic behavior of a high energy beach facing the Sea of Japan
 Harshinie U. Karunarathna
 Hajime Mase
 Yasuyuki Baba
- 1College of engineering, Swansea University, Swansea, UK
- 2Disaster Prevention Research Institute, Koyoto University, Kyoto, Japan
Monthly cross shore beach profiles measured at the Ogata Wave Observation pier located in Joetsu-Ogata Coast, Niigata Prefecture, Japan, was analyzed to investigate multi-scale morphodynamic beach behavior. The Ogata beach, facing the Sea of Japan, is subjected to high energy wave conditions that has a strong winter/summer seasonal signature. The measured beach profiles at the beach show very significant variability where cross-shore movement of shoreline position and lowering of the beach at the location of measurements exceed 20 and 4 m respectively. The shoreline position seems to follow the seasonal variability of incident wave climate where a correlation coefficient of 0.77 was found between monthly averaged incident significant wave height and the measured monthly shoreline position. During the summer months, the beach variability mostly concentrated in the sub-tidal part of the profile, while a significant amount of upper beach change was observed during the winter months. The beach profile shape was found to rotate between three different beach states in time; (i) concave reflective profile; (ii) profile with sub-tidal berm; and (iii) gentle, dissipative profile. Empirical Orthogonal Function (EOF) analysis of the profiles show that the variability of beach profile shape is dominated by (a) upper shoreface steepening; (b) sub tidal berm development and dissipation; and (c) variability of the overall profile slope, which have some longer than seasonal cyclic signatures. Comparison of temporal EOFs with climate indices such as Southern Oscillation Index and Pacific Decadal Oscillation index shows some correlations between profile change and climatic variability in the region. The analysis also shows that the morphological variability of Joetsu-Ogata Coast has similarities and some distinct spatial and temporal differences to beaches of similar kind found elsewhere.
Introduction
The interaction between natural environmental forcings and beach morphology is a complex process that takes places at a range of time and space scales (De Vriend, 1991). Beaches vary as a result of sediment dynamics driven mostly by incident waves and wave/tide induced currents in both cross-shore and longshore directions. Understanding beach change at multiple timescales is extremely important to sustainable beach management and coast protection. In the timescale of a few days, a storm can erode or breach a beach as a result of intense wave activities thus damaging coastal defenses and hinterland infrastructure (Berkemeier, 1979; Dolan and Davies, 1994; Lee et al., 1998; Forbes et al., 2004). At monthly to seasonal timescales, prevailing highly energy wave conditions during winter months can progressively erode beaches, which may cause failure of coastal defenses, coastal flooding and damage to ecosystems (Karunarathna et al., 2014). During calm summer months most beaches naturally recover from winter damage where human intervention is not necessary to restore beach stability. At the inter-annual to inter-decadal scale, sediment sources and sinks, longshore sediment transport and climate-related causes such as global sea level rise and increasing storminess can cause large scale and irrecoverable beach change. The morphodynamic response of a beach to external environmental drivers depends on its location, sediment characteristics, type, and orientation. Sandy beaches are more prone to erosion and may need high level of maintenance than their coarse grain counterparts. Cross shore distribution of beach sediment and sediment composition play a major role in determining beach response to environmental forcings. Gentle, dissipative beach undergo notably large changes than reflective steep beaches. Embayments and sheltered beaches undergo less change than open, exposed coastlines.
Relationships between natural environmental drivers and beach change at numerous timescales have been extensively studied and established using field records at various locations worldwide, by numerous researchers. Karunarathna et al. (2012) investigated beach profile change of sand and sand-gravel composite beaches using field measurements at the Narrabeen Beach Australia and Milford-on-Sea beach in the UK respectively. They found that cross-shore profile change of a sand beach is mostly confined to the intertidal zone while most changes in a sand-gravel composite beach are in the swash zone. Using long term records of beach profile change at Narrabeen Beach Australia, beach profile response to storm conditions was investigated by Karunarathna et al. (2014). They found that single storms or storm clusters mostly change the supra tidal and inter-tidal regions of the beach profile and that beach erosion volumes are strongly correlated to the power of the storm. Coco et al. (2013) investigated beach response to storm sequences using beach profiles measured at Truc Vert Beach, France, and found that incident storm chronology plays a primary role in beach morphodynamics. Ferreira (2005) investigated beach response to storms using a set of measured data from a Portuguese coast. Lee et al. (1998) studied storm driven beach change using beach profiles measured at Duck, North Carolina. In addition, many literatures have been published on numerical modeling of storm impacts on beaches (e.g., Roelvink et al., 2009b; McCall et al., 2010; Ruiz de Algeria-Arzaburu et al., 2011; Williams et al., 2012; Pender and Karunarathna, 2013).
Relationships between incident wave conditions and profile variability have been examined and established using various techniques by Larson et al. (2000); Horrillo-Caraballo and Reeve (2008, 2010); Kuriyama et al. (2008) and few others, using numerous field observations. Their studies explained the behavioral response of planar, barred, and composite beaches to incident waves. Linkages between beach profile change and climate variations at beaches located at different parts of the world have been investigated by Ranasinghe et al. (2004), Zoulas and Orme (2007), Kuriyama et al. (2012) and a few others, using numerous climate indices. These investigations show highly localized response characteristics of beaches to medium to long term, climate related environmental forcings.
The present study focuses on the Joetsu-Ogata Coast (hereafter known as J-O Coast), located in the Niigata Prefecture of Japan, facing the highly energetic Sea of Japan. This beach has been extensively surveyed over a period of 17 years by measuring beach profiles at a central location of the beach at monthly intervals, which provides a unique dataset on a highly energetic mixed sand beach. It should be noted that this dataset may be the longest beach profile measurements available to-date at a Japanese coastline facing the Sea of Japan. Wave measurements have also been carried out in parallel at a nearby site for 5 years. However, the dataset has been largely forgotten and has never been extensively analyzed to understand and interpret the behavior of the J-O Coast. The objective of this study is to analyse the measured beach profiles at the J-O Coast to investigate multi-scale morphodynamic behavior. The results will be useful to beach users as well as coastal engineers and managers who deal with the management of this beach. Even though the data used is site specific, the insights gathered during this study will be useful to understand the behavior of other high energy beaches of similar kind.
A detailed description to the field study site is given in Section Field Site and Data Description of the paper. Analysis of the beach profiles and linkages of profile change to incident wave conditions are given in Section Morphological Variability of the J-O Coast. Relationships between profile change and climate indices are explored in Section Empirical Orthogonal Function Analysis. Using the observations made in Sections Morphological Variability of the J-O Coast and Empirical Orthogonal Function Analysis, conclusions are derived in Section Linkages with Waves and Climate Indices.
Field Site and Data Description
J-O Coast, located between Joetsu and Kashiwazaki cities facing the Sea of Japan, is a 28 km long sand beach with mostly straight and parallel bottom contours (Figure 1). The beach is micro tidal with spring tidal range not exceeding 0.4 m. Beach sediment is predominantly sand with median diameter varying between 0.3 and 2.7 mm in the cross shore direction (Baba et al., 2008). J-O Coast is subjected to frequent stormy wave conditions during the winter months where on average, 3–4 storms per month reach the coastline. The average duration of winter storms was found to be 2–3 days. The maximum significant wave height of these storms can reach as high as 3.0–3.5 m. It has been reported that winter storms cause severe beach erosion (Baba et al., 2008).
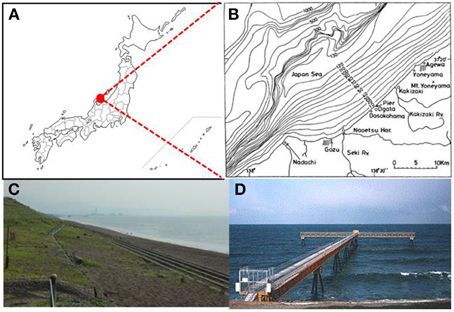
Figure 1. (A) Location of Joetsu-Ogata Coast, (B) Joetsu-Ogata Coast and the location of the pier, (C) View of the beach, and (D) OWO Pier.
Field surveys of cross shore beach profiles at J-O Coast have been carried out at the Ogata Wave Observatory (OWO) pier located at the central part of the beach (Figure 1). The pier was 256 m long in the cross shore direction and was supported by truss girders to minimize its effects on the nearshore hydrodynamics and sediment transport processes (Mase et al., 1990). The measurements were carried out by the Disaster Prevention Research Institute of Kyoto University, Japan. The beach profiles have been measured with respect to a reference line located 25 m landward of the beach crest. As the J-O Coast is a straight beach with predominantly parallel sea bed contours, the profile measurements at OWO pier can be considered as typical of this beach. The profiles had been measured once a month since October 1986 until March 2006, with a cross shore resolution of 1.25 m. However, it should be noted that the data set prior to 1997 are largely incomplete and contain significant gaps (Mase et al., 1990).
Careful observation of measured profiles sediment sampling reveals that J-O Coast is primarily a mixed sand beach with a steep upper shoreface and a gentle inter-tidal/sub-tidal terrace. However, beach profile shape undergoes numerous changes from time to time. In Figure 2, the mean beach profile, the profile envelop and the standard deviation determined from profiles measured between 1987 and 2005 are shown. It should be noted that beach profiles measured in 1990, 1991, 1992, 1994, and 1996 are excluded from the analysis due to prevailing data gaps. It can be seen in Figure 2 that beach levels had varied between 3 and 5 m during the measurement period. Variability of the beach crest height is about 4.5 m. The standard deviation is large between 50 and 185 m cross shore distance and then gradually reduces as the profile reaches offshore. It should be noted in Figure 2 that the profile measurements have not been extended until the depth of closure.
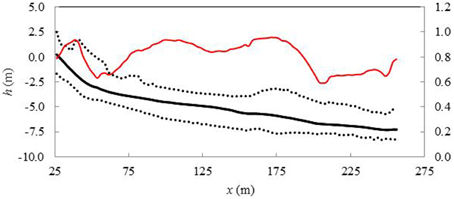
Figure 2. Mean profile (dark black line), profile envelope (broken black lines) and standard deviation (red line) of measured profiles between 1987 and 2005 at Ogata Wave Observation Pier.
Wave measurements have been carried out at the OWO pier for a short interval between November 1987 and January 1989 (Mase et al., 1990). However, wave measurements at the nearby Naoetsu Port, located 5 km west of the OWO pier during 1999 and 2005, are available from the National Wide Ocean Wave Information Network for Ports and Harbors (NOWPHAS), Japan. These measurements have been carried out for 20 min at every 2 h. Due to the existence of straight and parallel depth contours at the J-O Coast, it is reasonable to assume that wave measurements at Naoetsu Port are representative of the waves reaching OWO pier. Therefore, this dataset was used in the current study.
In Figure 3, significant wave heights (Hs) and periods (Ts) of the measured waves are shown. Only the wave measurements between 2001 and 2005 were used here due to significant data gaps observed between 1999 and 2000. The analysis of wave data reveals that the significant wave height (Hs) varied between 0.3 and 3.4 m while significant wave period (Ts) varied between 2.4 and 13.5 s. The average values of Hs and Ts are 1.1 m and 5.6 s, respectively. It should be noted that all wave measurements are non-directional and therefore, no information on incoming wave direction could be found.
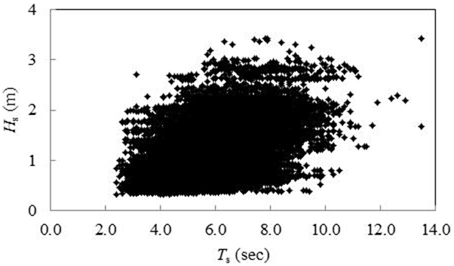
Figure 3. Significant wave height and wave period measured between 2001 and 2005.
To investigate the seasonal variability of the incident wave climate at J-O Coast, monthly averaged significant wave heights were determined from the 2001–2005 wave record. The mean, maximum, and minimum values of the monthly averaged Hs are shown in Figure 4. The seasonality of the incident wave climate at J-O Coast can be clearly seen where average Hs-values during the winter months are notably higher than that during the summer months. Monthly averaged Hs-values vary each year where the largest variation is observed in December (standard deviation 0.41) and the smallest variability in August (standard deviation 0.03).
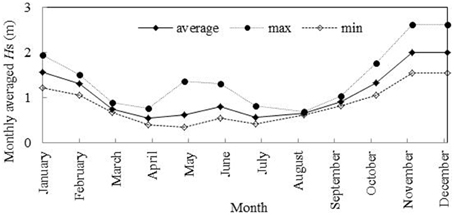
Figure 4. Monthly averaged significant wave height derived from wave measurements carried out between 2001 and 2005.
Morphological Variability of the J-O Coast
Variability of the J-O Coast at a number of timescales is discussed in this section. First, seasonal and inter-annual scale beach variability of J-O coast were examined using beach profiles measured between 1987 and 2005. The wave climate at J-O Coast has shown a strong seasonal signature (Figure 4) where significantly more energetic waves reach the coastline in winter months than in summer months. To investigate beach response to seasonal variability of the incident wave climate, we take the shoreline position as a suitable variable. It should be noted that the actual shoreline position has not been recorded during the profile measurements. As a result, we take -3 m contour, which is roughly the transition point between steep upper shore face and the gentler sub-aerial beach, as the indicative mean shoreline position.
Figure 5 shows monthly averaged shoreline position (−3 m contour). The results show that the shoreline position follows a similar to that of the monthly averaged incident significant wave height, with a correlation coefficient between the two of 0.77. No significant correlation was found between shoreline position and incident wave period (not shown). This result confirms that the beach variability at the J-O Coast primarily depends on the incident wave height where stormy winter waves erode the beach while less energetic summer waves rebuild the beach during summer months.
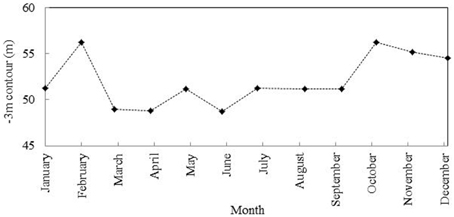
Figure 5. Variability of monthly averaged position of the −3 m contour at J-O Coast.
In order to determine seasonal variability of beach profile shape, profiles were seasonally averaged and their standard deviations were determined. Following Kuriyama et al. (2012), we consider three seasons: March-April-May-June period (MAMJ), July-August-September-October period (JASO) and November-December-January-February period (NDJF). The results are shown in Figure 6. It is seen in Figure 6 that the average profiles during the three seasons look remarkably similar. However, the standard deviation of the upper beach area (cross shore distance between 46 and 75 m) during NDJF (winter) period is significantly larger than that during MAMJ and JASO periods. This may be attributed to rapid recession of the upper beach during frequent winter storms and fast beach recovery during short intervals of calm weather conditions between storms. It should also be noted that irrespective of the season, the standard deviation of seasonal beach change is highest (~1 m) in the gently sloping inter-tidal/sub-tidal zone of the beach, which indicates a significant all-year-round beach change in this region.
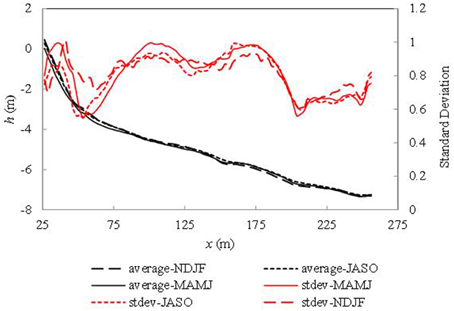
Figure 6. Seasonally averaged beach profiles at J-O Coast. Black lines-seasonally averaged beach profiles, red lines—standard deviation.
It may be possible that beach change takes place at timescales larger than the seasonal scale. We will use annual average beach profiles for a detailed investigation of inter-annual variability of beach profiles at J-O Coast. The results are shown in Figure 7. Annual average beach profiles show excessively large variation in terms of both profile elevation and shape. A notable feature is the lowering and erosion of beach crest, which may have considerable implications on the stability of the beach and its coastal defenses, overtopping and hence flooding. The beach crest elevation varied by more than 4 m while sub-tidal beach elevation varied by around than 3 m. This analysis also reveals that the annual average cross shore beach profiles vary between three classic beach states: (a) concave [erosive] profile; (b) profile with a steep shore face and a sub tidal terrace/berm [intermediate]; and (c) composite, dissipative profile with a step shore face and gentle, uniform lower beach [dissipative] (Short, 1985) (Figure 8).
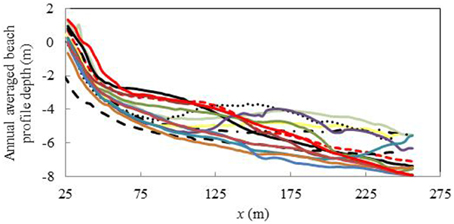
Figure 7. Average annual beach profiles at J-O Coast from 1987 to 2005.
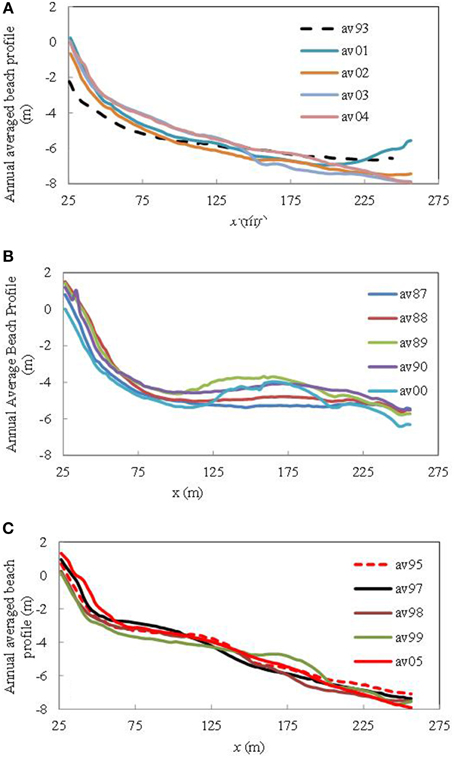
Figure 8. Variability of beach profile shape at J-O Coast (A) Concave, erosion profile (B) profile with steep shoreface and sub tidal berm (C) composite, dissipative profile with steep shoreface and gentle lower beach. Corresponding year of all profiles is given in “avxy” where “xy” is the measurement year.
Although lack of measurements in years 1991, 1992, and 1994 add some uncertainty, annual averaged profiles are seen to vary cyclically between these three beach states. To consolidate this observation, available measurements in 1991 (4 profiles), 1992 (4 profiles) and 1994 (4 profiles) were also averaged and found that all three of them indicate concave, erosive shape, which confirms cyclic variability of beach profile shape between the three beach states. The results also show that once a beach state is reached, the profile stays in that state for a few years, before transforming into a different state.
Cyclic variability of beach states may be linked to longer than annual scale environmental variables. To examine inter-annual to decadal scale change in shoreline position first, the annual averaged −3 m contour line position was determined from the measured profiles (Figure 9). It can be seen in Figure 9 that the shoreline position fluctuates between 43 and 65 m from the reference line. However, year 1997 was found to be an exception where the movement of shoreline position was significantly higher. Cross-examination of average annual beach profiles and shoreline position show that in 1997, −3 m contour has been notably shifted seaward due to the development of an intertidal terrace. The reason for this is not known and cannot be linked to incident waves. The linear trend line of the shoreline position (broken line, Figure 9) shows a slight positive trend which indicates long term shoreward movement of the shoreline. However, it should be noted that the coefficient of determination of the trend line is 0.0197.
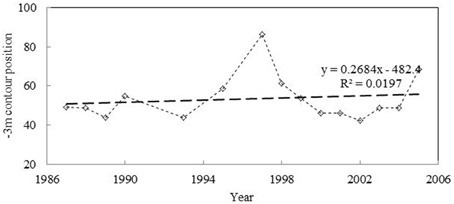
Figure 9. Average annual shoreline position at OWO pier at J-O Coast.
Beach profile shape and shoreline position are two useful indicators of beach change. However, overall beach volume (per meter width) plays a significant role in determining beach stability. Therefore, to investigate changes to beach volume, annual average beach profile volume per meter width of the beach at J-O Coast was determined using the measured profiles between 25 and 250 m cross shore chainages (Figure 10). The mean of the annual averaged beach volume is found to be 461 m3/m and the standard deviation is 185 m3/m. This indicates significant inter-annual change in beach volume. In Figure 10, intermittent periods of beach erosion and accretion can be seen. There are two notable periods of beach accretion: from 1990 to 1999 and post-2001. Beach volume has a decreasing trend between 1999 and 2001. Pre-1990 figures show a mix of accretion and erosion. It should be noted that despite intermittent periods of accretion and erosion, the linear trend line fitted to beach volumes (broken line in Figure 10- coefficient determination of 0.41) show evidence of long term beach volume gain.
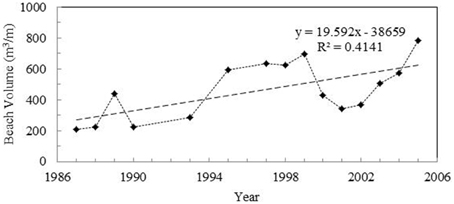
Figure 10. Average annual beach volume per meter width of beach at OWO pier at J-O Coast. Broken line shows the linear trend.
In an attempt to establish a relationship between long term beach volume gain and incident wave climate, beach volume is compared with incident wave energy (results are not shown). It should be noted that wave data are available for a limited period between 2001 and 2005 only and therefore, the comparison is limited to that period. Significant wave heights were used to calculate wave energy using linear wave theory. Apart from the winter/summer seasonal variability and a few extreme storm occurrences, no significant long term trend in wave energy, which will contribute to long term beach accretion, is found. However, it should be noted that the limited duration of wave measurements is not adequate to arrive any firm conclusions. Also, either the directionality of incident waves or information on alongshore sediment transport are not known. Therefore, effects of longshore sediment transport on beach change cannot be investigated.
Empirical Orthogonal Function Analysis
In the previous section, seasonal and inter-annual scale beach variability at J-O Coast was investigated by using beach profiles averaged at a number of timescales. In this section we use Empirical Orthogonal Function (EOF) analysis to directly link spatial and temporal variability of the profiles at different timescales. EOFs provide a means of analysing a time history of observations of a quantity along a line or over a two-dimensional grid so that the variability within the observations is split into those in space and time. EOF analysis is widely used to investigate patterns in beach change (e.g., Winant et al., 1975; Wijnberg and Terwindt, 1995; Larson et al., 2000; Karunarathna et al., 2012) and other coastal features (e.g., Reeve et al., 2001, 2008; Kroon et al., 2008). In EOF analysis of beach profiles, the measured profile data are matched to a set of shape functions, known as “eigenfunctions,” which will be determined from the data themselves:
In Equation (1), h = profile depth, x = distance measured offshore. n = nx = the number of measurement points in the cross-shore profile and n = nt = number of cross-shore profile surveys. en and cn are spatial orthogonal functions and corresponding time coefficients respectively, which are given by,
Each eigenfunction corresponds to a statistical description of the data with respect to how the data variance is concentrated in that function. The functions are ranked according to the magnitude of their corresponding eigenvalues which are proportional to the data variance. Typically, a large proportion of the data variance is contained within a small number of eigenvalues and hence, only a limited number of eigenfunctions are needed to explain most of the variation in the measurements (Pruszak, 1993; Reeve et al., 2001; Larson et al., 2003). The eiginfunctions reveal spatial and temporal patterns of variation around the mean beach profile (Pruszak, 1993; Larson et al., 2003; Kroon et al., 2008; Karunarathna et al., 2012). As a result, the cross shore profile shape is represented by a linear summation of time and space varying set of eigenfunctions.
Since there were considerable data gaps prior to 1996, the beach profiles measured between 1997 and 2005 were used for EOF analysis. The analysis reveals that 99.9% of the data variance is captured by the first five eigenfunctions, which confirms that the method provides a compact means of presenting space and time variability of beach profiles.
The first five normalized spatial eigenfunctions are shown in Figure 11. In Figure 11, the secondary vertical axis corresponds to the first eigenfunction (EOF1) and the primary vertical axis corresponds to subsequent eigenfunctions (EOF2 to EOF5). The relationship between EOF modes and the spatial beach profile characteristics is then examined. The EOF1 corresponds to time mean cross shore profile. EOF2 corresponds to change in profile gradient at the shore face and the sub areal region. Development and existence of the lower beach berm is shown in EOF3. EOF4 indicates shoreward movement and steepening of the shore face. EOF5 indicates small localized erosion and accretion of the profile, which is less significant. According to these results, it can be confirmed that the variability of the profile gradient, berm formation and shoreface steepening are the primary causes of beach profile change at J-O Coast.
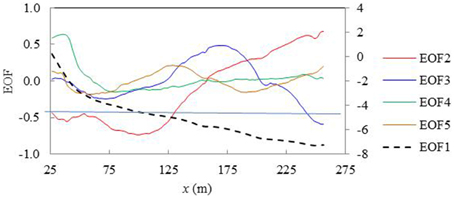
Figure 11. Spatial variability of the first five eigenfunctions for monthly beach profiles measured at J-O Coast between 1997 and 2005.
To investigate the temporal behavior of cross-shore profiles, first five temporal eigenfunctions were then examined (Figure 12). EOF1 is approximately constant as it corresponds to the time-mean profile. EOF2 shows an increasing trend until 1999 and a decreasing trend afterwards. This indicates the occurrence of a gentle beach slope until 1999 and steepening thereafter, which correctly captures the trend found in average annual profiles (Figure 8). EOF3 shows a cyclic behavior with an upward trend from 1997 to 1999, a steep downward trend in 2000 followed by a gradual upward trend, which resembles the gradual sub-aerial bar growth, sudden erosion and re-growth. This behavior coincides with the cyclic profile shape variability observed in the annual averaged profiles shown in Figure 8 where transition from planner beach to berm profile and then to reflective profile has taken place. In EOF4, which relates to the steepening of the shore face, a 3–4 year cycle is clearly visible. EOF5 primarily shows a high-frequency variability.
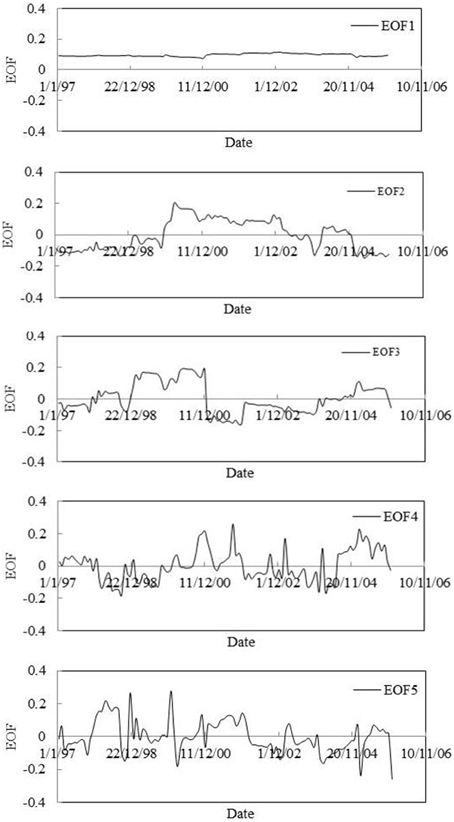
Figure 12. Temporal variation of the first five eigenfunction derived for J-O Coast beach profiles.
The results of the EOF analysis reveals the success of the method in capturing multi-scale temporal changes of a highly complex beach system subjected to multiple wave conditions. The method also provides a potential means of extrapolating the past behavior in order to obtain forecasts of future beach variability.
The variability of beach profile shape at J-O coast is largely driven by the intensity of the incoming wave field. Even though wave directionality was not available to investigate the impacts of wave direction on longshore sediment transport and hence beach change, changes in beach profile shape reveal that incident wave height is predominantly responsible for beach change.
Karunarathna et al. (2012) carried out EOF analysis of beach profile variability at Narrabeen Beach, Australia. Narrabeen is a high energy, sandy beach that has some similarities to J-O Coast.
The first four spatial EOFs at Narrabeen beaches were found to be significantly similar to that at J-O coast, indicating common morhodynamic trends at the two beaches. Changes to beach face gradient, berm movement and seaward/shore beach movement are significantly similar. Minor differences were found in the upper beach region, which may be attributed to the differences in site characteristics (Narrabeen is an embayment while J-O Coast is an exposed beach. Average sediment size in Narrabeen is 0.4 mm while that in J-O Coast is 1.5 mm). Temporal EOFs at the two beaches are distinctly different, which may be attributed to the differences in incident wave fields. The reader is referred to Karunarathna et al. (2012) for details of the analysis of the Narrabeen Beach.
A similar analysis of beach profiles has been done for Duck, North Carolina by Horrillo-Caraballo and Reeve (2008, 2010). Duck has a multiple barred beach profile which continuously evolves as a result of incident waves, particularly storm waves (Birkemeier, 1985; Larson and Kraus, 1995). Even though Duck is an exposed sandy beach subjected to high energy wave conditions, overall wave climate, beach sediment, and the nature of the beach profile are significantly different from the J-O Coast. As a result, distinct differences in spatial and temporal beach variability were found between the two beaches.
Linkages with Waves and Climate Indices
Analysis of beach profiles at J-O Coast shows significant longer term signatures as described in Section Morphological Variability of the J-O Coast. This may be attributed to climate-related factors, longshore transport and/or sediment sources and sinks. Investigation of impacts of longshore transport is not possible due to lack of data. It is evident that there are no known sediment sources and sinks at the J-O Coast. Here we attempt to examine potential contributions from climate variability to beach profile change, using two climate indices applicable to Sea of Japan. The indices used in the present analysis are Southern Oscillation Index (SOI) driven by El Niño-La Niña Southern Oscillation (ENSO) (Ropelewski and Jones, 1987) and Pacific Decadal Oscillation (PDO) index, a long-lived (decadal scale) El Niño-like pattern (Mantua et al., 1997), which are the primary climate indices in the Pacific region. While the two climate oscillations have similar spatial climate fingerprints, they have very different behavior in time. The presence of ENSO driven sea level variation signals and low frequency sea level change signals corresponding to PDO in the Sea of Japan have been established by Wang et al. (2009) and Gordon (2004) respectively.
A comparison of temporal eigenfunctions of beach profiles determined in Section Morphological Variability of the J-O Coast with the monthly SOI is shown in Figure 13. It was found that the correlation between monthly SOI and EOF2 which corresponds to change in beach profile gradient) is almost insignificant (correlation coefficient 0.093) whereas a positive correlation was found between EOF4 and SOI (correlation coefficient 0.25). This result indicates that the ENSO driven climate variability has a noticeable impact on the shoreface slope and the shoreline position (note: EOF4 represents variability of shoreface and beach position), which is explained by the 3–4 year cyclic variability. Correlation coefficient between EOF3 (related to the development of a beach berm) and SOI is -0.12. These results reveal that growth and recession of upper beach berm should be driven by short term variability of wave climate (storms) rather than the long term, climate-related changes to environmental forcings while a noticeable proportion of long term shoreline position change can be attributed to ENSO driven climate variability.
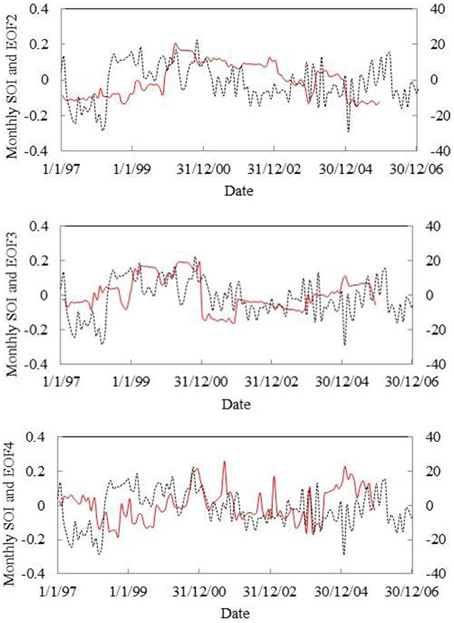
Figure 13. Comparison of temporal eigenfunctions and SOI. Primary axis corresponds to temporal EOFs. Secondary axis corresponds to monthly SOI. Red lines—temporal EOFs, black dotted lines—monthly SOI.
Next, temporal EOFs of beach profiles were compared with the monthly PDO index. The results are shown in Figure 14. The correlation coefficients between PDO index and, EOF2, EOF3, and EOF4 are 0.12, −0.25 and −0.27 respectively. Although these correlations cannot be discarded, it should be noted that the PDO index is related to decadal scale climate variability in the region and that 10 year beach profile measurements used in this study may not be adequate to capture beach response to decadal scale climatic variability.
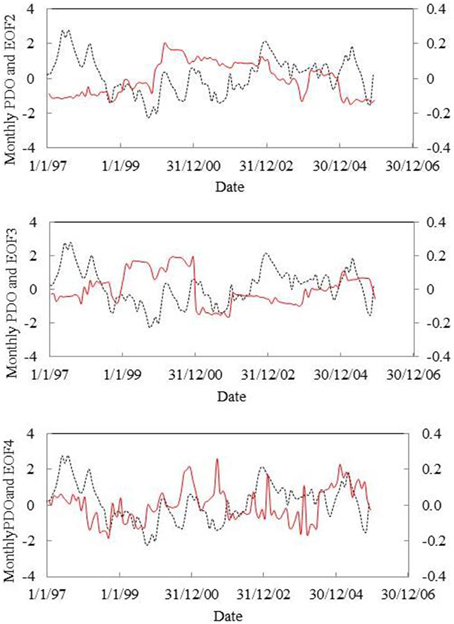
Figure 14. Comparison of temporal EOFs with PDO. Primary axis corresponds to PDO. Secondary axis corresponds to temporal EOFs. Red line—temporal EOF, black dotted line—monthly PDO.
Conclusions
Analysis of field observations at Joetsu-Ogata Coast located in the Niigata Prefecture, Japan to investigate multi-scale beach change is presented in this paper. The measured data includes monthly cross-shore beach profile surveys over a period of 18 years between 1987 and 2005 at the Ogata Wave Observation pier and incident wave measurements between 2001 and 2005 at a nearby site. Although there are some data gaps in the early years of filed campaign, the data set provides a valuable tool to investigate and understand the dynamics of this beach at a range of timescales. The observations made and the conclusions arrived at from this study may be useful to understand the behavior of other beaches in the region and elsewhere, which have similar characteristics and are subjected to similar environmental forcings.
It was found that J-O Coast temporally migrates between three primary beach states: classic reflective (concave) beach; beach with steep shore face and a sub-tidal berm; and dissipative beach. Beach profile migration between these three states takes place at timescales of several years and once a certain beach state is reached, the beach remains at that state for a few years.
A notable contribution from ENSO driven climate variability was found to contribute to long term shoreline position. No significant correlation was found between long term beach accretion and incident wave energy. Although wave measurements do not cover the entire duration of profile measurements, this observation raises the question whether the long term beach accretion is linked to longshore sediment transport gradients. However, no information on wave directionality and longshore sediment transport is available at this site to investigate this further.
The analysis of beach profiles shows that the variability of the profiles takes place at a range of timescales. A strong seasonal signature which follows the seasonal variability of the incident wave climate predominate the profile variability at J-O Coast with a correlation coefficient between monthly averaged shoreline position and incident significant wave height of 0.77. In addition, some primary features of beach profile change such as change in shoreline position and shore face gradient show linkages with to climate indices, which is an indication of long term beach change associated with climatic variations in the Sea of Japan.
Finally, the usefulness of the results found through this analysis on coastal management practice should be noted. Understanding different timescales at which beach changes take place and the scale of variability is essential to develop sustainable coastal and flood defense management practice. The results show that methodologies used in this study provides useful insights to multi-scale beach change of high energy sand beaches. A qualitative comparison made between J-O Coast beach variability and Narrabeen Beach (Karunarathna et al., 2012) reveals similarities between the two beaches, which indicates that the findings of this study may be useful to understand multi-scale behaviors of beaches of similar kind elsewhere especially when long term field measurements are not available to study them. However, it should be noted that in doing so, local beach characteristics, sediment transport regime, sediment sources/sinks should be carefully taken into account as local conditions may play a very important role in beach change, as evident from the differences found between J-O Coast and Duck beach North Carolina.
Conflict of Interest Statement
The authors declare that the research was conducted in the absence of any commercial or financial relationships that could be construed as a potential conflict of interest.
Acknowledgments
The authors wish to thank Mr. Kiyoshi Uchiyama, the technical officer responsible for collecting field data at J-O Coast. HK acknowledges the support of the iCOASST Project (NE/J005428) funded by the Natural Environment Research Council (EPSRC), UK and the Ensemble Estimation of Flood Risk in a Changing Climate project funded by The British Council through their Global Innovation Initiative.
References
Baba, Y., Uchiyama, K., Sekiguchi, H., and Nakagawa, H. (2008). “Cross shore bottom profiles along an observational pier and its seasonal variations,” in 4th International Conference in Scour and Erosion (Tokyo).
Berkemeier, W. A. (1979). The effects of the 19th December 1977 coastal storm on beaches in North Carolina and New Jersey. Shore Beach 47, 7–15.
Birkemeier, W. A. (1985). “Time scales of nearshore profile changes,” in Proceedings of the 19th International Conference on Coastal Engineering, ed B. L. Edge (Houston, TX: ASCE), 1507–1521.
Coco, G., Senechal, N., Rejas, A., Brian, K. R., Capo, S., Parisot, J. P., et al. (2013). Beach response to sequence of extreme storms. Geomorphology 204, 493–501. doi: 10.1016/j.geomorph.2013.08.028
De Vriend, H. J. (1991). Mathematical modelling of large scale coastal behaviour, Part I. Phys. Process. J. Hydraul. Res. 29, 727–740. doi: 10.1080/00221689109498955
Ferreira, O. (2005). Storm groups versus extreme single storms: predicted erosion and management consequences. J. Coast. Res. Spec. Issue 42, 221–227.
Forbes, D. L., Parks, G. S., Manson, G. K., and Ketch, L. A. (2004). Storms and shoreline retreat in the southern Gulf of St. Lawrence. Mar. Geol. 210, 169–204. doi: 10.1016/j.margeo.2004.05.009
Gordon, A. L. (2004). Pacific decadal oscillation and sea level in the Japan/East Sea. Deep Sea Res. I 51, 653–663. doi: 10.1016/j.dsr.2004.02.005
Horrillo-Caraballo, J. M., and Reeve, D. E. (2008). An investigation of the link between beach morphology and wave climate at Duck, North Carolina, USA. J. Flood Risk Manage. 1, 110–122. doi: 10.1111/j.1753-318X.2008.00013.x
Horrillo-Caraballo, J. M., and Reeve, D. E. (2010). An investigation of the performance of a data-driven model on sand and shingle beaches. Mar. Geol. 274, 120–134. doi: 10.1016/j.margeo.2010.03.010
Karunarathna, H., Horrillo-Caraballo, J. M., Ranasinghe, R., Short, A. D., and Reeve, D. E. (2012). An analysis of the cross-shore beach morphodynamics of a sandy and a composite gravel beach. Mar. Geol. 299–302, 33–42. doi: 10.1016/j.margeo.2011.12.011
Karunarathna, H., Pender, D., Ranasimghe, R., Short, A. D., and Reeve, D. E. (2014). The effects of storm clustering on beach profile variability. Mar. Geol. 348, 103–112. doi: 10.1016/j.margeo.2013.12.007
Kroon, A., Larson, M., Moller, I., Yokoki, H., Rozynski, G., Cox, J., et al. (2008). Statistical analysis of coastal morphological data sets over seasonal to decadal time scales. Coast. Eng. 55, 581–600. doi: 10.1016/j.coastaleng.2007.11.006
Kuriyama, Y., Banno, M., and Suzuki, T. (2012). Linkages among interannual variations of shoreline, wave and climate at Hasaki, Japan, Geophy. Res. Lett. 39, L06604. doi: 10.1029/2011GL050704
Kuriyama, Y., Ito, Y., and Yanagishima, S. (2008). Medium term variation of bar properties and their linkages with environmental factors at Hasaki, Japan. Mar. Geol. 248, 1–10. doi: 10.1016/j.margeo.2007.10.006
Larson, M., Capobianco, M., and Hanson, H. (2000). Relationship between beach profiles and waves at Duck, North Carolina, determined by canonical correlation analysis. Mar. Geol. 163, 275–288. doi: 10.1016/S0025-3227(99)00119-X
Larson, M., Capobianco, M., Jensen, H., Rozyanki, G., Southgate, H. N., Stive, M., et al. (2003). Analysis and modelling of field data on coastal morphological evolution over yearly and decadal time scales, Part 1: background and linear techniques. J. Coast. Res. 19, 760–775.
Larson, M., and Kraus, N. C. (1995). Prediction of cross-shore sediment transport at different spatial and temporal scales. Mar. Geol. 126, 111–127. doi: 10.1016/0025-3227(95)00068-A
Lee, G.-H., Nicholls, R. J., and Birkemeier, W. A. (1998). Storm driven variability of the beach-nearshore profile at Duck, North Carolina, USA, 1981–1991. Mar. Geol. 148, 163–177. doi: 10.1016/S0025-3227(98)00010-3
Mantua, N. J., Hare, R. S., Zhang, Y., Wallace, J. M., and Francis, R. C. (1997). A Pacific inter decadal climate oscillation with impacts on salmon production. Bull. Am. Meteorol. Soc. 78, 1069–1079.
Mase, H., Yamashita, T., and Hayashi, K. (1990). “Wave group properties of coastal waves,” in 22nd International Conference in Coastal England (Delft).
McCall, R., van Thiel de Vries, J., Plant, N. G., van Dongeren, A., Roelvink, J. A., Thompson, D. A., et al. (2010). Two dimensional time dependent hurricane overwash and erosion modelling at Santa Rosa Island. Coast. Eng. 57, 668–683. doi: 10.1016/j.coastaleng.2010.02.006
Pender, D., and Karunarathna, H. (2013). A statistical-process based approach for modelling beach profile variability. Coast. Eng. 81, 19–29. doi: 10.1016/j.coastaleng.2013.06.006
Pruszak, Z. (1993). The analysis of beach profile changes using Dean's method and empirical orthogonal functions. Coast. Eng. 19, 245–261. doi: 10.1016/0378-3839(93)90031-3
Ranasinghe, R., McLoughlin, R., Short, A., and Symonds, G. (2004). The Southern Oscillation Index, wave climate and beach rotation. Mar. Geol. 204, 273–287. doi: 10.1016/S0025-3227(04)00002-7
Reeve, D. E., Horrillo-Caraballo, J. M., and Magar, V. (2008). Statistical analysis and forecasts of long-term sandbank evolution at Great Yarmouth, UK. Estuar. Coast. Shelf Sci. 79, 387–399. doi: 10.1016/j.ecss.2008.04.016
Reeve, D. E., Li, B., and Thurston, N. (2001). Eigenfunction analysis of decadal fluctuations in sandbank morphology at Great Yarmouth. J. Coast. Res. 17, 371–382.
Roelvink, J. A., Reniers, A., van Dongeren, A., van Thiel De Vries, J., McCall, R., and Lescinski, J. (2009b). Modelling storm impacts on beaches, dunes and barrier islands. Coast. Eng. 56, 1133–1152. doi: 10.1016/j.coastaleng.2009.08.006
Ropelewski, C. F., and Jones, P. D. (1987). An extension of the Tahiti-Darwin Southern Oscillation Index. Mon. Weather Rev. 115, 2161–2165.
Ruiz de Alegria-Arzaburu, A., Williams, J. J., and Masselink, G. (2011). “Application of XBeach to model storm response on a macrotidal gravel barrier,” in Proceedings 32nd Conference on Coastal Engineering, eds J. K. Smith and P. Lynnet (Shanghai: Coastal Engineering). doi: 10.9753/icce.v32.sediment.39
Short, A. D. (1985). Rip current type, spacing and persistence, Narrabeen Beach, Australia. Mar. Geol. 65, 47–71. doi: 10.1016/0025-3227(85)90046-5
Wang, T., Liu, Y., Zong, H., and Rong, Z. (2009). The inter annual and decadal variability of the sea levels in the Japan/East Sea. J. Ocean Univ. China 8, 335–342. doi: 10.1007/s11802-009-0335-y
Wijnberg, K. M., and Terwindt, J. H. J. (1995). Extracting decadal morphological behaviour from high-resolution, long-term bathymetric surveys along the Holland coast using eigenfunction analysis. Mar. Geol. 126, 301–330. doi: 10.1016/0025-3227(95)00084-C
Williams, J. J., Ruiz de Alegria-Arzaburu, A., McCall, R., and van Dongeren, A. (2012). Modelling gravel barrier profile response to combined waves and tides using XBeach: laboratory and field results. Coast. Eng. 63, 62–80. doi: 10.1016/j.coastaleng.2011.12.010
Winant, C. D., Inman, D., and Nordstrom, C. E. (1975). Description of seasonal beach changes using Empirical Eigenfunctions. J. Geophys. Res. 80, 1979–1986. doi: 10.1029/JC080i015p01979
Keywords: Joetsu-Ogata coast, beach profile, empirical orthogonal function, multi scale beach change, southern oscillation index, pacific decadal oscillation
Citation: Karunarathna HU, Mase H and Baba Y (2015) Analysis of multi-scale morphodynamic behavior of a high energy beach facing the Sea of Japan. Front. Mar. Sci. 2:51. doi: 10.3389/fmars.2015.00051
Received: 03 March 2015; Accepted: 01 July 2015;
Published: 16 July 2015.
Edited by:
Corinna Schrum, University of Bergen, NorwayReviewed by:
João Miguel Dias, University of Aveiro, PortugalMagda Catarina Sousa, University of Aveiro, Portugal
Ian Townend, CoastalSEA, UK
Copyright © 2015 Karunarathna, Mase and Baba. This is an open-access article distributed under the terms of the Creative Commons Attribution License (CC BY). The use, distribution or reproduction in other forums is permitted, provided the original author(s) or licensor are credited and that the original publication in this journal is cited, in accordance with accepted academic practice. No use, distribution or reproduction is permitted which does not comply with these terms.
*Correspondence: Harshinie U. Karunarathna, College of engineering, Swansea University, Singleton Park, Swansea SA2 8PP, UK, h.u.karunarathna@swansea.ac.uk