Simulating Stakeholder Behavior in a Marine Setting: Integrated Coastal Zone Planning and the Influential Power of Selected Stakeholders in Frøya, Norway
 Rachel G. Tiller
 Yngve Svalestuen3
 - 1SINTEF Fisheries and Aquaculture, Trondheim, Norway
- 2Department of Sociology and Political Science, Norwegian University of Science and Technology, Trondheim, Norway
- 3Department of Computer and Information Science, Norwegian University of Science and Technology, Trondheim, Norway
Aquaculture expansion is a political priority in Norway, despite simmering conflicts, and competing claims. We expand on this hypothesis and analyze the Norwegian governance system by adding stakeholder theory in case of a simulated model of the effects of municipal coastal zone planning in the municipality of Frøya, Norway. One cannot analyze the governance system in Norway without fully comprehending the perspectives of the stakeholders involved. Different stakeholders will react and respond differently and have conflicting presumptions basing their actions toward the planning process for coastal areas. They will also have different levels of power and abilities to influence the system. The article presents the interdisciplinary, first generation development of an agent based simulation model that mimics the outcomes of coastal zone planning for a stakeholder groups, the commercial fishers and the aquaculture industry, based on qualitative input from legislation, regulations, and stakeholder workshops. We proceed with verifying the applicability of this simulator in light of the key actors involved, namely the commercial fishers. We found that the simulator had two outcomes for the commercial fishers that were consistently recurring, namely “collapse” and “stability,” based on the simulated occurrences of complaints by the stakeholders, with the latter being the de facto perceptions of actuality by the commercial fishers. Using stakeholder theory, we argue that the aquaculture industry's role has the saliency of an Important Stakeholder in Frøya has steered the commercial fishers, who has the role of Dependent Stakeholders according to stakeholder theory, to no longer see any legitimacy in the process in that their complaints were never upheld because of their lack of the attribute Power.
Introduction
Competing claims to coastal waters are nothing new (Buanes et al., 2005; Young et al., 2007; Douvere, 2008; Meiner, 2010; Tiller et al., 2012, 2013, 2014). A traditional use of coastal areas has been the harvest of fish for food consumption, and this continues to be an important activity globally. Research reports show, however, that marine fish stocks have continued to decline and that in 2011, 61.3% were fully utilized and could no longer be harvested at a biologically sustainable level (FAO, 2014b). If pressure on wild stocks increases—driven for example by the increasing demand for seafood from big emerging economies with large populations like India and China—serious threats to global food security could result (Delgado et al., 2003; Fu et al., 2012). The primary method of the past several decades for the reduction in the rate of fishing pressure on wild stocks has been to expand the aquaculture industry for all farmed species, from shrimp to Atlantic salmon1 (Abdallah and Sumaila, 2007; Garcia and Rosenberg, 2010; van Vliet et al., 2010; Islam, 2014). This expansion of the aquaculture industry, however, can have an effect on the trade of the commercial fishers in countries with an interest in exploiting ecosystem services provided by the coastal zone. In Norway, 64% of the municipalities border directly on coastal waters (The Norwegian Mapping Authority, 2014). Both commercial fishers and the aquaculture industry are closely involved in the integrated coastal zone management process here. This is especially true for the local municipal coastal area planning procedures that in fact allocate marine areas for commercial purposes to different stakeholder groups, whether it is for capture fishing, crabbing, aquaculture, tourism, or other. The involvement in the process is therefore critical in order for commercial fisheries to have their interests taken into account and their primary fishing areas put on the official municipal maps to avoid the placement of competing claims there. It is similarly important for the aquaculture industry to ascertain that suitable areas with enough flexibility to adapt to future changes in national framework policies, as long as allowing for growth of the industry, are taken into account.
In the current article the focus is on the commercial fishers, however, and their will to provide municipal coastal planning authorities with said information regarding their fisheries. We also want to explore their perceptions of the importance thereof. In one case, we could expect fishers to either over-report areas of great fishing, in order to obtain more marine areas that would prohibit aquaculture facilities in the proximity of their fishing spots. In another case, we could also expect them to under-report it, as revealing these fishing spots could encourage other fishers to encroach on their preferred fishing areas, which might have been a long kept family secret. In light of this, the following article provides insight to illuminate this dual expectation, using an innovative and interdisciplinary process of combining expertise in political science with the logical presumptions of computer science, and developing a first generation multi-agent simulator based on qualitative data from (1) the established regulatory facts related to the Norwegian Planning and Building Act and (2) results from a workshop with fishers in 2012. What we aim to do is to test both expectations and explore whether the simulated coastal planning process and hearings regarding the industry application for localities conforms to real life stakeholder perceptions of the same issues. In doing so, we will first provide a background section about fishing and aquaculture in Norway. This is followed by the theories that will frame our study, and the methods used to develop the Agent-Based simulations as well as how the stakeholders were selected for participation in the study. Finally, we will present the results from the stakeholder verification session in 2014.
Background
Fishing and Aquaculture in Norway and Frøya
The Norwegian coast has long been influenced by human activity, and has historically been of great significance for the Norwegian society. After the Second World War, though, rationalization and modernization of the commercial fishing industry and the fishing vessel-structure was characterized by conflicts and there were natural resistance against readjustments of these fisheries in coastal communities, including Frøya. The fishing industry had prior to this experienced great expansion and there were dramatic increases in production of different commercial species and highly developed fish-products, even resulting in the employment of women several places (Christensen, 2014). By 1950, there were in fact more than 1500 fishers on this island community (Foss and Hammer, 1997), as compared with only 103 fishers that today have fishing as their main source of income (Directorate of Fisheries, 2014c). Increased efficiency and better technology, however, made the fishing vessels more mobile and the total catch of some species soon neared collapse (e.g., Norwegian herring, smelt, and coastal cod, Ibid), in line with the global experience at the time. In the coastal communities where the fisheries earlier had an important role, new and alternative businesses, including aquaculture, soon took over for this now declining industry. The process resulted in strong deconstruction of the fishing industry both at sea as well as on land, as measured by employment. In both Frøya and Hitra, the neighboring archipelago, the significant restructuring in both commercial fishing and agriculture caused a population loss of 38% from 1964 to 1995 (Van auken and Fredrik Rye, 2011; Statistics Norway, 2013).
The solution for many coastal communities, including Frøya, became a further expansion of the up-and-coming aquaculture industry. Norway has seen enormous aquaculture growth since the inception of the industry after this period and is currently the world leader in the production and export of farmed salmon (FAO, 2014a). By the 1970's the industry had expanded globally and has had exponential growth ever since, with a focus on high value species with a high export demand (FAO Fisheries and Aquaculture Department., 2010). The industry has also been critical in the development of spin-off industries, and is an important contributor to the supply- and processing industry as well in Norway (Sandberg et al., 2014). This is of crucial importance for the life in the coastal communities, and creates economic growth in both rural districts as well as larger cities, which is of utmost political priority across party lines (Regjeringen Stoltenberg II, 2005-2009; Pedersen, 2006; Ministry of Trade Industry and Fisheries, 2014). Furthermore, the population change in Frøya has been positive since 2008, and was at 3.04% in 2013, with the current population being 4506 inhabitants (Statistics Norway, 2013). Frøya was also recently ranked the 5th out of the 10 most successful rural municipalities in Norway (Richardson et al., 2009), indicating that Frøya is one of the municipalities that has been successful both in terms of industrial development and in population growth. Furthermore, value added per capita is among the highest in Norway, and is ranked top in Trøndelag. The municipality's largest business, the salmon farming- and processing company SalMar, completed and launched in 2011 an extensive construction and a huge expansion of their new salmon-processing plant located on Kverva, Frøya, which is Europe's largest salmon processing plant of its kind (Webb, 2007). It is within this framework that the stakeholder group of commercial fisher, having declined from 1500 to only 103 with fishing as their main income, and where the coastal areas within which their trade is dependent upon is located.
Both stakeholder groups belong to a Norwegian governance model of inclusion of stakeholders at all times. It is a tripartite coalition system, with the national, regional and municipal governments working in unison to develop area plans for both terrestrial and marine areas in the given municipality. The schematic in Figure 1 refers to the actual municipal area planning process, where areas, both terrestrial and marine, are divided into usage areas, whether these be open access, aquaculture, pipelines, windmills, or any other usage a given stakeholder group might have for a given marine spatial area. Though all three level of government are included in the governance system, it is the municipality that has the primary responsibility to develop area plans along the coastal zone, including areas for aquaculture. Their job is to determine where these industries are best located, from a socio-ecological angle. However, the regional government (Fylkeskommunen) has a duty to assist the municipalities in this endeavor, specifically about the goals and expectations of the national government, though legally, they do not have the right to impose any specific usage to any given area. However, given the complexities of having both a planning process, as well as actual enforcement of a variety of laws governing the areas and ventures that are planned for in the given locations, the demands for expertise are immense. When in addition national expectations are expected to have an effect on the planning process, the necessity of cooperation between levels of governance is evident, as well as the inclusion of both stakeholders and different sectors (Sørtrøndelag Fylkeskommune, 2010). This is because after the planning is done, a variety of other instruments determine whether or not an aquaculture facility is actually going into the water in an area set aside for this in the municipality's plans (see Figure 2).
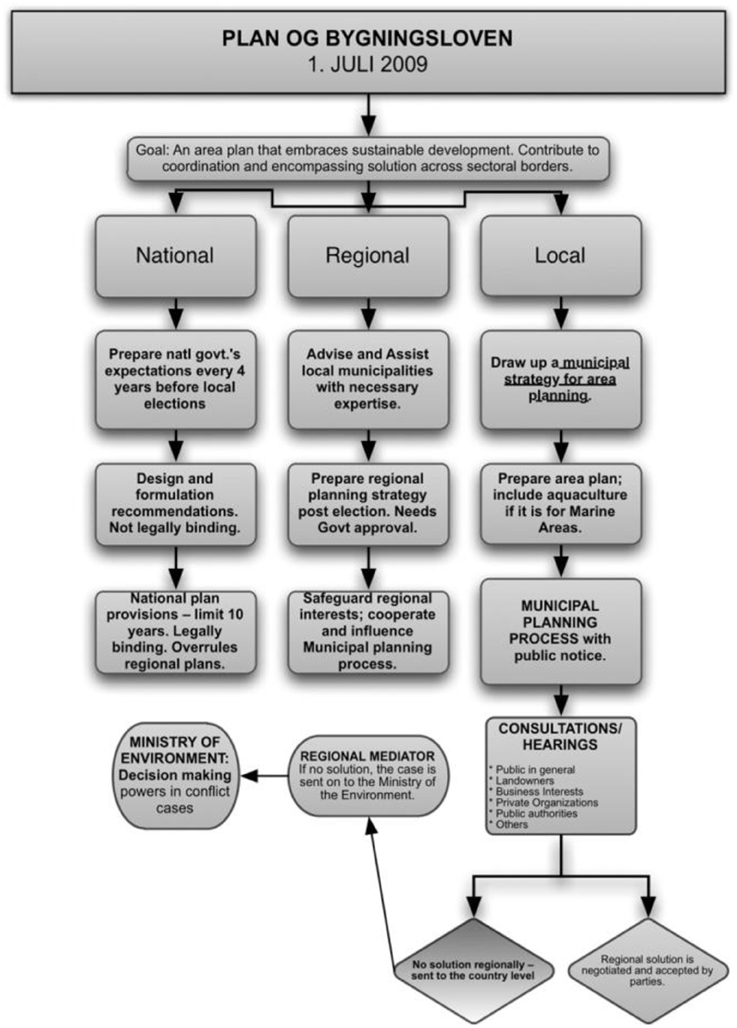
Figure 1. Planning and Building Act (1985).
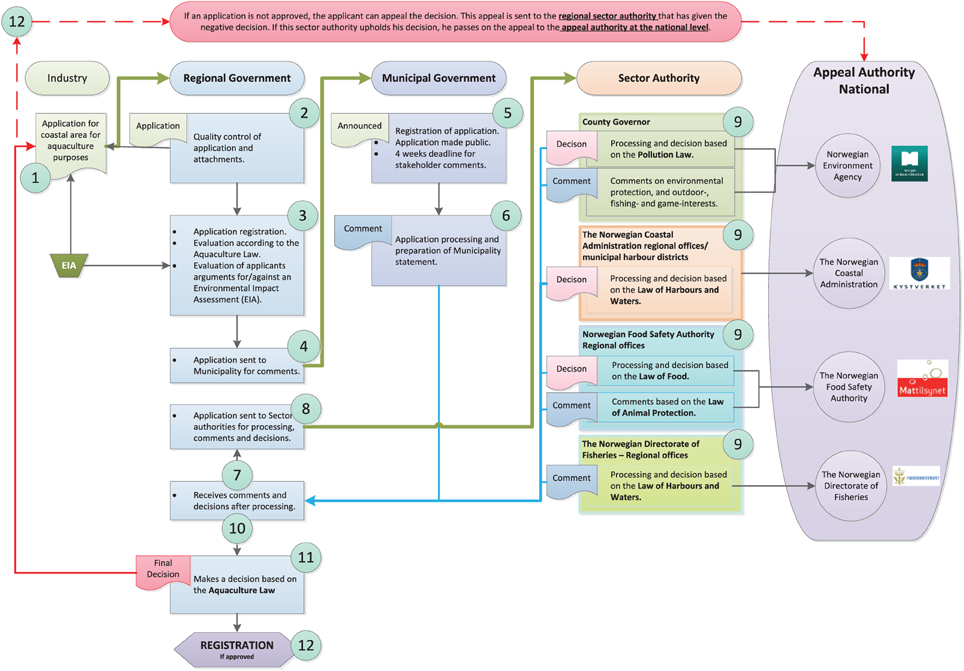
Figure 2. Municipality area planning is only the first step before an aquaculture license can be placed in the water in accordance with a given area plan. The above figure delineates the process that the industry has to adhere to. Adapted from Osmundsen and Finne (2014).
The first, and most critical of these instruments, is the actual dispensation of aquaculture licenses, or permits, by the national government, in accordance with the Aquaculture Act of 2005 (Lovdata.no, 2005). These licenses were granted with few restrictions from 1973, when the first and temporary Aquaculture Law was effectuated. It lasted until 1977, when all license applications were denied while a permanent Aquaculture Law was put in place. This law was not in place until 1981, when the government took over the distribution of growth in the industry with regards to municipalities and regions. The ordinary licensing rounds after this time were in 1981, 1983, 1985, 1989, 2002, 2003, 2009, and 2013 (Table 1) (Holm et al., 2002; Jakobsen et al., 2003; Lovdata.no, 2003; Sønvisen, 2003; Bjørndal and Aaker, 2006; Fiskeri-og kystdepartementet, 2008; Gullestad et al., 2009; Riksrevisjonen, 2012; Andreassen and Robertson, 2014; Directorate of Fisheries, 2014b).
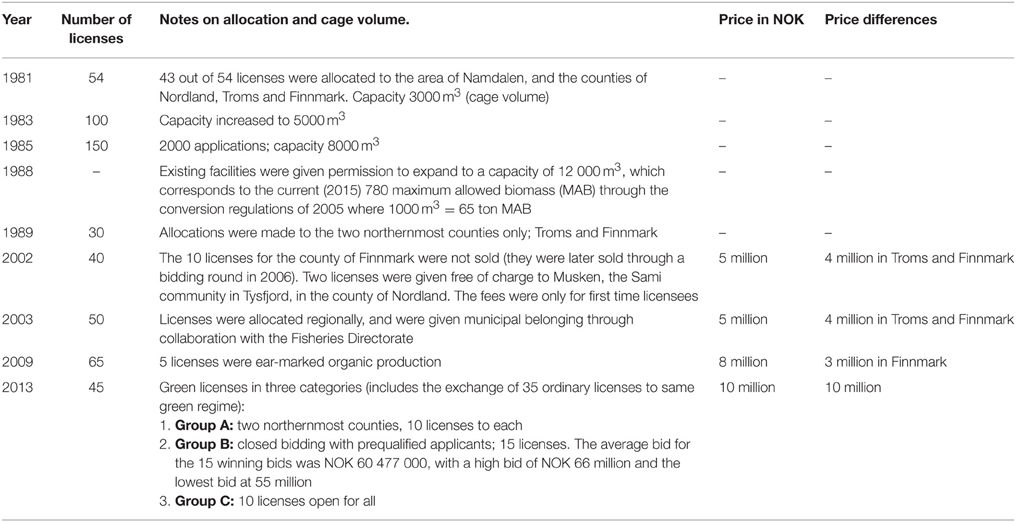
Table 1. Overview of rounds of aquaculture license allocations by the Norwegian government after the first Aquaculture Act of 1981.
Once these licenses are granted, however, applications for the location in which to place the facility must take into account not only the area plans of the municipalities. They must also take into account the legalities covered in the Aquaculture act. This is because, though the municipalities may have facilitated the process of increasing aquaculture production localities in their area plans in a given area, the Aquaculture Act determines whether or not it indeed can be allowed in the specific area, based on conditions and terms in the act itself. Furthermore, in many area plans, large marine areas are listed as multipurpose (FFFNA) areas, which in some cases can the power back to the stakeholder groups to affect what activities are best suited therein.
One of the conditions of the actual placing of aquaculture facilities in the water is that other affected sectors (step 9 in Figure 2) have given their approval decision to the application for establishment of an aquaculture facility in the given area where the industry suggests new ventures. The application is also subject to rigorous municipal hearings with affected stakeholders (step 5–6 in Figure 2), and special dispensations from the municipal planners will have to be administered if the actual area plans are to be sidestepped or changed. There are, in other words, many instances in which affected stakeholders have an opportunity to influence the government process with regards to the allocation of areas to specific purposes in a given municipality.
Theory and Methods
Stakeholders Theory
The power of one group of stakeholders to influence policy and management decisions is difficult to explain for many though. The principle of stakeholder involvement is to ensure that local stakeholders, including environmental NGOs, are involved at all level of interest in the governance process. This is natural, in that governments of democratic nations continuously make laws that influence stakeholder groups by shaping and regulating them. They are constantly faced with both the interests of new investments that could provide job opportunities, and the wishes of stakeholders. These stakeholders apply different levels of power and influence over policy decisions, and some also have the opportunity to shape policy. It has been argued, though, that stakeholders also should play a large role in determining public policy in any given issue area. This is because it arguably facilitates legitimacy in the process for the stakeholders, greater satisfaction and often more innovative solutions, and thus also compliance with legislation (Buanes et al., 2005; Young et al., 2007; Gopnik et al., 2012).
The political culture wherein stakeholder groups maneuver, however, is a reflection and a reinforcement of the political context thereof. The management of stakeholders with conflicting incentives in a given environmental circumstance is thus critical for policy makers and companies alike, in order to ensure that the project in question is able to move forward and that the field of legitimate stakeholders is taken into account so that an environmental conflict2 can be avoided. Conflicts in these cases arise for different reasons between different groups. It can be due to conflicting usage of the given resources, such as a given ocean space where fish spawn and where conditions are also prime for the offshore farming of Atlantic Salmon. It could also be between those who wish to use the resource and those who wish to conserve it, such as the capture fisheries industry wanting to harvest wild fish, and environmental organizations wanting to preserve them or aquaculture industries wanting to place net pens over the same marine space where the wild fish can be harvested. It can also be a conflict between decision makers, and those who wish a larger say in the governance process, such as interest organizations for the affected stakeholder groups (Elias, 2008).
In light of this, stakeholder theory looks at stakeholder possession of one or more of three relationship attributes within this system, namely power, legitimacy, and urgency (Mitchell et al., 1997). Accordingly, stakeholders can be classified according to their possession of one, two, or all three of these identifying attributes. Power relates to a given stakeholder's ability to influence the industry in question, or the governing sector. Legitimacy refers to the given stakeholder groups relationship with the said industry or governing sector, and Urgency refers to the claim the given stakeholder is putting forth, and the degree to which it calls for its immediate attention because it is time-sensitive and of importance to the given stakeholder. A stakeholder is thus defined by the resultant addition of power and legitimacy, which equals its legitimate use of power, or authority, on the given topic.
The salience of a given stakeholder is thus the degree to which the decision makers will give priority to claims from different stakeholder, and rate one above another. Stakeholders who possess two or more attributes will expect something from the process and have a much more salient status with policy- and decision makers than those who only possess one attribute. Table 2 is based on a figure in Mitchell et al. (1997) and gives numeric values to these attributes.
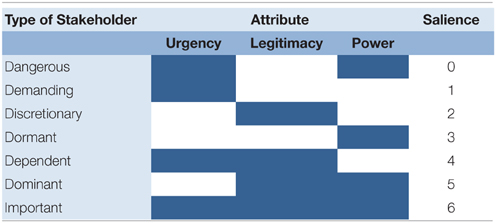
Table 2. Stakeholder attributes and corresponding salience.
The least salient group of stakeholders is the Dangerous ones. These stakeholders, though in the possession of both urgency and power, have no political legitimacy to push decision makers, but choose to do so for other reasons and sometimes using illegal and dangerous methods. Their salience is thus theoretically strong, though not for legitimate reasons and policy makers can thus not consider them highly in salience politically, since these are often associated with illegal use of force. Ranking just slightly higher than the dangerous stakeholders are those that are considered Demanding by decision makers. These are unable—or unwilling—to attain neither legitimacy nor power. What they do have are urgent claims. They are thus not considered dangerous for the decision maker, but rather an annoyance and their claim will therefore seldom have a very salient status. Discretionary stakeholders on the other hand only have legitimacy. They do not possess either a claim with an urgency associated with it nor do they have any power to influence the decision makers and they therefore lack the active relationship necessary to influence a political process. In business, these stakeholders are often recipients of Corporate Philanthropy, or Corporate Social Responsibility, such as communities where the given companies do business. Dormant stakeholders on the other hand are those that have the power to impose their will, but neither urgency nor a legitimate relationship with the decision maker. Because of the latter, their power over the process is not tapped into, and dormant. However, given that they do have this power, they also have the potential to achieve a second attribute, and thus it is a stakeholder group that needs to be accounted for and taken into consideration by the decision maker.
Dependent stakeholders though, are those that possess both legitimacy and urgency, but do not have the power, neither dormant nor awake, to push the decision makers like dominant stakeholders do. The Dominant stakeholder therefore has to show benevolence on these to aid them in their work toward their goal. This is because the Dominant stakeholders belong to a group that matters to, and demand a lot of attention from, the decision makers in any situation. These stakeholders have more saliency given that they possesses both power and legitimacy, and their influence and dominant role in the governance process is thus assured even if they have no urgent claim. In liaison with Dependent stakeholders, they are a dominant force that decision makers will take into account. An Important Stakeholder, though, is one that possesses all three attributes on his own, and is a force that decision makers will always consider, having urgency, power, and legitimacy.
Methods
The goal of this article was to assess the will of commercial fishers to provide municipal coastal planning authorities with information regarding their fisheries areas, and what influenced their willingness, or lack therof to do this. We therefore decided to develop a first generation Agent-Based simulator that could simulate the effects, according to qualitative input, of either withholding information about fishing spots to area managers or freely sharing it with the mapping authorities. Secondly, we wanted to explore their perceptions about whether their involvement as a stakeholder group had enough saliency to have an effect on the policy making process, in line with stakeholder theory. One of the reasons for this interest was that in Frøya, the commercial fishers were originally welcoming of aquaculture, as represented in results from a previous workshop held with the same group (Tiller et al., 2014). These results contradicted the rational prediction the research group had that this group ought to protest more often to municipal marine area plans that threatened their fishing sites in order to avoid a competing industry, such as that of aquaculture, from taking over the coastal resources.
Data
For the purposes of this study, we chose an innovative and interdisciplinary angle to this exploration, combining expertise in political science with multi-agent systems, in developing a first generation agent-based simulator based on qualitative data input sourced on the governance model (Figure 1), results from an earlier stakeholder workshop (Tiller et al., 2014), and discussions with experts within the research group.
Development of the First-generation Agent-based Simulator
Agent-based models of human behavior and multi-agent simulations have proven to be useful for predicting social behavior (Davidsson, 2002). Agent-based models are used to learn and teach about complex situations where agents influence and are influenced by dynamic and vulnerable environments. For example, the multiagent system in Cleland et al. (2012) simulates fishers'interaction to cooperate and harvest resources from the environment in different locations, and has been applied as a teaching tool in a social setting. Another agent-based model (Groner et al., 2013) was developed to investigate the spread and dynamics of the sea lice infestation in salmon populations, allowing study of effectiveness and optimal concentrations of wrasse without environmental risk. Farmers spreading pests through interactions were simulated (Rebaudo et al., 2011) using a combined agent-based and cellular automaton model that was applied as a teaching tool, aiming to increase awareness of how the pests spread. It is obvious that individual stakeholder agents exercise strategic thinking and decision making, and that complex societal behavior emerges from decisions taken by individuals. The main principle underlying such dynamic behavior of societies is that individuals observe other agents' behavior and change their behavior accordingly. Game theory (GT) investigates such strategic decision- making and is able to explain many prototypical dilemmas. However, GT has been criticized for being unable to capture the behavior of societies with high population. Firstly, classical GT assumes that the agents have perfect knowledge about the other agents in the environment, e.g., their payoffs. Secondly, it assumes that agents behave rationally, i.e., each individual select actions that maximize their utility. In dynamic and stochastic environments, assumption of perfect knowledge is unrealistic, and agents do not necessarily behave rationally. In addition, it is not possible to know in advance which strategies are optimal. Evolutionary game theory (EGT), on the other hand, investigates the learning of optimal strategies, rather than assuming that agents have sufficient information about their environments to decide optimal actions in advance (Smith, 1982). In EGT, individuals learn how to select an optimal behavior by imitating the strategies of the agents that receive highest payoff. This is analogous to survival of individuals with highest fitness in biological evolution (Axelrod and Hamilton, 1981). EGT methods has been used in environmental settings such as the issue of culling red deer populations through hunting, where the decisions and behaviors of land owners depend on the behavior of their neighbors (Touza et al., 2013).
The software written for this article is entitled FisherSimulation, and the program was created as part of a Master's Thesis at NTNU applying a multi-agent system to a real-world problem, in this case that of integrated coastal zone management in Frøya, Norway (Svalestuen, 2014). The core of the simulator is an evolutionary artificial neural network that implements a learning-by-imitation mechanism, an EGT method, where agents adopt the behavior of agents that made best return in the preceding round. The source code for the simulation was written in Python, following standard object-oriented programming techniques. The platform CORMAS was chosen for the project, since it is used for creating agent-based simulations, especially with an ecological focus (Le Page et al., 2012). Given that the project involves intelligent agents (fishermen, government, municipality, aquaculture industry) and ecological resources (fish), this is a suitable choice. For the purposes of this study, we define “agents” as a computer simulated variable that represented a given stakeholder group. The simulation centered on agents that corresponded to the stakeholders of fishermen and aquaculture owners, and was run with 20 simulated fishermen. The overall mechanism and the rules, the agent types and their roles, and the type of interaction between them are designed according to the description in Tiller et al. (2014).
The simulator was created to replicate the complaint behaviors related to the municipal area planning process of the stakeholders. If it weren't able to replicate them, we wanted to reveal why the simulated situation didn't correspond to real life. We also developed a municipality-agent and an agent for the government in the simulation. In the simulation, run 10 times for each configuration, these stakeholders interact through messages, and make decisions through different mechanisms. Agents are prompted for decisions in a set sequence of events that cycle over and over again, simulating a large time span. Time, however, for the purposes of this simulation, was measured in terms of coastal planning cycles. This measure does not directly correspond to a set number of days, months or years, though, since the coastal planning cycles can occur with irregular intervals. The different events that have an effect on the simulations are based on the data from Data, and thus as follows:
Coastal planning
This is an act that is performed by the municipality and consists of assigning purposes to marine areas, such as fishing, tourism, general purpose, or aquaculture, to name a few. The simulated world we developed is divided into cells that represent areas that are plentiful of fish resources (see Figure 3 for illustration of a Coastal Planning output). These cells are also attractive to the aquaculture owners, though. In the simulation, the agent “Fisher” (20 agents are simulated) is represented with boats (numbered means multiple fishers in the same location), and are located in their current “home” cells. Fish quantity in each cell can be seen by the size of the fish in the cell's top-left corner. Aquaculture facilities are shown as gray decagons, and the area around them that is blocked for fishing (as well as further aquaculture expansion) is indicated by crosses.
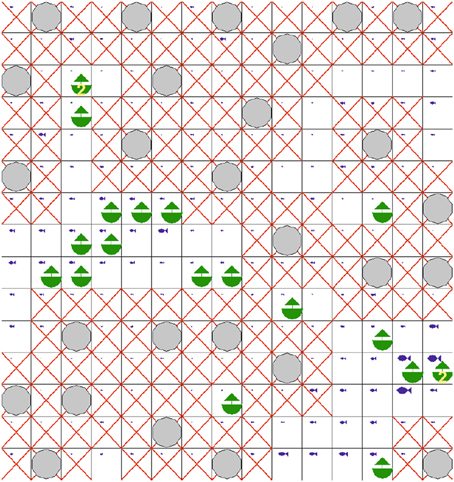
Figure 3. The world map organized as a grid structure.
Initially, the simulation will allow the municipality to reserve all slots that aren't already used by aquaculture for exclusive use for the purposes of industry expansion. When reviewing the plan, the municipality therefore assigns a reserved status to marine locations, which means they can only be occupied by aquaculture, and are thus not freely used by fishermen.
Hearing
During the hearing part of the simulation, the fishermen agents review the municipal area plan and issue formal protests to the government if there are areas among those with reserved status that they want to protect from further aquaculture expansion. This assumption of complaint is also based on the input from the data selection process. The simulation sets this decision to complain to be made on a per-cell basis by an artificial neural network that relies on three input parameters: (a) how good the fishing resource the fishermen agents currently occupy is; (b) how good the resource threatened by aquaculture in the coastal plan is (the area that has reserved status); and (c) the distance between the two cells (or areas, as they would be in real life). The simulator assumes these protests to be formal and public, so they inform other (competing) fishermen of the location of a complaint area in question as well, which also identifies a good fishing spot (since we assume that it is marked on the map by a fisher at that point). The simulator then let the agent “government” review the complaints and decide if the plan needs to be reviewed again to change the area from aquaculture to fishing based on this new information.
Fishing
Initially, in the simulation, the commercial fishers have knowledge of only one good fishing spot, namely their own cell. If this cell is blocked by aquaculture, the simulation forces them to search for a new location that they can fish in. They base this search on other fishers' formal and official complaints, but this information is initially only a guess since it is not their own knowledge. When they do harvest at the location, they get to know how good that spot actually is, but if they are sharing with another fisher they get only half payout, since there already is a fisher agent that occupies that cell.
Building
This last sequence of events represents the addition of an aquaculture cell in the simulation that effectively blocks the area for fishers. Five aquaculture facilities are built every round of the simulation, at random locations that are reserved for aquaculture in the original coastal plan and that has not been blocked by fishers complaints.
Sequence
The sequence then goes as follows (see Figure 4) in the simulation. First the municipality creates a coastal plan which contains the areas that are reserved for the aquaculture industry. In the beginning, all coastal areas are reserved for aquaculture.
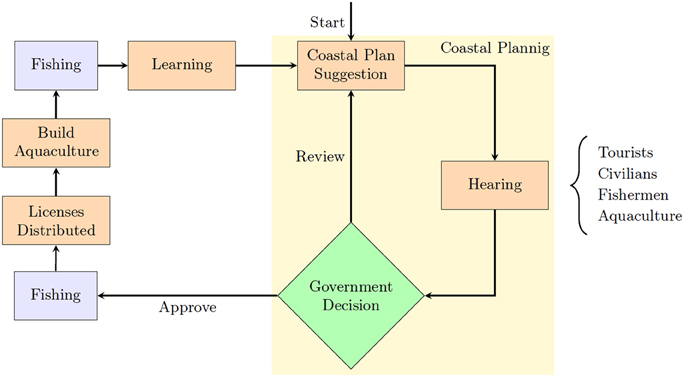
Figure 4. Process chart of the simulation.
When the plan has been completed, however, it is sent to all interested agents (including the fishers) for review. Fishers decide whether to make a complaint and send those formally to the government, which decides based on the complaints if the plan needs to be reworked or not. If it needs to be reworked, it is sent back to the municipality with a list of changes that need to be applied and the simulation goes back to the coastal planning phase. During these revisions the municipality converts aquaculture areas with approved complaints into reserved zones. If the government decides that the plan is fine, and thereby disregards complaints, the process continues with the fishing phase, where the fisher moves to a cell with an already existing fisher occupies it. If there has been three (3) hearing-planning cycles already, the simulator is set to automatically approve the plan based on experiences from the real life process. There are two fishing phases after plan approval, with the aquaculture building phase in between them. When the second fishing phase is complete, a new plan is created by the municipality, and a new round begins.
In the simulation, agents measure their performance through priority satisfaction, where agents of different types have different priorities. Fishermen prioritize their own profits most of all, but also prioritize the wealth of the community, which directly profits from aquaculture facilities, and is in line with different workshop results (Tiller et al., 2014). Fishers learn and thereby change their decision making based on which strategies are observed as more successful in the simulation, though. If agents observe that those that complain more are more successful, they will copy the strategy which results in the complaints for that agent. This copying is applied with social learning as an evolutionary process.
Stakeholder Selection and Workshop
The real life workshop where this was presented and commented on consisted of 7 representatives of the Norwegian Fishermen's Union (Norges Fiskarlag) and was conducted during the spring of 2014. The stakeholders were selected using the snowball method through their respective organization. The quality of the results sampled from this group far outweighs the relative small number, as is often the case in qualitative research studies where large samples can be ineffective and do not provide the detailed and contextual information wanted by the researcher. In a narrative analysis, which this project included, 15 was judged by the researcher to be the maximum of what would provide a holistic narrative where all participants were given ample opportunity to share, and this limit was given to the supervisor at the company in charge of selecting participants. The sample size can be as small as one or two as well, if this participant has information that is of critical value for that given sector and advances the research toward a specific goal (Sandelowski, 1995). By prior consent, the session was recorded, and the narrative from the perception workshop was used to illuminate the results.
Results
Simulation Results
An important factor of the simulation is that in order for the fishers to keep aquaculture at bay, they have to cooperate on complaining. A single fisher complaining will not be able to consistently reserve any areas since the probability of complaints being approved is less than 1 and an agent can only complain once about a given area. However, several agents complaining about the same area significantly increases the odds of a complaint about that location being approved. The population of fishers overall will therefore benefit from cooperation. This is because complaining has zero monetary cost in the simulation. However, there is an associated information cost when agents reveal their good fishing spots by complaining about the allocation of aquaculture localities in the same spot. This cost is not an explicit part of the decision making process, but rather a consequence of complaining, and thus this information sharing cost is learned through experience as well. Individual fishers are therefore disadvantaged by complaining since they thereby share information about the best fishing spot they know of.
When running the simulation for 30 rounds, the outcomes can be classified in two kinds: a collapse and stabilization (Figure 5). In the first outcome, the collapse, the average number of complaints from fishers in each round plummets and reaches zero (0) almost immediately, which eventually results in the whole map being flooded with aquaculture facilities. This outcome is labeled a “collapse.” In the other outcome, the stabilization, the simulation doesn't collapse, and the complaining rate of fishers stabilizes at a non-zero level and aquaculture expansion stops after a while, resulting in a stable equilibrium of complaints. According to the specifications of our simulation, when fishers end up not complaining, it is because they observe that complaining doesn't work. The average fisher fitness is higher in stabilized outcomes than collapsed ones, which means that there are other influences on the outcome than a pure evolutionary process would optimize. There are stochastic effects originating from varying degrees in information in the agents, which can result in the sub-optimal outcome. Fishers have different knowledge about fishing spots, and when they learn the value of a spot that information may be false if there is more than one fisher operating there, which results in reduced income for them. It was furthermore one of our expectations, which was also built into the simulation, that the simulated fishers always complained because if enough fishers complain they can protect a larger area from aquaculture expansion, which in turn would protect the income of the fishers. However, sufficient complaints to protect an area only occur in simulations with a 50% frequency, which is lower than expected.
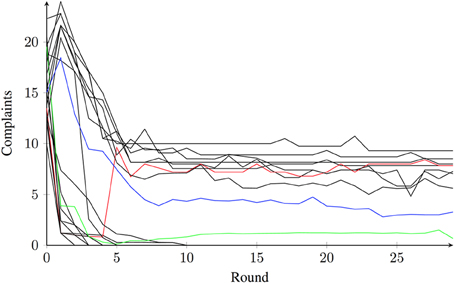
Figure 5. Average number of complaints for each round of 20 simulations using the same configuration. The three highlighted plots (red, blue, and green) are of special interest because they have attributes that distinguish them from the rest. Non-highlighted plots show regular collapsed and stabilized outcomes. Out of the non-highlighted plots, there are 8 stabilized runs and 9 collapsed ones. The three highlighted runs are all classified as stabilized ones. The red plot (top highlighted one) shows the only run where the average number of complaints rapidly falls in the beginning, but recovers and stabilizes around the same level as the normal stabilized runs. The green plot also shows a run that falls rapidly and recovers, but the recovery is at a much lower level. The blue plot shows the lowest stability level with a normal profile.
Stakeholder Workshop Results
When presenting the results from the simulation to fishers in Frøya during the stakeholder workshop, the main point of feedback was first that the results of the simulation were not realistic. They specified that the stakeholder group, in the simulation called “agent,” the commercial fishers, had in fact only complained twice to municipal area plans. In these two cases, aquaculture had in fact been placed on top of fishing sites. Nevertheless, though they had well-documented reasoning and put in large efforts in the complaint process, neither complaint was approved. Eventually, aquaculture companies obtained permission to establish in the locations.
We then went on to demonstrate this “collapse” outcome to them in the Agent-Based simulation, visualizing a setting in which the complaint approval rate was set to zero (0), and which in turn would therefore result in total collapse and all that the coastal resources would be blocked by aquaculture expansion, something which the fishers nodded and agreed to. We explained that in the simulation, the agent fisher mainly received revenue from fishing activities, but since they are community members, they also receive tax benefits indirectly from aquaculture companies. This was also input that was derived from the stakeholder workshop held earlier, and which the fishers themselves had specified (Tiller et al., 2014). Typically fishermen's capital therefore showed a slight increase in the beginning of the simulation, when the number of aquaculture facilities is increasing. Later it declines when the fishermen are pushed away from their preferred fishing spots, either by aquaculture facilities establishing, or by blocked areas as a consequence of those facilities.
We also explained that “Average fisherman fitness” signified the evolutionary fitness of each fisherman, averaged over all fishermen. Fitness is a term from evolutionary algorithms in computer science, and is a learning mechanism used in the system. For fishermen, their fitness is calculated as their combined satisfaction of various priorities, which were set based on the results from the first set of participatory workshops. The most important priority for fishermen at that workshop was their own profits, which was their capital, and what would ensure their industry to survive. Another priority that was important for the fitness of the fisherman was community wealth, which was influenced by aquaculture which gives back to the community in a variety of forms. This balance often causes fitness to stay relatively stable, even if fishing spots are disappearing, since it means effectively that the community will be richer as a consequence of more aquaculture industry.
One comment from a fisher, when seeing the simulation play out (Figure 6), was that it was obvious that the commercial fishers were being pushed out to the edges, slowly but surely, through the simulation process and that if we were to run the simulation a few more rounds we would see that the fishers would be completely pressed out, which indeed was correct. The reason for this, the fishers argued, was that even if the plans did state that there could not be aquaculture in a given locality, because there were fishing activities there, the industry would then make a complaint to the regional government (Fylkeskommunen) and ask for a dispensation to bypass the municipality plans, which they felt in all cases were granted. This is in line with stakeholder theory, in that not only the commercial fishers are stakeholders, but also the aquaculture industry, and in the case of Frøya, the latter has a saliency of 6, with the attributes of power, urgency and legitimacy all demonstrated.
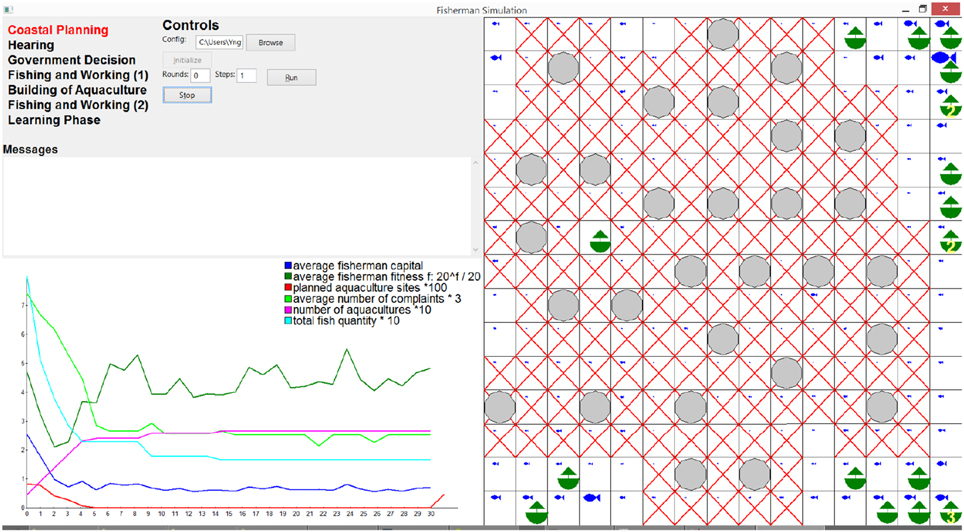
Figure 6. Screenshot of the graphical user interface of FisherSimulation.
Discussion
Though the fishers had initially proclaimed that the simulation did not represent real life for them, we suggest that it did, most specifically with regards to the collapse outcome, with the fishers being pressed from all angles and in the end losing all their fishing grounds because of lack of complaints. However, our assumption in model input, where we specified that it would be most beneficial to cooperate as a group of fishers, and report all fishing spots, which would lead to aquaculture not being allowed on those spots, was wrong. The fishers emphasized at their lack of action, which they perceived was leading to a real life collapse, was due to an observation that it did not matter what they did. They felt that it had no effect, and therefore nobody complained, and in turn, all areas were taken over by aquaculture. In turn, they said that the simulation was correct in that they then had to move to new fishing spots, where there already were fishers. “We don't have a choice—we have to look for new spots” they exclaimed. They explained that it was usually an unwritten rule that the fishers had their own private fishing areas. If you had been in a spot for say 10 years, that would be your spot, and others accepted and respected it by refraining from fishing in those areas. But this all disappeared if something, like aquaculture, would take over your own spot.
It wasn't the threat of having to share your fishing spot with other fishers that hindered them from complaining though; it was just the exasperation of knowing that it wouldn't lead to anything anyways. Also, they emphasized that Frøya was a small island community, and that it was easy to be put on the spot and be the focus of negative attention if they made a complaint that could negatively affect the aquaculture industry. “We are friends with those in the aquaculture industry, and we might even have close relatives that work in the industry” they explained. It was furthermore tough to get heard, they argued, when they lived in a municipality that stood to earn a lot of money from aquaculture localities being allocated in the area plans. This was in reference to when in June of 2013, the Norwegian Directorate of Fisheries announced the allocation of 45 new concessions (licenses) for aquaculture (see Table 1). The new licenses were divided into three different groups, with separate allocations within each (20 licenses for the two regions farthest north, Troms and Finnmark); 15 open licenses with closed bidding rounds and; 10 open licenses). The results of the bidding rounds for the 15 open licenses were that in the prequalified closed bidding group, was that the 15 highest bids were granted licenses. This essentially revealed the official market value of the licenses, with the average bid of these 15 being 56,6 million NOK (approximately USD 8,7 million). One of the big winners in this bidding war was Salmar, the aquaculture company with extensive operations in Frøya (Directorate of Fisheries, 2014a). Salmar had 8 of the 15 highest bids, with concession fees totalling 494 million NOK (approximately USD 76). Of this total concession fee for Salmar alone, NOK 86 million (USD 13 million) will be transferred to the host municipalities for the first time, based on where the localities for the concessions are allocated. It is expected that Frøya municipality will receive NOK 16,13 million (USD 2,5 million) as compensation for setting aside ocean space for these operations (Rønningen, 2014).
The fishers still emphasized though, at the same time, that they saw the benefits of aquaculture for their community as well, which echoed the first workshop results as well. The standard of living had been raised and infrastructure was better, and it was good for schools and retirement homes, they argued - but there should be room for more actors as well, they said. “Us as fishermen don't get anything directly back from this, but as inhabitants of Frøya, we do,” they said. They felt that they could have taken care of the commercial fishermen as well, though, and not just the aquaculture industry.
Conclusion
In the current article, we have explored what steers the will of the fishers to provide coastal planners with important information regarding the location of their fishing areas for the purposes of adding these to the official area plans. In one case, we expected fishers to either over-report areas of great fishing, in order to obtain more zones that would prohibit aquaculture facilities in the proximity of their fishing spots. In another case, we expected them to under-report it, as revealing these fishing spots could encourage other fishers to also encroach on their area, which might have been a long kept family secret. Our goal was to test to see whether the coastal planning process and hearings regarding the industry application for localities would conform to the Norwegian system of inclusion of stakeholders and their resultant trust in the governance process. The Fishermen's Union is relatively large in membership, and is incorporated into the process of forming policy through tripartite conversation. This means that policy often is made in concert between the executive branch of government, peak business that are often dominated by large export-oriented firms (such as the aquaculture industry in this case), as well as labor federations such as stakeholders groups for fishermen (Lijphart, 1999; Siaroff, 1999; Dryzek et al., 2003).
In looking at the planning and building act (Lovdata.no, 2008) and the official documents that prescribe the planning process, as well as the localities process, we find that this on paper is correct in this setting, which was also reflected in the simulation developed for the purposes of this study. The simulator was created to replicate the complaint behaviors related to the municipal area planning process of this given set of stakeholders; or if it weren't able to replicate them, reveal why the simulated situation didn't correspond to real life. The simulations provided two results that were occurring at an equal rate. One was the “collapse” outcome, with no complaints being filed and aquaculture taking over the area. The other was one of stabilization, where expansion of aquaculture stops after a while. The fishers, that were the stakeholders investigated in this case to comment upon their own “agents” in the simulation, were in agreement that the simulation outcome “collapse” indeed was what they were experiencing in real life, in that they had stopped making complaints after experiencing that there was no effect to it, and that the aquaculture industry was more powerful than them in determining policy in not only their municipality but also in the region as a whole. Though Norway is a stakeholder inclusive state, attempting to anticipate and organize stakeholders into the state itself (Dryzek et al., 2003), this is not contrary to the experiences of the fishers despite their lack of influence on the system to steer it in their benefit. This is because, when one applies stakeholder theory to this experience, one sees that the aquaculture industry is also a stakeholder in this process. As such, we know that stakeholders can be classified according to their possession of one, two, or all three of the main identifying attributes of their group with regards to their level of power, legitimacy and the urgency of their claim. Power relates to a given stakeholder's ability to influence the process in question, or the decision maker sector, which in this case is the allocation of marine areas or the actual allocation of localities after the licenses have been granted. Legitimacy refers to the given stakeholder groups relationship with the governing sector in question and Urgency refers to the claim the given stakeholder is putting forth, and the degree to which it calls for its immediate attention because it is time-sensitive and of importance to the given stakeholder. When two stakeholders are on opposite sides of a process and both attempt to influence the system, the saliency, or number of attributes it possesses, is instrumental. In the case of the stakeholders commercial fishers and the aquaculture industry, we find that the former are Dependent stakeholders, by possessing both legitimacy and urgency, but do not have the power. The aquaculture industry, however, especially in the case of Frøya, is an Important Stakeholder by possessing all three attributes on his own, and is a force that decision makers will always consider, having urgency, power and legitimacy. However, we also expect that in other areas in Norway, other stakeholder groups will have this attribute, with the aquaculture industry playing the role of the dependent stakeholder. In the end, however, it is the national government, working alongside both interest groups that will determine who gets what and how much of the resource that marine area in fact is.
Ethics Statement
Ethical approval was not necessary as the process was anonymous, in accordance with regulations at the Norwegian Social Science Data Services.
Conflict of Interest Statement
The authors declare that the research was conducted in the absence of any commercial or financial relationships that could be construed as a potential conflict of interest.
Acknowledgments
The author would like to acknowledge the Norwegian Research Council (NRC) for their generous financial support of the STARR and CINTERA project, which enabled the effectuation of the research in this article. The Fisheries Directorate gave useful comments on the license distribution over time. Advisor Ingeborg Ratvik, at SINTEF Fisheries and Aquaculture, provided comments and feedback on aquaculture facts in the article. The Gemini Center for Sustainable Fisheries (NTNU/SINTEF) is also acknowledged for laying the groundwork and encouraging the interdisciplinary and international collaboration of this article.
Footnotes
1. ^The aquaculture industry is defined in the current article as the farming of Atlantic Salmon (Salmo salar) within the framework of the production process of placing produced smolts in sea cages for saltwater growing until the fish reaches the size that is suitable for market purposes.
2. ^An environmental conflict is, according to the Environmental Policy and Conflict Resolution Act of 1998 (Huemer, 2010), defined as a dispute or conflict, disagreements, which relate to topics of the environment held in the public trust and natural resources generally.
References
Abdallah, P. R., and Sumaila, U. R. (2007). An historical account of brazilian public policy on fisheries subsidies. Mar. Pol. 31, 444–450. doi: 10.1016/j.marpol.2007.01.002
Andreassen, O., and Robertson, R. (2014). “Eierendringer for Havbrukskonsesjoner Tildelt I 2009,” in Secondary Eierendringer for Havbrukskonsesjoner Tildelt I 2009, Secondary. Available online at: http://www.nofima.no/filearchive/rapport-4-2014-eierendringer-for-havbrukskonsesjoner-tildelt-i-2009-runden.pdf
Axelrod, R., and Hamilton, W. (1981). The evolution of cooperation. Science 2, 1390–1396. doi: 10.1126/science.7466396
Bjørndal, T., and Aaker, H. (2006). “Konsesjonar Og Konsesjonsverdi I Norsk Oppdrettsnæring,” in Secondary Konsesjonar Og Konsesjonsverdi I Norsk Oppdrettsnæring, Secondary. Available online at: http://brage.bibsys.no/xmlui/bitstream/handle/11250/166108/A39_06.pdf?sequence=1&isAllowed=y
Buanes, A., Jentoft, S., Maurstad, A., Søreng, S. U., and Karlsen, G. R. (2005). Stakeholder participation in norwegian coastal zone planning. Ocean Coast. Manag. 48, 658–669. doi: 10.1016/j.ocecoaman.2005.05.005
Christensen, P. (2014). Norwegian Fisheries- and Coastal History IV - The Sea, the Fish and the Oil, 1970-2014 (In Norwegian: Norges Fiskeri- og Kysthistorie Bind IV - Havet, Fisken og Oljen, 1970–2014). Bergen: Fagbokforlaget.
Cleland, D., Dray, A., Perez, P., Cruz-Trinidad, A., and Geronimo, R. (2012). Simulating the dynamics of subsistence fishing communities: reefgame as a learning and data- gathering computer-assisted role-play game. Simul. Gaming 43, 102–117 doi: 10.1177/1046878110380890
Davidsson, P. (2002). Agent based social simulation: a computer science view. J. Artif. Soc. Soc. Simulat. 5:7. Available online at: http://jasss.soc.surrey.ac.uk/5/1/7.html
Delgado, C. L., and Institute International Food Policy Research, Center WorldFish. (2003). Fish to 2020: Supply and Demand in Changing Global Markets. Washington, DC; Penang: International Food Policy Research Institute; WorldFish Center.
Directorate of Fisheries. (2014a). The Bids for Green Concessions Group B Are Publicly Available (“Boda for Grøne Løyve Gruppe B Er Opna” in Norwegian). Available online at: http://www.fiskeridir.no/akvakultur/groene-loeyve/boda-for-groene-loeyve-gruppe-b-er-opna
Directorate of Fisheries. (2014b). Boda for Grøne Løyve Gruppe B Er Opna. Available online at: http://www.fiskeridir.no/akvakultur/groene-loeyve/boda-for-groene-loeyve-gruppe-b-er-opna
Directorate of Fisheries. (2014c). “Utlisting Fra Fiskermanntallet (List Display of the Fishers Census) in Norwegian. Search: Region—Sør Trøndelag; Municipality: Frøya,” in Secondary Utlisting Fra Fiskermanntallet (List Display of the Fishers Census)—in Norwegian. Search: Region—Sør Trøndelag; Municipality: Frøya, Secondary. Available online at: http://www.fiskeridir.no/register/fiskermanntallet/?m=utl_mant&s=1
Douvere, F. (2008). The importance of marine spatial planning in advancing ecosystem-based sea use management. Mar. Pol. 32, 762–771. doi: 10.1016/j.marpol.2008.03.021
Dryzek, J., Downs, D., Hernes, H.-K., and Schlosberg, D. (2003). Green States and Social Movements: Environmentalism in the United States, United Kingdom, Germany, and Norway. Oxford: Oxford University Press.
Elias, A. A. (2008). Towards a shared systems model of stakeholders in environmental conflict. Inter. Trans. Operat. Res. 15, 239–253. doi: 10.1111/j.1475-3995.2008.00631.x
FAO. (2014a). National Aquaculture Sector Overview. Norway. FAO Fisheries and Aquacutlure Department [online]. Available online at: http://www.fao.org/fishery/countrysector/naso_norway/en
FAO. (2014b). “The state of world fisheries and aquaculture 2014: opportunities and challenges,” in Secondary The State of World Fisheries and Aquaculture 2014: Opportunities and Challenges, Secondary. Available online at: http://www.fao.org/3/a-i3720e.pdf.
FAO Fisheries Aquaculture Department. (2010). “The state of world fisheries and aquaculture 2010,” in Secondary The State of World Fisheries and Aquaculture 2010, Secondary. Rome.
Fiskeri-og kystdepartementet. (2008). St.Prp. Nr. 1 Tillegg Nr. 4 (2008–2009): Om Endring Av St.Prp. Nr. 1 Om Statsbudsjettet 2009 (Nye Løyve Til Oppdrett Av Laks, Aure Og Regnbogeaure I 2009), Det kongelige Fiskeri- og Kystdepartement. Available online at: https://www.regjeringen.no/contentassets/342a073e6f454e3e89977cd729334145/nn-no/pdfs/stp200820090001t04dddpdfs.pdf
Foss, J. G., and Hammer, H. U. (1997). Frøya Fiskeindustri Gjennom 50 År. Dyrvik: Frøya fiskeindustri.
Fu, W., Gandhi, V. P., Cao, L., Liu, H., and Zhou, Z. (2012). Rising consumption of animal products in China and India: national and global implications. China World Econ. 20, 88–106. doi: 10.1111/j.1749-124X.2012.01289.x
Garcia, S. M., and Rosenberg, A. A. (2010). Food security and marine capture fisheries: characteristics, trends, drivers and future perspectives. Philos. Trans. R. Soc. B 365, 2869–2880. doi: 10.1098/rstb.2010.0171
Gopnik, M., Fieseler, C., Cantral, L., McClellan, K., Pendleton, L., and Crowder, L. (2012). Coming to the table: early stakeholder engagement in marine spatial planning. Mar. Pol. 36, 1139–1149. doi: 10.1016/j.marpol.2012.02.012
Groner, M. L., Cox, R., Gettinby, G., and Revie, C. (2013). Use of agent-based modelling to predict benefits of cleaner fish in controlling sea lice, lepeophtheirus salmonis, infes- tations on farmed atlantic salmon, Salmo Salar L. J. Fish Dis. 36, 195–208. doi: 10.1111/jfd.12017
Gullestad, P., Bjørgo, S., Eithun, I., Ervik, A., Gudding, R., Hansen, H., et al. (2009). “Effective and sustainable area use in the aquaculture industry (in Norwegian: Effektiv Og Bærekraftig Arealbruk I Havbruksnæringen),” in Secondary Effective and Sustainable Area Use in the Aquaculture Industry (in Norwegian: Effektiv Og Bærekraftig Arealbruk I Havbruksnæringen), Secondary. Available online at: https://www.regjeringen.no/globalassets/upload/fkd/vedlegg/rapporter/2011/effektiv_og_baerekraftig_arealbruk_i_havbruksnaeringen.pdf?id=2222470
Holm, J. C., Eithun, I., Jahnsen, T., Møgster, F., Postmyr, E., Stuevold, G., et al. (2002). “Mtb: Nytt system for produksjonsregulering Og Avgrensning Av Matfiskoppdrett,” in Secondary Mtb: Nytt System for Produksjonsregulering Og Avgrensning Av Matfiskoppdrett, Secondary. Available online at: www.fiskeridir.no/content/download/1630/9649/version/1/file/innstilling150802.pdf
Huemer, L. (2010). Corporate social responsibility and multinational corporation identity: norwegian strategies in the chilean aquaculture industry. J. Bus. Ethics 91, 265–277. doi: 10.1007/s10551-010-0618-7
Islam, M. S. (2014). Confronting the Blue Revolution: Industrial Aquaculture and Sustainability in the Global South. Toronto, CA: University of Toronto Press.
Jakobsen, S.-E., Berge, D. M., and Aarset, B. (2003). “Snf-Prosjekt Nr. 4291: Regionale Og Distriktspolitiske Effekter Av Statlig Havbrukspolitikk,” in Secondary Snf-Prosjekt Nr. 4291: Regionale Og Distriktspolitiske Effekter Av Statlig Havbrukspolitikk, Secondary. Available online at: https://www.regjeringen.no/globalassets/upload/kilde/krd/rap/2003/0006/ddd/pdfv/182943-a16_03.pdf
Le Page, C., Becu, N., Bommel, P., and Bousquet, F. (2012). Participatory agent-based simulation for renewable resource management: the role of the cormas simulation platform to nurture a community of practice. J. Arti. Soc. Soc. Simulat. 15:10. doi: 10.18564/jasss.1928
Lijphart, A. (1999). Patterns of Democracy: Government Forms and Performance in Thirty-Six Countries. New Haven, CT: Yale University Press.
Lovdata.no. (2003). “Forskrift Om Tildeling Av Konsesjoner for Matfiskoppdrett Av Laks Og Ørret I Sjøvann,” in FOR-2003-10-17-1245, ed Fiskeri- og kystdepartementet. Available online at: https://lovdata.no/dokument/LTI/forskrift/2003-10-17-1245:Lovdata.no
Lovdata.no. (2005). “Akvakulturloven,” in LOV-2005-06-17-79, ed Nærings- og fiskeridepartementet. Available online at: http://lovdata.no/dokument/NL/lov/2005-06-17-79
Lovdata.no. (2008). “Lov Om Planlegging Og Byggesaksbehandling (Plan- Og Bygningsloven),” in LOV-2008-06-27-71, ed Kommunal- og moderniseringsdepartementet. Available online at: https://lovdata.no/lov/2008-06-27-71
Meiner, A. (2010). Integrated maritime policy for the european union—consolidating coastal and marine information to support maritime spatial planning. J. Coast. Conserv 14, 1–11. doi: 10.1007/s11852-009-0077-4
Ministry of Trade Industry Fisheries. (2014). Meld. St. 16 (2014-2015) Forutsigbar Og Miljømessig Bærekraftig Vekst I Norsk Lakse- Og Ørretoppdrett. ed Det Kongelige Nærings- og Fiskeridepartement. Available online at: https://www.regjeringen.no/nb/dokumenter/meld.-st.-16-2014-2015/id2401865/?docId=STM201420150016000DDDEPIS&ch=1&q=laks%20distrikt&redir=true&ref=search&term=laks%20distrikt:Regjeringen.no
Mitchell, R. K., Agle, B. R., and Wood, D. J. (1997). Toward a theory of stakeholder identification and salience: defining the principle of who and what really counts. Acad. Managem. Rev. 22, 853–886.
Osmundsen, T. C., and Finne, H. (2014). “Modell for Samhandling Og Forvaltning I Regional Marin Sektor—En Veileder (Engl: Model for Cooperation and Management in Regional Marine Sectors—a Guideline),” in Secondary Modell for Samhandling Og Forvaltning I Regional Marin Sektor—En Veileder (Engl: Model for Cooperation and Management in Regional Marine Sectors—a Guideline), Secondary. Available online at: http://www.fornymar.no/Gjennomforing/Documents/Fornymar_Rapport_15.pdf
Pedersen, H. (2006). “Hva Må Vi Gjøre for Å Sikre Lys I Husan? “What Do We Have to Do to Ensure That Homes Have Lights On?” ed Minister of Fisheries and Coastal Affairs. Ministry of Fisheries and Coastal Affairs. Available online at: https://www.regjeringen.no/no/aktuelt/hva-ma-vi-gjore-for-a-sikre-lys-i-husan/id113908/
Rebaudo, F., Crespo-Perez, V., Silvain, J.-F., and Dangles, O. (2011). Agent-based modeling of human-induced spread of invasive species in agricultural landscapes: insights from the potato moth in ecuador. J. Artif. Soc. Soc. Simulat. 14:7. doi: 10.18564/jasss.1802
Regjeringen Stoltenberg II. (2005-2009). Plattform for Regjeringssamarbeidet Mellom Arbeiderpartiet Sosialistisk Venstreparti Og Senterpartiet. Available online at: https://www.regjeringen.no/globalassets/upload/smk/vedlegg/2005/regjeringsplatform_soriamoria.pdf.
Richardson, A. J., Bakun, A., Hays, G. C., and Gibbons, M. J. (2009). The jellyfish joyride: causes, consequences and management responses to a more gelatinous future. Trends Ecol. Evol. 24, 312–322. doi: 10.1016/j.tree.2009.01.010
Riksrevisjonen. (2012). “Riksrevisjonens Undersøkelse Av Havbruksforvaltningen, Dokument 3:9 (2011–2012),” in Secondary Riksrevisjonens Undersøkelse Av Havbruksforvaltningen, Dokument 3:9 (2011–2012), Secondary. Available online at: https://www.riksrevisjonen.no/rapporter/Documents/2011-2012/Dokumentbase_3_9_2011_2012.pdf
Rønningen, B. L. (2014). Sums in the Double Digit Millions Accrued by Frøya (“Tosifret Millionbeløp Tilfaller Frøya: Salmars Grønne Oppdrettskonsesjoner Gir I Alt 86 Millioner Til 13 Vertskommuner” in Norwegian). Hitra-Frøya, November 4th.
Sandberg, M. G., Henriksen, K., Aspaas, S., Bull-Berg, H., and Johansen, U. (2014). “Value Creation and Employment in the Norwegian Seafood Industy in 2012—a Multiplier Effect Analysis (in Norwegian),” in Secondary Value Creation and Employment in the Norwegian Seafood Industy in 2012—A Multiplier Effect Analysis (in Norwegian), Secondary. Trondheim, Norway: SINTEF Fiskeri og havbruk.
Siaroff, A. (1999). Corporatism in 24 industrial democracies: meaning and measurement. Eur. J. Polit. Res. 36, 175–205. doi: 10.1111/1475-6765.00467
Sønvisen, S. A. (2003). Integrated Coastal Zone Management (Iczm). The Allocation of Space in Norwegian Aquaculture—from Local Lottery to Central Planning? Tromsø: University of Tromsø.
Sørtrøndelag Fylkeskommune. (2010). Kystsoneplan. Available online at: http://www.stfk.no/en/Tjenester/Plan_klima_og_Miljo/Kystsoneplan/
Statistics Norway. (2013). “Population changes in the municipalities,” in Secondary Population Changes in the Municipalities, Secondary.
Svalestuen, Y. (2014). An Application of Agent-Based Simulation to a Natural Resource Dilemma: Understanding Payoff, Decision Making, and Learning of Stakeholders through a Simulated Environment. Trondheim: NTNU.
The Norwegian Mapping Authority. (2014). Area Statistics for Norway (in Norwegian: Arealstatistikk for Norge). Available online at: http://www.statkart.no/Kunnskap/Fakta-om-Norge/Arealstatistikk/Oversikt/
Tiller, R., Brekken, T., and Bailey, J. (2012). Norwegian aquaculture expansion and integrated coastal zone management (Iczm): simmering conflicts and competing claims. Mar. Pol. 36, 1086–1095. doi: 10.1016/j.marpol.2012.02.023
Tiller, R., Gentry, R., and Richards, R. (2013). Stakeholder driven future scenarios as an element of interdisciplinary management tools; the case of future offshore aquaculture development and the potential effects on fishermen in Santa Barbara, California. Ocean Coast. Manag. 73, 127–135. doi: 10.1016/j.ocecoaman.2012.12.011
Tiller, R., Richards, R., Salgado, H., Strand, H., Moe, E., and Ellis, J. (2014). Assessing stakeholder adaptive capacity to salmon aquaculture in Norway. Consilience J. Sustain. Dev. 11, 62–96.
Touza, J., Drechsler, M., Smart, J., and Termansen, M. (2013). Emergence of cooperative behaviours in the management of mobile ecological resources. Env. Model. Softw. 45, 52–63. doi: 10.1016/j.envsoft.2012.03.015
Van auken, P. M., and Fredrik Rye, J. (2011). Amenities, affluence, and ideology: comparing rural restructuring processes in the Us and Norway. Landsc. Res. 36, 63–84. doi: 10.1080/01426397.2010.536203
van Vliet, M., Kok, K., and Veldkamp, T. (2010). Linking stakeholders and modellers in scenario studies: the use of fuzzy cognitive maps as a communication and learning tool. Futures 42, 1–14. doi: 10.1016/j.futures.2009.08.005
Webb, S. (2007). Biochemistry: gooey solution to a sticky problem. Sci. News 172, 29. doi: 10.1002/scin.2007.5591720213
Keywords: fisheries, aquaculture, stakeholder, power, simulation, interdisciplinary, area planning, coastal zone management
Citation: Tiller RG, Svalestuen Y, Öztürk P and Tidemann A (2015) Simulating Stakeholder Behavior in a Marine Setting: Integrated Coastal Zone Planning and the Influential Power of Selected Stakeholders in Frøya, Norway. Front. Mar. Sci. 2:90. doi: 10.3389/fmars.2015.00090
Received: 07 July 2015; Accepted: 19 October 2015;
Published: 17 November 2015.
Edited by:
Simone Libralato, Istituto Nazionale di Oceanografia e di Geofisica Sperimentale, ItalyReviewed by:
Fabio Pranovi, University of Venice, ItalyValeria Mamouridis, Institut de Ciències del Mar (ICM-CSIC), Spain
Copyright © 2015 Tiller, Svalestuen, Öztürk and Tidemann. This is an open-access article distributed under the terms of the Creative Commons Attribution License (CC BY). The use, distribution or reproduction in other forums is permitted, provided the original author(s) or licensor are credited and that the original publication in this journal is cited, in accordance with accepted academic practice. No use, distribution or reproduction is permitted which does not comply with these terms.
*Correspondence: Rachel G. Tiller, rachel.tiller@sintef.no