Direct Deposition of Crystalline Aragonite in the Controlled Biomineralization of the Calcareous Tubeworm
 Vera B. S. Chan1,2
  Takashi Toyofuku3
  George Wetzel4
  Laxmikant Saraf4
  Vengatesen Thiyagarajan1*
  Andrew S. Mount2*
- 1Swire Institute of Marine Sciences and School of Biological Sciences, The University of Hong Kong, Hong Kong, China
- 2Department of Biological Sciences, Clemson University, Clemson, SC, USA
- 3Department of Marine Biodiversity Research, Japan Agency for Marine-Earth Science and Technology, Yokosuka, Japan
- 4Advanced Material Research Laboratory, Clemson University, Clemson, SC, USA
Although space delineation is a well-accepted requirement for biologically controlled biomineralization, the actual location of the mineralizing compartment within marine invertebrates has only recently been determined. We observed that the biomineralization was compartmented within the collar region of the metamorphosing larvae of Hydrodies elegans at its earliest possible time, i.e., at the post-metamorphic stage. We have also found that these highly regulated compartments contained aragonite crystals, as detected by EBSD and confirmed by electron diffraction TEM. Within these compartments, the metamorphosed larvae maintained a pH 9, at the pKa for CaCO3 formation. This model describes how biomineralization is a space delineation event in which calcium carbonate formation is an intracellular phenomenon.
Significance statement: Using the tubeworm, a popular invertebrate model for marine research, we propose a unifying mechanism of calcification that emphasizes the importance of specialized mineralizing compartments in providing delineated space for controlled biomineralization within a multicellular organism. Through the use of correlative microscopy, we have demonstrated the functional observation of organisms under fluorescent microscopy can be directly followed by performing structural analysis using the extreme edge of electron microscopy, specifically SEM-EBSD and FIB-TEM. Unlike conventional fluorescent observations that require the use of fixation artifacts that are inevitable in electron microscopy, this novel method of understanding both the function and structure of any calcifying organism avoids such artifacts, while still providing a higher structural resolution.
Introduction
Tubeworms from the family Serpulidae belong to a major group of calcifying polychaetes, which produce exquisite tube ultrastructures that display a wide variety of mineralogical properties (Vinn et al., 2008; Smith et al., 2013). Simple calcifying marine organisms such as coccolithophores, calcareous green algae, and foraminifera have been the popular candidates in biomineralization research (de Nooijer et al., 2009; Lohbeck et al., 2014; Wizemann et al., 2015). Among the more complex calcifying marine animals such as mollusks and echinoderms, the serpulid worms is a taxonomically disctinctive group of calcifiers, and it produces considerable biomass in both facilitating marine species in the temperate waters, and creating biofouling concerns in global oceans (Qiu et al., 2003; Smith et al., 2013). Although, the process of serpulid tube deposition was the subjected of a few early studies, the true origin of crystals remained a mystery. For example, Hedley (1956a,b) described a pair of calcium secretion glands under the fold of the collar region of the tubeworm which involved crystal deposition via secretory mechanisms (Neff, 1969, 1971; Nott and Parkes, 1975). During tube formation, mucus-rich calcium carbonate is secreted in the form of a slurry in which the collar tissues acted like a mold for accumulation and solidification (Hedley, 1956a,b). While this model explains the accretion of irregularly oriented tube ultrastructures that are found in approximately half (54%) of the serpulid species studied (Vinn et al., 2008), further examination is necessary to explain the construction of many diverse oriented tube structures that are present in many serpulid species (Vinn et al., 2009).
One of the primary requirements for calcification in marine invertebrates is the presence of a compartmentalized space in which the reaction conditions can support calcium carbonate formation (Lowenstam and Weiner, 1989). For example, foraminifera has a great level of biological control in its mineralization. Calcium and carbon pools are present for calcification of the new calcium carbonate chambers (Erez, 2003), and the deposition of mineral involves tiny membrane bound vesicles (Spero, 1988; Bentov and Erez, 2005; de Nooijer et al., 2014) which were later found to be an active cellular process of endocytosis and exocytosis (Bentov et al., 2009). Elucidating these calcification pathways in the living tubeworm requires understanding the movement of the cation Ca2+ and anion lattice ions from their source to the crystal product CaCO3 (Weiner and Addadi, 2011). To meet the conditions of CaCO3 nucleation, the calcification environment must maintain a suitable alkaline pH to favor crystal formation. An elevation of intracellular pH indicates a favorable deprotonation of the anion into , and as the pH approaches 9.0 (CaCO3 pKa = 9.0), the precipitation of CaCO3 is favored (Stumm and Morgan, 1996). This formation is achieved through the elimination of hydrogen ions that are generated during the process of CaCO3 formation (Jokiel, 2011). Therefore, empirical observations of the in vivo cellular environment in terms of Ca2+ concentration and pH distribution during active calcification are crucial for understanding both the lattice ion movements, and the CaCO3 formation. To obtain such information, we used calcein as a putative CaCO3 indicator and employed ratiometric fluorescent molecules in the living larval worm as reporters of cellular pH, both techniques are widely used for understanding the physiological status of many organisms (Moran, 2000; Han and Burgess, 2010).
Many calcifying organisms have been shown to regulate intracellular pH, which occurs in the foraminifera (de Nooijer et al., 2008; Bentov et al., 2009), and corals (Venn et al., 2013), and is crucial for the construction of biomineral structures. Some calcifiers are known to mitigate the unfavorable environmental pH in this intracellular context, e.g., coral (Venn et al., 2009) and urchin (Stumpp et al., 2012). Although, scanning electron microscopy (SEM) and transmission electron microscopy (TEM) are effective at characterizing such mineral the samples must be meticulously prepared before these higher resolution-imaging techniques may be used (Hayat, 2000). Therefore, SEM and TEM can only be used in characterization of non-living specimens. Since calcein may be ineffective at an alkaline pH, SEM-EDX was applied correlatively characterize the distribution of calcium. Consequently, there is a need to integrate the in vivo information of the cellular process derived from fluorescence microscopy with the holistic picture of these minerals derived from electron microscopy to fully characterize calcification mechanisms.
Serpulid larvae are ideal for use in studying biomineralization in that the tube formation of these calcifiers begins at the time of metamorphosis, thus marking the important transition from free-swimming larvae into sessile reef-building adults (Carpizo-Ituarte and Hadfield, 1998). Calcification occurs immediately after the attachment and metamorphosis of the tubeworm, thus providing an optimum window for in vivo fluorescent microscopic examination. Larval metamorphosis of the tubeworm provides an optimum window undertaking calcification studies without the requirement of using such artificial treatments such as decalcification. The research team used the tubeworm Hydroides elegans for this study in that it has a well-understood life cycle to facilitate the direct observation of the earliest onset of biomineralization within a predictable temporal frame of reference.
In this study, the actively calcifying post-metamorphic stages of Hydroides elegans, were monitored with correlative microscopy. This method of understanding both the function and structure of any calcifying organism is novel in that it avoids the introduction of inevitable fixation artifacts in electron microscopy, which includes uneven penetrative rate of fixative in the tissue, differences in fixative reaction with different cellular components, and drying conditions when tissues were not totally immersed in fixative (Wisse et al., 2010), while also providing a higher structural resolution than conventional fluorescent observations. This experiment entailed using (1) fluorescent microscopy for in vivo observation of the intracellular pH in the post-metamorphic worm at the earliest onset of calcification and for quantifying this in vivo data to determine the potential calcification compartments and their distribution in the organism; (2) energy dispersive spectroscopy-scanning electron microscopy (EDS-SEM) to map the distribution of calcium ions from putative mineralizing compartment locations; (3) electron backscatter diffraction analysis-scanning electron microscopy (EBSD-SEM) to determine the presence of aragonite crystals within the mapped compartments on unpolished intact specimens using EBSD-SEM; (4) the focused ion beam (FIB) lift-out technique remove of the crystal from the mineralization compartment and confirm the presence of crystalline aragonite; and (5) intermediate voltage TEM to collect the electron diffraction pattern.
Materials and Methods
Study Material
Adult Hydroides elegans were obtained from submerged rafts at a fish farm in Clear Water Bay in Hong Kong SAR. Larvae were spawned and raised in the laboratory. Briefly, individuals of H. elegans were cleaned to removed any adhered macrofauna, and were placed in separate petri dishes of filtered seawater (FSW; 0.22 μm), eggs and sperm were spontaneously released from broken tubes with exposed posterior ends according to previous reported methods (Bryan et al., 1998; Qiu and Qian, 1998). Gametes from multiple male and female individuals (~8 individuals for each sex) were collected and kept separately in small beakers. Several drops of sperm suspension were added to the container with the mixture of eggs to minimize chances of polyspermy. Fertilized eggs were transferred to a larger beaker at a lower density (10 embryos per mL) after about 15 min of fertilization. Trochophore larvae were hatched after 12 h. The newly hatched trochophore larvae were free-swimming and were fed with Isochrysis galbana (6 × 10⁵ cells mL−1) with aerated filtered seawater (FSW) renewed every other day (22°C, 33‰, pH 8.1), seawater pH measured in NBS scale by Mettler-Toledo pH meter, calibrated with Mettler-Toledo buffers at pH4, pH7 and pH 10. Swimming competent larvae on day 8 after hatching were incubated in (1) 10 mg/L calcein (Bis[N,N-bis(carboxymethyl)aminomethyl]-fluorescein) and (2) 10 μM 5-(and-6)-carboxy SNARF-1 acetoxymethyl ester (carboxy SNARF-1 AM, Molecular Probes) in FSW with a salinity of 33‰ and a pH of 8.1. Calcein stock solution (500 mg/L, adjusted to pH 8.0) was prepared for the experiment.
Cellular Environments Labeling with Fluorescent Molecules
Larvae were incubated in the dark at a low density (~5 larvae per mL) inside a water-tight container, and then transported to a laboratory for internal pH measurement in Japan Agency for Marine-Earth Science and Technology (JAMSTEC), Yokosuka, Japan. The containers were insulated with a foam box and multiple layers of clothes to reduce temperature shock during flight (~5 h) and land transit (~4 h). For the remaining time of incubation, larvae were kept at ~20°C in the laboratory. After 22 h of fluorescent dye uptake, the larvae appeared active and healthy. Approximately, 10–20 larvae were rinsed twice with filtered artificial seawater (FASW, 35‰, pH 8.3). After arrival at JAMSTEC, seawater pH measurements were performed in total scale using a pH meter (Orion 5 star, Thermo Scientific, MA, USA; two point calibrated with 2-amino-2-hydroxymethyl-1,3-propanediol (“tris”) buffers at pH 6.8 and pH 8.1), and placed in glass based dishes with FASW 10−4,M isobutylmethylxanthine (IBMX) to induce metamorphosis (Bryan et al., 1998).
Measurement of Cellular Environment
Incubated larvae were imaged to visualize post-metamorphic changes, using an inverted fluorescent microscope (Axio Observer, Zeiss, Germany) fitted with a filter cube. Filters were used to detect fluorescent signals in terms of internal pH distribution from carboxy SNARF-1 signal (λ 488 nm, λ 580 nm, λ 514 nm, λ 640 nm) and calcium distribution from calcein signal (λexc = 470 nm, λem = 500 nm emission). Shutter time for imaging ranged from 100 to 300 ms. Z-stack images (1 μm between each layer) were captured by digital imaging software (Axiovision, Version 4.6). Gray scale images representing the intensities for both signal channels were exported as TIF files from Axiovision software. Using image J (NIH, Bethesda, MD, USA), a composite image was generated by dividing λ by λ for each layer pixel by pixel (Process/Image Calculator…/image file 640 nm “divide” image file 580 nm), i.e., 640/580 nm ratio. A representative layer containing the most heterogeneity was selected to interpret in greater detail for the distribution of internal pH. Using the relationship between 640/580 nm ratio and pH, a plot profile was constructed to visualize the distribution of internal pH (Figure 1).
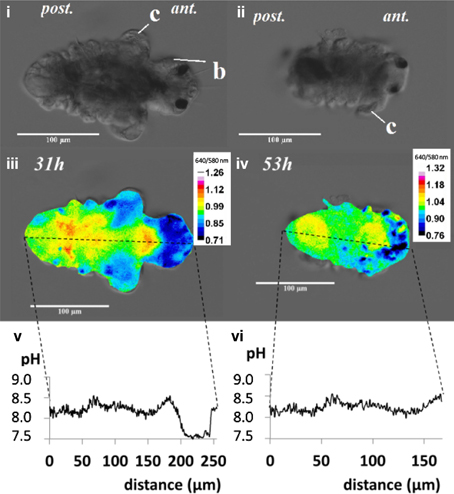
Figure 1. The post-metamorphic tubeworm, Hydroides elegans, demonstrates a heterogeneous distribution of the intracellular pH at both 31 and 53h after metamorphosis. The DIC images [top panel; (i,ii)] and pseudocolorized composite images generated from the gray values at 640 nm divided by gray values at 580 nm [middle panel; (iii,iv)] are shown. The calculated gray values from the 640/580 nm ratio is proportional to the intracellular pH. The profiles of the gray values from the composite images, were converted into intracellular pH values over the distance along the longitudinal body axis of the tubeworm [bottom panel; (v,vi)]. The relationship between intracellular pH and 640/580 nm ratio in emission was established by in vitro calibration (y = 0.30x−1.47; R2 = 0.934; y, gray value; x, intracellular pH). Regions with intracellular pH above pH 8.5 are sites potentially responsible for calcification. c, collar; b, branchial lobes; ant, anteior side; post, posterior side; scale bars = 100 μm.
Calibration of between Intracellular and Environmental pH Values
In situ calibration was performed using similar stages of tubeworm larvae incubated with 10 μM carboxy SNARF-1 for 22 h. To equilibrate environmental seawater pH with the intracellular pH, animals were subjected to 50 μM nigericin and 150 mM KCl in AFSW. A relatively higher level of nigericin (37.3 μg/mL) in the presence of KCl than the minimal nigericin concentration required (2 μg/mL) in previous studies with cell lines was used (Bond and Varley, 2005), with a higher level of nigericin, intracellular and extracellular pH equilibrium can be ensured in the multicellular larval tubeworm. Cells were in equilibrium with the environmental seawater, and signals intensity for SNARF 640 nm and 580 nm appeared homogenous throughout the animal body. The seawater at different pH was adjusted by NaOH or HCl and each pH value of the seawater environment was recorded using a pH meter (Orion 5 star, Thermo Scientific, MA, USA; two point calibrated with 2-amino-2-hydroxymethyl-1,3-propanediol (“tris”) buffers at pH 6.8 and pH 8.1; DelValls and Dickson, 1998). Tubeworm larvae from different seawater pH environments were imaged and intensities of both 640 and 580 nm, i.e., (λ and λ), were recorded for calculation of the pH dependent 640/580 nm ratio of carboxy SNARF-1. Realistic values of pH for physiological range, natural seawater and potential calcification sites, i.e., pH 5.9–9.9, were used for calibration. The five point calibration showed a linear relationship (y = 0.30x−1.47; y = gray value; x = pH; R2 = 0.934). Intracellular pH values were calculated from the equation using the measured 640/580 nm intensity ratio.
Characterization of Nascent Calcified Products by Scanning Electron Microscopy
The attached tubeworms at various stages (day 2–4) were preserved with 4% paraformaldehyde, fixed with osmium tetroxide aqueous solution (1% for 30 min) to prevent tissue shrinkage during dehydration process. Serial dehydration with ethanol (50% for 5 min; 70% for 5 min; 85% for 5 min; 95% for 5 min; 100% for 5 min; 100% for 5 min) was followed by a drying process with 50% ethanol and 50% HMDS (until complete evaporation), 100% HMDS (until complete evaporation). The dried specimen was analyzed using field emission-scanning electron microscopy (FE-SEM) on a SU6600 VPSEM (Hitachi, Japan), at a chamber pressure of 10 Pa to minimize sample charging. Back-scattered electron (BSE) imaging was then performed at accelerating voltage of 5 kV. Energy dispersive X-ray spectrometry (EDS) and electron backscattered diffraction (EBSD) data were obtained at 20 kV accelerating voltage. EDS spectra and EBSD patterns were analyzed by AZtec EDS/EBSD microanalysis software (Oxford Instruments).
To determine the potential sites of calcium carbonate deposition, elemental distribution of calcium (Ca) for tubeworms at different post-metamorphic stages was examined by EDS mapping. After the earliest calcified stage was identified, quantitative data from over 30 random spots were collected. Elemental distribution of calcium from a SEM-EDS map was heterogeneous (Figure 2vi). Quantification using EDS spot analysis on multiple locations on the tubeworms found that the calcium rich areas, with over 15 mol wt%, were mostly located around the thoracic region (Figure 2vii). Some locations from these calcium rich spots were identified as aragonite crystals by EBSD (Figures 2vii–x). The EBSD specimen was mounted on a 45° pretilted stub, the unpolished specimen was tilted a further 25 to ≈70° toward the EBSD phosphor screen. EBSD patterns were collected at 100 ms frame time with 1 × 1 binning. Collected Kikuchi bands were automatically detected for certain spots and digitally processed to determine the identity of the mineral phase. Although analysis of a rough, unpolished sample with EBSD was shown to have a limited success rate, the method is non-destructive of the sample, offers a quick and unambiguous way to differentiate mineral phases (Bandli and Gunter, 2012), and provides important spatial information including evidence of probable calcification sites.
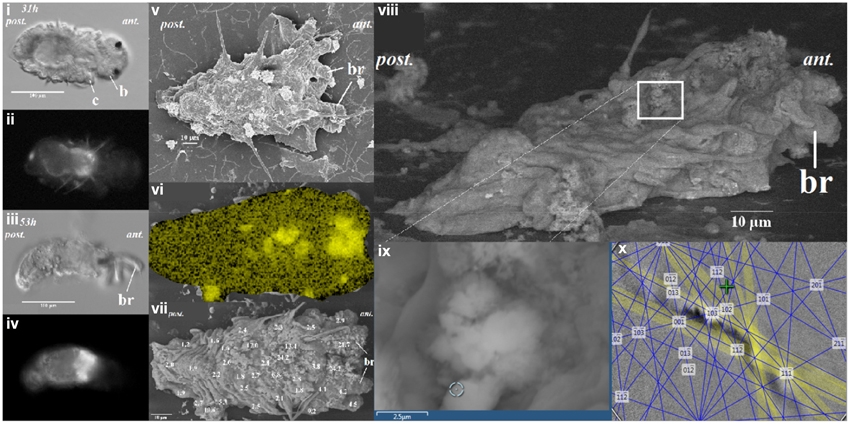
Figure 2. The distribution of calcium ion as correlated to calcein signal at 31 and 53 h after metamorphosis of the Hydroides elegans. The DIC images [left panel; (i,iii)] and the calcein signal [left panel; (ii,iv)] are shown. Correlative electron microscopy on the day 2 post-metamorphic Hydroides elegans detected spots of calcified structures, as shown in a lower-voltage (5 kV) SEM image [middle panel; (v)]. SEM-EDS analysis mapping, performed at 20 kV, shows a heterogeneous distribution of calcium [middle panel; (vi), Ca; in yellow]. The Ca contents are presented as numbers overlaying a greater surface detail of lower-voltage (5 kV) image of the tubeworm, the Ca contents (mol wt%, decimal points are aligned to show the location of spot analyses) obtained from spot quantification (with SEM-EDS at 20 kV) [middle panel; (vii)]. Regions with a Ca content higher than 15 mol wt% are likely to be calcified structures. SEM-EBSD analysis of the calcium rich regions is illuastrated in the right panel of (viii–x). The calcium rich regions (white box) as found in SEM-EDS results were further analyzed with EBSD [right panel; (viii)]. (ii) The circle [right panel; (ix)] indicates the EBSD analysis site; a Kikuchi pattern [right panel; (x)] suggests the site is aragonitic from the interface of EDS/EBSD microanalysis software. c, collar; b, branchial lobes; ant, anteior; post, posterior.
Mineralogy Identification by Transmission Electron Microscopy
Calcified structures emitting a Kikuchi pattern from EBSD analysis were further studied in detail. Bright field high-resolution TEM (BR-HRTEM) images were taken by a high-resolution transmission electron microscope (HRTEM, Hitachi® TEM H500) with LaB6 source electron gun operated at 300 kV. TEM specimens were prepared by a Hitachi NB5000 Focused Ion and Electron Beam (FIB-SEM) system (Hitachi, Japan) with a microsampling system using a gallium ion beam. To prevent charging during fabrication, the samples were sputter-coated with platinum. To minimize beam damage, the region of interest was coated with a thick carbon (3 μm) film and a tungsten cap before FIB processing (Figure 3iii). The specimens were trimmed at a lower voltage (5 kV) down to a final thickness of ~200 nm (Figure 3iv; Kudo et al., 2010); regions that were thin enough were analyzed for TEM.
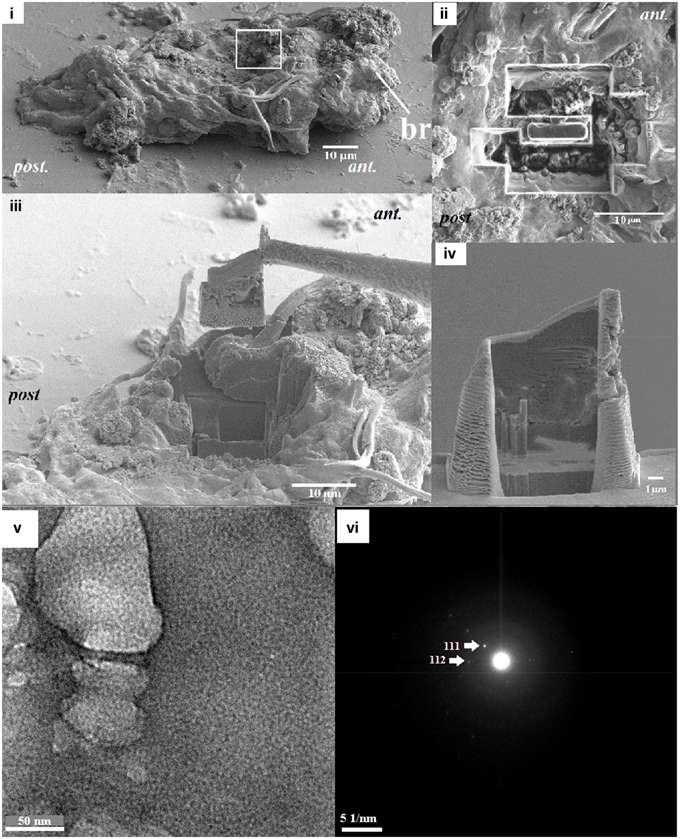
Figure 3. (i) EBSD analysis (white box) showing the region with a Kikuchi pattern was excied to prepare a TEM sample, (ii) the removed surrounding material excised by a focused ion beam (FIB) technique (top view), (iii) the material was lifted using a tungsten probe (side view), (iv) the sample with a final thickness of ~200 nm, which was obtained at a lower voltage. Circled area in (v) were analyzed for the presence of selected-area diffraction pattern in a TEM (vi), showing a single-crystal pattern of aragonite.
Results
When the competent tubeworm larvae were transferred to glass substrates in the presence of 10−4 M IBMX, they began metamorphosis from a larval body form into a juvenile body form with branchial radioles (Figures 1i,ii). During this larval metamorphosis process of the tubeworm, both the active processes of cellular control and mineral deposition were observed. The region located near the collar was much higher in pH compared with other regions. We observed pH values as high as 9.04 in 3 day post metamorphoric individuals (Supplementary Figure 1). A pH value slightly above the pKa value of 9.0 was found to favor the formation of CaCO3 (Figure 2). Regions containing higher pH values above pH 8.5 included the thoracic and ventral posterior locations of the tubeworm (Figure 1), both of which were also near the specialized cells of the calcifying gland responsible for calcification (Hedley, 1956a,b; Neff, 1969, 1971; Bubel, 1983). This suggests that the tubeworm actively create and maintained cellular environment favorable for calcification. The regions with higher pH values are generally the thoracic and ventral posterior regions, also correlate with the regions with a high calcein signal (Figures 2i–iv), which in turn suggests the presence of greater calcium ions or newly accreted calcium carbonate. SEM-EDS quantification and mapping (Figures 2vi,vii) provided additional empirical data to suggest these coherent locations of higher pH values and Ca2+ levels may serves as potential sites for calcification.
A 24 h incubation period with the two fluorescent dyes, 10 μM carboxy SNARF-1 and 10 mg/L calcein, resulted in no observable impacts on the normal metamorphosis activities of the tubeworm. The tissue of the larvae and algae also exhibited no auto-fluorescence that would have interfered with the detection of λ by λ of carboxy SNARF-1 AM. A few algae in the gut of the tubeworms did contain auto-fluorescence that appeared to overlap with calcein signals, however, the algae appeared as small spheres that were distinctive enough from the tissues and disregarded.
The internal pH indicator carboxy SNARF-1 AM showed satisfactory cell permeability and effectively labeled the cytoplasm. At a 10 μM concentration and incubation time of 22 h, good signal strength was detected from different tissues of the tubeworm. The alteration of the spectral features of carboxy SNARF-1 from the environment of living cells (Han and Burgess, 2010), makes calibration of the live animal tissue essential. The 640/580 nm ratio allows a quantification of pH in the range between 6.5 and 9.0 with a linear relationship (R2 = 0.934; Bentov et al., 2009). The quantified pH values occur within a range that were physiologically realistic for the cytoplasm (pH 7–8), natural seawater (~pH 8.1), and potential calcification sites (commonly > pH 8.5) which are consistent with values found in other calcifiers such as foraminifera and corals (Bentov et al., 2009; Venn et al., 2013).
Elemental quantification using SEM-EDS verified both the presence and absence of crystalline carbonate, which correlated with the regions exhibiting these higher Ca2+ levels (Figures 2vi,vii). These Ca2+ rich areas with over 15 mol wt% calcium were located along the central part of the body (Figure 2). Applied as a non-destructive approach, an intact and unpolished specimen was examined by SEM-EBSD to determine the existence of aragonite in these calcium abundant regions (Figures 2viii–x). A Kikuchi pattern using an unpolished specimen in SEM-EBSD served as an unambiguous and direct evidence of the presence of minerals at selected locations (Bandli and Gunter, 2012). Combining the FIB sample preparation (Figures 3i–iv), the selected-area diffraction pattern detected in a TEM showed evidence of a weak poly-crystalline component arising from aragonite phase (Figure 3), suggesting the formation of aragonite at the early stage of mineralization. Although we characterized the tube material at an early phase, the presence of transiet ACC phase was not detected in the present work.
Discussion
In this study, a combination of imaging systems, i.e., fluorescent, electron, and X-ray, were applied to identify and study the tissues of interest, correlative microscopy is also an emerging field of research interest (Loussert and Humbel, 2015). We demonstrated how new techniques including a whole animal and a FIB prepared TEM specimen can be analyzed by SEM-EBSD and TEM, respectively. These methods were helpful in determining changes in the lattice ion concentration flux and other changes in the mineralization compartment when active mineralization occurs. The process begins with the active regulation of increased intracellular pH, a process known to require the active pumping of protons out of the cell membrane. We constructed a hypothetical model for determining larval tubeworm calcification based on our current knowledge and the serpulid literature (Figure 4). This model localizes the site of biomineralization to the mineralizing compartments, where the calcifying glands (CG) were previously observed at the collar region (Hedley, 1956a,b; Neff, 1971). The gut (G) is described as the site of Ca2+ accumulation, possibly from dietary intake (Nott and Parkes, 1975), which supplies Ca2+ to the calcifying gland (Figure 4ii), resulting in the secretion of calcium carbonate (CaCO3) crystals together with mucous organic matter (Figure 4iii). From the early literature, the involvement of multivesicular bodies in the Golgi-rich region of the cells (Neff, 1969)were found to result in an intracellular deposition of calcified crystal granules (de Nooijer et al., 2009). The presence of these intracellular secretory vacuoles suggests calcification is a compartmentalized process (Figure 4iv) and may serve to prevent cytotoxicity in the cytosol associated with Ca2+ build up during CaCO3 precipitaion (Simkiss and Wilbur, 1989).
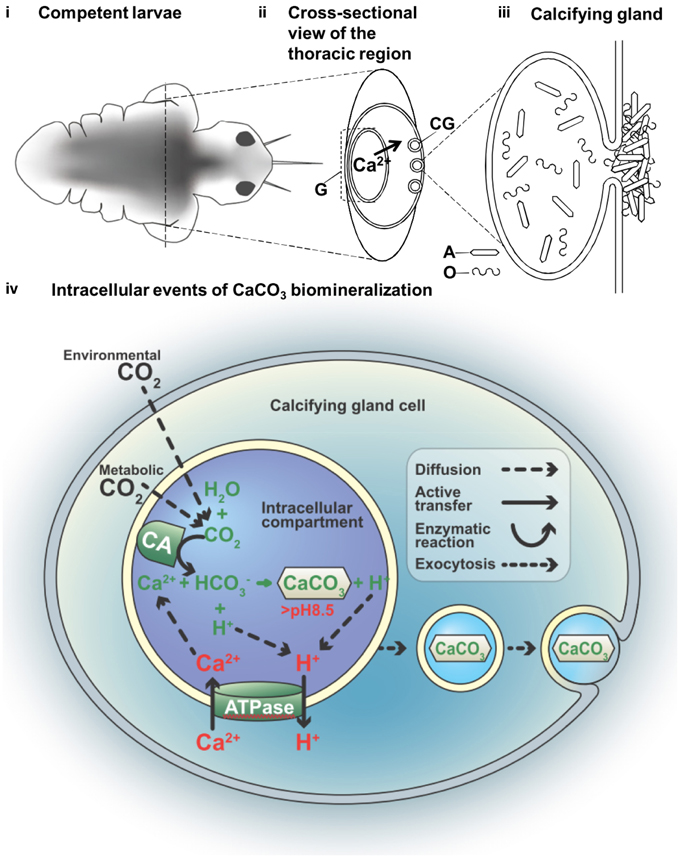
Figure 4. A hypothetical model of the compartmental crystal formation in the body of the tubeworm Hydroides elegens. (i) Empirical data indicates calcifcation activities in the thoracic region of the competent larvae at day 7 (eyespots are visible). (ii) A cross-sectional view of thoracic region through the axis delineated in (i) depicts the flux of Ca2+ ions. The serpulid tubeworms commonly produce calcium carbonate through dietary calcium ions from the gut, requiring an active transporting, or pumping of Ca2+ from the gut (G) to the calcifying glands (CG). (iii) A calcifying gland depositing aragonite crystals (A) together with the organic (O) component of the biomineral are deposited to the surface of the body; shown via a schematic representation of the possible intracellular events in the process of the CaCO3 biomineralization (iv) nucleation of CaCO3 from bicarbonate ion () and (Ca2+) involves the function of carbonic anhydrase (CA) and an ATP driven Ca2+/H+ antiport (ATPase). This process is thought to occur in an intracellular compartment to prevent the toxicity associated with high Ca2+ in the cytosol. The deposition of CaCO3 to the surface of the body causes a migration of the mineral along the cytosol, via an event similar to exocytosis.
Space delineation is a well-accepted requirement for biologically controlled mineralization (Simkiss and Wilbur, 1989), however, it remains poorly understood. In the present study, we have observed that biomineralization is compartmented within the collar region of the settling marine larvae of Hydrodies elegans and at its earliest possible time, i.e., the post-metamorphic stage. We have also demonstrated that these compartments contain aragonite crystals, as detected by EBSD and confirmed by electron diffraction TEM. Within this highly regulated compartment, the pH values were elevated to approach the pKa value of CaCO3, for purposes of initiating their formation chemically. We observed, through the use of a variety of correlative microscopy techniques, the calcification of aragonite at the earliest possible time, i.e., at the post-metamorphic stage. Our study shows lattice ion concentration flux and changes in the internal pH environment as active mineralization occurs. It is reasonable to then assume that, if the tubeworm has evolved a functional bio-mineralizing compartment that meets all physicochemical and thermodynamics constraints of calcium carbonate formation, the most favorable final phase produced formed within the tubeworm would be a crystalline product. Our observation of the existence of aragonite crystals supports this hypothesis.
With regard to the mechanism of nucleation within the compartment it is conceivable that crystallization may undergo an amorphous transient or intermediate phase (Addadi et al., 2003; Pouget et al., 2009) because of the near certain presence and close association of amorphous calcium carbonate (ACC) with the compartmented polycrystalline inclusions that we detected. Although aragonite was detected by EBSD in the collar region of the tubeworm, other calcium rich regions, greater than 15 mol wt% along the central part of the animal's body likely held amorphous CaCO3. These findings are consistent with our previous research which showed that the homogenized powder samples of newly deposited tubes also contained amorphous calcium carbonate (ACC) phase (Chan et al., 2015). It is also possible that both crystals and amorphous deposits may be present at the mineralization front (Kudo et al., 2010). It is also now known that the deposition of CaCO3 may be supplied from the intracellular calcification to the body surface via exosome-like crystal bearing vesicles (Figure 4iv; Zhang et al., 2012; Johnstone et al., 2015). These observations have led us to further hypothesize that amorphous materials may act as a supply of lattice ions to enable rapid crystalline growth to the preformed crystals that have been previously deposited by the calcifying tubeworm. This hypothesis can be supported by the model of endoskeleton formation in sea urchin embryos, where aggregates of ACC were found in 20-30 nm nanospheres that integrates to a preformed spicule during its growth (Vidavsky et al., 2014).
The biological production of CaCO3, which is shown in our proposed model, requires the reactants of and Ca2+ (Roleda et al., 2012). Despite the uncertainty of its origin (i.e., environmental or metabolic), carbon dioxide (CO2) can enter a calcification compartment by diffusion prior to conversion by carbonic anhydrase into (Freeman and Wilbur, 1948; Bertucci et al., 2013). The translocation of charged ions would involve ATP dependent mechanisms (Gohad et al., 2009). Membrane bound calcium ATPase has been characterized in the pearl oyster and coral (Zoccola et al., 2004; Fan et al., 2007; Moya et al., 2008). The simultaneous supply of the cation reactant (Ca2+) and removal of the inhibitory by-product of calcification (H+; Jokiel, 2011; Pan et al., 2015), may cause the ATP dependent translocation of Ca2+ to function as an antiport ion pump. That is to say, each molecule of the Ca2+ influx is coupled with the H+ efflux (Figure 4iv). The deposition of CaCO3 may be the result of the intracellular calcification to the body surface via the supply by exosome-like crystal bearing vesicles (Figure 4iv; Zhang et al., 2012; Johnstone et al., 2015). Previous research determined that protons (H+) act as an inhibitory by-product during calcification (Jokiel, 2011), while the pH elevation indicated an H+ efflux, which was an inhibition removal mechanism that encouraged the process of calcification. The ability to maintain intracellular pH within the biomineralization space strongly influences calcification success, which we demonstrated to be as great as pH 9.0 within the calcifying compartment of the metamorphosed larvae. Since, the pK2' for the dissolution of bicarbonate () to form carbonate () in seawater is 9.11, at least 50% of the carbon will assume the form of carbonate and thus be available for crystal formation within the compartment (Stumm and Morgan, 1996). Without a direction measurement of physiological environment, the total alkalinity and salinity values were assumed to be similar to the seawater environment. With this assumption, a conservative estimation of DIC, 35 ppt, 18°C, pCO2 at 400 ppm can be performed using CO2SYS (Lewis and Wallace, 1998), at pH 9, the values of , and CO2 were 17187.04, 14703.94, and 10.61 μmol/kg SW, which add up to DIC value of 31,901.59 μmol/kg SW. This concentration of in seawater yields aragonite saturation states of 221, which enables spontaneous homogeneous nucleation of aragonite (Morse and He, 1993). Furthermore, since carbon dioxide freely diffuses across plasma lipid membranes regardless of its source (either environmental or metabolic) and can be directly converted to bicarbonate by carbonic anhydrase activity within a cellular compartment, the inability of calcifiers in maintaining the cellular environmental such as intracellular pH would indicate failure in calcification. Elevation of intracellular pH, i.e., the removal of protons, is at a cost of somatic energy (Allemand et al., 2011). Therefore, monitoring the intracellular pH serves as a way assess the cellular and physiological status of the calcifier, which indicates its susceptibility to metabolic stress from ocean acidification (Bach, 2015). For example, both sea urchins and corals exhibit a certain ability of pH homeostasis that buffers the effects of CO2-driven acidification (Venn et al., 2009; Stumpp et al., 2012). In addition to the monitoring of intracellular pH and calcium (Hayat, 2000), higher resolution studies should be undertaken to elucidate the activities of vacuolization and endocytosis by applying commercially available fluorescent molecules (Toyofuku et al., 2008; Bentov et al., 2009). Understanding diverse serpulid tubeworms at the calcification sites during ocean acidification may help determine their susceptibility to a changing climate, which is crucial for developing methods to protect the temperate reefs (Smith et al., 2013). Evaluating the calcifying mechanisms of marine invertebrates throughout their life cycle, addressing their potential adaptaion capacity are essential to developing a more informed understanding of their mechanistic vulnerability in the face of the treats of OA, leading to better predictions for potential community shifts and reorganization of future ecosystems (Fabry, 2008).
Author Contributions
Research idea contributed by VC, TT, VT, LS, AM. Cultivation and preparation of research animals by VC. Observation of internal pH by VC and TT. Sample preparation and analysis on SEM-EDX, SEM-EBSD, FIB-TEM by VC, AM, and GW. Interpretation of mineralogy data by VC, LS, and AM. Paper written by VC, commented by TT, VT, LS, GW, edited by AM.
Conflict of Interest Statement
The authors declare that the research was conducted in the absence of any commercial or financial relationships that could be construed as a potential conflict of interest.
Acknowledgments
The authors wish to thank S. Kawada, S. Kubo, J. Hudson, T. Darroudi, D. Mulwee, H. Qian, Y. W. Lam, M. B. Johnstone, C. Campanati, A. C. Lane, and R. Dineshram for their technical assistance and scientific advice on this study. The research idea was inspired by Prof. S. Weiner's generous scientific discussion in the 10th ICCBMT meeting. This study was funded by three GRF grants from the HKSAR-RGC (Grant Numbers: 705511P, 705112P, and 17304914).
Supplementary Material
The Supplementary Material for this article can be found online at: https://www.frontiersin.org/article/10.3389/fmars.2015.00097
References
Addadi, L., Raz, S., and Weiner, S. (2003). Taking advantage of disorder: amorphous calcium carbonate and its roles in biomineralization. Adv. Mater. 15, 959–970. doi: 10.1002/adma.200300381
Allemand, D., Tambutté, É., Zoccola, D., and Tambutté, S. (2011). Coral Calcification, Cells to Reefs. Coral Reefs: An Ecosystem in Transition. New York, NY: Springer.
Bach, L. T. (2015). Reconsidering the role of carbonate ion concentration in calcification by marine organisms. Biogeosci. Discuss 12, 6689–6722. doi: 10.5194/bgd-12-6689-2015
Bandli, B. R., and Gunter, M. E. (2012). Electron backscatter diffraction from unpolished particulate specimens: examples of particle identification and application to inhalable mineral particulate identification. Am. Mineral. 97, 1269–1273. doi: 10.2138/am.2012.4155
Bentov, S., Brownlee, C., and Erez, J. (2009). The role of seawater endocytosis in the biomineralization process in calcareous foraminifera. Proc. Natl. Acad. Sci. U.S.A. 106, 21500. doi: 10.1073/pnas.0906636106
Bentov, S., and Erez, J. (2005). Novel observations on biomineralization processes in foraminifera and implications for Mg/Ca ratio in the shells. Geology 33, 841–844. doi: 10.1130/G21800.1
Bertucci, A., Moya, A., Tambutté, S., Allemand, D., Supuran, C. T., and Zoccola, D. (2013). Carbonic anhydrases in anthozoan corals—A review. Bioorg. Med. Chem. 21, 1437–1450. doi: 10.1016/j.bmc.2012.10.024
Bond, J., and Varley, J. (2005). Use of flow cytometry and SNARF to calibrate and measure intracellular pH in NS0 cells. Cytometry A 64, 43–50. doi: 10.1002/cyto.a.20066
Bryan, P. J., Kreider, J. L., and Qian, P. Y. (1998). Settlement of the serpulid polychaete Hydroides elegans (Haswell) on the arborescent bryozoan Bugula neritina (L.): evidence of a chemically mediated relationship. J. Exp. Mar. Biol. Ecol. 220, 171–190. doi: 10.1016/S0022-0981(97)00105-6
Bubel, A. (1983). A fine structural study of the calcareous opercular plate and associated cells a polychaete annelid. Tissue Cell 15, 457–476. doi: 10.1016/0040-8166(83)90076-9
Carpizo-Ituarte, E., and Hadfield, M. (1998). Stimulation of metamorphosis in the polychaete Hydroides elegans Haswell (Serpulidae). Biol. Bull. 194, 14. doi: 10.2307/1542509
Chan, V. B. S., Vinn, O., Li, C., Lu, X., Kudryavtsev, A. B., Schopf, J. W., et al. (2015). Evidence of compositional and ultrastructural shifts during the development of calcareous tubes in the biofouling tubeworm, Hydroides elegans. J. Struct. Biol. 189, 230–237. doi: 10.1016/j.jsb.2015.01.004
de Nooijer, L., Toyofuku, T., Oguri, K., Nomaki, H., and Kitazato, H. (2008). Intracellular pH distribution in foraminifera determined by the fluorescent probe HPTS. Limnol. Oceanogr. 6, 610–618. doi: 10.4319/lom.2008.6.610
de Nooijer, L. J., Spero, H. J., Erez, J., Bijma, J., and Reichart, G. J. (2014). Biomineralization in perforate foraminifera. Earth Sci. Rev. 135, 48–58. doi: 10.1016/j.earscirev.2014.03.013
de Nooijer, L. J., Toyofuku, T., and Kitazato, H. (2009). Foraminifera promote calcification by elevating their intracellular pH. Proc. Natl. Acad. Sci. U.S.A. 106, 15374–15378. doi: 10.1073/pnas.0904306106
DelValls, T. A., and Dickson, A. G. (1998). The pH of buffers based on 2-amino-2-hydroxymethyl-1,3-propanediol (‘tris’) in synthetic sea water. Deep Sea Res. 45, 1541–1554 doi: 10.1016/S0967-0637(98)00019-3
Erez, J. (2003). The source of ions for biomineralization in foraminifera and their implications for paleoceanographic proxies. Rev. Mineral. Geochem. 54, 115–149. doi: 10.2113/0540115
Fabry, V. (2008). Marine calcifiers in a high-CO2 ocean. Science 320, 1020–1022. doi: 10.1126/science.1157130
Fan, W., Li, C., Li, S., Feng, Q., Xie, L., and Zhang, R. (2007). Cloning, characterization, and expression patterns of three sarco/endoplasmic reticulum Ca2+-ATPase isoforms from pearl oyster (Pinctada fucata). Acta Biochim. Biophys. Sin. 39, 722–730. doi: 10.1111/j.1745-7270.2007.00330.x
Freeman, J., and Wilbur, K. (1948). Carbonic anhydrase in molluscs. Biol. Bull. 94, 55–59. doi: 10.2307/1538209
Gohad, N., Dickinson, G., Orihuela, B., Rittschof, D., and Mount, A. (2009). Visualization of putative ion-transporting epithelia in Amphibalanus amphitrite using correlative microscopy: potential function in osmoregulation and biomineralization. J. Exp. Mar. Biol. Ecol. 380, 88–98. doi: 10.1016/j.jembe.2009.09.008
Han, J., and Burgess, K. (2010). Fluorescent indicators for intracellular pH. Chem. Rev. 110, 2709–2728. doi: 10.1021/cr900249z
Hayat, M. A. (2000). Principles and Techniques of Electron Microscopy: Biological Applications. Cambridge, UK: Cambridge University Press.
Hedley, R. (1956a). Studies on serpulid tube formation. I. The secretion of the calcareous and organic components of the tube by Pomatoceros triqueter. Q. J. Microsc. Sci. 97, 411–427.
Hedley, R. (1956b). Studies on serpulid tube formation. II. The calcium-secreting glands in the peristomium of Spirorbis, Hydroides and Serpula. Q. J. Microsc. Sci. 97, 421–427.
Johnstone, M. B., Gohad, N. V., Falwell, E. P., Hansen, D. C., Hansen, K. M., and Mount, A. S. (2015). Cellular orchestrated biomineralization of crystalline composites on implant surfaces by the eastern oyster, Crassostrea virginica (Gmelin, 1791). J. Exp. Mar. Biol. Ecol. 463, 8–16. doi: 10.1016/j.jembe.2014.10.014
Jokiel, P. L. (2011). Ocean acidification and control of reef coral calcification by boundary layer limitation of proton flux. Bull. Mar. Sci. 87, 639–657. doi: 10.5343/bms.2010.1107
Kudo, M., Kameda, J., Saruwatari, K., Ozaki, N., Okano, K., Nagasawa, H., et al. (2010). Microtexture of larval shell of oyster, Crassostrea nippona: a FIB-TEM study. J. Struct. Biol. 169, 1–5 doi: 10.1016/j.jsb.2009.07.014
Lewis, E., and Wallace, D. W. R. (1998). Program Developed for CO2 System Calculations. ORNL/CDIAC-105. Carbon Dioxide Information Analysis Center; Oak Ridge National Laboratory; U.S. Department of Energy, Oak Ridge; Tennessee.
Lohbeck, K. T., Riebesell, U., and Reusch, T. B. H. (2014). Gene expression changes in the coccolithophore Emiliania huxleyi after 500 generations of selection to ocean acidification. Proc. R. Soc. Lond. B Biol. Sci. 281:20140003. doi: 10.1098/rspb.2014.0003
Loussert, F. C., and Humbel, B. M. (2015). Correlative microscopy. Arch. Biochem. Biophys. 581, 98–110. doi: 10.1016/j.abb.2015.05.017
Moran, A. (2000). Calcein as a marker in experimental studies newly-hatched gastropods. Mar. Biol. 137, 893–898. doi: 10.1007/s002270000390
Morse, J. W., and He, S. (1993). Influences of T, S and PCO2 on the pseudo-homogeneous precipitation of CaCO3 from seawater: implications for whiting formation. Mar. Chem. 41, 291–297. doi: 10.1016/0304-4203(93)90261-L
Moya, A., Tambutté, S., Bertucci, A., Tambutté, E., Lotto, S., Vullo, D., et al. (2008). Carbonic anhydrase in the scleractinian coral Stylophora pistillata characterization, localization, and role in biomineralization. J. Biol. Chem. 283, 25475–25484. doi: 10.1074/jbc.M804726200
Neff, J. (1969). Mineral regeneration by serpulid polychaete worms. Biol. Bull. 136, 76–90. doi: 10.2307/1539670
Neff, J. (1971). Ultrastructure of calcium phosphate-containing cells in the serpulid polychaete worm Pomatoceros caeruleus. Calcif. Tissue Res. 7, 191–200. doi: 10.1007/BF02062606
Nott, J., and Parkes, K. (1975). Calcium accumulation and secretion in the serpulid polychaete Spirorbis spirorbis L. at settlement. J. Mar. Biol. Assoc. U.K. 55, 911–923. doi: 10.1017/S0025315400017793
Pan, T.-C. F., Applebaum, S. L., and Manahan, D. T. (2015). Experimental ocean acidification alters the allocation of metabolic energy. Proc. Natl. Acad. Sci. U.S.A. 112, 4696–4701. doi: 10.1073/pnas.1416967112
Pouget, E., Bomans, P., Goos, J., and Frederik, P. (2009). The initial stages of template-controlled CaCO3 formation revealed by cryo-TEM. Science 323, 1455. doi: 10.1126/science.1169434
Qiu, J. W., and Qian, P. Y. (1998). Combined effects of salinity and temperature on juvenile survival, growth and maturation in the polychaete Hydroides elegans. Mar. Ecol. Prog. Ser. 168, 127–134. doi: 10.3354/meps168127
Qiu, J. W., Thiyagarajan, V., Leung, A. W., and Qian, P. Y. (2003). Development of a marine subtidal epibiotic community in Hong Kong: implications for deployment of artificial reefs. Biofouling 19, 37–46. doi: 10.1080/0892701021000060851
Roleda, M. Y., Boyd, P. W., and Hurd, C. L. (2012). Before ocean acidification: calcifier chemistry lessons 1. J. Phycol. 48, 840–843. doi: 10.1111/j.1529-8817.2012.01195.x
Simkiss, K., and Wilbur, K. (1989). Biomineralization: Cell Biology and Mineral Deposition. New York, NY: Academic Press.
Smith, A. M., Riedi, M. A., and Winter, D. J. (2013). Temperate reefs in a changing ocean: skeletal carbonate mineralogy of serpulids. Mar. Biol. 160, 2281–2294. doi: 10.1007/s00227-013-2210-z
Spero, H. J. (1988). Ultrastructural examination of chamber morphogenesis and biomineralization in the planktonic foraminifer Orbulina universa. Mar. Biol. 99, 9–20. doi: 10.1007/BF00644972
Stumm, W., and Morgan, J. J. (1996). Aquatic Chemistry: Chemical Equilibria and Rates in Natural Waters, 3rd Edn. New York, NY: John Wiley & Sons, Inc.
Stumpp, M., Hu, M. Y., Melzner, F., Gutowska, M. A., Dorey, N., Himmerkus, N., et al. (2012). Acidified seawater impacts sea urchin larvae pH regulatory systems relevant for calcification. Proc. Natl. Acad. Sci. U.S.A. 109, 18192–18197. doi: 10.1073/pnas.1209174109
Toyofuku, T., de Nooijer, L. J., Yamamoto, H., and Kitazato, H. (2008). Real-time visualization of calcium ion activity in shallow benthic foraminiferal cells using the fluorescent indicator Fluo-3 AM. Geochem. Geophys. Geosyst. 9:Q05005. doi: 10.1029/2007gc001772
Venn, A. A., Tambutté, E., Lotto, S., Zoccola, D., Allemand, D., and Tambutté, S. (2009). Imaging intracellular pH in a reef coral and symbiotic anemone. Proc. Natl. Acad. Sci. U.S.A. 106, 16574. doi: 10.1073/pnas.0902894106
Venn, A. A., Tambutté, E., Holcomb, M., Laurent, J., Allemand, D., and Tambutté, S. (2013). Impact of seawater acidification on pH at the tissue–skeleton interface and calcification in reef corals. Proc. Natl. Acad. Sci. U.S.A. 110, 1634–1639. doi: 10.1073/pnas.1216153110
Vidavsky, N., Addadi, S., Mahamid, J., Shimoni, E., Ben-Ezra, D., Shpigel, M., et al. (2014). Initial stages of calcium uptake and mineral deposition in sea urchin embryos. Proc. Natl. Acad. Sci. U.S.A. 111, 39–44. doi: 10.1073/pnas.1312833110
Vinn, O., Kirsimäe, K., and ten Hove, H. A. (2009). Tube ultrastructure of Pomatoceros americanus (Polychaeta, Serpulidae): implications for the tube formation of serpulids. Estonian J. Earth Sci. 58, 148–152. doi: 10.3176/earth.2009.2.05
Vinn, O., Mutvei, H., ten Hove, H. A., and Kirsimae, K. (2008). Unique Mg-calcite skeletal ultrastructure in the tube of the serpulid polychaete Ditrupa. Neues Jahrb. Geol. Paläontol. Abh. 248, 79–89. doi: 10.1127/0077-7749/2008/0248-0079
Weiner, S., and Addadi, L. (2011). Crystallization pathways in biomineralization. Annu. Rev. Mater. Res. 41, 21–40. doi: 10.1146/annurev-matsci-062910-095803
Wisse, E., Braet, F., Duimel, H., Vreuls, C., Koek, G., Olde Damink, S. W., et al. (2010). Fixation methods for electron microscopy of human and other liver. World J. Gastroenterol.? 16, 2851–2866. doi: 10.3748/wjg.v16.i23.2851
Wizemann, A., Meyer, F. W., Hofmann, L. C., Wild, C., and Westphal, H. (2015). Ocean acidification alters the calcareous microstructure of the green macro-alga Halimeda opuntia. Coral Reefs 34, 941–954. doi: 10.1007/s00338-015-1288-9
Zhang, G., Fang, X., Guo, X., Li, L., Luo, R., Xu, F., et al. (2012). The oyster genome reveals stress adaptation and complexity of shell formation. Nature 490, 49–54. doi: 10.1038/nature11413
Keywords: tubeworms, biomineralization, internal pH, FIB-TEM, calcification, aragonite, electron diffraction
Citation: Chan VBS, Toyofuku T, Wetzel G, Saraf L, Thiyagarajan V and Mount AS (2015) Direct Deposition of Crystalline Aragonite in the Controlled Biomineralization of the Calcareous Tubeworm. Front. Mar. Sci. 2:97. doi: 10.3389/fmars.2015.00097
Received: 19 September 2015; Accepted: 02 November 2015;
Published: 18 November 2015.
Edited by:
Christian Robert Voolstra, King Abdullah University of Science and Technology, Saudi ArabiaReviewed by:
Christine Ferrier-Pagès, Centre Scientifique de Monaco, MonacoSteeve Comeau, University of Western Australia, Australia
Copyright © 2015 Chan, Toyofuku, Wetzel, Saraf, Thiyagarajan and Mount. This is an open-access article distributed under the terms of the Creative Commons Attribution License (CC BY). The use, distribution or reproduction in other forums is permitted, provided the original author(s) or licensor are credited and that the original publication in this journal is cited, in accordance with accepted academic practice. No use, distribution or reproduction is permitted which does not comply with these terms.
*Correspondence: Vengatesen Thiyagarajan, rajan@hku.hk;
Andrew S. Mount, mount@clemson.edu