Sediment Nitrous Oxide Fluxes Are Dominated by Uptake in a Temperate Estuary
 Sarah Q. Foster
 Robinson W. Fulweiler
- 1Earth and Environment Department, Boston University, Boston, MA, USA
- 2Biology Department, Boston University, Boston, MA, USA
Coastal marine ecosystems are generally considered important sources of nitrous oxide (N2O), a powerful greenhouse gas and ozone depleting substance. To date most studies have focused on the environmental factors controlling N2O production although N2O uptake has been observed in a variety of coastal ecosystems. In this study, we examined sediment fluxes of N2O during 2 years (2012–2013) in a shallow temperate estuary (Waquoit Bay, MA, USA). Overall sediments were a net N2O sink (–23 ± 5.2 nmol m−2 h−1, mean ± SE, significantly less than zero p < 0.0001). N2O fluxes were significantly correlated to water column dissolved N2O (% saturation; p < 0.0001), inorganic phosphorus (DIP; p = 0.0017), and nitrogen (DIN; p = 0.0019), as well as to temperature (p = 0.0192). Additionally, there was a positive correlation between sediment N2O uptake and both oxygen (O2) and DIP uptake (p = 0.0002 and p < 0.0001, O2 and DIP sediment uptake, respectively). Results from this study indicate that sediments in shallow coastal ecosystems can be a strong sink of dissolved N2O, and therefore may mitigate N2O efflux to the atmosphere and export to the coastal ocean. Establishing the nature and strength of relationships between environmental conditions and sediment N2O fluxes moves us toward better-constrained models that will improve ecosystem management strategies, N2O budgets, and our ability to predict the response of coastal ecosystems to local and global change.
Introduction
At the interface between the land and the sea, coastal marine ecosystems process large amounts of anthropogenic carbon (C) and nutrients (e.g., nitrogen (N) and phosphorus (P); Nixon, 1981; Boynton and Kemp, 1985; Gattuso et al., 1998; Hopkinson and Smith, 2005). Many of the processes that transform these elements occur in estuarine sediments making them biogeochemical “hot spots” (McClain et al., 2003; Groffman et al., 2009). In particular, sediments can be a substantial sink for reactive N through denitrification (Seitzinger, 1988; Christensen, 1994), and thus may play a key role in the flux of nitrous oxide (N2O), a powerful greenhouse gas and ozone depleting substance (Ravishankara et al., 2009; Portmann et al., 2012; Myhre et al., 2013). Although coastal ecosystems are typically considered net sources of N2O to the atmosphere (Bange et al., 1996; Seitzinger et al., 2000; Kroeze et al., 2005), the magnitude and environmental controls of these fluxes are not well-constrained (Murray et al., 2015). Additionally, there have been several reports of net uptake from a variety of coastal environments (e.g., Kieskamp et al., 1991; Kreuzwieser et al., 2003; LaMontagne et al., 2003; Rajkumar et al., 2008; Adams et al., 2012).
Whether coastal sediments are a source or sink of N2O depends on a balance between both autotrophic and heterotrophic microbial processes that either produce and/or consume N2O during the oxidation or reduction of N through the +1 oxidation state. In estuarine sediments, microbial nitrification, denitrification, and nitrifier-denitrification are likely to be the dominant processes producing N2O (Figure 1). The role of other N cycling processes, including anaerobic ammonium oxidation (anammox), dissimilatory nitrate reduction to ammonium (DNRA), fungal denitrification, and chemodenitrification is unclear, but to date research suggests that their contribution to overall N2O production is relatively small in marine environments (e.g., Shoun et al., 1992; Einsle et al., 1999; Cooper et al., 2003; Coby and Picardal, 2005; Kartal et al., 2007; Rakshit et al., 2008). In canonical nitrification and nitrifier-denitrification, N2O can be released as a reductive by-product during the chemoautotrophic oxidation of ammonium/ammonia [NHx(/ )] through hydroxylamine (NH2OH) to nitrite (; Wrage et al., 2001; Frame and Casciotti, 2010; Santoro et al., 2011). N2O can also be produced by both canonical denitrification and nitrifier-denitrification as an intermediate compound, during the reduction of oxidized N species to di-nitrogen gas (N2; Wrage et al., 2001; Fernandes et al., 2010). Alternatively, canonical denitrification, nitrifier-denitrification, DNRA, and N-fixation are capable of consuming N2O (Firestone and Davidson, 1989; Sanford et al., 2012; Farías et al., 2013; Giblin et al., 2013; Figure 1).
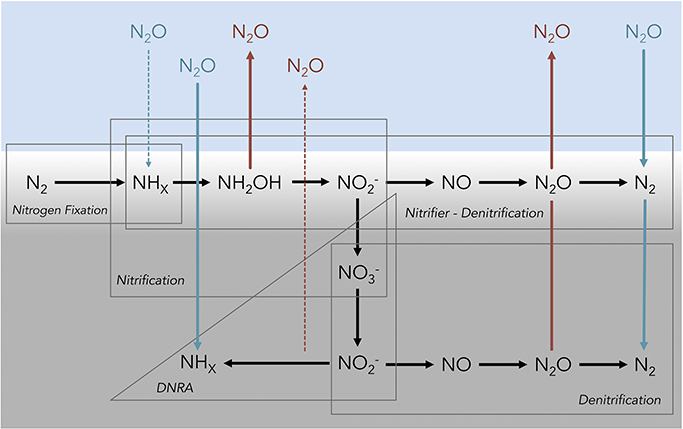
Figure 1. Conceptual diagram depicting several of the known microbial processes that influence the flux of nitrous oxide at the sediment–water interface in shallow coastal marine ecosystems. The blue shading represents water above the sediments, light gray shading represents the oxic region of the sediment profile and the dark gray shading represents sub-oxic/anoxic sediments. Abbreviations for nitrogen species are as follows: di-nitrogen (N2), ammonia/ammonium (NHx), hydroxylamine (NH2OH), nitrite (), nitrate (), nitric oxide (NO), nitrous oxide (N2O). Red lines and font indicate an efflux of N2O out of the sediments into the overlying water and blue lines indicate sediment N2O uptake. Dashed arrow lines indicate the potential for a N2O flux, but limited evidence from the current literature. Note that the vertical profile is idealized and certain processes may occur at the same depth when suitable micro-environmental conditions exist. Figure adapted from Baggs (2008).
The amount of N2O produced or consumed depends on substrate availability and environmental conditions which regulate the relative rate of these processes (Zumft and Kroneck, 2007; Murray et al., 2015). Dissolved inorganic nitrogen (DIN) is one of the most significant factors controlling the flux of N2O. High concentrations of and nitrate () can increase the production of N2O by enhancing nitrification and denitrification (Seitzinger and Nixon, 1985; Bange, 2006; Barnes and Upstill-Goddard, 2011; Moseman-Valtierra et al., 2011). Alternatively, low DIN coupled with low oxygen (O2) concentrations can promote uptake of N2O by denitrification and DNRA (Chapuis-Lardy et al., 2007; Figure 1). N2O uptake can also occur under conditions of abundant DIN, when dominates the inorganic N pool (Middelburg et al., 1995; Rajkumar et al., 2008; Adams et al., 2012). The quantity and quality of organic matter can greatly influence rates of net denitrification (Fulweiler et al., 2007, 2008; Eyre et al., 2013). And finally, the concentration of hydrogen sulfides can inhibit both nitrification (Joye and Hollibaugh, 1995) and NO and N2O reduction by denitrifiers (Sørensen et al., 1980). However, the overall impact of organic matter and sulfide concentrations on sediment N2O fluxes is unknown.
Here we examine sediment N2O fluxes in a shallow (2 m mean depth), temperate estuary (Waquoit Bay, Massachusetts, USA). Our goals were two-fold. First, we wanted to determine if the estuarine sediments in this system were a source or sink of N2O. Second, we wanted to investigate the environmental characteristics (e.g., temperature, salinity, oxygen and nutrient concentrations and fluxes) influencing sediment N2O fluxes. Determining the controls on the benthic flux of N2O is an essential step in establishing the potential for estuarine sediments to mitigate emission of this powerful greenhouse gas. Furthermore, a better understanding of the role various environmental parameters play in N2O budgets enables us to make better-constrained models that will improve management decisions on local, regional, and global scales. In Waquoit Bay, we hypothesized that the sediments would be dominated by N2O uptake because and concentrations are low, while sediment organic matter is relatively high, and O2 is consumed quickly in the upper millimeters of the sediment. We also hypothesized that both O2 and nutrient dynamics would have a substantial impact on the magnitude of N2O fluxes by influencing the relative balance of nitrogen cycling processes.
Methods
Sediment Coring and Field Measurements
We collected sediment cores and water samples from Waquoit Bay (41° 34′ N, 70° 32′ W) on six occasions at four sampling stations [Childs River Estuary (CRE), Metoxit Point (MP), South Basin (SB), and Sage Lot Pond (SLP); Figure 2] over 2 years (2012 and 2013; Table 1). We selected these sampling stations as they represent the environmental conditions of the Waquoit Bay estuarine system including variability in salinity and temperature profiles, external N loading rates, DIN (, , ), and dissolved inorganic P (DIP: ) concentrations, chlorophyll a concentrations, and sediment characteristics (as described by Foster and Fulweiler, 2014). Concentrations of DIN, DIP, and N2O did not differ significantly between the surface and bottom waters, except on two occasions at the CRE station. On these sampling dates, CRE surface water NOx ( + ) was significantly higher than the bottom water (p = 0.0003). In general, the water column at all stations is well-mixed, however at CRE freshwater inflow from river and groundwater can at times cause vertical stratification.
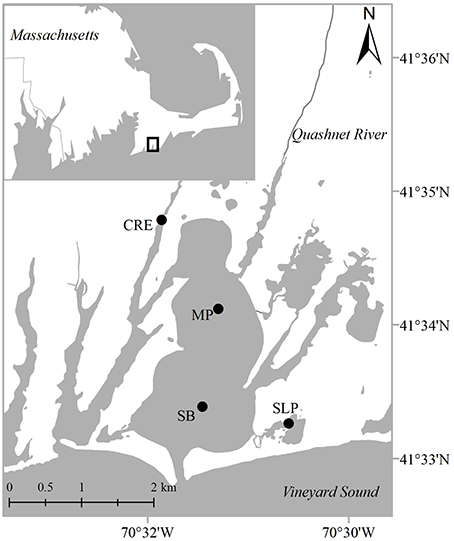
Figure 2. Sampling locations in Waquoit Bay, Massachusetts, USA. In 2012–2013 during summer and fall months we collected sediment cores and water samples from four stations: CRE (Childs River Estuary), MP (Metoxit Point), SB (South Basin), and SLP (Sage Lot Pond). Map adapted from Foster and Fulweiler (2014).
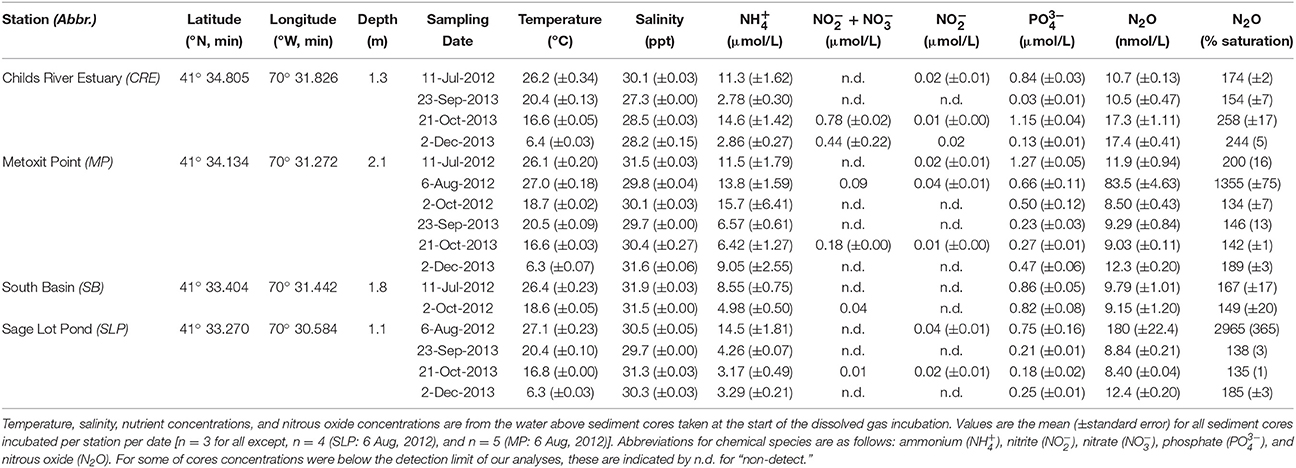
Table 1. Environmental conditions at four stations sampled in Waquoit Bay, Massachusetts, USA.
We collected triplicate sediment cores using clear polyvinyl chloride (PVC) core tubes (10 cm diameter and 30 cm height) and a pole corer. The sediment height in the collected cores ranged from 9 to 17 cm. In the field cores were capped and kept in a cooler in order to maintain approximate field temperature until they were brought to an environmental chamber at Boston University. On core collection days, we measured in situ surface and bottom water O2 concentrations, salinity, and temperature (Hach HQd using LDO101 and CDC401 probes) at each station. Bottom water was collected using a Niskin Water Sampler (General Oceanics, Miami, Florida, USA) and surface water was collected by hand. Duplicate water samples for DIN and DIP were immediately filtered into 30 mL acid washed and deionized water leached polyethylene bottles using a 60 mL acid washed polypropylene syringe and glass fiber filters (Whatman GF/F, 0.70 μm pore size). The vials were stored in a freezer (at approximately −15°C) until analysis. We also collected triplicate water samples for dissolved N2O gas analysis using 12 mL Labco Limited Exetainer® vials with gastight septa. Sample vials were filled from the bottom with ~3 times the overflow volume and preserved with 25 μL of saturated zinc chloride solution. These samples were then placed in a cooler on ice and transferred to a refrigerator (4–6°C) at the lab until analysis.
Incubation Set Up and Sampling
Sediment cores were placed in a water bath in an environmental chamber set to the ambient field temperature. The sediment cores were kept in the dark, uncapped, and bubbled gently with ambient air overnight (>12 h) to keep the overlaying water oxygenated without disturbing the surface of the sediment (Fulweiler et al., 2008; Heiss et al., 2012; Fields et al., 2014).
To determine benthic flux rates we conducted two separate static core incubations (Banta et al., 1995). Both incubations were conducted in the dark. During the first incubation we collected samples to determine the DIN/DIP fluxes, and in the second incubation we collected samples to determine the flux of dissolved N2O gas. We separated these incubations in order to minimize the sample volume taken from the cores at each time point thus decreasing potential dilution impacts. The two incubations were separated by at least 12 h and cores were again bubbled gently with ambient air (Fulweiler et al., 2007; Heiss et al., 2012; Vieillard and Fulweiler, 2012). Before each of the core incubations we carefully siphoned off the water overlaying the sediment and replaced it with filtered (0.2 μm), station-specific bottom water (Giblin et al., 1995; Hopkinson and Smith, 2005; Fulweiler et al., 2008). After each core tube was filled it was then sealed with no air headspace (water volume above cores ranged from 1.1 to 1.8 L) with an acrylic gas-tight lid equipped with inflow and outflow ports (Dornblaser et al., 1989). Magnetic stir bars fixed to the core tops provided gentle mixing of the overlying water (~40 revolutions min−1) with minimal re-suspension of sediments (Dornblaser et al., 1989; Giblin et al., 1995; Hopkinson et al., 2001; Renaud et al., 2008). The incubation temperatures ranged from 6 to 30°C (Table 1). Incubation time was determined by balancing the following criteria: achieving a 62.5 μM (2 mg O2 L−1) drop in dissolved O2 (Giblin et al., 1995), five sampling time points at intervals of at least 60 min, and dissolved O2 concentrations kept above the hypoxic threshold (>62.5 μM; Heiss et al., 2012). Incubation times ranged between 5 and 17 h.
At each time point 60 mL of water was collected from the cores and filtered for DIN and DIP analysis as described above in the field sampling description. Dissolved O2 concentrations were measured at three time points (initial, middle, and final) using an optical dissolved oxygen sensor (Hach LDO101). At the start of the second incubation we replaced the overlying water with filtered station water and the cores were again sealed with the gas tight lids and the incubation proceeded. We collected duplicate water samples for N2O at five time points allowing for overflow for each sample vial (Labco Limited Exetainer®).
Sampling Analysis and Flux Calculations
Dissolved inorganic nitrogen concentrations were determined by high-resolution digital colorimetry on a Seal Auto Analyzer 3 with segmented flow injection using standard techniques (Solorzano, 1969; Johnson and Petty, 1983; Grasshoff et al., 1999). Our laboratory minimum detection limits (MDLs) for the period of this study are 0.082, 0.035, 0.006, and 0.012 μM for , NOx( + ), , channels, respectively. Concentration values for and were consistently low and in many cases below the detection limit of the analysis method. As a result NOx was often less than the measured concentration of yielding a negative (i.e., “non-detect”) value for .
Concentrations of dissolved N2O gas were measured directly using a headspace equilibration technique similar to published methods (Kling et al., 1991). In brief, we created a headspace in each vial by adding 5 mL of ultra-high purity helium while simultaneously removing 5 mL of water sample. We carried out this procedure used Hamilton® gastight glass syringes equipped with stopcocks and Luer Lock connection dispensing needles, entering the Labco Exetainer® vials through the septa. Once the headspace was created, samples were shaken vigorously and left on their sides to equilibrate for a minimum of 1 h. After equilibration, we sampled the headspace and injected it into a Shimadzu 2014 Gas Chromatograph (GC) using a electron capture detector (ECD) with a 63Nickel (Ni) source. The columns contained HayeSep®and Shimalite®. Di-nitrogen (UPC grade) was used as the carrier gas and the make-up gas was a P5 mixture (5% methane, argon balance). Detector/column temperatures and gas flows followed specifications from the manufacturer (Shimadzu). Concentrations of headspace N2O were determined through a linear regression of peak area and standard concentrations custom made by Airgas® (Radnor Township, Pennsylvania, USA). The amount of N2O in the headspace was calculated using the Ideal Gas Law and aqueous concentrations of the dissolved gas were calculated according to Henry's Law using a Bunsen coefficient determined by the equation and constants of Weiss and Price (Weiss and Price, 1980).
Flux rates across the sediment–water interface were determined by calculating the linear regression slope of the nutrient or gas concentration over the incubation time (Banta et al., 1995; Giblin et al., 1997; Hopkinson et al., 1999; Heiss et al., 2012) when the coefficient of determination (R2) was ≥0.65 (Prairie, 1996). Positive fluxes represent a net efflux (i.e., production) of the analyte out of the sediments into the water column, and negative fluxes represent a net influx (i.e., uptake) of the analyte into the sediments from the water column (Fulweiler et al., 2008; Heiss et al., 2012). On some occasions the R2 ≤ 0.65. When there was no change in the analyte concentration the flux was determined to be net zero, representing either a balance between production and consumption processes in the sediments and/or rates that are below our detection limit. We designated fluxes as “non-detect” when there was a change in the analyte concentrations but the change was not linear (R2 < 0.65).
Dissolved inorganic nitrogen fluxes from 2012 were published previously (Foster and Fulweiler, 2014). We compiled these 2012 data with DIN flux data from 2013 in this study to use as supporting data to compare to the 2012–2013 N2O and DIP flux data.
Data Analysis
All statistical tests were conducted using the JMP software package (version 11.0.0, copyright 2013, SAS Institute Inc., Cary, North Carolina, USA). To determine if flux rates were significantly different from each other we ran analysis of variance (ANOVA) tests with sampling date and station as the main effects (Heiss et al., 2012; Vieillard and Fulweiler, 2012; Brin et al., 2014). We then conducted an all pairs Tukey-Kramer post-hoc tests (Tukey, 1949) to further examine where differences existed in our datasets. Variance in N2O fluxes across stations and sampling dates were homogenous according to the O'Brien's unequal variance test (p = 0.4366 and 0.0723, station and date, respectively). We determined outliers in dataset distributions as points that exceed 1.5 times the interquartile range beyond the first or third quartiles using Grubb's test for outliers (Grubbs, 1950). We determined outliers in our linear regression models as data points with a Cook's D influence value >1.0 (Cook, 1977). To determine the parameters that best described the variability observed in the N2O flux rates we applied single variable linear regression models and then developed multiple linear regression (MLR) models. We constructed the MLR models stepwise using minimum Akaike's Information Criterion (AICc; Akaike, 1973) as the stopping rule in the forward direction. To evaluate the appropriateness of using linear models, we plotted the model predictions against the model residuals and verified that the data were randomly distributed across y = 0. For all statistical analyses we interpreted a p ≤ 0.05 as statistically significant.
Results
Nitrous Oxide Fluxes across the Sediment Water Interface
N2O fluxes ranged from −99 to 78 nmol N2O m−2 h−1. However, on one sampling date (6-Aug-2012), we measured uncharacteristically high N2O fluxes (−1346 to 681 nmol N2O m−2 h−1) well outside the range of the other data. All 6 cores with non-zero fluxes from this date were outliers (p < 0.0001). We attribute these high fluxes to the initial N2O concentrations measured in each of the cores at the start of the incubation. On this date, initial N2O concentrations were 1–2 orders of magnitude greater than the initial concentrations measured for the other incubations (p < 0.0001; Table 1), and were strongly correlated with N2O uptake rates (R2 = 0.77, p = 0.068, n = 6 cores). In order to more accurately investigate the environmental controls on N2O fluxes, we did not include the 6-August-2012 N2O fluxes in our analyses.
On average, Waquoit Bay sediments consumed N2O (−23 ± 5.2 nmol N2O m−2 h−1, mean ± SE, significantly less than zero, p < 0.0001, n = 39 cores). N2O fluxes did not differ across stations (p = 0.2410; Figure 3). Sediment N2O uptake (i.e., negative flux) was observed in a majority of the cores with significant N2O fluxes (28 negative, 2 positive, and 9 zero; Figures 4A,C,E,G, 5A,C).
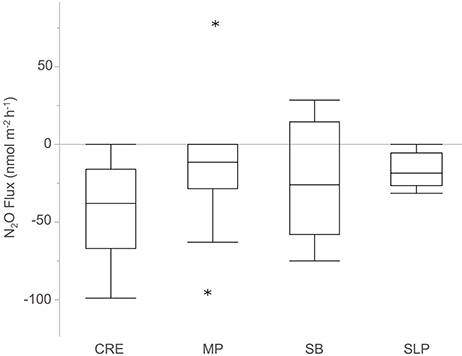
Figure 3. Sediment nitrous oxide (N2O) fluxes across the sediment–water interface from cores collected across the four Waquoit Bay sampling stations. Stars indicate outliers in the station distribution of N2O flux rates. Positive fluxes indicate that sediments are a net source of N2O and negative fluxes indicate sediments are a net N2O sink. Net zero fluxes indicate a balance between source and sink processes. Abbreviations for sampling stations: Childs River Estuary (CRE), Metoxit Point (MP), South Basin (SB), and Sage Lot Pond (SLP). Stations are listed from a relatively high external N load (CRE) to a relatively low N load (SLP). Overall sediments consumed N2O (−23 ± 5.2 nmol m−2 h−1, mean ± SE, significantly less than zero p < 0.0001, n = 39) and did not differ between stations (p = 0.2412, α = 0.05).
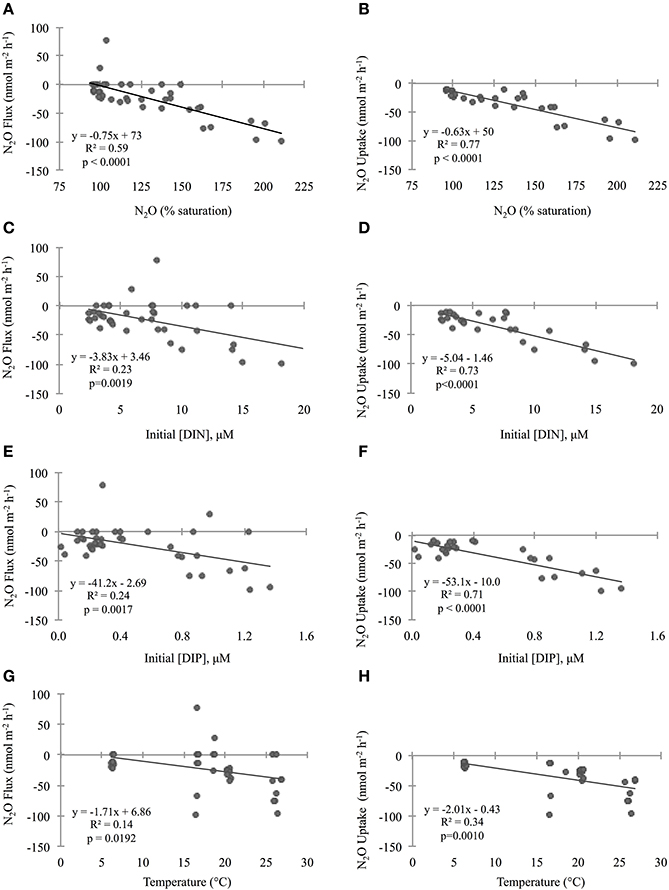
Figure 4. Relationship between initial geochemical parameter concentrations and sediment nitrous oxide (N2O) fluxes across the sediment–water interface. The first column of plots (A,C,E,G) compares parameters to “N2O Flux” which includes positive, zero, and negative rate values, while the second column (plots B,D,F,H) compares parameters to “N2O Uptake” which is a subset including negative rates only. Please note that only two cores had positive flux values (and seven cores were net zero), so it was not possible to have a subset for “Production.” Geochemical parameters include N2O (% saturation; A,B), dissolved inorganic nitrogen (DIN; C,D), phosphorus (DIP; E,F), and temperature (G,H). Lines through points show results from the single variable linear regression models. p-values were determined with significance level α = 0.05. For all cores, the initial total DIN concentrations were predominantly with very little to no contribution of oxidized nitrogen compounds. In all cores accounted for >75% of the total DIN and in all but one core it accounted for >91%.
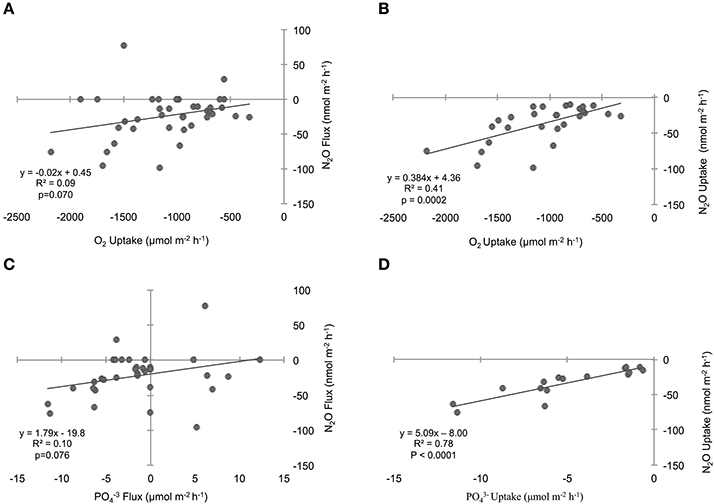
Figure 5. Influence of sediment oxygen (O2) (A) and phosphate () (C) fluxes on the nitrous oxide (N2O) flux across the sediment–water interface. The relationships considering sediment uptake rates are shown in the adjacent column of plots for O2 (B) and (D). “Flux” includes all positive, zero, and negative rates, while “uptake” includes negative rates only. Lines through points show results from the single variable linear regression models. p-values were determined with significance level α = 0.05.
Influence of Environmental Conditions and Sediment Dynamics
N2O Flux
To investigate the relative influence of environmental conditions and sediment dynamics on N2O fluxes, we compared N2O fluxes (i.e., net positive, zero, and negative values) to initial water column concentrations of geochemical parameters and sediment nutrient and O2 fluxes measured concurrently. Geochemical conditions included, salinity, temperature, DIN, DIP, N:P, O2 (% saturation), N2O (% saturation), and sediment fluxes included , , , DIP, and O2. Across the various geochemical parameters we found that the initial concentrations of N2O (% saturation), DIN, DIP as well as temperature all significantly influenced N2O fluxes (p < 0.0001, p = 0.0019, 0.0017, 0.0192, for N2O, DIN, DIP, and temperature, respectively; Table 2). All these parameters were inversely correlated to N2O fluxes, where higher initial concentrations and temperatures led to more negative N2O fluxes (Figures 4A,C,E,G). Based on the MLR using all of these initial parameters, N2O (% saturation) and DIP created the best fit model (MLR: R2 = 0.60, p < 0.0001; Table 2). We also found sediment N2O fluxes were positively related to O2 and DIP fluxes, although the relative statistical significance was not as strong (p = 0.0696 and 0.0762, O2 and DIP, respectively; Figures 5A,C and Table 3).
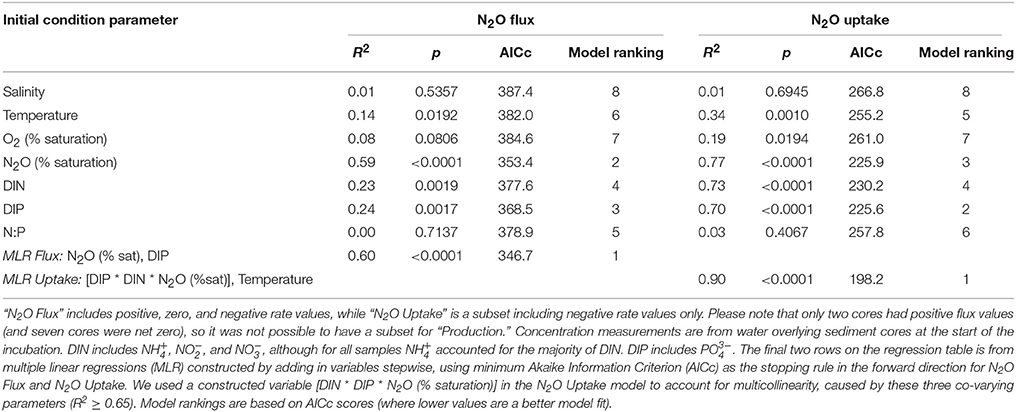
Table 2. Results from linear regression models comparing initial concentrations and measurements of environmental parameters on nitrous oxide (N2O) fluxes across the sediment–water interface.
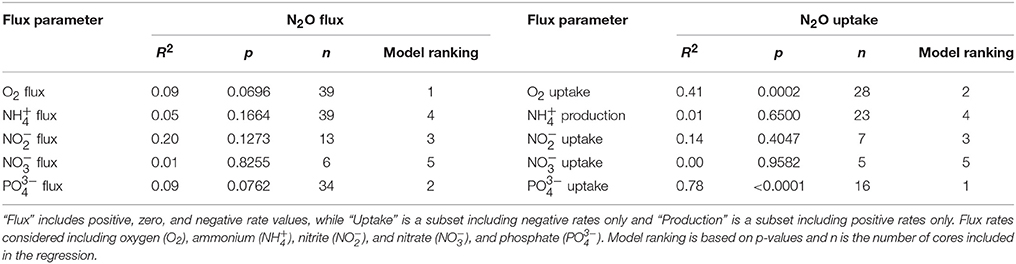
Table 3. Linear regression model results comparing oxygen and nutrient flux rates on nitrous oxide (N2O) fluxes across the sediment–water interface.
N2O Uptake
Overall, sediments in Waquoit Bay consumed N2O with 72% of the cores showing net N2O uptake (i.e., negative fluxes; Figure 4). To better understand what environmental conditions influenced N2O uptake rates we examined how the negative fluxes alone varied with other measured parameters (Table 2). Similar to the N2O flux results, we found that sediment N2O uptake was inversely correlated to the initial N2O (% saturation), DIN, DIP, and temperature [p < 0.0001 for N2O (% saturation), DIN, DIP, p = 0.0010 for temperature] where higher nutrient concentrations and temperatures resulted in greater N2O uptake (i.e., greater negative fluxes; Figures 4B,D,F,H). Oxygen(% saturation) was also significantly correlated to N2O uptake (p = 0.0194), although the relationship was positive with lower O2 (% saturation) concentrations corresponding to higher N2O uptake rates (i.e., greater negative fluxes). The influence of DIP on N2O uptake rates was stronger than DIN based on the slope of the linear regression model (m = −53.1 vs. −4.93 nmol N2O m−2 h−1 per μM DIP vs. DIN, respectively; Figures 4D,F). The ratio of initial concentrations of DIN to DIP (n = 25) appeared to influence N2O uptake rates, although the correlation was not statistically significant for a linear model [N2O uptake = (1.32 * N:P) − 60.2, R2 = 0.14, p = 0.061, n = 25, removing two outliers from the N:P dataset] or an exponential model [N2O uptake = −(e3.98− (0.035 * N:P)), R2 = 0.15, p = 0.061, n = 25]. Nonetheless the highest rates of N2O uptake (>50 nmol m−2 h−1) were observed only when the initial N:P ratios were below 16:1 (Figure 6).
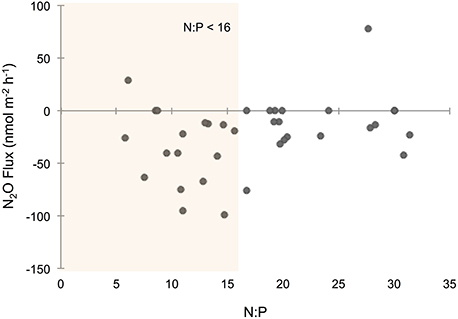
Figure 6. Nitrous oxide (N2O) flux across the sediment–water interface compared to the ratio of nitrogen (N) to phosphorus (P). N:P ratios were determined from the initial dissolved inorganic N (DIN) and P (DIP) molar concentrations measured from water above the sediments at the start of the incubation. Orange shading highlights N2O fluxes from cores with an initial N:P ratio below 16.
From these individual linear regression models we found that N2O (% saturation), DIN, DIP, and temperature were all significantly correlated to N2O uptake rates (all p < 0.0001) with DIP being the most influential parameter (based on AICc of best-fit; Table 2). Covariance among three of the predictive parameters DIN, DIP and N2O (% saturation) caused multicollinearity in our MLR model (N2O vs. DIP: R2 = 0.74, p < 0.0001; DIP vs. DIN: R2 = 0.75, p < 0.0001). The best-fit MLR model included temperature and a combined parameter of these three co-varying variables created by multiplication [DIN * DIP * N2O (% saturation)]. This MLR model strongly predicted N2O uptake rates (MLR: R2 = 0.90, p < 0.0001; Table 2).
We also compared N2O uptake rates to sediment flux dynamics and found that sediment uptake of O2 and DIP were positively correlated to uptake of N2O (p = 0.0002 and p < 0.0001, O2 and DIP, respectively; Figures 5B,D, Table 3). In particular, DIP uptake had a strong predictive power on N2O uptake (R2 = 0.78). We found no significant relationships between N2O uptake and any of the DIN fluxes (Table 3). It was difficult to clearly determine the influence of and uptake however, because of the low sample sizes from numerous non-detect concentration values. Based on the large variation in sample sizes between the flux parameters, we did not compare AICc scores from the single variable linear regression models, and did not construct an MLR. Best-fit evaluations were based on p-values.
Discussion
Influential Parameters on Sediment N2O Uptake
Sediment N2O fluxes in Waquoit Bay were dominated by uptake at all the sites and across all sampling dates. These findings are consistent with a previous study conducted in Waquoit Bay two decades ago (LaMontagne et al., 2003). In a recent global review of coastal N2O flux ranges, Murray et al. (2015) found that 37% of the locations reported negative N2O flux rates. In fact, substantial uptake rates have been measured in a range of latitudes and coastal systems including, salt marshes (Blackwater estuary, Essex, UK; Adams et al., 2012), mangroves (Brisbane and near Port Douglas, Queensland, Australia; Kreuzwieser et al., 2003), intertidal sediments (Rowley River, Massachusetts, USA; Vieillard and Fulweiler, 2014), and in estuarine open water bodies (Adyar River Estuary, India; Rajkumar et al., 2008).
We found that sediment N2O uptake rates (i.e., negative fluxes) are significantly influenced by DIN, DIP, N2O (% saturation), O2 (% saturation), temperature, and the rate of sediment DIP and O2 uptake. When we consider all N2O fluxes together (i.e., positive, zero, and negative values), these factors are also the dominant predictive parameters, although the relationships are weaker. Based on the findings of previous studies and our current understanding of sediment N2O flux dynamics, some of the relationships found were expected (e.g., temperature, N2O, and O2 % saturations, and O2 uptake), while others were less so (e.g., DIN and DIP concentrations and DIP uptake).
Temperature is often a key factor regulating bacterial activity and we therefore expected it to play a role in regulating N2O sediment fluxes (Nowicki, 1994; Barnes and Owens, 1999). In Waquoit Bay, higher temperatures were positively correlated to both sediment N2O fluxes and uptake rates, although it explained only a small portion of the variability. Water column N2O and O2 (% saturation) also played an influential role on sediment N2O uptake rates. Higher concentrations of N2O where positively correlated to high rates of N2O uptake, indicating that adding more reactant (i.e., N2O) facilitates greater consumption rates. In contrast, low O2 (% saturation) corresponded to high N2O uptake rates. This is consistent with research from oxygen minimum zones (OMZs) that have found N2O consumption by denitrification in the oxygen-depleted core of OMZs (Cohen and Gordon, 1978; Yoshida et al., 1984; Yoshinari et al., 1997; Farías et al., 2007; Yamagishi et al., 2007). Low O2 conditions favor N2O consuming processes (e.g., denitrification, DNRA, heterotrophic N-fixation; Figure 1), which use anaerobic metabolic pathways and consume organic carbon. Similarly, we found sediment O2 uptake to be positively correlated to N2O uptake, signifying the importance of organic matter substrate since the rate of sediment O2 uptake can be a proxy for the amount of organic matter in the sediments (i.e., high organic matter content promotes high O2 uptake rates).
In numerous studies, the concentration of N has been shown to be a good predictor of N2O fluxes from a variety of ecosystems from both terrestrial (Eichner, 1990; Liu and Greaver, 2009; Acton and Baggs, 2011) and marine environments (Seitzinger and Nixon, 1985; Murray et al., 2015). The hypothesis that N loading to coastal systems increases the efflux of N2O is based on a conceptual model where increasing N loads to coastal areas stimulates primary production and the biological N cycle which leads to greater emission of N2O during processes such as nitrification and denitrification (Seitzinger et al., 1984, 2000; Firestone and Davidson, 1989). In contrast to this model we found higher sediment N2O uptake rates under increasing DIN concentrations. This is likely driven by the fact that DIN was dominated by while and concentrations were so low they were undetectable. In addition, we also observed higher sediment N2O uptake rates under increasing DIP concentrations. Although, we recognize that these correlations do not necessarily signify causality, we hypothesize that microbial processes responsible for N2O consumption may be stimulated by water column DIN and DIP and thus, sediment N2O uptake could be limited by inorganic nutrient availability.
This hypothesis is also supported by the uptake of DIP in these sediments and the positive correlation between DIP uptake and N2O uptake. Sediment DIP uptake is particularly intriguing since marine sediments are typically considered to be a source of DIP. High sulfate concentrations (Sugawara et al., 1957; Caraco et al., 1989), and low bottom water O2 conditions (Mortimer, 1941, 1942) characteristic of shallow marine systems limit their ability to retain DIP through mineral precipitation and/or adsorption which enhances sediment release of DIP. The seasonal variability of the benthic DIP flux is characterized with a high efflux of DIP during the warmest months of the year (Nixon et al., 1980; Jensen et al., 1995). In contrast to these commonly observed trends, we found that DIP was consumed in the majority of Waquoit Bay sediment cores across all incubation temperatures. Although, DIP fluxes are often explained by abiotic adsorption/mineral formation in coastal marine sediments, uptake of DIP by microorganisms can also substantially limit regenerated DIP release (Gächter et al., 1988). In Waquoit Bay, sediment O2 uptake had a positive linear relationship to DIP uptake (R2 = 0.40, p < 0.0001, plot not shown). One interpretation of this result is that at least part of the DIP uptake may be explained by microbial aerobic metabolism. We might then expect that anaerobic metabolisms may also be influencing DIP uptake if we assume that the stoichiometric requirement for P would be high for any actively growing microorganism (Vadstein and Olsen, 1989; Vadstein, 2000; Arrigo, 2005) reflecting the increased allocation to growth “machinery” such as P-rich ribosomal RNA (Elser et al., 1996; Arrigo, 2005).
Literature from terrestrial studies have shown that P concentrations can play an important role on N2O emissions by influencing microbial rates of nitrification and denitrification (Minami and Fukushi, 1983; Hall and Matson, 1999). In addition, Vieillard and Fulweiler (2014) found evidence of P limitation on the flux of N2O from an experimental study conducted in a temperate tidal flat. In Waquoit Bay we found that initial DIP concentrations and DIP uptake were among the most influential factors on sediment N2O uptake. Initial DIP concentrations had a stronger impact than DIN concentrations on N2O uptake rates, and we observed the highest N2O uptake rates when the initial N:P ratio was below 16:1 (Figure 6). Taken together, these results indicate that P may play an important role in the regulation of N2O fluxes in these and perhaps other estuarine sediments.
An Ecosystem Service: Sediment Net N2O Uptake
Low oxidized N concentrations (i.e., and ) are a key environmental characteristic of both terrestrial (Chapuis-Lardy et al., 2007) and aquatic (Murray et al., 2015) ecosystems exhibiting N2O consumption. These conditions are likely to occur in many shallow, macrophyte-dominated ecosystems, like the one we studied here. Despite high nutrient loading, Waquoit Bay bottom waters have relatively low DIN concentrations due to efficient nutrient uptake by macroalgae (Peckol et al., 1994). In this study, the DIN pool measured in the cores was dominated by and concentrations of and were consistently low or below the detection limit (Table 1) as were the sediment fluxes of both species. Under these conditions, the source of for denitrifiers comes primarily from nitrification, in coupled nitrification-denitrification (Jenkins and Kemp, 1984). In Waquoit Bay the bottom waters are frequently under-saturated with respect to O2 (D'Avanzo and Kremer, 1994) and it is likely that nitrification rates at the sediment–water interface are low, thus there is little available for denitrification. Additionally, surface waters in Waquoit Bay were consistently at saturation or super-saturated with respect to N2O, likely as a result of the septic contaminated groundwater inflow (LaMontagne et al., 2003) and water column nitrification (Barnes and Owens, 1999). Under conditions where N2O is at or above saturation, and concentrations of and O2 are low, microorganisms with the N2O reductase enzyme (which transforms N2O to N2) can use exogenous N2O as the sole electron acceptor for respiration (Zumft and Kroneck, 2007), and the balance of the N2O flux may tip toward net uptake vs. production (Figure 1).
We propose that Waquoit Bay, is similar to many other temperate estuaries where relatively long water residence times, low O2 conditions, and high macroalgae production create an environment conducive to net N2O sediment uptake. During these conditions sediments can consume N2O and provide an important and perhaps underappreciated ecosystem service. Of course, here we have measured the uptake of N2O by the sediments, not the water–atmosphere flux. A key next step is to determine if this sediment uptake rate is large enough to make the system a net sink of N2O from the atmosphere. We propose that under certain conditions sediment N2O uptake could substantially lower water column concentrations so that the percent saturation of N2O dips below equilibrium with the atmosphere. Under this circumstance there would be a net flux from the atmosphere into the estuary. For example, in Waquoit Bay, summer conditions include warm water, high primary productivity, low concentrations, and large diel swings in dissolved O2 with the potential for persistent (on the order of days) low oxygen concentrations. In addition, winds in Waquoit Bay are predominantly onshore (south-westerly) during the summer, which reduces estuarine circulation and increases residence time (Geyer, 1997). These summertime conditions would stimulate microbial processes consuming N2O and promote N2O under-saturation.
Conclusions and Implications
Coastal ecosystems represent an important component of the global N2O budget, however the estimates from these regions are not well-constrained. This is due, in part, to a limited understanding of the environmental factors influencing N2O consumption. In this study we found that sediments from a shallow, temperate estuary acted as a net N2O sink, despite heavy N loads from the surrounding watershed. Such sediment consumption of N2O likely decreases the net ecosystem efflux to the atmosphere and export to the neighboring ocean. We found that initial water column DIP, DIN, N2O, temperature and sediment DIP and O2 uptake were all positively correlated to N2O uptake from the estuarine sediments. Of all the geochemical conditions and processes measured we found that both the initial concentration and sediment uptake rate of DIP most significantly influence sediment N2O uptake. This has several potential implications for estuarine biogeochemical cycles of C, P, and N. While N inputs can accelerate C fixation by primary producers, nutrients like P could influence rates of C turnover by heterotrophs. In addition, DIP consumption by benthic heterotrophic processes could have a secondary effect on pelagic primary producers that rely on the regeneration of nutrients from sediments for growth. Furthermore, if N2O uptake is driven primarily by denitrifiers we hypothesize that DIP may limit overall denitrification, which would decrease the natural filtering process that transforms reactive N (e.g., ) into its largely unreactive form (e.g., N2). Of course, future field observations and experimental work will need to test this hypothesis, but if true, it would challenge our understanding of what controls N removal in estuarine sediments. Going forward, efforts to improve our understanding of the environmental factors driving N2O fluxes in coastal ecosystems is of critical importance as it will promote better management decisions, generate more accurate greenhouse gas budgets, and enhance our ability to predict the response to future environmental change.
Author Contributions
Both authors (SF and RF) were involved in all aspects of the research presented, including the study design, field sampling, lab incubations/experiments, sample analytical analyses, data analysis and interpretation, and writing. SF took the lead on these research elements and wrote the first draft of the manuscript. RF contributed substantially by advising on all aspects of the research, providing funding support, assisting with field and lab work, and providing manuscript comments and edits. SF and RF are accountable for all aspects of the work presented.
Funding
Funding and support for this work was provided in part by the Woods Hole Sea Grant (awarded to RWF), the Alfred P. Sloan Foundation Fellowship (awarded to RWF), and the National Defense Science and Engineering Graduate student fellowship administered through the American Society for Engineering Education (awarded to SQF).
Conflict of Interest Statement
The authors declare that the research was conducted in the absence of any commercial or financial relationships that could be construed as a potential conflict of interest.
Acknowledgments
We thank the National Estuarine Research Reserve and specifically C. Weidman, for the site access, boat use, and field assistance during this project. The following Fulweiler Lab members and Boston University Marine Program students assisted us in the field and/or during the lab incubations: E. Heiss, S. Newell, S. Donovan, K. Czapla, M.K. Rogener, S. Buckley, K. Yoshimura, M. Yacano, G. Hillyer, R. Lauto, Z. Bengtsson, A. Banks, R. Schweiker, J. Luthringer, D. Forest, and S. Andrews. We would like to thank K. Czapla and A. Al-Haj for running the nutrient samples and H. Emery and E. Morgan for assisting us with the GC greenhouse gas methods development. H. Emery also helped with statistical analysis. And finally, we would like to thank T. Maguire for creating the Waquoit Bay sampling stations map.
References
Acton, S. D., and Baggs, E. M. (2011). Interactions between N application rate, CH4 oxidation and N2O production in soil. Biogeochemistry 103, 15–26. doi: 10.1007/s10533-010-9442-5
Adams, C. A., Andrews, J. E., and Jickells, T. (2012). Nitrous oxide and methane fluxes vs. carbon, nitrogen and phosphorous burial in new intertidal and saltmarsh sediments. Sci. Total Environ. 434, 240–251. doi: 10.1016/j.scitotenv.2011.11.058
Akaike, H. (1973). “Information theory and an extension of the maximum likelihood principle,” in Proceedings of the Second International Symposium on Information Theory, eds B. N. Petrov and F. Caski (Budapest: Akademiai Kiado), 267–281.
Arrigo, K. R. (2005). Marine microorganisms and global nutrient cycles. Nature 437, 349–355. doi: 10.1038/nature04159
Baggs, E. M. (2008). A review of stable isotope techniques for N2O source partitioning in soils: recent progress, remaining challenges and future considerations. Rapid Commun. Mass Spectrom. 22, 1664–1672. doi: 10.1002/rcm.3456
Bange, H. W. (2006). Nitrous oxide and methane in European coastal waters. Estuar. Coast. Shelf Sci. 70, 361–374. doi: 10.1016/j.ecss.2006.05.042
Bange, H. W., Rapsomanikis, S., and Andreae, M. O. (1996). Nitrous oxide in coastal waters. Global Biogeochem. Cycles 10, 197–207. doi: 10.1029/95GB03834
Banta, G. T., Giblin, A. E., Hobbie, J. E., and Tucker, J. (1995). Benthic respiration and nitrogen release in Buzzards Bay, Massachusetts. J. Mar. Res. 53, 107–135. doi: 10.1357/0022240953213287
Barnes, J., and Owens, N. (1999). Denitrification and nitrous oxide concentrations in the Humber Estuary, UK, and adjacent coastal zones. Mar. Pollut. Bull. 37, 247–260. doi: 10.1016/S0025-326X(99)00079-X
Barnes, J., and Upstill-Goddard, R. C. (2011). N2O seasonal distributions and air-sea exchange in UK estuaries: implications for the tropospheric N2O source from European coastal waters. J. Geophys. Res. 116:G01006. doi: 10.1029/2009JG001156
Boynton, W. R., and Kemp, W. M. (1985). Nutrient regeneration and oxygen consumption by sediments along an estuarine salinity gradient. Mar. Ecol. Prog. Ser. 23, 45–55. doi: 10.3354/meps023045
Brin, L. D., Giblin, A. E., and Rich, J. J. (2014). Environmental controls of anammox and denitrification in Southern New England estuarine and shelf sediments. Limnol. Oceanogr. 59, 851–860. doi: 10.4319/lo.2014.59.3.0851
Caraco, N. F., Cole, J. J., and Likens, G. E. (1989). Evidence for sulphate-controlled phosphorus release from sediments of aquatic systems. Nature 341, 316–318. doi: 10.1038/341316a0
Chapuis-Lardy, L., Wrage, N., Metay, A., Chotte, J. L., and Bernoux, M. (2007). Soils, a sink for N2O? A review. Glob. Change Biol. 13, 1–17. doi: 10.1111/j.1365-2486.2006.01280.x
Christensen, J. P. (1994). Carbon export from continental shelves, denitrification and atmospheric carbon dioxide. Cont. Shelf Res. 14, 547–576. doi: 10.1016/0278-4343(94)90103-1
Coby, A. J., and Picardal, F. W. (2005). Inhibition of and reduction by microbial Fe (III) reduction: evidence of a reaction between and cell surface-bound Fe2. Appl. Environ. Microbiol. 71, 5267–5274. doi: 10.1128/AEM.71.9.5267-5274.2005
Cohen, Y., and Gordon, L. I. (1978). Nitrous oxide in the oxygen minimum of the eastern tropical North Pacific: evidence for its consumption during denitrification and possible mechanisms for its production. Deep Sea Res. 25, 509–524. doi: 10.1016/0146-6291(78)90640-9
Cook, R. D. (1977). Detection of influential observation in linear regression. Technometrics 19, 15–18. doi: 10.1080/00401706.1977.10489493
Cooper, D. C., Picardal, F. W., Schimmelmann, A., and Coby, A. J. (2003). Chemical and biological interactions during nitrate and goethite reduction by Shewanella putrefaciens 200. Appl. Environ. Microbiol. 69, 3517–3525. doi: 10.1128/AEM.69.6.3517-3525.2003
D'Avanzo, C., and Kremer, J. N. (1994). Diel oxygen dynamics and anoxic events in an eutrophic estuary of Waquoit Bay, Massachusetts. Estuaries 17, 131–139. doi: 10.2307/1352562
Dornblaser, M. M., Tucker, J., Banta, G. T., Foreman, K. H., O'Brien, M. C., and Giblin, A. E. (1989). “Obtaining undisturbed sediment cores for biogeochemical process studies using SCUBA,” in Proceedings of the American Academy of Underwater Sciences (AAUS), 9th Annual Scientific Diving Symposium, eds M. A. Lang and W. C. Jaap (Costa Mesa, CA), 97–104.
Eichner, M. J. (1990). Nitrous oxide emissions from fertilized soils: summary of available data. J. Environ. Qual. 19, 272–280. doi: 10.2134/jeq1990.00472425001900020013x
Einsle, O., Messerschmidt, A., Stach, P., Bourenkov, G. P., Bartunik, H. D., Huber, R., et al. (1999). Structure of cytochrome c nitrite reductase. Nature 400, 476–480. doi: 10.1038/22802
Elser, J. J., Dobberfuhl, D. R., MacKay, N. A., and Schampel, J. H. (1996). Organism size, life history, and N:P stoichiometry. BioScience 46, 674–684. doi: 10.2307/1312897
Eyre, B. D., Maher, D. T., and Squire, P. (2013). Quantity and quality of organic matter (detritus) drives N2 effluxes (net denitrification) across seasons, benthic habitats, and estuaries. Global Biogeochem. Cycles 27, 1083–1095. doi: 10.1002/2013GB004631
Farías, L., Faúndez, J., Fernández, C., Cornejo, M., Sanhueza, S., and Carrasco, C. (2013). Biological N2O fixation in the Eastern South Pacific Ocean and marine cyanobacterial cultures. PLoS ONE 8:e63956. doi: 10.1371/journal.pone.0063956
Farías, L., Paulmier, A., and Gallegos, M. (2007). Nitrous oxide and N-nutrient cycling in the oxygen minimum zone off Northern Chile. Deep Sea Res. I Oceanogr. Res. Pap. 54, 164–180. doi: 10.1016/j.dsr.2006.11.003
Fernandes, S. O., Bharathi, P. A., Bonin, P. C., and Michotey, V. D. (2010). Denitrification: an important pathway for nitrous oxide production in tropical mangrove sediments (Goa, India). J. Environ. Qual. 39, 1507–1516. doi: 10.2134/jeq2009.0477
Fields, L., Nixon, S. W., Oviatt, C., and Fulweiler, R. W. (2014). Benthic metabolism and nutrient regeneration in hydrographically different regions on the inner continental shelf of Southern New England. Estuar. Coast. Shelf Sci. 148, 14–26. doi: 10.1016/j.ecss.2014.06.007
Firestone, M. K., and Davidson, E. A. (1989). “Microbiological basis of NO and N2O production and consumption in soil,” in Exchange of Trace Gases between Terrestrial Ecosystems and the Atmosphere, eds M. O. Andreae and D. S. Schimel (New York, NY: John Wiley & Sons), 7–21.
Foster, S. Q., and Fulweiler, R. W. (2014). Spatial and historic variability of benthic nitrogen cycling in an anthropogenically impacted estuary. Front. Mar. Sci. 1:56. doi: 10.3389/fmars.2014.00056
Frame, C. H., and Casciotti, K. L. (2010). Biogeochemical controls and isotopic signatures of nitrous oxide production by a marine ammonia-oxidizing bacterium. Biogeosciences 7, 2695–2709. doi: 10.5194/bg-7-2695-2010
Fulweiler, R. W., Nixon, S. W., Buckley, B. A., and Granger, S. L. (2007). Reversal of the net dinitrogen gas flux in coastal marine sediments. Nature 448, 180–182. doi: 10.1038/nature05963
Fulweiler, R. W., Nixon, S. W., Buckley, B. A., and Granger, S. L. (2008). Net sediment N2 fluxes in a coastal marine system—experimental manipulations and a conceptual model. Ecosystems 11, 1168–1180. doi: 10.1007/s10021-008-9187-3
Gächter, R., Meyer, J. S., and Mares, A. (1988). Contribution of bacteria to release and fixation of phosphorus in lake sediments. Limnol. Oceanogr. 33, 1542–1558. doi: 10.4319/lo.1988.33.6_part_2.1542
Gattuso, J.-P., Frankignoulle, M., and Wollast, R. (1998). Carbon and carbonate metabolism in coastal aquatic ecosystems. Annu. Rev. Ecol. Syst. 29, 405–434. doi: 10.1146/annurev.ecolsys.29.1.405
Geyer, W. R. (1997). Influence of wind on dynamics and flushing of shallow estuaries. Estuar. Coast. Shelf Sci. 44, 713–722. doi: 10.1006/ecss.1996.0140
Giblin, A. E., Hopkinson, C. S., and Tucker, J. (1997). Benthic metabolism and nutrient cycling in Boston Harbor, Massachusetts. Estuaries 20, 346–364. doi: 10.2307/1352349
Giblin, A. E., Hopkinson, C. S., Tucker, J., Nowicki, B. L., and Kelly, J. R. (1995). Metabolism, Nutrient Cycling and Denitrification in Boston Harbor and Massachusetts Bay Sediments in 1994. Massachusetts Water Resources Authority.
Giblin, A. E., Tobias, C. R., Song, B., Weston, N., Banta, G. T., and Rivera-Monroy, V. H. (2013). The importance of dissimilatory nitrate reduction to ammonium (DNRA) in the nitrogen cycle of coastal ecosystems. Oceanography 26, 124–131. doi: 10.5670/oceanog.2013.54
Grasshoff, K., Kremling, K., and Ehrhardt, M. (eds.). (1999). “Determination of Nutrients,” in Methods of Seawater Analysis (Weinheim: Wiley-VCH, Verlag GmbH, D-69469), 159–226.
Groffman, P. M., Butterbach-Bahl, K., Fulweiler, R. W., Gold, A. J., Morse, J. L., Stander, E. K., et al. (2009). Challenges to incorporating spatially and temporally explicit phenomena (hotspots and hot moments) in denitrification models. Biogeochemistry 93, 49–77. doi: 10.1007/s10533-008-9277-5
Grubbs, F. E. (1950). Sample criteria for testing outlying observations. Ann. Math. Stat. 21, 27–58. doi: 10.1214/aoms/1177729885
Hall, S. J., and Matson, P. A. (1999). Nitrogen oxide emissions after nitrogen additions in tropical forests. Nature 400, 152–155. doi: 10.1038/22094
Heiss, E. M., Fields, L., and Fulweiler, R. W. (2012). Directly measured net denitrification rates in offshore New England sediments. Cont. Shelf Res. 45, 78–86. doi: 10.1016/j.csr.2012.06.002
Hopkinson, C. S., Giblin, A. E., and Tucker, J. (2001). Benthic metabolism and nutrient regeneration on the continental shelf of Eastern Massachusetts, USA. Mar. Ecol. Prog. Ser. 224, 1–19. doi: 10.3354/meps224001
Hopkinson, C. S., Giblin, A. E., Tucker, J., and Garritt, R. H. (1999). Benthic metabolism and nutrient cycling along an estuarine salinity gradient. Estuaries 22, 863–881. doi: 10.2307/1353067
Hopkinson, C. S., and Smith, E. M. (2005). “Estuarine respiration: an overview of benthic, pelagic, and whole system respiration,” in Respiration in Aquatic Ecosystems, eds P. A. del Giorgio and P. J. L. Williams (New York, NY: Oxford University Press), 122–146.
Jenkins, M. C., and Kemp, W. M. (1984). The coupling of nitrification and denitrification in two estuarine sediments. Limnol. Oceanogr. 29, 609–619. doi: 10.4319/lo.1984.29.3.0609
Jensen, H. S., Mortensen, P. B., Andersen, F. O., Rasmussen, E., and Jensen, A. (1995). Phosphorus cycling in a coastal marine sediment, Aarhus Bay, Denmark. Limnol. Oceanogr. 40, 908–917. doi: 10.4319/lo.1995.40.5.0908
Johnson, K. S., and Petty, R. L. (1983). Determination of nitrate and nitrite in seawater by flow injection analysis. Limnol. Oceanogr. 28, 1260–1266. doi: 10.4319/lo.1983.28.6.1260
Joye, S. B., and Hollibaugh, J. T. (1995). Influence of sulfide inhibition on nitrification on nitrogen regeneration in sediments. Science 270, 623–625. doi: 10.1126/science.270.5236.623
Kartal, B., Kuypers, M. M., Lavik, G., Schalk, J., Op den Camp, H. J., Jetten, M. S., et al. (2007). Anammox bacteria disguised as denitrifiers: nitrate reduction to dinitrogen gas via nitrite and ammonium. Environ. Microbiol. 9, 635–642. doi: 10.1111/j.1462-2920.2006.01183.x
Kieskamp, W. M., Lohse, L., Epping, E., and Helder, W. (1991). Seasonal variation in denitrification rates and nitrous oxide fluxes in intertidal sediments of the western Wadden Sea. Mar. Ecol. Prog. Ser. 72, 145–151. doi: 10.3354/meps072145
Kling, G. W., Kipphut, G. W., and Miller, M. C. (1991). Arctic lakes and streams as gas conduits to the atmosphere: implications for tundra carbon budgets. Science 251, 298. doi: 10.1126/science.251.4991.298
Kreuzwieser, J., Buchholz, J., and Rennenberg, H. (2003). Emission of methane and nitrous oxide by Australian mangrove ecosystems. Plant Biol. 5, 423–431. doi: 10.1055/s-2003-42712
Kroeze, C., Dumont, E., and Seitzinger, S. P. (2005). New estimates of global emissions of N2O from rivers and estuaries. Environ. Sci. 2, 159–165. doi: 10.1080/15693430500384671
LaMontagne, M. G., Duran, R., and Valiela, I. (2003). Nitrous oxide sources and sinks in coastal aquifers and coupled estuarine receiving waters. Sci. Total Environ. 309, 139–149. doi: 10.1016/S0048-9697(02)00614-9
Liu, L., and Greaver, T. L. (2009). A review of nitrogen enrichment effects on three biogenic GHGs: the CO2 sink may be largely offset by stimulated N2O and CH4 emission. Ecol. Lett. 12, 1103–1117. doi: 10.1111/j.1461-0248.2009.01351.x
McClain, M. E., Boyer, E. W., Dent, C. L., Gergel, S. E., Grimm, N. B., Groffman, P. M., et al. (2003). Biogeochemical hot spots and hot moments at the interface of terrestrial and aquatic ecosystems. Ecosystems 6, 301–312. doi: 10.1007/s10021-003-0161-9
Middelburg, J. J., Klaver, G., Nieuwenhuize, J., Markusse, R. M., Vlug, T., and van der Nat, F. J. W. (1995). Nitrous oxide emissions from estuarine intertidal sediments. Hydrobiologia 311, 43–55. doi: 10.1007/BF00008570
Minami, K., and Fukushi, S. (1983). Effecfs of phosphate and calcium carbonate application on emission of N2 0 from soils under aerobic conditions. Soil Sci. Plant Nutr. 29, 517–524. doi: 10.1080/00380768.1983.10434654
Mortimer, C. H. (1941). The exchange of dissolved substances between mud and water in lakes. J. Ecol. 29, 280–329. doi: 10.2307/2256395
Mortimer, C. H. (1942). The exchange of dissolved substances between mud and water in lakes. J. Ecol. 30, 147–201. doi: 10.2307/2256691
Moseman-Valtierra, S., Gonzalez, R., Kroeger, K. D., Tang, J., Chao, W. C., Crusius, J., et al. (2011). Short-term nitrogen additions can shift a coastal wetland from a sink to a source of N2O. Atmos. Environ. 45, 4390–4397. doi: 10.1016/j.atmosenv.2011.05.046
Murray, R. H., Erler, D. V., and Eyre, B. D. (2015). Nitrous oxide fluxes in estuarine environments: response to global change. Glob. Change Biol. 21, 3219–3245. doi: 10.1111/gcb.12923
Myhre, G., Shindell, D., Breon, F.-M., Collins, W., Fuglestvedt, J., Huang, J., et al. (2013). “Anthropogenic and natural radiative forcing,” in Climate Change 2013: The Physical Science Basis. Contribution of Working Group I to the Fifth Assessment Report of the Intergovernmental Panel on Climate Change, eds T. F. Stockner, D. Qin, G.-K. Plattner, M. Tignor, S. K. Allen, J. Boschung, A. Nauels, Y. Xia, V. Bex, and P. M. Midgley (Cambridge, UK; New York, NY: Cambridge University Press), 659–740.
Nixon, S. W. (1981). “Remineralization and nutrient cycling in coastal marine sediments,” in Estuaries and Nutrients, eds B. Nielsen and L. Cronin (Clifton, NJ: Humana Press), 111–138.
Nixon, S. W., Kelly, J. R., Furnas, B. N., Oviatt, C. A., and Hale, S. S. (1980). “Phosphorus regeneration and the metabolism of coastal marine bottom communities,” in Marine Benthic Dynamics, eds K. R. Tenore and B. C. Coull (Columbia, SC: University of South Carolina Press), 219–242.
Nowicki, B. L. (1994). The effect of temperature, oxygen, salinity, and nutrient enrichment on estuarine denitrification rates measured with a modified nitrogen gas flux technique. Estuar. Coast. Shelf Sci. 38, 137–156. doi: 10.1006/ecss.1994.1009
Peckol, P., DeMeo-Anderson, B., Rivers, J., Valiela, I., Maldonado, M., and Yates, J. (1994). Growth, nutrient uptake capacities and tissue constituents of the macroalgae Cladophora vagabunda and Gracilaria tikvahiae related to site-specific nitrogen loading rates. Mar. Biol. 121, 175–185. doi: 10.1007/BF00349487
Portmann, R. W., Daniel, J. S., and Ravishankara, A. R. (2012). Stratospheric ozone depletion due to nitrous oxide: influences of other gases. Philos. Trans. R. Soc. B Biol. Sci. 367, 1256–1264. doi: 10.1098/rstb.2011.0377
Prairie, Y. T. (1996). Evaluating the predictive power of regression models. Can. J. Fish. Aquat. Sci. 53, 490–492. doi: 10.1139/f95-204
Rajkumar, A. N., Barnes, J., Ramesh, R., Purvaja, R., and Upstill-Goddard, R. C. (2008). Methane and nitrous oxide fluxes in the polluted Adyar River and estuary, SE India. Mar. Pollut. Bull. 56, 2043–2051. doi: 10.1016/j.marpolbul.2008.08.005
Rakshit, S., Matocha, C. J., and Coyne, M. S. (2008). Nitrite reduction by siderite. Soil Sci. Soc. Am. J. 72, 1070–1077. doi: 10.2136/sssaj2007.0296
Ravishankara, A. R., Daniel, J. S., and Portmann, R. W. (2009). Nitrous oxide (N2O): the dominant ozone-depleting substance emitted in the 21st century. Science 326, 123–125. doi: 10.1126/science.1176985
Renaud, P. E., Morata, N., Carroll, M. L., Denisenko, S. G., and Reigstad, M. (2008). Pelagic–benthic coupling in the Western Barents Sea: processes and time scales. Deep Sea Res. II 55, 2372–2380. doi: 10.1016/j.dsr2.2008.05.017
Sanford, R. A., Wagner, D. D., Wu, Q., Chee-Sanford, J. C., Thomas, S. H., Cruz-García, C., et al. (2012). Unexpected nondenitrifier nitrous oxide reductase gene diversity and abundance in soils. Proc. Natl. Acad. Sci. U.S.A. 109, 19709–19714. doi: 10.1073/pnas.1211238109
Santoro, A. E., Buchwald, C., McIlvin, M. R., and Casciotti, K. L. (2011). Isotopic signature of N2O produced by marine ammonia-oxidizing archaea. Science 333, 1282–1285. doi: 10.1126/science.1208239
Seitzinger, S. P. (1988). Denitrification in freshwater and coastal marine ecosystems: ecological and geochemical significance. Limnol. Oceanogr. 33, 702–724. doi: 10.4319/lo.1988.33.4_part_2.0702
Seitzinger, S. P., Kroeze, C., and Styles, R. V. (2000). Global distribution of N2O emissions from aquatic systems: natural emissions and anthropogenic effects. Chemosphere Glob. Change Sci. 2, 267–279. doi: 10.1016/S1465-9972(00)00015-5
Seitzinger, S. P., and Nixon, S. W. (1985). Eutrophication and the rate of denitrification and N2O production in coastal marine sediments. Limnol. Oceanogr. 30, 1332–1339. doi: 10.4319/lo.1985.30.6.1332
Seitzinger, S. P., Nixon, S. W., and Pilson, M. E. (1984). Denitrification and nitrous oxide production in a coastal marine ecosystem. Limnol. Oceanogr. 29, 73–83. doi: 10.4319/lo.1984.29.1.0073
Shoun, H., Kim, D.-H., Uchiyama, H., and Sugiyama, J. (1992). Denitrification by fungi. FEMS Microbiol. Lett. 94, 277–281. doi: 10.1111/j.1574-6968.1992.tb05331.x
Solorzano, L. (1969). Determination of ammonia in natural waters by the phenolypochlorite method. Limnol. Oceanogr. 14, 799–801. doi: 10.4319/lo.1969.14.5.0799
Sørensen, J., Tiedje, J. M., and Firestone, R. B. (1980). Inhibition by sulfide of nitric and nitrous oxide reduction by denitrifying Pseudomonas fluorescens. Appl. Environ. Microbiol. 39, 105–108.
Sugawara, K., Koyama, T., and Kamata, E. (1957). Recovery of precipitated phosphate from lake muds related to sulfate reduction. J. Earth Sci. Nagoya Univ. 5, 60–67.
Tukey, J. W. (1949). Comparing individual means in the analysis of variance. Biometrics 5, 99–114. doi: 10.2307/3001913
Vadstein, O. (2000). “Heterotrophic, planktonic bacteria and cycling of phosphorus: phosphorus requirements, competitive ability, and food web interactions,” in Advances in Microbial Ecology, ed B. Schink (New York, NY: Kluwer Academic/Plenum Publishers), 115–167. doi: 10.1007/978-1-4615-4187-5_4
Vadstein, O., and Olsen, Y. (1989). Chemical composition and phosphate uptake kinetics of limnetic bacterial communities cultured in chemostats under phosphorus limitation. Limnol. Oceanogr. 34, 939–946. doi: 10.4319/lo.1989.34.5.0939
Vieillard, A. M., and Fulweiler, R. W. (2012). Impacts of long-term fertilization on salt marsh tidal creek benthic nutrient and N2 gas fluxes. Mar. Ecol. Prog. Ser. 471, 11–22. doi: 10.3354/meps10013
Vieillard, A. M., and Fulweiler, R. W. (2014). Tidal pulsing alters nitrous oxide fluxes in a temperate intertidal mudflat. Ecology 95, 1960–1971. doi: 10.1890/13-1333.1
Weiss, R. F., and Price, B. A. (1980). Nitrous oxide solubility in water and seawater. Mar. Chem. 8, 347–359. doi: 10.1016/0304-4203(80)90024-9
Wrage, N., Velthof, G. L., Van Beusichem, M. L., and Oenema, O. (2001). Role of nitrifier denitrification in the production of nitrous oxide. Soil Biol. Biochem. 33, 1723–1732. doi: 10.1016/S0038-0717(01)00096-7
Yamagishi, H., Westley, M. B., Popp, B. N., Toyoda, S., Yoshida, N., Watanabe, S., et al. (2007). Role of nitrification and denitrification on the nitrous oxide cycle in the Eastern tropical North Pacific and Gulf of California. J. Geophys. Res. Oceans (1978–2012) 112:G02015. doi: 10.1029/2006JG000227
Yoshida, N., Hattori, A., Saino, T., Matsuo, S., and Wada, E. (1984). 15N/14N ratio of dissolved N2O in the Eastern tropical Pacific Ocean. Nature 307, 442–444. doi: 10.1038/307442a0
Yoshinari, T., Altabet, M. A., Naqvi, S., Codispoti, L., Jayakumar, A., Kuhland, M., et al. (1997). Nitrogen and oxygen isotopic composition of N2O from suboxic waters of the Eastern tropical North Pacific and the Arabian Sea—Measurement by continuous-flow isotope-ratio monitoring. Mar. Chem. 56, 253–264. doi: 10.1016/S0304-4203(96)00073-4
Keywords: nitrous oxide, greenhouse gas, sediment biogeochemistry, coastal ecosystem, estuary
Citation: Foster SQ and Fulweiler RW (2016) Sediment Nitrous Oxide Fluxes Are Dominated by Uptake in a Temperate Estuary. Front. Mar. Sci. 3:40. doi: 10.3389/fmars.2016.00040
Received: 19 December 2015; Accepted: 14 March 2016;
Published: 31 March 2016.
Edited by:
Christos Dimitrios Arvanitidis, Hellenic Centre for Marine Research, GreeceReviewed by:
Mario Barletta, Federal University of Pernambuco State, BrazilNafsika Papageorgiou, Hellenic Centre for Marine Research, Greece
Manolis Tsapakis, Hellenic Centre for Marine Research, Greece
Copyright © 2016 Foster and Fulweiler. This is an open-access article distributed under the terms of the Creative Commons Attribution License (CC BY). The use, distribution or reproduction in other forums is permitted, provided the original author(s) or licensor are credited and that the original publication in this journal is cited, in accordance with accepted academic practice. No use, distribution or reproduction is permitted which does not comply with these terms.
*Correspondence: Sarah Q. Foster, sqfoster@bu.edu