Assessing Future Flood Hazards for Adaptation Planning in a Northern European Coastal Community
 Carlo Sorensen1,2*
  Niels H. Broge3
  Mads R. Molgaard4
  Charlotte S. Schow5
  Peter Thomsen5
  Karsten Vognsen3
  Per Knudsen1
- 1DTU Space, Department of Geodesy, Technical University of Denmark, Kongens Lyngby, Denmark
- 2Coast and Climate, Danish Coastal Authority, Lemvig, Denmark
- 3Danish Geodata Agency, Copenhagen, Denmark
- 4Geo, Kongens Lyngby, Denmark
- 5Ramboll, Viborg, Denmark
From a transdisciplinary approach in the town of Thyboron, Denmark, we investigate couplings between sea state (i.e., mean and extreme) and flooding hazards today and ahead. This includes analyses of change and variability in the groundwater table, precipitation, land motion, geotechnical ground properties, sewerage systems and other infrastructure to outline a more complete platform for the integration of knowledge into climate adaptation schemes at this highly vulnerable coastal location. It involves the engagement of the main stakeholders who, although having different responsibilities, interests, needs of knowledge and data, and different timeframes for investment and planning, must join in a common appraisal of the challenges faced ahead to provide for better adaptation measures. Apart from obvious adverse effects from future storm surge events, knowledge about the coupled effects of the abovementioned parameters needs to be taken into account to reach optimal mitigation and adaptation measures. Through stakeholder interviews it becomes clear that an enhanced focus on transdisciplinary research is a viable way forward to develop such measures: it will bring in more knowledge, a broader scope, and it will provide for more holistic solutions that both serve to protect the town and allow for business development and better municipal planning ahead.
Introduction
The future impact of climate change to people and the environment in coastal regions due to floods, inundation and erosion is substantial (Nicholls et al., 2007; IPCC, 2012). Furthermore, the groundwater table may be affected on varying time scales as may ground stability and the overall morphodynamics off the coastal locations. Climate research has advanced our knowledge of current and potential future sea level changes at global and regional scales (IPCC, 2013; Grinsted et al., 2015), of extreme water levels (Arns et al., 2015), natural variability and the anthropogenic footprint in sea level (Dangendorf et al., 2015), and of methods to evaluate sea level change from satellite (Nerem et al., 2010) and tide gauge data (Wahl et al., 2013; Visser et al., 2015; Watson, 2015).
Knowledge of climate change effects on society is in many ways still fragmented regarding approaches to adaptation, however. Updates on sea level rise projections and real-time monitoring of change need better integration in planning tools, and consequences should be looked at in a more holistic way. For several reasons gaps exist between scientific knowledge and societal measures to mitigate climate change effects: First, the translation of climate change evidence to concrete impact measures is difficult. Second, the dissemination of uncertainty in projections and climate scenarios is certainly not a “one size fits all.” Depending on the user, the information on uncertainty must be transformed to concrete impact variables used for e.g., adaptation and mitigation. Third, different and shifting agendas and opinions across levels of governance challenge the ways we address, perceive, and act on climate change issues in society. In order to bridge gaps, we thus need to address the translation of climate change parameters like sea level rise (SLR) and extreme events to actual effect measures; we must evaluate other contributors affecting climate change impact in time and space, and we must consider the stakeholders that may be affected as well as the actual assets that become threatened.
Many studies deal with current and future coastal hazards, exposure and vulnerability, risk and risk reduction on global (e.g., Nicholls, 1995; Hallegatte et al., 2013), regional (e.g., Du et al., 2013; Gibbs, 2015; Kuklicke and Demeritt, 2016) or local scales (e.g., Hallegatte et al., 2011; Kortenhaus and Oumeraci, 2014) that use different methodologies and modeling practices (Bosello and De Cian, 2014; Gallina et al., 2016; Nguyen et al., 2016). Often the research shows that a comparison between locations (or methodologies) is difficult as “the impacts of climate change on the coastal zone are expected to be largely site specific, due to the influence of local factors” (Linham and Nicholls, 2010). In relation to climate change adaptation the conclusion may even be that “coastal communities are unique and defy generalization” (Lane et al., 2015).
The quantification of potential hazards from climate change is governed by uncertainty and simplified assumptions about the impacts, and this affects the calculated exposure, vulnerability and risk of the area of investigation. Through independent and interdependent natural processes and potential interactions from multiple hazards—that may act differently through space and time, climate change impact studies gain complexity. In Denmark, for instance, flood risk mapping of the EU Flood Directive (EU, 2007; DCA, 2013a) uses a source-pathway-receptor approach with simplified assumptions made regarding the hazards and pathway of potential flooding. Also, a multitude of local national flood studies, typically carried out by consulting companies, tend to be “off the shelf” work that only look into one source of flooding (i.e., either sea floods, precipitation and runoff, or, the sewerage system) depending on the contracting entity. This often causes the decision-making process regarding mitigation measures to be uncoordinated between sectors and local governance administrations which lead to suboptimal solutions.
The starting point of the present study is to investigate couplings between sea state (mean and extremes) and flooding hazards today and ahead for a small coastal community in Denmark. We seek to include land motion, precipitation, geology, geotechnical properties, the sewerage system, and changes in groundwater level to reveal a more detailed picture of the climate impact. Through interviews with main stakeholders we investigate their roles, responsibilities and incitements to act. From this we discuss the added value of using existing data together with ongoing and future data provision for climate adaptation, and we address the diversified needs for knowledge and tools among the stakeholders. In doing so, we move from a cross-disciplinary scientific platform to a transdisciplinary research approach (using the definition by Jahn et al., 2012, pp. 8–9) to address local future practice-oriented adaptation collaboration where “transdisciplinarity is a gradual process of conceptual and methodological articulation” (Visser, 2001).
As such, we present ongoing research and also include data and preliminary results that may become focal points of collaboration between stakeholders. Not all scientific aspects are treated in detail and the paper rather addresses general links between disciplines, and it provides an overview of locally coupled climate change impact factors that may prove useful to advance climate change research and adaptation. The main research focus is thus on the identified coastal hazards to provide managers and decision-makers with a more complete common platform for the integration of knowledge in climate adaptation and planning.
Data and Methods
History is an important but often neglected factor to the understanding of current and future hazards. As such, potentially important knowledge about an area may not be included in adaptation planning. We start by providing a fairly detailed historical overview of the area of interest, thereby also identifying hazards not included in the present study and factors that affect the future impact from climate change—apart from climate change itself. We then proceed to present the legislative framework and main stakeholders, and the methods applied dealing with land motion, sea state, groundwater, geological and geotechnical modeling, and hydrological modeling in relation to coastal hazards.
The Study Area
The town of Thyboron (population 2015: 2104), Figure 1; belongs to the Lemvig Municipality. A breach of the sandy barrier during a storm surge in 1862 led to the formation of Thyboron Channel. Since 1900 the channel has been maintained by groins along the channel banks and on the North Sea coast north and south of the channel, respectively (Sorensen et al., 1996; Knudsen et al., 2011). The coastal protection works and opening of a harbor in 1914 led to population growth. From the 1930s the ongoing coastal erosion, and doubts about whether it was possible protect the town, led the Danish Parliament to pass an act to close the Thyboron Channel with large dams and a sluice (MPW, 1942; DP, 1946). Dams were built on the fjord side of the barriers both north and south of the channel, but the decision to close the channel and the scientific reasoning for doing so was soon disputed (Bruun, 1954; MPW, 1968) and in 1970 a decision was made to maintain an open channel and let the Danish Coastal Authority monitor the evolution (DP, 1970; DCA, 1975).
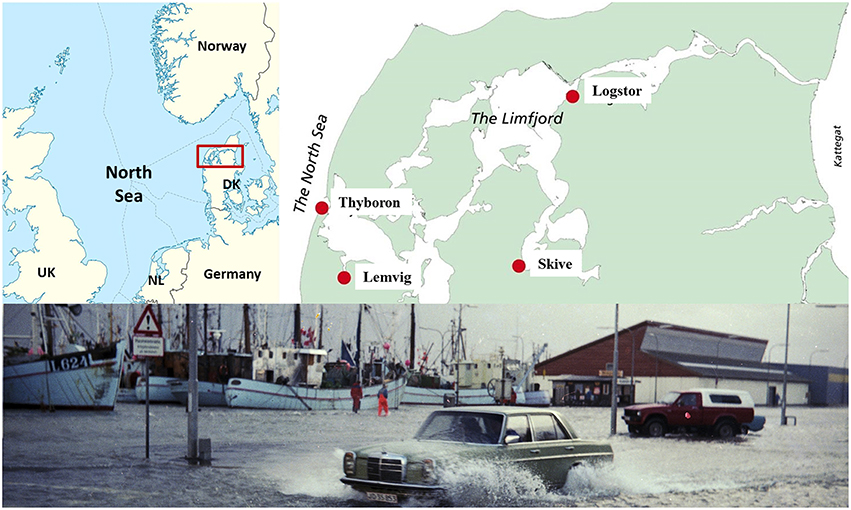
Figure 1. Study area. The Danish town of Thyboron is located on the eastern North Sea coast and hosts a large harbor by the Thyboron Channel that connects the North Sea and the Limfjord. The town has experienced several minor floods like in 1981 (Photo: Thyboron-Harboore-Engbjerg Local Archive).
The “Thyboron question” is still controversial, however (e.g., Larsen and Beck, 2009; Norgaard et al., 2014). An expanding channel cross section (Bruun and Gerritsen, 1960; Knudsen et al., 2011) leads to increased water transport into and higher surge levels in the fjord during storms. Between 1958 and 2005 a statistical 100-year extreme water level in the town of Lemvig has increased from 1.73 to 1.99 m DVR90, and it is expected to increase further to 2.38 m DVR90 by 2060 excluding effects of sea level rise, if the channel is allowed to develop naturally (Christensen, 2011a,b; Knudsen et al., 2012; Sorensen et al., 2013). All heights refer to the Danish Datum DVR90 which corresponds to Danish mean sea level around 1990 (Schmidt, 2000) unless otherwise stated. The Danish Coastal Authority has sketched several possible solutions to mitigate future storm surge levels inside the fjord (Ingvardsen et al., 2012) but no efforts have been made toward reaching a solution. The decision (or lack of such) on how to handle Thyboron Channel is a large, unknown factor in flood protection and adaptation planning in Thyboron and other communities located at the shores of the Limfjord.
A large sea dike and a transverse dike toward south protect Thyboron against flooding from the North Sea for a 1000 year storm surge event according to the Danish Coastal Authority, who is in charge of the coastal protection along the 110 km central part of the Danish North Sea coast (DCA, 2013b). Lemvig Municipality is in charge of protection against floods from the channel and fjord. Coastal erosion challenges (Jensen and Sorensen, 2008; DCA, 2013b) and dike strength assessments are not within the scope of this paper but are, of course, important in relation to the future safety of Thyboron. Today, sand nourishments on the North Sea coast are used for protection.
A small part of Thyboron, locally known as “old town,” in the south-west dates back to the nineteenth century and is the remnant of the pre-1862 settlement not lost to coastal erosion (see Sorensen, 2015a). Aerial photography provides a visual impression of town growth, Figure 2. The road and railway track to Thyboron are both toward west in 1945—just east of the “dike trenches” seen as dark patches in the lower left of the photo. Most houses are situated between the main road and the North Sea, and houses and infrastructure have been built in connection with the port. In the 1950s, the large dam/dike is being finalized in conjunction with a new road and railway along the fjord to the east. In Thyboron, an area between the railway and the road shows marshlands to the west and shallow water with deeper parts draining under the road to the fjord. The very light-colored appearance of the town is indicative of a very sandy environment. In 1965 the harbor is expanding and the north-east part of the town has developed. In addition, a new development is forming on sandy landfill on the aforementioned marshland (middle of photo). Gradually, between 1965 and 1992 the town development continues in this area in 4–5 major stages and with the local heating plant in the south-eastern most part opening in late 1992. Since 1992 the development has slowed down and the largest changes are witnessed in the north-west corner of the town and in connection with the harbor. A harbor expansion is currently being developed on new landfill areas southeast of the area shown.
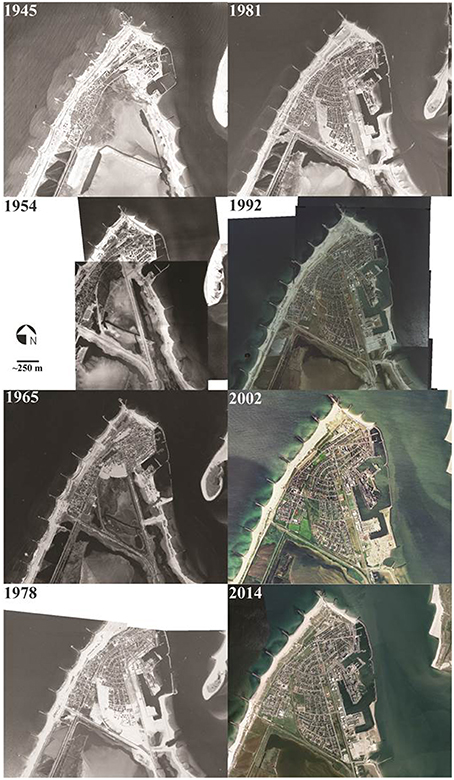
Figure 2. Aerial photography of Thyboron covering the period 1945–2014. Sources: arealinformation.miljoeportal.dk (I-GIS 1945; DDO®, © COWI 1954, 2002, 2014), flyfotoarkivet.dk (© Geomidt/Lemvig Municipality 1965, 1978, 1981, 1992).
Governance and Main Stakeholder Interviews
Denmark has three levels of governance: national, regional (5 regions) and local (98 municipalities). Regions have a small role in facilitating climate adaptation and mitigation processes. The European Union plays a role at the coast e.g., through the implementation of the Floods Directive in member states (EU, 2007). The Danish Coastal Protection Act (MT, 2009) is one of several laws regulating the coastal zone (see Figure 15 in Sorensen, 2015b). Through national legislation passed (DP, 2012a,b) the Danish municipalities have made climate adaptation plans and are in the process of preparing measures to mitigate future events. The plans only focus on water related issues and with a strong emphasis on flash floods, however. The Lemvig Municipality adaptation plan points out Thyboron as a focus area (Lemvig Municipality, 2014) and, although initially unrelated to the municipal work, the present research relates to the challenges faced by the municipality and other stakeholders to address coastal hazards in their adaptation planning.
The Port of Thyboron, Lemvig Municipality, Lemvig Water and Wastewater, and the Danish Coastal Authority (DCA) are identified as the four main stakeholders in relation to climate change adaptation in Thyboron. The local population is not considered in the present study. The institutions have formal responsibilities and are all a part of a political system governed by legislation and rules. Although, the Port of Thyboron and Lemvig Water and Wastewater (LWW) both operate as independent corporations, they are either owned entirely or partly by and have board members from Lemvig Municipality. The municipality itself follows strict rules regarding their expenditure, and the Danish Coastal Authority needs to act according to national legislation with reference to the Minister for the Environment and Food. As mentioned the Danish Coastal Authority is responsible for the flood protection toward the North Sea. Lemvig Municipality is responsible for the flood protection toward the Thyboron Channel and the fjord, or, at least the Danish Coastal Authority is not.
Semi-structured interviews were held in September 2015 with Port of Thyboron Director, Mr. Jesper Holt Jensen, and Technical Director, Mr. Christian Vrist; the Director at Lemvig Water & Wastewater Inc., Mr. Lars Noergaard Holmegaard; the Head of Nature and Environment Department at Lemvig Municipality, Mr. Thomas Damgaard, and Danish Coastal Authority Director Ms. Merete Loevschall. Interviews were held in Danish and an English translation of the interview summaries enters the research.
The scope of the interviews was to bring out opinions and reflections on the current level of preparedness in relation to coastal floods (from all sources); positions in relation to current legislation; potential future or already planned actions in relation to climate change adaptation; collaboration issues, and the need of information regarding climate change and e.g., data and tools for adaptation. Previous to the interviews the stakeholders were consulted in late 2014 for the provision of data relevant to the study presented. In the course of research Lemvig Municipality has provided spatial data from house registers etc. and local knowledge, and Lemvig Water and Wastewater has financed the groundwater monitoring setup.
Although, potentially biased from knowledge of and varying interests in the ongoing research by the stakeholders, the information provided and main learnings from the interviews are included to discuss the concrete use and integration of research and data in adaptation planning.
Ethics Statement
The scientific data use fulfills the Danish Ethical legislation as authorized in writing by the responsible institution Legal Affairs at the Technical University of Denmark (DTU), 15 April 2016, regarding the legal and ethical handling of personal data. The Data Protection Act implementing Directive 95/46 was passed on in Law no. 429 of 31/05/2000. The Act faithfully transposes the provisions of the EC Directive into Danish law. The University (DTU) follows the Danish Statutory Order on Security on Data processing of Personal data, no. 528 of 15/06/2000 when processing Personal Data. According to § 10.2 in The Danish Statutory Order on Security on Data processing of Personal data, public universities may handle personal data without the permission from the subject (person) where the processing takes place for the sole purpose of carrying out statistical or scientific studies of significant public importance and where such processing is necessary to carry out these studies.
Ground Deformation and Topography
The NE part of Denmark experiences larger absolute national scale glacio-isostatic uplift rates than SW (Mertz, 1924; Duun-Christensen, 1990). Several studies deal with surface deformation on regional and local scale in Denmark due to sedimentary processes and tectonics (Andersen et al., 1996; Lykke-Andersen and Borre, 2000; Hanssen and Perski, 2007; Gregersen and Voss, 2010, 2015; Pedersen et al., 2011; Hansen et al., 2012; Jakobsen et al., 2013). In European collaboration projects (PanGeoProject.eu; SubCoast.eu; Terrafirma.eu.com, and Absrate, Knudsen et al., 2009) Danish issues of coastal hazards from land subsidence have been addressed. Here, we investigate the local pattern of vertical ground movement from a combination of methods to relate it to climate change impact.
Glacio-Isostatic Uplift
The glacio-isostatic land uplift rates within the study area, and for Denmark in general, are found from uplift model calculations (Knudsen et al., Supplementary Material 1 [S1]) related to the Milne et al. (2004) uplift model, three national leveling campaigns over the past century, long tide gauge series (Holgate et al., 2013; Permanent Service for Mean Sea Level, 2015), and to vertical deformation rates from permanent GPS station data in Denmark (Khan, 2014). The model is used to evaluate the overall rates of land uplift currently experienced.
Precision Leveling
Repeated motorized, geometric precision leveling (Vognsen et al., 2013a,b) to a few existing and +60 newly established height benchmarks, typically bolts, along the Limfjord Barriers and in Thyboron was carried out in 2006, 2009, 2012, and 2015, respectively, Figure 3. Across the Thyboron Channel, the height determination is carried out in relation to the geometric leveling by simultaneous-reciprocal trigonometric leveling under favorable weather conditions. All campaigns were carried out in late summer/early autumn of the corresponding year. Leveling was performed between two assumedly stable benchmarks north and south of the barriers, respectively, and with the northern benchmark kept at a fixed height (Id. 72-12-9021; determined in 1995). Differences in the calculated heights at the southern benchmark (Id. 125-06-9026; determined 2006) between individual leveling campaigns, which is ascribed to small differences in general glacio-isostatic land uplift between the two points, are small and within the allowed uncertainty for the individual leveling campaigns. Therefore, no subsequent corrections of individual benchmarks are made, and the uncertainty in their height determination over this 9 year period is evaluated at ±0.003 m (Vognsen et al., 2013b). Ahead, however, a recalculation of the benchmark heights covering the area should be performed when either point is connected to the national leveling network again. Older leveling data were digitized, recalculated, transformed from the former Danish Ordnance Datum (DNN) to DVR90, and quality assessed for calculations of vertical velocities extending back in time.
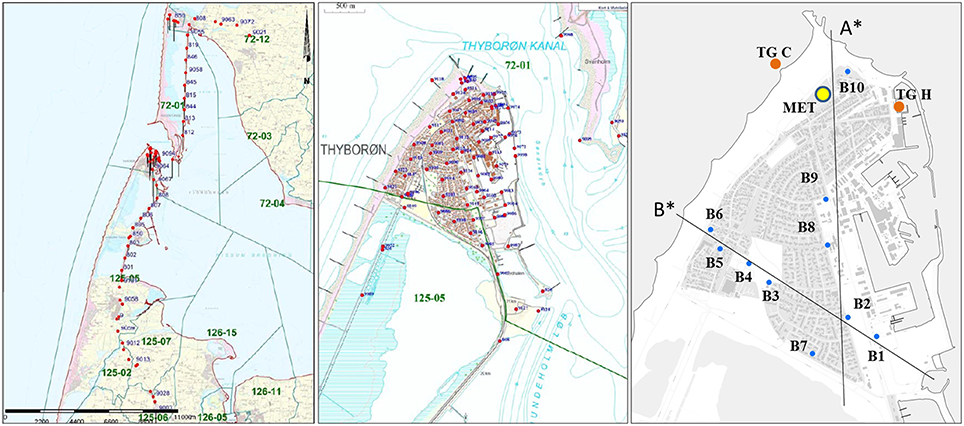
Figure 3. Benchmarks along the Limfjord barrier (left) between Vestervig Church (NE) and Hove Church (S) and a zoom-in on Thyboron (middle). Groundwater monitoring (B1–B10), tide gauge (TG C & TG H) and meteorological (MET) station positions are plotted (right) together with lines (A*, B*) along which groundwater stations are approximately aligned.
Elevation of Sewers
In 2012, elevations of the bottom of the sewers were measured beneath man-hole covers at 57 accessible locations to compare these with elevations measured between 1980 and 1990 (in parts of Thyboron this was not possible due to floating manhole covers that could not readily be removed). So far, it has not been possible to date the older measurements more precisely. The uncertainty in the 2012 height determination is evaluated to be better than ± 0.013 m; refer to Vognsen et al. (2013b) for more information on methods. The 1980–1990 measurements are believed to represent the bottom level of sewers well although the uncertainty is unknown and probably somewhat larger.
Land Motion from Satellite Interferometry
Imagery from the ERS radar satellite has been used as an alternative method to reveal land deformation at Thyboron. The methodology is based on analysis of time series of co-registered radar satellite images known as persistent scatterer interferometry, PSI (Ferretti et al., 2007). The method has been applied to monitor land deformation from a number of geo-hazards like landslides, earthquakes, volcanism, and coastal flooding.
In the present study time series of ERS radar images from 1995 to 2001 [ERS SAR: Track 108, frame 2457: 48 scenes (period: 1995–2001)] were collected by courtesy of the European Space Agency (Levinsen et al., 2015). The images were acquired and processed by the Geological Survey of Norway. After a detailed quality assessment of the results, a threshold measure of 0.55 is set on the “coherence” parameter, which is a measure of reliability of each PSI point with a calculated vertical velocity. Although, newer satellite imagery is desirable, this has not been possible due to lack of coverage, data series not being sufficiently available for calculations, or, due to inhibitive costs for inclusion in the present study. No subdivision of the PSI data set has been attempted and the data thus provides information about the averaged relative rates of vertical land deformation 1995–2001 in Thyboron relative to a point near the northern benchmark mentioned above for the leveling. Thus, the PSI calculated vertical velocities do not include the contribution from the glacial isostatic adjustment.
Digital Terrain Model
The Digital Terrain Model (DTM) from the Danish 2007 Digital Elevation Model (DK-DEM) used throughout this study has a 1.6 * 1.6 m resolution, a horizontal accuracy of 0.67 m RMSE and an averaged vertical accuracy of 0.059 m RMSE (Hawa et al., 2011; Rosenkranz and Frederiksen, 2011). Data are available free of charge through the Danish “basic data program” (eng.gst.dk). In addition to the DTM (DK-DEM), a hydrological adaptation layer has been produced and is also available for download. A stretch of quay that has been heightened by 0.5 m since the acquisition of the DEM is not included but is unlikely to affect the overall results. According to Thyboron Port Authorities and confirmed in our own investigations, the new quay height corresponds well to the initial height when the original quay was constructed approximately 50 years ago indicating land subsidence rates in the order of 10 mm/year.
Tide Gauge Data and Sea State
Two continuous tide gauge (TG) digital data series exist for Thyboron and are operated by the Danish Coastal Authority. Thyboron Harbor TG (Id: 4201; from 1974) is in the northern part of the harbor, and Thyboron Coast TG (Id: 4203; from 1975) is placed in a groin on the open coast, Figure 3. In addition, analog data exist back to c. 1935 for the harbor TG but still await digitization. Historical extreme water levels and storm events have been digitized in the past. No systematic metadata have been collected and kept for the central Danish North Sea West Coast TGs and data series (service & maintenance, benchmark and water level corrections etc.) and no concise manual for their operation exists. Correction of data, services, and benchmark leveling has been performed in the past, however, and can be traced in the data series (e.g., linear corrections in time and datum shifts). From a close manual scrutiny of the data, the TG series (1975–2012) have been corrected and validated as far as possible, e.g., by recalculating of the TG benchmarks and omitting erroneous data. Furthermore, tide gauge data from the Limfjord are available from a number of stations. 2015 TG measurements are used in relation to the groundwater level observations. Regarding extreme water levels and statistics, numbers are adopted from Sorensen et al. (2013).
Groundwater and Precipitation Data
Ten stations measuring the groundwater level in Thyboron were established in august 2015, Figure 3. Their current spatial distribution reflects a plan to monitor variations N-S and W-E, interests in certain areas in the town, and that the deployment should be on municipal land. Although covering a mere 3 months only, the data logging in 5 min intervals are included to, at least, discuss their potential value ahead in assessing climate impacts in Thyboron. The measured groundwater levels are related to DVR90 from GPS measurements at time of deployment and validated in the DTM. Precipitation is measured in Thyboron (10 min intervals) and is cumulated on a daily basis. Wind is also recorded but these data are not used in the present study (Id: 4200).
Geological Modeling and Geotechnical Data
A geological model is a spatial representation of the local subsurface conditions and its quality depends on the accuracy and availability of geological information. A geological model rarely accounts for the entire geology of an area but it can focus on specific layers such as the shallow geology or the pre-Quaternary conditions (Binzer and Stockmarr, 1994; Nielsen et al., 2007). We use standard methods (Jorgensen et al., 2008; Sandersen, 2008) to define layers which potentially play a role for land subsidence in Thyboron, and to preliminarily discuss issues related to the groundwater level and coastal hazards. These layers are generated in GeoScene3D (I-GIS, 2015) accordingly and appear as continuous near-surface layers (0–30 m depth) in the resultant geological model.
Incorporation of Data
Various subsurface information from public and private archives, such as geological (Geo, 2015; GEUS, 2015a), geophysical (GEUS, 2015b), hydrological (GEUS, 2015c,d), and geotechnical data (Geo, 2015) are integrated into the model. A combination of these data can considerably increase the model's accuracy. The local geological knowledge primarily results from public and private well data as well as from a soil map of the upper 1 m (GEUS, 2015e), where according to Jakobsen et al. (2015) the Thyboron area is among the 10% of the country which is still not included in the map. Geophysical information for the area exists in the form of DUALEM-421s data collected in the framework of this study. No additional geophysical data have been located except for a single geophysical log in well no. 44.571 located SE of Thyboron (Petersen et al., 2008). Hydrologic data are from groundwater level measurements, hydraulic tests in wells and from a groundwater mapping campaign previously conducted in the area.
Digitization of Borehole Logs
A review of the Geo (2015) geotechnical archive located +200 geotechnical boreholes, all of which are geo-referenced based on the old site plans and digitized based on the old borehole reports to enter the GeoGIS database. The boreholes were mainly conducted in relation to construction works and, unlike most of the publicly available drilling from Thyboron (GEUS, 2015a), contain a high level of detail that describes the geological and geotechnical parameters such as water content and strength; e.g., Geoteknisk Institut (1978) and Geoteknisk Institut (1983), Figure S1. Groundwater levels are often registered, too, if established below the groundwater level. The Geo (2015) geotechnical boreholes are mainly concentrated in the eastern and southern part of the town facing the harbor and are not evenly distributed. At the same time, the exact location of the boreholes from the old site plans is uncertain. By combining this data set with boreholes from the GEUS (2015a) database, although in less detail, it seems possible to achieve a fairly good coverage in major areas of the town, Figure 4. The model of the geological conditions is expected to be more accurate around the harbor, however.
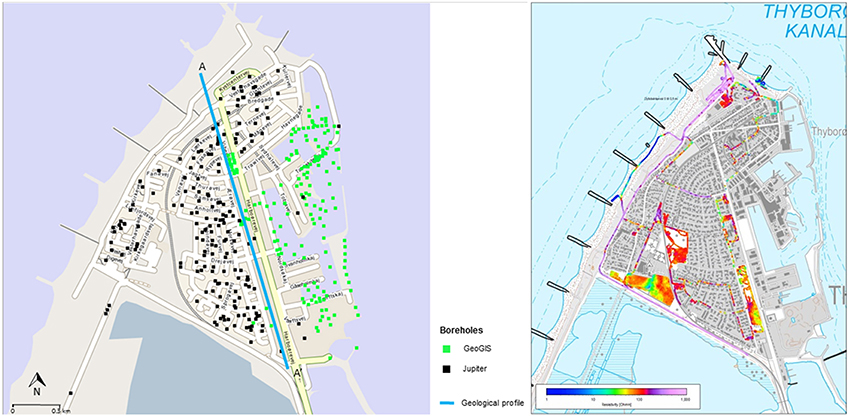
Figure 4. Available subsurface data for Thyboron. The green dots indicate wells from Geo's well database and black dots show wells available from the public Jupiter database. The blue line indicates the position of the geological profile A-A′. DUALEM-421s data coverage is exemplified by resistivity measurements at 1–1.5 m depth (right).
Geophysical Data (DUALEM-421s)
Geophysical data were collected in Thyboron during May 2015. The ground conductivity meter DUALEM-421s was applied for detailed mapping of the electrical resistivity of the upper 6 meters of the ground. Data have been collected at all available green areas, parking lots and on some roads with the DUALEM-421s deployed to an ATV (max. speed 30 km/h) with simultaneous video and GPS recordings. Data is inverted using a constrained multi-layer model (Vignoli et al., 2015). Figure 4 shows the inverted resistivity in depth interval 1–1.5 m. Green colors indicate clay, whereas red and purple colors indicate the presence of more coarse sediments like sand and gravel. The results from the DUALEM-421s survey will together with borehole information represent data input for the geology of the upper few meters of the soil.
Hydrologic Flow Modeling
To gain insights about hydrological conditions in Thyboron today as well as in the future modeling is performed using the MIKE software (dhigroup.com). MIKE FLOOD couples the models MIKE URBAN and MIKE 21. MIKE URBAN is a hydraulic 1D-model used to simulate the flow and thereby stowage levels in the sewers. The calculation in MIKE URBAN is divided into two parts: first the runoff on terrain and thereby hydrography (flow over time) which runs into the individual wells in the sewer system is calculated. Secondly, the flow and backflow into sewers, wells, sump pumps, water outlet drains, basins etc. are calculated. A detailed digital mapping of the sewer system was kindly provided by the Lemvig Water and Wastewater Company and used in the model. Connecting this 1D calculation with 2D calculations in MIKE 21 via MIKE FLOOD water stowage from the sewers can propagate across the terrain indicated to the model by the aforementioned DTM including the hydrological adaptation layer. Thereby MIKE FLOOD calculates dynamic flood levels at any given precipitation event. Similarly, storm surge events are modeled. The results indicate a potential flood from various scenarios, sources, and durations by showing the maximum water depth in each cell (1.6 * 1.6 m) of the DTM/DK-DEM. This may not necessarily occur simultaneously, however, and results thus show maximum potential flooding.
Hydrological conditions are calculated for the following precipitation events:
• 5 year rain event including climate factor; corresponding to the Danish operation practice precipitation for storm water sewers (IDA, 2005),
• 10 year rain event including climate factor; corresponding to the Danish operation practice precipitation for combined household and storm water sewers (IDA, 2005), and
• 100 year rain event including climate factor.
Values of rain intensity including a climate factor are adopted from Gregersen et al. (2014).
The combined effects of precipitation, land subsidence (projected from 2006 to 2012 leveling results and general uplift in the DEM) and sea level rise/extreme water levels have been calculated for various future scenarios, Table 1.
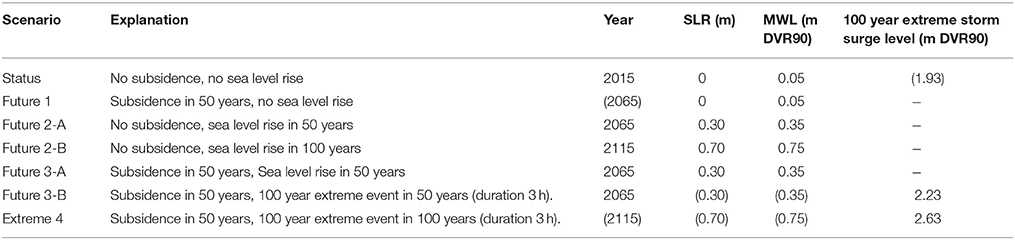
Table 1. Scenarios modeled in MIKE for a range of combinations of precipitation, sea level rise, and extreme water levels with and without land movement, and looking 50 and 100 years ahead.
Subsidence rates are assumed constant in time in the calculations. The sea level rise scenario is adopted from Grinsted (2015) and Olesen et al. (2014) and modified to 2065 and 2115, respectively. Extreme water levels are adopted from Sorensen et al. (2013) using the Thyboron Harbor statistics. Linearity in 100 year event extreme water levels with SLR is assumed and e.g., changes in climate conditions (storm frequency and intensity), tides, morphodynamic conditions, construction works etc. are not considered. The effect of wave overtopping on flooding is not considered in the present study. The 2015 mean water level (0.05 m) accounts for the relative SLR since determination of the DVR90 datum around 1990. The Thyboron tide gauge statistics are assumed to be representative of extreme water levels in the channel and fjord thus disregarding potential gradients in the extreme water levels along the coastline. Furthermore, considerably higher extreme storm surge levels on the North Sea coast, which may potentially lead to breaches of the sea dike, are not considered.
Results
Results from in situ and satellite measurements are presented and joined in modeling results. Main stakeholder interview results are briefly presented.
Water Levels
The central Danish North Sea coast TGs' data are of a varying quality, Figure 5, Figure S2. The Thyboron Coast TG data are not as complete as the Harbor TG and data quality is lower mainly due to the harsher physical environment and more difficult access. From around 1990 the Thyboron series show a good correlation to the long tide gauge series in Esbjerg and Hanstholm (from Hansen, 2013) in annual mean water levels, Figure S3. Calculated rates of change in mean water levels from linear regression, used only here to evaluate datum/benchmark corrections of the TG's, seem reasonable and within the expected range for Thyboron, Table S1. Results imply that the Thyboron TG's can be useful to regional sea level studies and, on the other hand, that the data represent well the overall measured annual mean sea level variations in the eastern North Sea over the past decades. Results from relevant regional sea level studies may thus be representative for consideration at Thyboron at the current stage of research. Especially in the Hvide Sande TG data apparent local land subsidence effects still need to be accounted for in a more thorough TG benchmark and leveling reanalysis, if possible. Considering the usefulness of the DK North Sea TGs, an effort should be made, in general, to upgrade TG maintenance, benchmarking, and data collection to international standards.
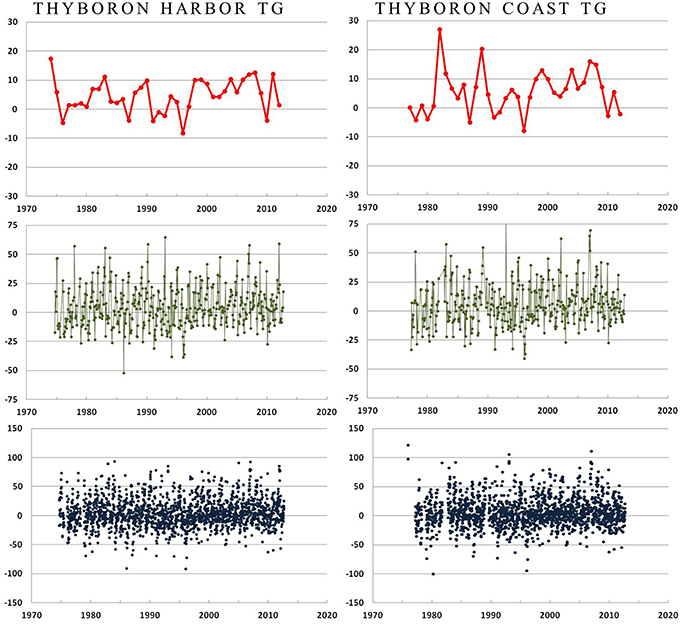
Figure 5. Yearly, monthly, and weekly means (top to bottom) water levels (in cm) at the two Thyboron tide gauges. Discrepancies between the series are mainly due to data quality issues and to local wave setup effects during storms at the coastal TG (Adopted from Sorensen et al., 2015).
Storm water levels can get significantly higher on the coast than in the harbor and Thyboron Channel and often with a strong gradient in water levels. In the vane of storms or after prolonged periods of windy conditions, the water level inside the fjord may be significantly higher than on the coast with a general water level in the fjord of c. 0.6–1.0 m DVR90, Figure S4. Regarding extreme water levels, a 100-year event at Thyboron Harbor is 1.93 m DVR90 (Thyboron Coast, 2.64 m) according to Sorensen et al. (2013) who also provide a list of the 40 highest water levels recorded. These show some variability in numbers and intensity over time at Thyboron Harbor, Figure S5.
Vertical Ground Motion
Observations of land deformation investigated from repeated benchmark leveling in 2006, 2009, 2012, and 2015 relative to an assumed stable point; from leveling the bottom of sewers in 1980/1900 and 2012, and from persistent scatterer interferometry (data from 1995 to 2001) all reveal the same pattern of subsidence, Figure 6, Figure S6. The subsidence rates of the bottom of sewers are up to 10 mm/year, from PSI up to 9 mm/year, and from leveling up to 7 mm/year, respectively, and results are thus consistent. Especially the independent results from PSI serve to validate the calculated leveling benchmark subsidence rates and vice versa. The two methods represent data acquired at different time periods points for the calculation of subsidence rates. Regarding PSI the measured rates of individual points are relative to the movement of a stable point that is only influenced by glacial uplift.
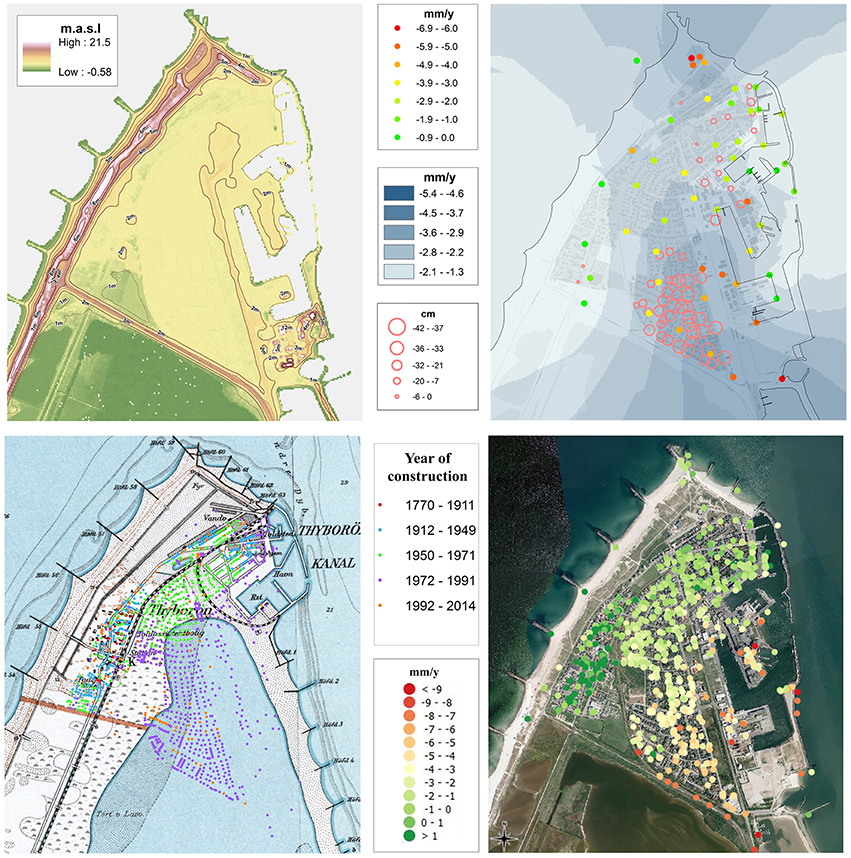
Figure 6. The DTM of Thyboron shows the high dikes and dunes toward the North Sea. Also, the road into Thyboron is elevated above the general land surface of the town at or below 2.0 m (top left). Repeated leveling of benchmarks (colored dots) show subsidence rates of 1–7 mm/year (2006–2015) and from ordinary kriging a small area toward N and a large area toward S experience large subsidence rates, whereas areas toward SW and N are relatively more stable. Also, the total change (1980/1990–2012) of the bottom of sewers (circles) shown a pattern that seems to closely resemble that from leveling (top right). A spatial-temporal analysis of constructions years (bottom left) shows that most houses built after 1971 (blue dots) are located on a former part of the fjord (map from c. 1930). PSI-results show the same pattern of subsidence where the SW part of town is stable and rates of subsidence are increasing from N toward SE with rates of up to 9 mm/year (1995–2001).
The PSI uncertainty is somewhat larger than from the leveling, but the spatial coverage (number of points measured) is larger and the risk of human error influencing calculations and thus the results is smaller. The separation in time points to the fact that subsidence is not a new phenomenon, and the subsidence does not seem to be restricted to individual buildings but is more widespread throughout the area (although differences may exist between building and ground subsidence rates). The apparent subsidence of the sewer system substantiates this. Also, there is a close connection between the year of construction of houses and infrastructure and rates of subsidence. This is, of course, not surprising considering the history of Thyboron (e.g., Figure 2). The area in SW which shows no/little sign of subsidence holds the oldest housing in town. Furthermore, the older parts of the harbor has probably been constructed on what was then believed to be the most stable location along the Thyboron Channel. Unfortunately, the digitization and investigation of historic leveling yielded little information that could be connected directly to the present study through “surviving” benchmarks. A few benchmarks have reliable results dating back to 1954, Figure S7, showing large subsidence rates on the then new-build dam north of Thyboron Channel, small but consistent subsidence rates of 1–2 mm/year in the more stable areas of Thyboron and on the Limfjord barrier, and stability north and south of the barrier, respectively.
The relative subsidence measured from leveling and PSI does not take into account the overall land movement from glacial effects. From the modeling an uplift value of +0.6 ± 0.2 mm/year is found for Thyboron and slightly more for the stable benchmark at Vestervig, Figure 7. Here, +0.8 mm/year is used and added in the hydrologic modeling to the subsidence rates measured from leveling at individual points (to yield slightly smaller subsidence rates than from leveling alone).
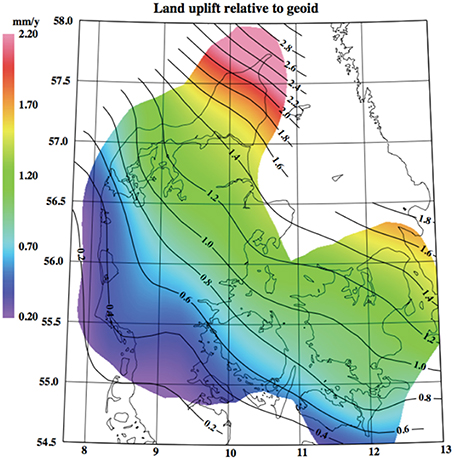
Figure 7. The calculated land uplift rates for Denmark relative to the geoid.
Geological Modeling
The geologic and geotechnical information are combined in the geological model. Results of the preliminary work to render all available geo-information are presented at an N-S profile (position is shown in Figure 4) in the eastern part of Thyboron, Figure 8. The surface is generally at an elevation of 1.6–2.0 m DVR90 and the upper three meters (+2 – −1 m) consist of landfill (incl. reworked marine sand). The marine sand fill may include layers or lenses of varying thickness of organic material that contains plant remains and root and wood fragments.
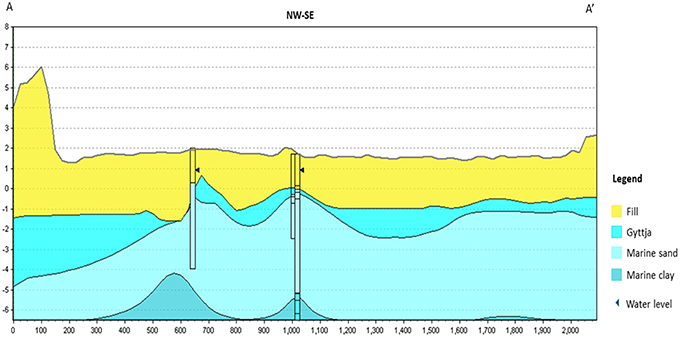
Figure 8. Geological profile A-A′ of the upper 7 m stretching from NW to SE (unit m on both axes). The geological profile includes wells from Geo's well database with a projection distance of less than 10 m. The blue triangle represents the water level observed in the wells.
Beneath the fill, a gyttja layer of a varying thickness (0.5–3.0 m) is found. Gyttja layers can be highly compressible. Below the gyttja is marine sand to −7 m, where marine clay is found. The model suggests that the surface of the marine sand and clay forms ridges, which may be interpreted as several former marsh areas; some shallower than others. Along parts of the profile results are enhanced by inclusion of the DUALEM-421s results for the upper 1–2 m, Figure S8 (as Figure 8 but showing DUALEM-421s results as well). The DUALEM-421s data, Figure S9, are difficult to interpret in most places due to the shallow groundwater level. The geophysical logging in well no. 44.571 SE of Thyboron (Petersen et al., 2008) indicates a high salinity in the groundwater. The DUALEM-421s resistivity measurements corroborate these findings but need verification from additional salinity measurements to e.g., map the salinity profile of the groundwater.
Hydrological Modeling and Groundwater
Although, covering less than 4 months (Aug 15–Nov 15), initial results from the 10 groundwater monitoring stations are included but do not offer sufficient data for a thorough analysis of the spatial-temporal variations in the groundwater level due to individual factors like ocean water level and waves, precipitation, temperature and saturation, infrastructure etc. Still, observations are worthy of an inspection following a dry period in October and a wet in November, Figure 9, including a minor storm event in late November with water levels of 1.5 m DVR90 in Thyboron Harbor. To separate effects from high (or low) water levels and wave run-up at the North Sea coast, and very high/low water level in the fjord, and in the sluice regulated lagoon south of Thyboron, more data is needed. Results show, however, that groundwater levels vary by at least up to 0.5 m in a few months, Figure 10, Figure S10. Also, at some locations along the profile lines and elsewhere the groundwater is likely to be present just below the ground surface. Whereas the average groundwater level is lowering toward south in profile A*, the picture is more unclear in profile B* and needs further investigation including effects from roads/railroad, sewers and drains etc. Some attenuation of the signal is apparent in B7. This may be due to the proximity to the sluice regulated lagoon experiencing smaller variations in water level. When longer coincident time series become available from the groundwater monitoring stations, from the Thyboron TGs, and from newly established gauges on either side of the sluice, groundwater level variations will be investigated further and the profiles integrated in the geological model as well as the hydrological model.
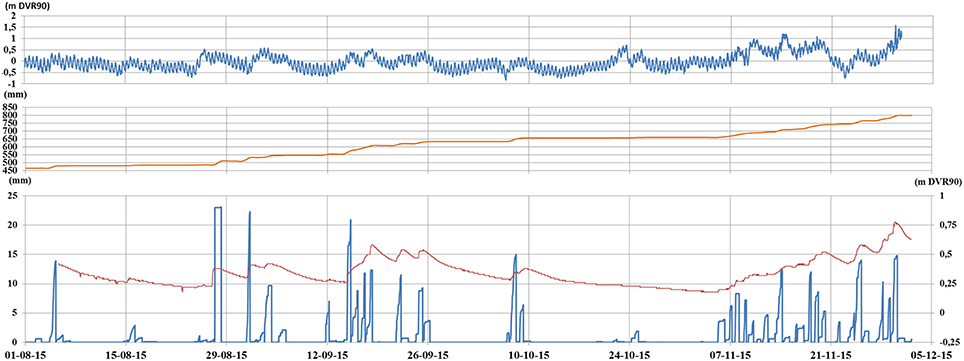
Figure 9. Water levels at Thyboron Harbor tide gauge (top), cumulated precipitation for 2015 at Thyboron (middle), and daily precipitation (bottom) showed together with groundwater levels in borehole B7 for the period 5 Aug–30 Nov 2015.
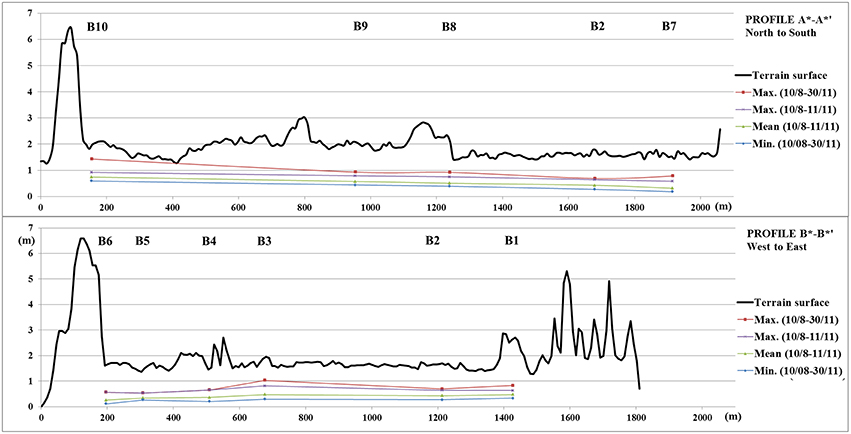
Figure 10. Groundwater level. Terrain profiles A*-A*′ (N-S) and B*-B*′ (W-E) with measured maximum, mean and minimum groundwater levels from the station data series plotted. Total measuring period 5 Aug–30 Nov 2015 but due to the lack of from B4 to B6 in November, the mean and maximum have been calculated for the period 10/8–11/11. Lines between the stations are only indicative of the groundwater levels between stations. To the left (N and W, respectively) in both profiles the c. 6 m high dike is seen. The “spikes” in profile A* toward E are mounds of sand and gravel.
In the MIKE modeling it is demonstrated that future subsidence will lead to an increased risk of flooding for both a 5 year and a 100 year precipitation event, Figure 11. As a result of the subsidence the sewer system will, and to some extent already does, experience stagnant water, sludge deposits, reversed slopes, and broken pipes leading to a dysfunctional sewer system accompanied with more frequent floods. Rainwater is pumped from the sewer and drainage system to the sea and a general rise in sea level has a minimal impact on the sewer ability to divert to recipients, whereas problems may occur during storm surges. As Thyboron is at the coast there is a clear relationship between groundwater and sea levels. Increased sea levels will lead to increased groundwater levels. This will increase the risk of seepage to leaking parts of the sewer system.
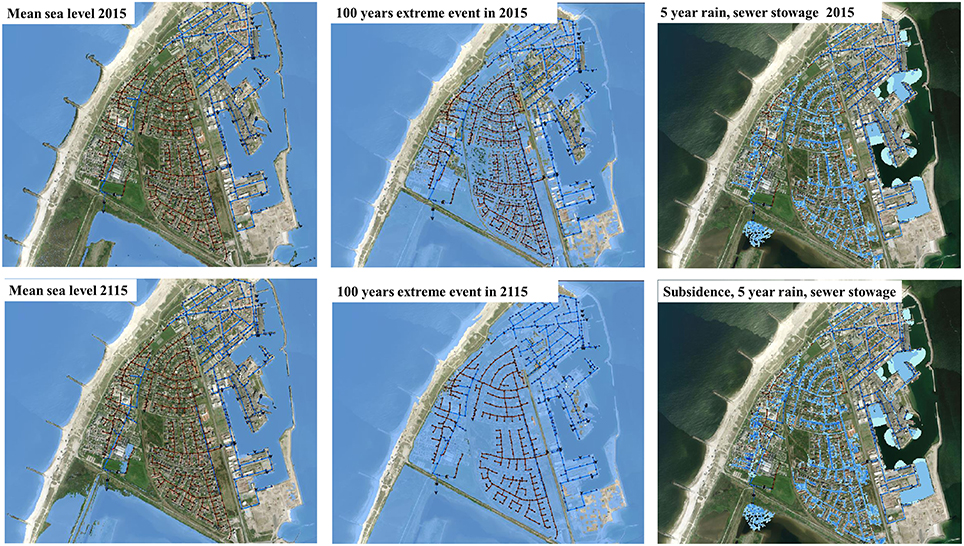
Figure 11. Examples from the MIKE modeling. A rise in mean water level will in itself not have a significant impact on flooding in 2115 compared with today, even if the groundwater level is raised (left). Today Thyboron is potentially at risk of getting flooded from a 100 year event. A similar event in 2115 including sea level rise and land subsidence will “drown” the town (a similar scenario potentially can occur in 2065) (middle). The sewer system will experience increased stow up from precipitation with a raised groundwater level, or, due to subsidence (right).
Rising groundwater stocks due to climate change (rising sea level and increased rainfall) can lead to a high water table where seepage is not possible all year round, especially during extreme water levels in the sea. At the same time an increased water table leads to the drainage system being filled with groundwater. This will significantly increase the risk of flooding in these areas as the existing drainage system is not working and a new sewage system must be constructed. A range of combinations of the modeled future scenarios may cause flooding at Thyboron, and many of the processes are coupled to enhance their effects on the hydrological system. As such, the hydrological modeling suggests that it is not the sea level rise itself that yields the largest impact but derived effects of prolonged periods of high ocean water levels, extreme events, changing groundwater levels, and with subsidence being an important factor to increase flooding in both time and space e.g., through the degradation of the sewer system.
Stakeholder Approaches to Climate Change and Adaptation
The four main stakeholders identified and interviewed in relation to this study are each playing an important role in relation to climate change adaptation in Thyboron, Table 2. The Port of Thyboron feels a responsibility toward to their customers (e.g., ships berthing and companies residing on port property) but as stated: “This is Thyboron, and this is a harbor. We occasionally get flooded and then we clean up.” Whereas most other business infrastructure and private housing in Denmark is partly covered by the “Danish national storm surge relief fund” for floods exceeding a 20 year water level event, this is not the case for harbor areas (DP, under revision). Individual business insurances may cover some losses but, in general, e.g., damages to buildings and production time losses are not covered. The Port of Thyboron does take actions to make buildings flood resilient to optimize their business, however, but does not perceive storm surges and climate change related floods as any immediate threat to their business and future development. The harbor accounts for a projected sea level rise related to an average life expectancy of 50–100 years for new quay areas, however. In recent years the harbor areas has experienced flooding on a couple of occasions but only in the case of much more frequent and severe storm surge events will the Thyboron Harbor act. The Thyboron Harbor is aware that the “underground is difficult” and is interested in more dynamic representations of the subsurface conditions. Finally, the harbor relies on a functioning sewerage system and, of course, is aware that sea water is most likely to pass harbor areas in order to flood the town.
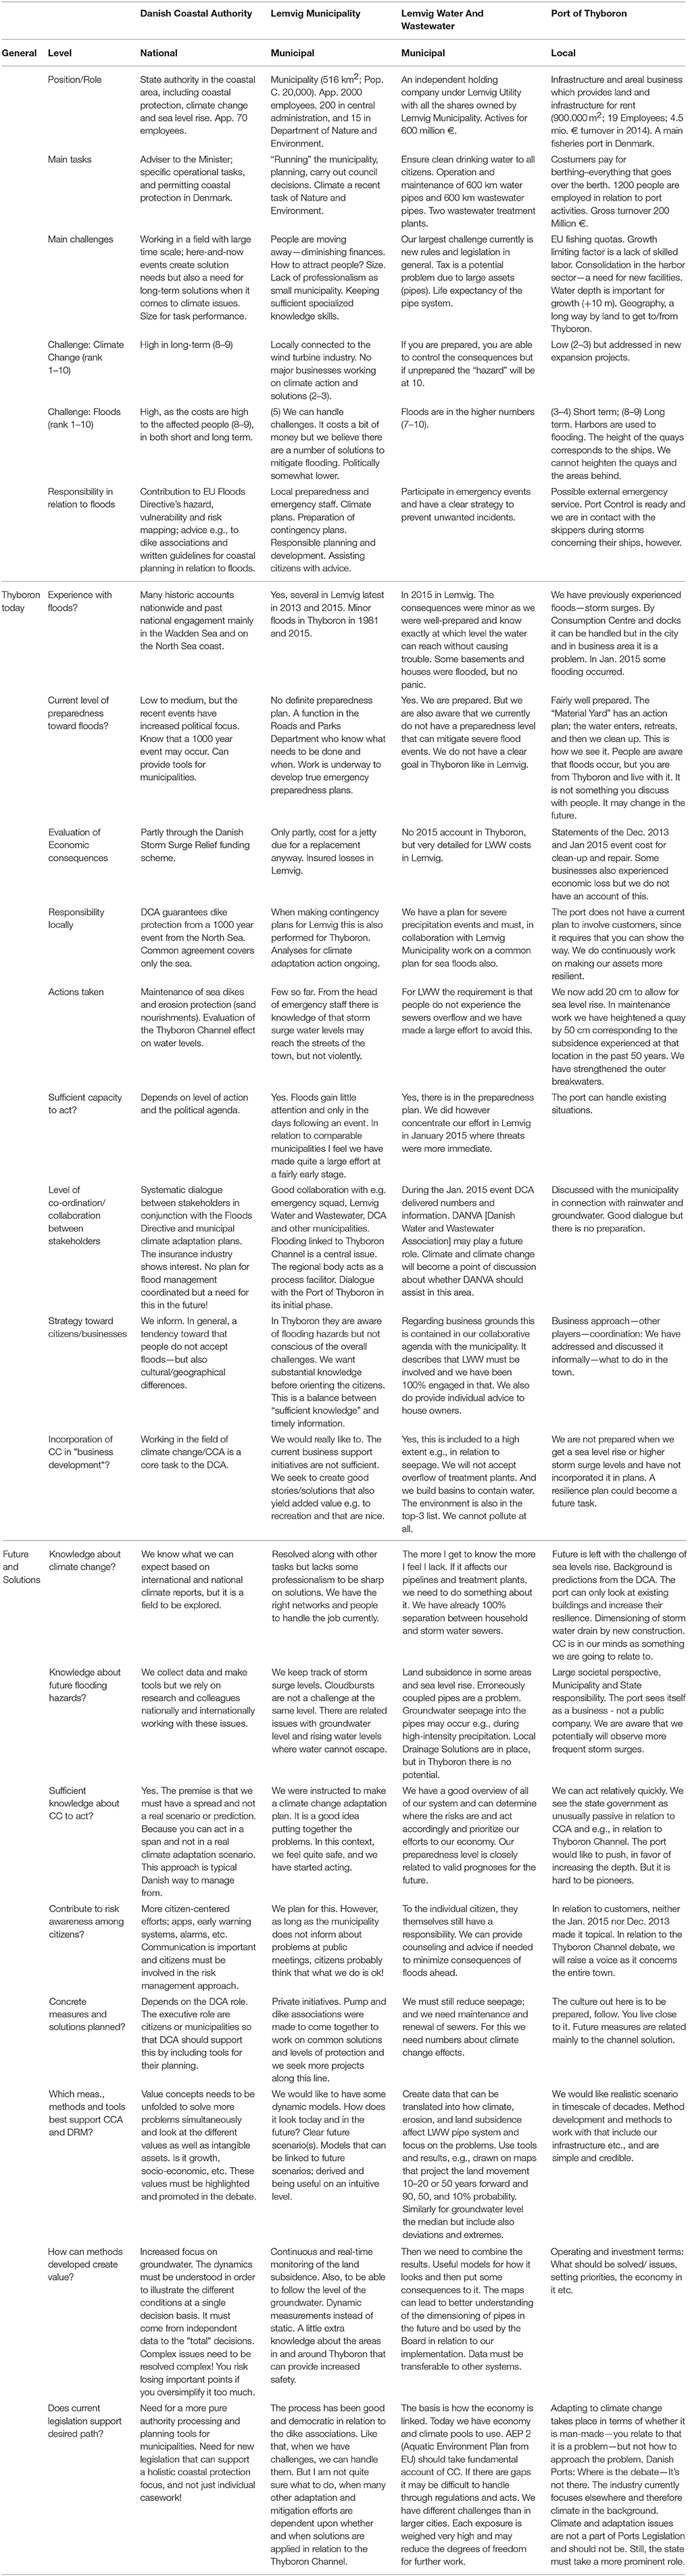
Table 2. Tabulated summary of information provided from semi-structured interviews held with main stakeholders in September 2015.
LWW seeks to keep a service level to avoid flooding exceeding 10 cm on street level due to heavy precipitation up to a 10 year event, and through their large investments in the water and wastewater pipe systems and costs for maintenance; they have a strong economic interest in the future. House owners and other businesses (otherwise not considered here) are responsible for their own protection against flooding.
The Lemvig Municipality, of course, has an interest in keeping their citizens happy and to develop the community for the benefit of all. To a large extent this is done through the municipal planning act. Also, the abovementioned municipal climate adaptation plan, which is to be integrated in the municipal plan, serves as an instrument for mitigation efforts in relation to climate change and in the development of the community. Climate change adaptation is ranked fairly high on the municipal agenda—at least in the future, and is something that the municipality will have to deal with. But, as pointed out, there are many other and more immediate challenges that the municipality has to tackle and climate change adaptation has hitherto not been the most prominent. That said the municipality still feels that it is ahead of many other Danish municipalities regarding hazard mapping and addressing future challenges, e.g., by initiating investigative work in relation to Thyboron. The citizens of Thyboron have a reputation of coping and not complaining, an impression shared with the DCA and Thyboron Harbor, and the municipality has so far not invited the citizens to participate in the broader adaptation work. The reason for this is that the municipality wants a more elaborate scientific background and ideas about where they are heading before engaging the community. The municipality does, however, inform the citizens individually when needed and takes interest in local water related challenges. The Lemvig Municipality sees the continuous expansion of the Thyboron Channel and its effect on current and future storm surge water levels as the overarching future adaptation challenge to Thyboron. The town's mitigation and adaptation measures will very much depend on whether and which solution to decrease the amount of water entering the fjord is implemented. Besides looking into local actions, the municipality is therefore active both politically and in a cross-municipal project funding search with other municipalities bordering the Limfjord to reach a future solution regarding Thyboron Channel.
The DCA is in charge of the implementation of the EU Flood Directive and is responsible for preliminary national flood hazard assessments and for the hazard, vulnerability, and risk assessment and mapping for areas appointed under the Directive. As mentioned before, DCA also is responsible for the erosion and flooding protection of Thyboron from the sea, currently in 5 year plans with economic contributions from Lemvig and other municipalities along the central Danish North Sea coast. DCA thus has a strong focus on the protection level toward the sea in Thyboron and, more general, a focus on tools for risk reduction and decision-making to e.g., municipalities.
Common to the stakeholders is the acknowledgment that coastal floods and climate change are factors that must be addressed and taken into account in future planning. Although, the perception of the timescale needed for action differs between the stakeholders according to their core business areas (and depending on potential future flooding experiences!), they all agree that collaboration is important to achieve the best solutions. Except for some co-work between the LWW and the municipality, no such collaboration is operational yet when it comes to coastal hazards and climate change adaptation. The stakeholders have quite varied needs for data, information, knowledge and tools. Whereas the Danish Coastal Authority sees itself as a provider of tools etc., as experts on coast protection and coastal climate adaptation and does give legal and coastal engineering advice, the LWW and Lemvig Municipality have fairly detailed but different demands for updated information and “dynamic results.” Port of Thyboron basically wants “a number to plan from.”
Although, direct questions about economy and funding were deliberately omitted—this will soon enough become a matter of attention, the interviews still provide some information on stakeholders' positions and ability to engage in collaborative efforts for climate change adaptation. The LWW essentially only has its customers to pay for adaptive measures, but they are forced to safeguard their investments in water supply and sewerage in relation to future conditions. The municipality is financed by the tax-payers and has to prioritize their initiatives very strictly in a time of budget-cuts due to a decreasing population, and the Port of Thyboron basically sees itself as a private enterprise with no formal responsibility toward climate adaptation and mitigation of the town of Thyboron. The three stakeholders to some extent all point to the national government to take a lead in adaptation and to assist economically. Opposed to this, DCA takes the economic responsibility given by the legislation and lets politicians make decisions regarding the national economic engagement at Thyboron and elsewhere in Denmark. However, through its scientific work DCA continuously aims at providing knowledge and better tools for decision support.
Discussion
The investigated coastal climate hazards from sea level rise and associated effects from storm surges, prolonged periods of a raised water level, and a general rise in the groundwater level will in combination with precipitation and land subsidence adversely impact the local community of Thyboron, Denmark. The future coastal erosion, erosion protection, and the effect of morphodynamic changes on storm surge levels in Thyboron due to an ongoing expansion of the cross-sectional area of the Thyboron Channel are additional challenges not considered in the present study. They, too, are significant in the evaluation of future options for adaptation and planning. Some results are preliminary and need further work. They are included to exemplify potential links between processes and impacts to the different sectors and main municipal stakeholders with interests and responsibilities in relation to adaptation in Thyboron. As such both scientific and societal aspects of hazards and impacts are parts of ongoing investigations into how coastal climate change issues are addressed to stakeholders to reveal their motivation, ideas, and needs in relation to knowledge and tools for adaptation management in each of their areas, and to create a local platform for transdisciplinary collaboration for mitigation and adaptation.
Toward Transdisciplinary Research and Collaboration
The development of a common language and to move from consulting to participatory transdisciplinary research (Mobjörk, 2010) and management may prove viable in Thyboron in relation to climate change adaptation. Serrao-Neumann et al. (2015) reviewed transdisciplinary literature and approaches, and provided learnings about sectorial and cross-sectorial climate change research and management of climate change impacts in SE Queensland, Australia. Particularly relevant to this study are the authors' reflections and conclusions regarding the concept of learning-by-doing and doing-by-learning concerning the development of theoretical knowledge from practice, and the development of practical knowledge from theory, respectively, proposed by Loorbach and Rotmans (2011, cf. Serrao-Neumann et al., 2015): learning-by-doing was pursued by engaging stakeholders representing all sectors and various scales (local, regional and state), and, the research team was able to integrate the practice/corporate/agency knowledge across sectors when formulating and refining adaptation options. In parallel, doing-by-learning was carried out by reframing adaptation options proposed in the literature to improve their capacity of being adopted and implemented in a pragmatic way based on stakeholders' feedback. In addition, a solution-oriented transdisciplinary research collaboration (opposed to a problem-oriented) was an advantage; and a selected sector can successfully be used as a platform to (re)integrate and apply created knowledge according to Serrao-Neumann et al. (2015).
At our local study location, the implementation of concrete adaptation measures is a matter of (preliminiary) discussion but cross-sector and transdisciplinary co-work is only slowly forming. Still, inasmuch as learnings are transferrable across scales, our work corroborates the findings of Serrao-Neumann et al. (2015) that transdisciplinary research is conducive to climate adaptation research. The research and cross-sector collaboration presented here has gradually evolved from a scientific interest in flooding hazards, data provision from leveling by national authorities, and an interest in these results by the local municipality. In relation to the work ahead several factors may prove advantageous: The currently involved stakeholders represent both public and private actors across levels of governance and legislation, and a common understanding of the legislative frameworks is already established. To some extent the political and/or economic standpoints of the individual actors have been clarified, and an initial platform for collaboration is “under construction” based on the research presented with positive (and realistic??) expectations from the stakeholders. Still, methods for the integration of knowledge need to be defined (e.g., Hinkel, 2008).
The research thus grows from a combined natural science and science-governance perspective. As the Thyboron Harbor, DCA and LWW mainly are technically founded, a technology/science base may well serve as the platform for transdisciplinary work and integration—gradually bringing in more social science oriented work. Although, there is a political agenda for adaptation actions, the “slow and small start” with no imminent need for actions may become a great advantage toward transdisciplinary work to decide upon optimal adaptation and mitigation measures. One major threat may be impatience among actors, including academia, to reach results, and another is a lack of focus on the process by the involved actors.
As climate change impact manifests itself in ways that do not consider administrative borders the identified main stakeholders must, although working in different areas and on different timescales for e.g., investment and maintenance, work together in a common appraisal of the challenges faced. By somehow deflecting scenarios of sea level rise, which can be difficult to relate to and address, into very concrete results on the natural processes this provides an alternative way of addressing climate change impact. For instance, the ongoing land subsidence is very concrete and easy to relate to for all stakeholders although the subsidence rates ahead may be governed by the same level of uncertainty as sea level rise. The measured land subsidence will almost certainly increase the vulnerability toward flooding, however. Here, the transformation of scientific knowledge into applicable measures can optimally provide a platform for this common work. In addition, the research presented seeks to explore how existing and new data can be utilized for this purpose. As such the work mainly addresses the transformation of current scientific knowledge for use in decision-making to create a joint platform for data, knowledge (sharing), and planning that satisfies the individual needs of the stakeholders, and at the same time optimizes the decision-making process to provide better common solutions for adaptation and planning—in Thyboron and elsewhere.
The presented research implicitly intends to address the added-value of cross-sectoral collaboration in climate change adaptation from private consulting and local companies, municipal and national government levels agencies, and academia. As these entities have different scopes of work that all must be satisfied within such a framework, a large effort must be made to clarify scopes, agendas, and perspectives of engagement to reach a consensus for collaboration. Equally, the research and development work must bear implications of advancement in a wider sense (e.g., economically through the transferability of results and methods developed, added value of data, business and research advancement, and optimal local solutions). This is no easy task as such co-work necessitates excursions into the unknown and at the same time it requires continuous attention to provide concrete results to the local politicians and decision-makers. Also, all material must be shared in a clear and concise way to be comprehendible to all actors. The research and local adaptation work has not yet addressed and engaged the local inhabitants. This is one of the forthcoming challenges that also call for enhanced inclusion of social sciences as well as someone to take responsibility of the process work ahead. So far, addressing common challenges between stakeholders seems a good starting point for collaboration.
The Probability of Sea Floods
Quality reassessment and analysis of two digital tide gauge series (late 1970s–2012/2015) from Thyboron have provided reliable results of the water level variations. Especially the harbor TG series (with additional data extending back to 1935 still in an analog form, and some daily recordings dating back to 1874) seems robust. A comparison of the harbor TG with the long TG series from the Danish North Sea coast at Esbjerg and Hanstholm shows a good correlation in the annual means. This potentially provides sea level research with additional data from the North Sea coast, and at this stage of investigation justifies that regional projections of water levels can be used for Thyboron, too. In addition, extreme water levels at Thyboron show a marked decadal variability. This variability is to be investigated further e.g., in a comparison with other TG series in Denmark and from the countries bordering the North Sea. The extremity of events in the Danish North Sea TG data has to be evaluated very carefully due to local effects in both open coast and harbor locations. For Thyboron Harbor a 100 year event has previously been calculated to 1.93 m DVR90 which is used in this study. This level is according to the digital elevation model just above the threshold where sea water may potentially flood large parts of Thyboron. As the three most extreme recordings at Thyboron Harbor TG are between 1.85 and 1.90 m DVR90, and the harbor area is flooded at c. 1.80 m DVR90, special attention to the most extreme events must be given ahead in relation both to the statistics, and to the actual probability of flooding. So far, the town has only experienced minor floods except on harbor areas. The 100 year event has been used in the hydrologic flow modeling, and scenarios of future extremes are based on Grinsted et al. (2015) adding SLR only to current statistical extreme water levels.
Land Deformation and Perspectives
Thyboron is subsiding. As the surface elevation generally is between 1.4 and 2.5 m DVR90 subsidence is relevant to consider in relation to the current and future vulnerability to flooding. Repeated precise leveling campaigns in 2006, 2009, 2012, and 2105 provide a detailed and quite unique dataset, at least in a Danish context, to show subsidence rates of 2–7 mm/year and with the largest rates toward SE. A recalculation of the leveling and corrections of the height benchmarks should be performed the next time the assumed stable points are connected to the national network. This will not change the overall results substantially but will connect the local, relative measurements to regional and national scale vertical land motion.
Considering the historic development of Thyboron over the past 100 years, subsidence may not come as a surprise as large parts of the town rests on landfill on the former fjord bottom. Only the oldest part of the town—residing on a previous fjord holm, does not experience any substantial subsidence, except perhaps c. 1 mm/year as witnessed on the barrier N and S of Thyboron, respectively. The leveling results are consistent and rates are, to a first approximation, considered linear between the measurements (9 years). As witnessed from aerial photographs and house registers there is a strong correlation between subsidence rates and time of landfill, and it is assumed that the thickness of fill material is larger toward SE. As the bottom of sewer wells show a similar pattern of subsidence (up to 10 mm/year) it is also assumed that the entire area is subsiding. The differentiated subsidence between N and S has led to broken pipes and to reverse sloping of the pipes at a considerable cost to the Lemvig Water and Wastewater Company over the past years.
Although, local land subsidence is a well-known phenomenon, data from Denmark are scarce. Detailed leveling is costly and densification and/or renovation of the Danish height system have not been carried out in many areas. Benchmarks were established by the Danish Geodata Agency in assumedly stable positions to avoid e.g., organic soils susceptible to land movement. However, local land subsidence issues have gained attention recently due to their adverse effect on flooding vulnerability, and other local areas of subsidence are currently being identified (Broge et al., 2013). In a Danish perspective a geographic focus of investigation may be related to coastal towns where low-lying former meadows have been urbanized in recent decades. Like in Thyboron, a screening that combines historical landscape information, house registers, and satellite imagery may be a viable way to proceed.
The PSI Insar mapping of Thyboron from 1995 to 2001 ERS satellite data provides results that are consistent with the leveling in terms of both subsidence rates and spatial variation. Although, separated in time, the leveling and PSI methods and results compliment and validate each other. Despite the low-resolution imagery compared to newer satellites' coverage, the PSI results appear to reflect the differentiated subsidence pattern in Thyboron very well. The difference in subsidence rates within the small area of Thyboron is a main reason for the good results. A combination of the two methods, e.g., by normalizing the PSI rates to the benchmark rates from leveling can be attempted ahead to enhance the spatial resolution and provide a more rightful map of subsidence than applying an ordinary kriging method from leveling as performed here.
PSI methods are used in many studies for detection of land subsidence in relation to coastal flooding hazard mapping. However, it is the first time convincing results are presented and validated by detailed leveling in Denmark. Knudsen et al. (2011) did not reach univocal conclusions regarding the method's applicability in a coastal setting (Esbjerg). Pedersen et al. (2011) initially set out to relate to coastal flooding in their work but the quality of mapping was not sufficient to address this further. Here PSI methods are applied directly in relation to the investigation and evaluation of coastal climate impact. When sufficient Sentinel-1 satellite data are available for subsidence mapping in mid-2016 (expectedly), this will provide access to near real-time (repeat cycle 12 days) subsidence mapping in Thyboron and the rest of Denmark. This will potentially become a strong tool to the local stakeholders provided that a service is set up to monitor the changes and deliver the results. With the launch of the twin Sentinel-1 satellite in April 2016, data acquisition frequency will double to the benefit of future updates of satellite based subsidence maps.
The rates in Thyboron are liable to decrease over time depending on the causes of subsidence. This is to be investigated further. However, we assume linearity (until 2065) in the rates from leveling in a first appraisal of the combined effect on flooding from land movement and sea level rise. This allows a dynamic modeling of the cumulated elevation changes in the DTM. As both the leveling and PSI methods show relative values, 0.8 mm/year uplift from GIA in the Danish uplift model [S1] is added to the rates and used in the hydrological model (using the ordinary kriging interpolation). The results show that the relative change in sea level also bears implications on sea flooding inland and not solely at the coast/at tide gauges.
GIA rates are small (≈ 0 – +2 mm/year) as Denmark lies at the margin of the last glaciation and thus also at the edge of most Fennoscandian GIA and uplift models. With the increased accessibility to land movement information ahead, this will allow for improvement of both the uplift model on a national scale (better fit to data) and yield a more detailed picture of regional (e.g., due to tectonics and basin compaction) and local deviations from the overall pattern. As the results from Thyboron show, land subsidence is, indeed, a factor that must be accounted for locally in Denmark.
Subsurface Interactions
Consideration must be given to sea level—groundwater interactions. Permanent or temporary changes in the groundwater level may affect the coastal flooding risk. Also, the geology plays a role. Although, the short data series (Aug–Nov 2015) from the 10 stations are too short for a detailed interpretation, variations in the groundwater level exceeding 0.5–0.8 m are witnessed, and by the end of the investigated period the groundwater levels is less than 0.6 m below terrain at low-lying stations, and likely less at some unmonitored locations. Groundwater is already a challenge in Thyboron. The groundwater information will enter the ongoing 3D geological model setup to couple to the geologic and geophysical mapping of the upper layers, which is expected to provide a more solid basis to interpret causes and magnitudes of subsidence and provide information that can be rendered useful for the hydrologic flow modeling and interpretation. With the increased repeat cycle of e.g., the Sentinel 1 satellites' imagery, seasonal variation in subsidence rates and the potential relation to the groundwater level can be resolved.
The coupling in a model of engineering geological and geotechnical analyzes and satellite borne subsidence mapping opens up a range of options, too. In and around Thyboron a large amount of geological and geotechnical parameters have been collected from decades of experience in construction works. By comparing these data with other available data in a 3D model, spatial analyzes of the underground conditions in relation to subsidence mapping can be performed. This allows for a comparison of cumulated layers of filling and observed compressible layers with actually recorded subsidence rates. Analyzes may also include geotechnical strength parameters, water content of sediments, and historic hydrological observations of water levels. Since the data coverage of the geotechnical information in Thyboron area is not evenly distributed spatially, the possible relation between subsidence rates and thickness of filling layers etc. from areas of good coverage may be used to predict thicknesses expected in areas which are not covered by geotechnical information. Satellite based subsidence mapping will then become a very useful source of data to support the establishment of engineering geological models for the area to be used by the individual stakeholders with a spatial interest in the area. The models can then be used in conditional assessments and climate proofing of existing facilities and infrastructure, in future design and planning, as well as for economic risk analysis of future investment conditions. This also means that subsidence attenuation better can be estimated and used in planning.
The DUALEM-421s geophysical results were not very successful due to the shallow and saline groundwater table (and limited spatial coverage). In other areas the method will contribute to detailing the 3D model (up to 10 m depth), however. Typically, geophysical surveys are constrained by existing infrastructure, land-use, access, noise sources in the area (metal fences, wires in land, buildings, etc.). The geophysical mapping can only be expected to cover certain areas of an urban environment, and should always be correlated against existing or new geotechnical wells to support the interpretation of the measured resistivity in the ground. Opposed to this, existing geotechnical data are typically located in or at the footprint of buildings. In this study it has therefore only so far been possible to correlate the geophysical data with the geological and geotechnical observations in a relatively small area in the SE part of Thyboron.
Insights gained about the subsurface geology will nevertheless be useful to the stakeholders. Based on the interviews the interest in the subsurface conditions may become a pivotal point of collaboration, and further research into the relations between geophysical subsurface properties, land subsidence, and future coastal climate change impact may reveal hitherto unrecognized connections for which existing geotechnical data may be utilized.
Flooding Thyboron
Through the hydrologic flow modeling in MIKE an initial assessment of the impact from sea state, precipitation, and land subsidence on the sewer system and flooding extent and depths has been made for a range of future scenarios based on the research results from land movement in this study and climate change scenarios for precipitation and sea level rise. At the current stage the modeling serves to gain insight to the relative importance of the various contributors; individually and in combination. Results are not interpreted into detail, and the model will subsequently be refined e.g., by use of the updated version of DK-DEM that is expected for release in 2016. The updated DK-DEM samples aircraft Lidar data with a much higher point density (4–5 points per m2) to allow for a better resolution of surface features to lead to an improved modeling of surface water flow and accumulation. This is accomplished by updating hydrologically important features such as sluices, aqueducts etc. to produce a hydrologically conditioned elevation model.
Whereas sea level rise in itself is unproblematic according to the model results, a generally rising groundwater level in combination with subsidence is a flooding challenge. In addition, this will severely affect the entire sewer system. Interestingly, precipitation will also increase the probability of flooding and is locally a focus of attention today. Ahead the surface flow and surface-sewerage interactions will be investigated in further detail based on the abovementioned updated DK-DEM, as well as the model will incorporate the joint probability of heavy precipitation and storm surges.
The low elevation threshold means that a large part of the town already today potentially may get flooded from a 100-year storm surge event. In 2115, flooding depths may potentially exceed 1 m on a regular basis. Measures to increase the threshold level for flooding are being planned by the municipality based on the modeling results and include heightening of the lowermost areas toward the northern part of the harbor. Here, an old and small dike has been neglected for decades and can fairly easy be restored to increase the current protection level from storm surges. This measure will probably satisfy the local politicians' call for action for a while. It will not deal with long term challenges nor will it address future adaptation and planning needs, however. Ahead, further work is needed on the modeling to yield more detailed results that also take into account e.g., dike strength, wave overtopping, morphodynamic changes, and to improve the relation between subsurface processes and potential flooding.
Work and Research Ahead
The stakeholders do state very different needs for knowledge and models about climate change at the current state. Although, the Port of Thyboron states that climate change adaptation is not a part of their business foundation, an enhanced knowledge about e.g., subsurface processes, geology etc. definitely will provide them with a useful platform for development. The point is that challenges related to climate change can also be addressed as something else and carry the knowledge and capacity-building forward. It is the shared opinion by the main stakeholders that people from Thyboron do not panic or complain. It is a part of their culture. A couple of severe flooding events can change this, of course, but ideally this provides a less hectic environment and provides time and room for the stakeholders to reach a common appraisal of the future challenges.
The presented research from Thyboron can be seen as the first step toward creating a common platform for integration of knowledge and data for climate adaptation and planning. However, the main stakeholders show a strong interest to build this platform together. It is also indicated that existing data can be revitalized and, especially in combination with in situ and satellite data, become very useful in creating tools to monitor and project climate change and impact in Thyboron and to allow for dynamic updates, as the scientific knowledge about what to expect advances.
Although, the presented transdisciplinary approach is very valuable, it also requires a high degree of coordination between the various professions and scientific disciplines. In a long term an optimization of the framework is essential, e.g., by providing free data through the Danish “basic data program” with standardized data formats. This will moreover strongly increase the popularity of data amongst the private sector and in this way support the advancement of perspectives for the concept provided.
Conclusions
Low-lying coastal towns may face severe challenges in relation to a changing climate. From a transdisciplinary approach in the community of Thyboron on the Danish North Sea coast, climate change impact on future flooding vulnerability has been investigated and related to the main stakeholders. Results from repeated precise leveling and satellite methods consistently show that Thyboron is subsiding by 2–7 mm/year which will adversely affect the flooding probability and extent ahead. Preliminary results presented in relation to the coupling between sea state, groundwater level, subsurface geology, the sewer system, and the observed land motion show increasing challenges ahead. The results have been addressed in relation to the responsibilities of the main stakeholders and their needs of knowledge, tools and models for planning and adaptation. By addressing potential water-related impact from climate change in a very concrete form, the stakeholders can more easily relate to the complexity and uncertainty in climate scenarios and projections. The combination of a revitalization and use of existing data, and in situ and satellite data collection is promising and may provide for better adaptation and planning measures, not only in Thyboron but also in other communities in Denmark and elsewhere.
Author Contributions
CS constructed the research framework and set-up, participated in all areas of the work including the conduction of interviews, field studies, data analysis and interpretation (except the hydrological model setup), and wrote the initial version of the manuscript. KV planned and led the calculations of the precise leveling campaigns. NB led the PSI data interpretation and collaborated on the precise leveling. MM led the geological and geotechnical data collection, interpretation and geological model setup. PT led geophysical data collection and interpretation, CSS led the data collection and the model setup for hydrological modeling, and PK did the main work on land uplift model setup and calculations and participated in the quality assessment of benchmark calculations. All authors have contributed with input, discussions, and critical comments to the final manuscript.
Conflict of Interest Statement
The authors declare that the research was conducted in the absence of any commercial or financial relationships that could be construed as a potential conflict of interest.
Acknowledgments
The authors wish to acknowledge and thank Bo Hviid Nielsen, Albert Jensen, and Jan Nielsen (Lemvig Water and Wastewater) for implementing the groundwater monitoring campaign and for sharing their “subsurface” stories; Pieter Mogree, Kirsten Harbo, and Martin Ronn Hansen (Lemvig Municipality) for providing local information and data; Britta Bockhorn (Geo) for assisting in preparing the geological model; and Roar Engell, Danish Geodata Agency, for assisting in preparing leveling data and graphic work. Christian Vrist and Jesper Holt Jensen (Port of Thyboron), Lars Norgaard Holmegaard (Lemvig Water and Wasterwater), Merete Lovschall (Danish Coastal Authority), and Thomas Damgaard (Lemvig Municipality) shared their views, ideas and visions for the future of Thyboron in relation to coastal climate adaptation and planning. For this we are grateful. Co-funding for an Industrial PhD scholarship (Grant no. 1355-00193) is provided by Innovation Fund Denmark.
Supplementary Material
The Supplementary Material for this article can be found online at: https://www.frontiersin.org/article/10.3389/fmars.2016.00069
References
Andersen, H. L., Thorsen, G., and Hauerbach, P. (1996). “Geotechnical and geological aspects of differential subsidence in the Skaw Spit, Denmark,” in Proceedings of the XII Nordic Geotechnical Conference: NGM-96, Vol. 1, eds S. Erlingsson and H. Sigursteinsson (Reykjavik: Icelandic Geotechnical Society), 339–346.
Arns, A., Wahl, T., and Jensen, J. (2015). The impact of sea level rise on storm surge water levels in the northern part of the German Bight. Coast. Eng. 96, 118–131. doi: 10.1016/j.coastaleng.2014.12.002
Binzer, K., and Stockmarr, J. (1994). Geological Map of Denmark, 1:500 000. Pre-Quaternary surface topography of Denmark. Copenhagen: Geological Survey of Denmark.
Bosello, F., and De Cian, E. (2014). Climate change, sea level rise, and coastal disasters. a review of modeling practices. Energy Economics 46, 593–605. doi: 10.1016/j.eneco.2013.09.002
Broge, N. H., Vognsen, K., Steffensen, F., Sonne, I. B., Sørensen, C., Knudsen, P., et al. (2013). Kortlaegning af Omraader Med Foroeget Sandsynlighed for Landsaenkning, Vol. 17. Technical Report Series, Danish Geodata Agency, Copenhagen.
Bruun, P., and Gerritsen, F. (1960). Stability of Coastal Inlets. Amsterdam: North Holland Publishing Company.
Christensen, B. B. (2011a). Stormflodsundersoegelse i Limfjorden. Modelgrundlag, Kalibrering og Foelsomhedsanalyse. Technical Report, DHI for the Danish Coastal Authority, Horsholm.
Christensen, B. B. (2011b). Stormflodsmodellering Vestlig Limfjord. Technical Report, DHI for the Danish Coastal Authority, Horsholm.
Dangendorf, S., Marcos, M., Müller, A., Zorita, E., Riva, R., Berk, K., et al. (2015). Detecting anthropogenic footprints in sea level rise. Nat. Commun. 6, 7849. doi: 10.1038/ncomms8849
DCA (2013a). Kortlægning af Fare og Risiko for Oversvømmelse. Metoderapport. EU's Oversvømmelsesdirektiv (2007/60/EF), Plantrin 2. Lemvig: Danish Coastal Authority, the Ministry of Transportation.
DCA (2013b). Straekningen Lodbjerg - Nymindegab. Bilag til Faellesaftale om Kystbeskyttelsen for Perioden 2014-18. Lemvig: Danish Coastal Authority.
DP (1946). Lov om Foranstaltninger til Sikring af Limfjordstangerne, Thyboron Havn og Thyboron Kanal. Act no. 454 of 14 Aug. 1946. Copenhagen: Danish Parliament.
DP (1970). Lov om Ophœvelse af Lov om Foranstaltninger til Sikring af Limfjordstangerne, Thyborøn Havn og Thyborøn kanal. Act no. 477 of 9 Dec 1970. Copenhagen: Danish Parliament.
DP (2012a). Lov om Ændring af Lov om Planlœgning (L148, 29 May 2012). Copenhagen: Danish Parliament.
DP (2012b). Lov om Ændring af Lov om Vandsektorens Organisering og Økonomiske forhold (L149, 29 May 2012). Copenhagen: Danish Parliament.
Du, Y.-D., Cheng, X.-H., Wang, X.-W., Ai, H., Duan, H.-L., He, J., et al. (2013). A review of assessment and adaptation strategy to climate change impacts on the Coastal Areas in South China. Adv. Clim. Change Res. 4, 201–207. doi: 10.3724/SP.J.1248.2013.201
Duun-Christensen, I. (1990). “Long-term variations in sea level at the Danish coast during the recent 200 years,” in Proceedings of the 1st International Coastal Symposium (Skagen).
EU (2007). Directive 2007/60/EC of the European Parliament and of the Council of 23 October 2007 on the Assessment and Management of Flood Risks. Luxembourg: Official Journal of the European Union, L 288/27 (6/11/2007).
Ferretti, A., Monti-Guarnieri, A., Prati, C., Rocca, F., and Massonnet, D. (2007). InSAR Principles: Guidelines for SAR Interferometry Processing and Interpretation (TM-19, February 2007), ed. K. Flethcher. Noordwijk: European Space Agency, ESA Publications/ESTEC.
Gallina, V., Torresan, S., Critto, A., Sperotto, A., Glade, T., and Marcomini, A. (2016). A review of multi-risk methodologies for natural hazards: Consequences and challenges for a climate change impact assessment. J. Environ. Manag. 168, 123–132. doi: 10.1016/j.jenvman.2015.11.011
Geo (2015). “Database of geotechnical surves in Denmark (Geo-GIS),” in Private Geotechnical Database (Copenhagen: Geo). Available online at: http://www.geo.dk
Geoteknisk Institut (1978). Ny Administrationsbygning Thyboron/Harboore, Case no. 78117. Geotechnical Report. Geotechnical Institute (now Geo), Copenhagen.
Geoteknisk Institut (1983). Thyboron, Nordsokaj, Case no. 140 02987. Geotechnical Report. Geotechnical Institute (now Geo), Copenhagen.
GEUS (2015a). Jupiter - Denmark's Geological and Hydrological Database. Denmark and Greenland Geological Survey. Available online at: http://www.geus.dk/DK/data-maps/jupiter/Sider/default.aspx
GEUS (2015b). GERDA - Danish National Database on Shallow Geophysical Data. Denmark and Greenland Geological Survey. Available online at: http://www.geus.dk/gerda/gerda-uk.htm
GEUS (2015c). GEUS' Model Data Base. Denmark and Greenland Geological Survey. Available online at: http://www.geus.dk/DK/data-maps/Sider/default.aspx
GEUS (2015d). Groundwater Reports Database. Denmark and Greenland Geological Survey. Available online at: http://www.geus.dk/DK/data-maps/Sider/default.aspx
GEUS (2015e). Digital Soil Map of Denamrk 1:25.000. Denmark and Greenland Geological Survey. 1:25 000. Available online at: http://www.geus.dk/DK/data-maps/Sider/j25-dk.aspx
Gibbs, M. T. (2015). Coastal climate risk and adaptation studies: The importance of understanding different classes of problem. Ocean Coast. Manag. 103, 9–13. doi: 10.1016/j.ocecoaman.2014.10.018
Gregersen, I. B., Madsen, H., Linde, J. J., and Krüger, Arnbjerg-Nielsen, K. (2014). Opdaterede Klimafaktorer og Dimensionsgivende Regnintensiteter. Copenhagen: Ingeniorforeningen i Danmark - IDA Spildevandskomiteen, Skrift nr. 30.
Gregersen, S., and Voss, P. (2010). Irregularities in Scandinavian postglacial uplift/subsidence in time scales tens, hundreds, thousands of years. J. Geodyn. 50, 27–31. doi: 10.1016/j.jog.2009.11.004
Gregersen, S., and Voss, P. (2015). Consistency of postglacial geodynamics for the Kattegat region, southern Scandinavia, based on seismological, geological and geodetic data. Geol. Surv. Den. Greenl. 33, 21–24.
Grinsted, A. (2015). “Projected change – Sea level, 2015,” in Second Assessment of Climate Change for the Baltic Sea Basin, eds The BACC II Author Team (Regional Climate Studies, Springer Open), 252–263.
Grinsted, A., Jevrejeva, S., Riva, R. E., and Dahl-Jensen, D. (2015). Sea level rise projections for northern Europe under RCP8.5. Clim. Res. 64, 15–23. doi: 10.3354/cr01309
Hallegatte, S., Green, C., Nicholls, R. J., and Corfee-Morlot, J. (2013). Future flood losses in major coastal cities. Nat. Clim. Change 3, 802–806. doi: 10.1038/nclimate1979
Hallegatte, S., Ranger, N., Mestre, O., Dumas, P., Corfee-Morlot, J., Herweijer, C., et al. (2011). Assessing climate change impacts, sea level rise and storm surge risk in port cities: a case study on Copenhagen. Clim. Change 104, 113–137. doi: 10.1007/s10584-010-9978-3
Hansen, J. M., Aagaard, T., and Binderup, M. (2012). Absolute sea levels and isostatic changes of the eastern North Sea to central Baltic region during the last 900 years. Boreas 41, 180–208. doi: 10.1111/j.1502-3885.2011.00229.x
Hansen, L. (2013). Sea Level Data 1889-2012 From 14 Stations in Denmark. Mean, Maximum and Minimum Values Calculated on Monthly and Yearly Basis Including Plots of Mean Values. Technical Report 13-15, Danish Meteorological Institute, Copenhagen.
Hanssen, R., and Perski, Z. (2007). Reconnaissance Skagen, Denmark. Status Overview 22 Jan 2007. TUDelft. Available online at: http://cct.gfy.ku.dk/skagen/skagen.htm
Hawa, M. N., Knudsen, T., Kokkendorff, S. L., Olsen, B. P., and Rosenkranz, B. C. (2011). Horizontal Accuracy of Digital Elevation Models, Vol. 10. Technical Report Series, National Survey and Cadastre, Copenhagen.
Hinkel, J. (2008). Transdisciplinary Knowledge Integration. Cases from Integrated Assessment and Vulnerability Assessment. Ph.D. thesis, Wageningen University, Wageningen.
Holgate, S. J., Matthews, A., Woodworth, P. L., Rickards, L. J., Tamisiea, M. E., Bradshaw, E., et al. (2013). New data systems and products at the Permanent Service for Mean Sea Level. J. Coast. Res. 29, 493–504. doi: 10.2112/jcoastres-D-12-00175.1
I-GIS (2015). GeoScene3D - Geological Modelling and Visualization Software. Available online at: http://www.i-gis.dk/GeoScene3D/tabid/62/language/en-GB/Default.aspx
IDA (2005). Funktionspraksis for Afloebssystemer Under Regn. Copenhagen: Ingeniorforeningen i Danmark - IDA Spildevandskomiteen, Skrift nr,. 27.
Ingvardsen, S. M., Knudsen, S. B., Madsen, H. T., Sørensen, C., and Bisgaard, C. (2012). Thyboron Kanal og Vestlige Limfjord. Technical Report, Danish Coastal Authority, Lemvig.
IPCC (2012). Managing the Risks of Extreme Events and Disasters to Advance Climate Change Adaptation. A Special Report of Working Groups I and II of the Intergovernmental Panel on Climate Change, eds C. B. Field, V. Barros, T. F. Stocker, D. Qin, D. J. Dokken, K. L. Ebi, M. D. Mastrandrea, K. J. Mach, G. -K. Plattner, S. K. Allen, M. Tignor, and P. M. Midgley (Cambridge, UK; New York, NY: Cambridge University Press), 582.
IPCC (2013). Climate Change 2013: The Physical Science Basis. Contribution of Working Group I to the Fifth Assessment Report of the Intergovernmental Panel on Climate Change, eds T. F. Stocker, D. Qin, G. -K. Plattner, M. Tignor, S. K. Allen, J. Boschung, A. Nauels, Y. Xia, V. Bex, and P. M. Midgley (Cambridge, UK; New York, NY: Cambridge University Press), 1535.
Jahn, T., Bergmann, M., and Keil, F. (2012). Transdisciplinarity: Between mainstreaming and marginalization. Ecol. Econ. 79, 1–10. doi: 10.1016/j.ecolecon.2012.04.017
Jakobsen, P. R., Hermansen, B., and Tougaard, L. (2015). Danmarks Digitale Jordartskort 1:25000 Version 4.0. Geological Survey of Denmark and Greenland, Report 2015/30.
Jakobsen, P. R., Wegmuller, U., Capes, R., and Pedersen, S. A. S. (2013). Terrain subsidence detected by satellite radar scanning of the Copenhagen area, Denmark, and its relation to the tectonic framework. Geol. Surv. Den. Greenl. 28, 25–28.
Jensen, J., and Sorensen, C. (2008). Fremskrivning af Fodringsindsatsen paa Vestkysten. Lemvig: Danish Coastal Authority.
Jorgensen, F., Kristensen, M., Hojberg, A. L., Klint, K. E. S., Hansen, C., Jordt, B. E., et al. (2008). Opstilling af Geologiske Modeller til Grundvandsmodellering. Copenhagen: Geo-Vejledning 3, Geological Survey of Denmark and Greenland.
Khan, S. A. (2014). Report: GPS Time Series for Permanent GPS Stations in Denmark. DTU Space, Lyngby.
Knudsen, S. B., Ingvardsen, S. M., Madsen, H. T., Sorensen, C., and Christensen, B. B. (2012). Increased Water Levels Due to Morphodynamic Changes; the Limfjord, Denmark. Santander: Coastal Engineering Proceedings.
Knudsen, S. B., Sorensen, C., Madsen, H. T., and Ingvardsen, S. M. (2011). Thyboron Kanal 2009. Technical Report, Danish Coastal Authority, Lemvig.
Knudsen, T., Dalaa, N. S., Knudsen, P., and Jakobsen, P. R. (2009). ABSRATE – Absolute Subsidence Rates from Persistent Scatterer Interferometry Data. Final report. Technical Report No. 5, National Survey and Cadastre (KMS), Copenhagen.
Kortenhaus, A., and Oumeraci, H. (2014). “Flood risk assessments - results, applications and future requirements,” in Proceedings of 34th Conference on Coastal Engineering (Seoul). doi: 10.9753/icce.v34.management.15
Kuklicke, C., and Demeritt, D. (2016). Adaptive and risk-based approaches to climate change and the management of uncertainty and institutional risk: the case of future flooding in England. Global Environ. Change 37, 56–68. doi: 10.1016/j.gloenvcha.2016.01.007
Lane, D. E., Clarke, C. M., Clarke, J. D., Mycoo, M., and Gobin, J. (2015). “Managing adaptation to changing climate in Coastal Zones,” in Coastal Zones, Solutions for the 21st Century, eds J. Baztan, O. Chouinard, B. Jorgensen, P. Tett, J.-P. Vanderlinden, and L. Vasseur (Amsterdam: Elsevier), 141–160. doi: 10.1016/B978-0-12-802748-6.00009-7
Larsen, T., and Beck, J. B. (2009). Stormflodsvandstande i Limfjorden ved lukning af Thyborøn Kanal. Teknik Miljoe 2009, 54–57.
Levinsen, J., Dall, J., Skriver, H., Kusk, A., Broge, N. H., and Sorensen, C. (2015). Derivation of Land Deformation Over Three Locations in Denmark. Copenhagen: ESA Project, Id. 30907.
Linham, M. M., and Nicholls, R. J. (2010). “Technologies for climate change adaptation – Coastal Erosion and flooding,” in TNA Guidebook Series, ed X. Zhu (New Delhi: UNEP Risø Centre. Magnum Custom Publishing), 152.
Loorbach, D., and Rotmans, J. (2011). The practice of transition management: examples and lessons from four distinct cases. Futures 42, 237–246. doi: 10.1016/j.futures.2009.11.009
Lykke-Andersen, H., and Borre, K. (2000). Aktiv tektonik i Danmark: der er liv i Sorgenfrei-Tornquist Zonen. Geol. Nyt. 6, 12–13.
Mertz, E. L. (1924). Oversigt Over de Sen- og Postglaciale Niveauforandringer i Danmark. Copenhagen: Danmarks Geologiske Undersøgelse, II Rk., Nr.41.
Milne, G. A., Mitrovica, J. X., Scherneck, H.-G., Davis, J. L., Johansson, J. M., Koivula, H., et al. (2004). Continuous GPS measurements of postglacial adjustment in Fennoscandia: 2. Modeling results. J. Geophys. Res. 109, B02412. doi: 10.1029/2003JB002619
Mobjörk, M. (2010). Consulting versus participatory transdisciplinarity: a refined classification of transdisciplinary research. Futures 42, 866–873. doi: 10.1016/j.futures.2010.03.003
MPW (1942). Betaenkning Vedrorende Foranstaltninger til Sikring af Limfjordstangerne og Thyboron havn. By Commission of 16 Apr 1937. Copenhagen: Ministry of Public Works.
MPW (1968). Betaenkning Vedrorende Thyboron Kanal. No. 472. ed S. L. Moellers Bogtrykkeri. Copenhagen: Ministry of Public Works.
MT (2009). Bekendtgørelse af Lov om Kystbeskyttelse, 2009. LBK nr 267 af 11/03/2009. Copenhagen: Danish Ministry of Transportation.
Nerem, R. S., Chambers, D., Choe, C., and Mitchum, G. T. (2010). Estimating Mean Sea Level Change from the TOPEX and Jason Altimeter Missions. Marine Geod. 33 (Suppl. 1), 435–446. doi: 10.1080/01490419.2010.491031
Nguyen, T. T. X., Bonetti, J., Rogers, K., and Woodroffe, C. D. (2016). Indicator-based assessment of climate-change impacts on coasts: a review of concepts, methodological approaches and vulnerability indices. Ocean Coast. Manag. 123, 18–43. doi: 10.1016/j.ocecoaman.2015.11.022
Nicholls, R. J., Wong, P. P., Burkett, V. R., Codignotto, J. O., Hay, J. E., McLean, R. F., et al. (2007). “Coastal systems and low-lying areas,” in Climate Change 2007: Impacts, Adaptation and Vulnerability. Contribution of Working Group II to the Fourth Assessment Report of the Intergovernmental Panel on Climate Change, eds M. L. Parry, O. F. Canziani, J. P. Palutikof, P. J. van der Linden, and C. E. Hanson (Cambridge: Cambridge University Press), 315–356.
Nielsen, T., Mathiesen, A., and Bryde-Auken, M. (2007). Base Quaternary in the Danish parts of the North Sea and Skagerrak. Geol. Surv. Den. Greenl. Bull. 15, 37–40.
Norgaard, J. Q. H., Bentzen, T. R., Larsen, T., Andersen, T. L., and Kvejborg, S. (2014). Influence of closing storm surge barrier on extreme water levels and water exchange; Limfjord, Denmark. Coast. Eng. J. 56, 1–16. doi: 10.1142/S0578563414500053
Olesen, M., Madsen, K. S., Ludwigsen, C. A., Boberg, F., Christensen, T., Cappelen, J., et al. (2014). Fremtidige Klimaforandringer i Danmark, 2014. Copenhagen: Danmarks Klimacenter, Rapport 6 (Summary in English).
Pedersen, S. A. S., Gaset, M., Cooksley, G., and Jakobsen, P. R. (2011). Detection of terrain changes in southern Denmark using persistent scatterer interferometry. Geol. Surv. Den. Greenl. 23, 41–44.
Permanent Service for Mean Sea Level (2015). “(PSMSL) Tide Gauge Data,” Available online: http://www.psmsl.org/data/obtaining/
Petersen, A., Andersen, H., and Thomsen, O. (2008). Borehulslogging Thyboron Sydhavn. DGU no. 44.571 (Feb. 2008). Copenhagen: Orbicon Inc.
Rosenkranz, B. C., and Frederiksen, P. (2011). Quality Assessment of the Danish Elevation Model (DK-DEM), Vol. 12. Technical Report Series, National Survey and Cadastre, Copenhagen.
Sandersen, P. B. E. (2008). “Uncertainty assessment of geological models – a qualitative approach,” in Calibration and Reliability in Groundwater Modelling: Credibility Of Modelling, eds J. C. Refsgaard, K. Kovar, E. Haarder, and E. Nygaard (International Association of Hydrological Sciences (IAHS) Publication 320), 345–349.
Schmidt, K. E. (2000). The Danish Height System DVR90. Skrifter 4. Rk., bd. 8. Copenhagen: Kort and Matrikelstyrelsen.
Serrao-Neumann, S., Schuch, G., Harman, B., Crick, F., Sano, M., Sahin, O., et al. (2015). One human settlement: a transdisciplinary approach to climate change adaptation research. Futures 65, 97–109. doi: 10.1016/j.futures.2014.08.011
Sorensen, C. (2015a). Elskede, forhadte Vesterhav - Livgivende forkaetrede kanal. Geogr. Orientering 45, 6–13.
Sorensen, C. (2015b). “Water NOT wanted - Coastal Floods and Flooding Protection in Denmark,” in Sicherung von Dämmen, Deichen und Stauanlagen. Handbuch für Theorie und Praxis, Vol. V, eds. R. A. Herrmann and J. Jensen (Siegen: Universität Siegen), 3–21.
Sorensen, C., Broge, N., Knudsen, P., and Andersen, O. B. (2015). “Combining sea state and land subsidence rates in an assessment of flooding hazards at the Danish North Sea Coast,” in Workshop on Global and Regional Sea Level Variability and Change, 10-12 June 2015 (Mallorca: University of the Balearic Islands), 62.
Sorensen, C., Madsen, H. T., and Knudsen, S. B. (2013). Hojvandsstatistikker 2012. Lemvig: Danish Coastal Authority.
Sorensen, T., Fredsoe, J., and Jakobsen, P. R. (1996). “History of coastal engineering in Denmark,” in History and Heritage of Coastal Engineering, ed N. Kraus (New York, NY: ASCE), 103–141.
Vignoli, G., Fiandaca, G., Christensen, A. V., Kirkegaard, C., and Auken, E. (2015). Sharp spatially constrained inversion with applications to transient electromagnetic data. Geophys. Prospect. 63, 243–255. doi: 10.1111/1365-2478.12185
Visser, H., Dangendorf, S., and Petersen, A. C. (2015). A review of trend models applied to sea level data with reference to the “acceleration-deceleration debate.” J. Geophys. Res. Oceans 120, 3873–3895. doi: 10.1002/2015JC010716
Visser, L. E. (2001). “Reflections on transdisciplinarity, integrated coastal development, and governance,” in Challenging Coasts - Transdisciplinary Excursions into Integrated Coastal Zone Development, ed L. E. Visser (Amsterdam: MARE Publication Series No. I, Amsterdam University Press), 23–47.
Vognsen, K., Jepsen, C., and Kokkendorff, S. L. (2013a). Guidelines for Motoriseret Geometrisk Praecisionsnivellement. Copenhagen: Danish Geodata Agency.
Vognsen, K., Sonne, I. B., Broge, N. H., Sorensen, C., and Knudsen, P. (2013b). Metode til Fremskrivning af Oversvoemmelsesomfang Ved Stormflod, Vol. 16. Technical Report Series, Danish Geodata Agency, Copenhagen.
Wahl, T., Haigh, I. D., Woodworth, P. L., Albrecht, F., Dillingh, D., Jensen, J., et al. (2013). Observed mean sea level changes around the North Sea coastline from 1800 to present. Earth Sci. Rev. 124, 51–67. doi: 10.1016/j.earscirev.2013.05.003
Keywords: sea level rise, local impact, extremes, land motion, geotechnical properties, integrating tools, stakeholder collaboration
Citation: Sorensen C, Broge NH, Molgaard MR, Schow CS, Thomsen P, Vognsen K and Knudsen P (2016) Assessing Future Flood Hazards for Adaptation Planning in a Northern European Coastal Community. Front. Mar. Sci. 3:69. doi: 10.3389/fmars.2016.00069
Received: 11 December 2015; Accepted: 22 April 2016;
Published: 11 May 2016.
Edited by:
Marta Marcos, University of the Balearic Islands, SpainReviewed by:
Goneri Le Cozannet, Bureau de Recherches Géologiques et Minières (BRGM), FranceIvica Vilibic, Institute of Oceanography and Fisheries, Croatia
Copyright © 2016 Sorensen, Broge, Molgaard, Schow, Thomsen, Vognsen and Knudsen. This is an open-access article distributed under the terms of the Creative Commons Attribution License (CC BY). The use, distribution or reproduction in other forums is permitted, provided the original author(s) or licensor are credited and that the original publication in this journal is cited, in accordance with accepted academic practice. No use, distribution or reproduction is permitted which does not comply with these terms.
*Correspondence: Carlo Sorensen, carlos@space.dtu.dk