Carbon and Nitrogen Stocks and Below-Ground Allometry in Temperate Mangroves
 Richard H. Bulmer
 Luitgard Schwendenmann2
  Carolyn J. Lundquist
- 1Institute of Marine Science, University of Auckland, Auckland, New Zealand
- 2School of Environment, University of Auckland, Auckland, New Zealand
- 3National Institute of Water and Atmospheric Research Ltd, Hamilton, New Zealand
Mangroves play an important role in the storage of carbon (C) and nitrogen (N) within estuarine systems, yet are being lost at an alarming rate throughout the tropics. In contrast, temperate mangroves have increased in area at many locations in recent decades. Field surveys, sediment sampling, allometry, and C and N analysis were used to determine total C and N stocks in five temperate Avicennia marina subsp. australasica forests in New Zealand. This is the first study developing allometric functions to estimate root biomass C and N stocks for A. marina. A. marina forests stored 117.1 ± 16.8 t C ha−1 and 15.4 ± 1.0 t N ha−1 in above and below-ground biomass and sediment to 100 cm depth. Below-ground biomass and sediment C and N stocks contributed 88 ± 3 and 99 ± 0.4% to total C and N stocks, respectively, emphasizing the importance of below-ground biomass and sediment in mangrove ecosystems. The results of this study can be used to inform management decisions for estuarine and coastal ecosystems, currently undergoing rapid changes in mangrove area.
Introduction
Mangrove ecosystems are vulnerable to anthropogenic impacts and are being lost at a rapid rate, particularly in the tropics where rates of loss of mangrove forests are estimated at 1–2% year−1 (Valiela et al., 2001; Duke et al., 2007; McLeod et al., 2011). In contrast, temperate mangrove forest, growing in New Zealand, southern Australia, the United States of America, South Africa, Japan, and Brazil has increased in area in recent decades at many locations (Morrisey et al., 2010; Giri et al., 2011).
Rising global carbon emissions and the associated impact on global warming (IPCC, 2013) has led to increased interest in identifying ecosystems with high carbon (C) stock capacity (Canadell and Raupach, 2008). Of particular interest is C stored within coastal vegetation, such as saltmarsh, seagrass, and mangrove (“Coastal Blue Carbon”) ecosystems (McLeod et al., 2011). These ecosystems are known to store considerably higher quantities of C per unit area than many terrestrial systems (McLeod et al., 2011). In addition to storing C, coastal vegetation play an important role storing other nutrients, such as nitrogen (N) (Valiela and Cole, 2002). Excess nutrients in estuarine and coastal systems following mangrove clearance may result in negative impacts on ecosystem function, such as algal blooms, hypoxia, and changes to primary producer communities (Paerl, 2006; Vaquer-Sunyer and Duarte, 2008).
Despite the importance of mangrove ecosystems in storing C and N, the economic value of these services is often not considered in mangrove management decisions (Harty, 2009). Various studies have now provided a monetary value for C and N (Newell et al., 2002; Piehler and Smyth, 2011; Beseres Pollack et al., 2013; Moore and Diaz, 2015) making the value of C and N stocks in estuarine ecosystems easier to assess. The value of 1 ton of C ranges widely, from US $6.20 (New Zealand Unit, NZU, spot price, February 2016) to $220 (Moore and Diaz, 2015). In comparison, the removal of 1 ton of N in estuarine systems has been valued at approximately US $15,000 (Newell et al., 2002; Piehler and Smyth, 2011; Beseres Pollack et al., 2013). Regardless of the pricing model used, these valuations require accurate estimates of C and N stocks within the system.
Allometric functions are often used as a non-destructive method to determine mangrove biomass (Komiyama et al., 2008), which can be converted into C and N stocks. However, allometric equations typically focus on above-ground biomass. Only a few below-ground allometric functions exist for mangroves due to difficulties extracting mangrove roots (Comley and McGuinness, 2005; Komiyama et al., 2008) and no allometric equations exist to directly estimate below-ground C or N stocks in Avicennia marina subsp. australasica. Existing data suggests that below-ground biomass exceeds above-ground biomass stocks in some locations (Briggs, 1977; Mackey, 1993; Tam et al., 1995; Comley and McGuinness, 2005).
Sediment C and N stocks also contribute a considerable proportion of the total amount of C and N in mangrove ecosystems (Howe et al., 2009; Saintilan et al., 2013). Root biomass and sediment C stocks have been observed to be highest in surface sediments, decreasing with increasing depths (Howe et al., 2009; McLeod et al., 2011; Saintilan et al., 2013). Previous studies have also found that sediment C and N stocks increase with increasing distance from the seaward edge of mangrove forests (Ellis et al., 2004; Yang et al., 2013). This is likely related to factors such as age of the forest (Lovelock et al., 2010), the distribution of autochthonous and allochthonous derived C (Ellis et al., 2004), and environmental factors affecting mangrove growth and biomass allocation (Yang et al., 2013).
The aim of this study was to quantify C and N stocks in five temperate A. marina forests and to investigate how C and N stocks change both vertically with sediment depth and horizontally with increasing distance from the seaward edge. Our study is the first to develop allometric equations to estimate C and N stocks in below-ground biomass in A. marina. We used this data to estimate the C and N stocks gained or lost due to changes in mangrove area, and also provide an economic assessment of C and N stocks in temperate A. marina forest.
Methods
Study Sites
A. marina is the dominant mangrove species within temperate mangrove ecosystems and the only mangrove species found in New Zealand (A. marina subsp. australasica), covering approximately 26,050 ha (Morrisey et al., 2010; Spalding et al., 2010). The distribution range extends from the top of the North Island to approximately 38° south (Morrisey et al., 2010). The northern area of the North Island has a warm temperate climate, with mean daily minimum temperatures of 6°C and maximum temperatures of 25°C throughout the course of the year. Mature A. marina trees in New Zealand range in size from < 1 m to over 6 m with taller trees generally found toward the northern distribution range (Morrisey et al., 2010). Mangrove expansion has been associated with increased sedimentation and periods of favorable weather conditions (low wind and wave activity) occurring during El Niño weather patterns, which are predicted to strengthen with climate change (Cane, 2005; Gergis and Fowler, 2009; Morrisey et al., 2010).
Five sites were selected to cover a range of tree size and site characteristics, where no evidence of prior mangrove clearance was detected. Sites were located in four estuaries on the east coast and one estuary on the west coast of the North Island (Table 1). Mature trees ranged from < 1 m (Bayswater) to >4 m (Mangere; Table 2). All selected estuaries are barrier enclosed river embayments, except Waitemata Harbour (Bayswater) which is a drowned valley system (Hume and Herdendorf, 1988). The estuaries have semi-diurnal tides with amplitudes of 1.4–4.1 m (LINZ, 2014). The distance from seaward to landward edge of each mangrove stand was determined using Google Earth™. The age of each stand was estimated by viewing historic aerial photographs using Google Earth™ and Auckland Council GIS viewer (AC, 2016).
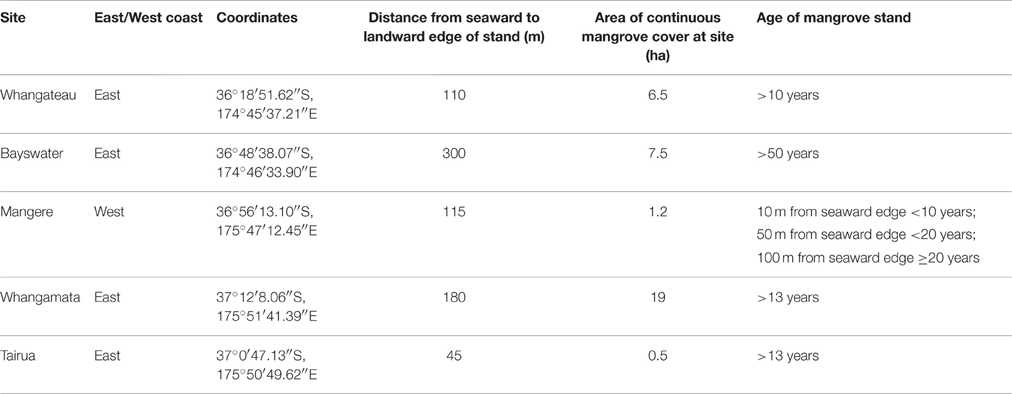
Table 1. Location, age, and area of the study sites.
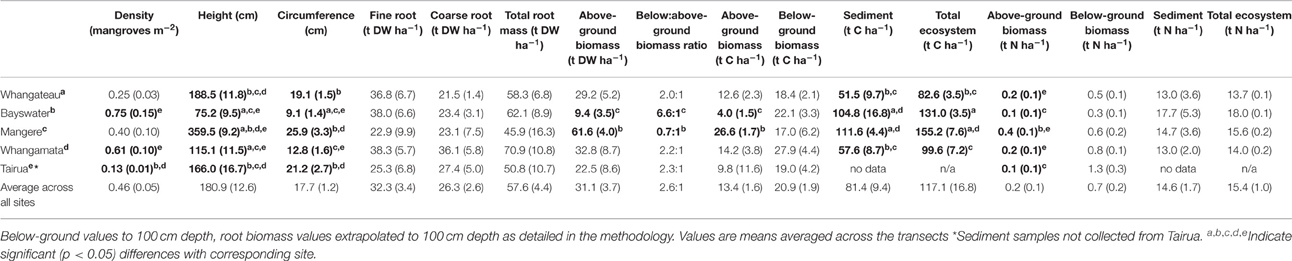
Table 2. Avicennia marina forest characteristics and above and below-ground carbon and nitrogen stocks, New Zealand.
Sampling was undertaken at Tairua during June 2014, at Bayswater and Whangateau during November 2014, and at Mangere and Whangamata during December 2014.
Mangrove Forest Characteristics
At each study site a 100 m transect was set up running from the seaward edge toward the landward edge of the mangrove forest, positioned approximately in the middle of each forest. The distance from seaward edge to landward edge exceeded 100 m at all sites other than Tairua (45 m).
Sampling points were established at 10 m intervals along each transect. As the mangrove stand at Tairua was narrow relative to other stands examined (only 45 m from seaward to landward edge), sampling points were established at 5 m intervals along a 40 m transect. At each sampling point the height, circumference at 30 cm, and number of trees within a 5 × 5 m area was recorded. The height of mangroves was measured using a telescopic measuring pole. The distance to the five closest mangroves at each sampling point was also measured at all sites except Tairua. Seedlings were defined as individuals below 50 cm in height without branches and were not included in measurements. However, at Bayswater, a stunted mangrove stand with mangroves < 1 m in height, we included all branching mangroves < 50 cm as these were reproductive adults. As branching commonly occurred below 30 cm at Bayswater, circumference was measured at 5–10 cm above the ground, rather than 30 cm. Due to unconsolidated sediment conditions limiting site access, tree measurements at the Mangere transect were only undertaken at 10, 50, and 100 m.
Root and Sediment Sampling
At each sampling point a shallow core (15 cm in diameter to a depth of 45 cm) was collected. Soil conditions limited 15 cm diameter cores to 45 cm depth. Cores were haphazardly placed irrespective of the presence of pneumatophores. Sieving through 1 mm mesh was done in the field using water to separate roots from the sediment. All root material (living or dead) was returned to the laboratory and separated into fine (< 2 mm diameter) and coarse (≥2 mm diameter) root material. Pneumatophores were included within below-ground material. Samples were weighed, dried at 60°C until constant dry weight was reached and re-weighed. No separation of these shallower cores into depth intervals was undertaken; values instead represent total fine root/total thick root/total root biomass within each core.
At 10, 50, and 100 m (from the seaward edge) along each transect two deeper cores (3.8 cm in diameter to a depth of 100 cm) were collected. Sediment cores were not collected from Tairua. Sediment conditions limited core depth at some sites, with shell hash or root material blocking the corer. Seven of the 12 pairs of sediment cores captured sediment to depths of 50 to 95 cm. The remaining five pairs captured sediment to 100 cm. One core of each pair was separated into 5 cm depth intervals and the root mass extracted (sieved through a 1 mm sieve) to investigate changes in root mass with increasing depth throughout the sediment column. The second core was separated into 10 cm intervals and used to measure sediment bulk density and C and N concentrations throughout the sediment column.
Carbon and Nitrogen Analysis
Subsamples from root material (fine root, coarse root) collected at the five sites and sediment samples collected at the four sites were dried (60°C for 48 h) and then ground using mortar and pestle. Root material was removed by eye from sediment samples prior to pulverizing. Total C (organic plus inorganic C) and N concentration was determined using an elemental analyser (TruSpec LECO CNS, Leco Corporation, St. Joseph, MI, USA). Sample size was 0.1 g for root and sediment samples. A leaf (NIST SRM 1515—Apple Leaves; 45% C, 2.3% N) and sediment (Soil 1016, Leco Corporation; 2.35% C, 0.18% N) standard was used for calibration of root and sediment samples, respectively. The coefficient of variation was 0.5% for C and 1% N for plant material and 1% for C and N for sediment. Ten Percent of samples were replicated and results were within the range of variation given for the standards.
Data Analysis
Above-ground biomass, C and N per tree was estimated using the allometric equations developed by Bulmer et al. (2016) using circumference data:
Tree biomass, C and N stocks per area were estimated by multiplying tree biomass, C and N stocks (averaged over the five trees per sampling point) times the density at a given sampling point.
The proportion of root biomass (dry weight, C and N stocks) and sediment total C and N at increasing depth intervals throughout the sediment column relative to values to a depth of 100 cm were calculated for each site using 3.8 cm diameter cores. This proportional data was used to extrapolate root biomass to 100 cm for each of the shallower 45 cm depth, 15 cm diameter, cores at each site (which were then used for allometric equations). For each 45 cm depth core, root biomass to 100 cm for each site was extrapolated based on the average root mass (fine, coarse, total) vs. depth relationships obtained from the three 100 cm cores for each site. As the proportion of root mass was highest in the top 45 cm of 100 cm depth cores, the average increase was by 15% to extrapolate 45 cm depth cores to 100 cm. As no 100 cm cores were collected from Tairua, no conversions were made to the shallower 45 cm cores collected from this site. The relationship between sediment C and N stocks and depth from each site was also used to extrapolate sediment total C and N stocks for deeper 3.8 cm diameter cores where shell hash or root material prevented sediment collection to 100 cm. As most C and N was stored in the surface sediments, and the average core depth was 83 cm across the 12 cores, this adjustment was relatively minor (< 10% increase). Sediment total C and N stocks to 100 cm depth were then calculated by averaging values across the three deeper sediment cores for each site.
Uni- and bi-variate linear and non-linear regression analysis was used to develop allometric equations. Response (total below-ground, fine root, and coarse root biomass, C and N stocks) and independent variables (above-ground biomass, distance to individual trees, distance from seaward edge) were natural log transformed (ln) prior to regression analysis.
As ln transformations are associated with underestimating the response data following back transformation (Beauchamp and Olson, 1973) a correction factor (CF) for each model was calculated: CF = exp(standard error of the estimate2/2; Sprugel, 1983). The correction factors are to be applied to the allometric models as follows: y = CF*(exp(a + b * ln(x)).
As data were not normally distributed, a Kruskal-Wallis one way analysis of variance (H) was used to test for significant (p < 0.05) differences in mangrove forest characteristics and below:above-ground biomass ratios between sites (Table 2). If significant differences existed, Dunn's post-hoc test (Q) was performed to identify significantly different factors (p < 0.05).
A two way analysis of variance was used to test for significant (p < 0.05) differences in above, below-ground and total C and N stocks between sites, and with increasing distance from the seaward edge. If significant differences were detected, the Holm-Sidak method (t) was used to identify significantly different factors (p < 0.05).
Spearman's rank order correlation (ρ) was used to test the relationships between response variables (forest characteristics, above, or below-ground biomass; C stocks; N stocks, below: above-ground biomass ratios) and distance from the seaward edge.
Results
Mangrove Forest Structure and Above-Ground Biomass
Mean mangrove density ranged from 0.13 to 0.75 individuals m−2 between sites. Mean tree height ranged from 75.2 to 359.5 cm and circumference from 9.1 to 25.9 cm between sites (Table 2). Significantly lower mangrove tree density m−2 was observed at Tairua than at Whangamata or Whangateau (H = 23.78, df = 4, p < 0.001), but no significant differences were detected in tree density between other sites (Table 2). The mean height and circumference of mangrove trees was significantly lower at Bayswater and Whangamata than at Tairua, Whangateau, or Mangere (H = 29.17, df = 4, p < 0.001, Table 2). Mangrove tree density was positively correlated with distance from the seaward edge across sites (ρ = 0.51, p < 0.001), however no significant relationship was observed between mangrove height or trunk circumference and distance from the seaward edge (p > 0.05).
Estimated mean above-ground biomass across sites, based on allometric equations, was 31.1 ± 3.7 t DW ha−1, increasing significantly from 9.4 ± 3.5 (Bayswater) to 61.6 ± 4.0 t DW ha−1 (Mangere; Q = 2.88, p < 0.05; Table 2). Estimated above-ground biomass was positively correlated with distance from seaward edge across sites (ρ = 0.32, p = 0.045).
Estimated mean above-ground biomass C and N stocks, based on allometric equations, were 13.4 ± 1.6 t C ha−1 and 0.2 ± 0.1 t N ha−1 across sites. Estimated above-ground biomass C stocks were significantly lower at Bayswater (4.0 ± 1.5) than Mangere (26.6 ± 1.7 t C ha−1) (Q = 2.88, p < 0.05). Similarly, estimated above-ground biomass N stocks ranged from 0.1 ± 0.1 (Bayswater) to 0.4 ± 0.1 t N ha−1 (Mangere) with significant differences detected between sites (H = 24.61, df = 4, p < 0.05; Table 2). Estimated above-ground biomass C and N stocks were positively correlated with distance from seaward edge across sites (ρ = 0.31, p = 0.048 and ρ = 0.36, p = 0.019, respectively).
Root Biomass, Root Allometric Equations, Carbon and Nitrogen Concentration, and Stocks
Extrapolated mean below-ground biomass (to 100 cm depth) across sites was 57.6 ± 4.4 t DW ha−1. No significant difference was detected in extrapolated below-ground biomass between sites (H = 1.87, df = 4, p = 0.76; Table 2). However, extrapolated below-ground biomass was positively correlated with distance from the seaward edge across sites (ρ = 0.81, p < 0.001).
Over 85% of the mangrove root biomass (fine, coarse, and total) was located within the top 45 cm of the sediment column across all sites, based on 100 cm cores (Figure 1).
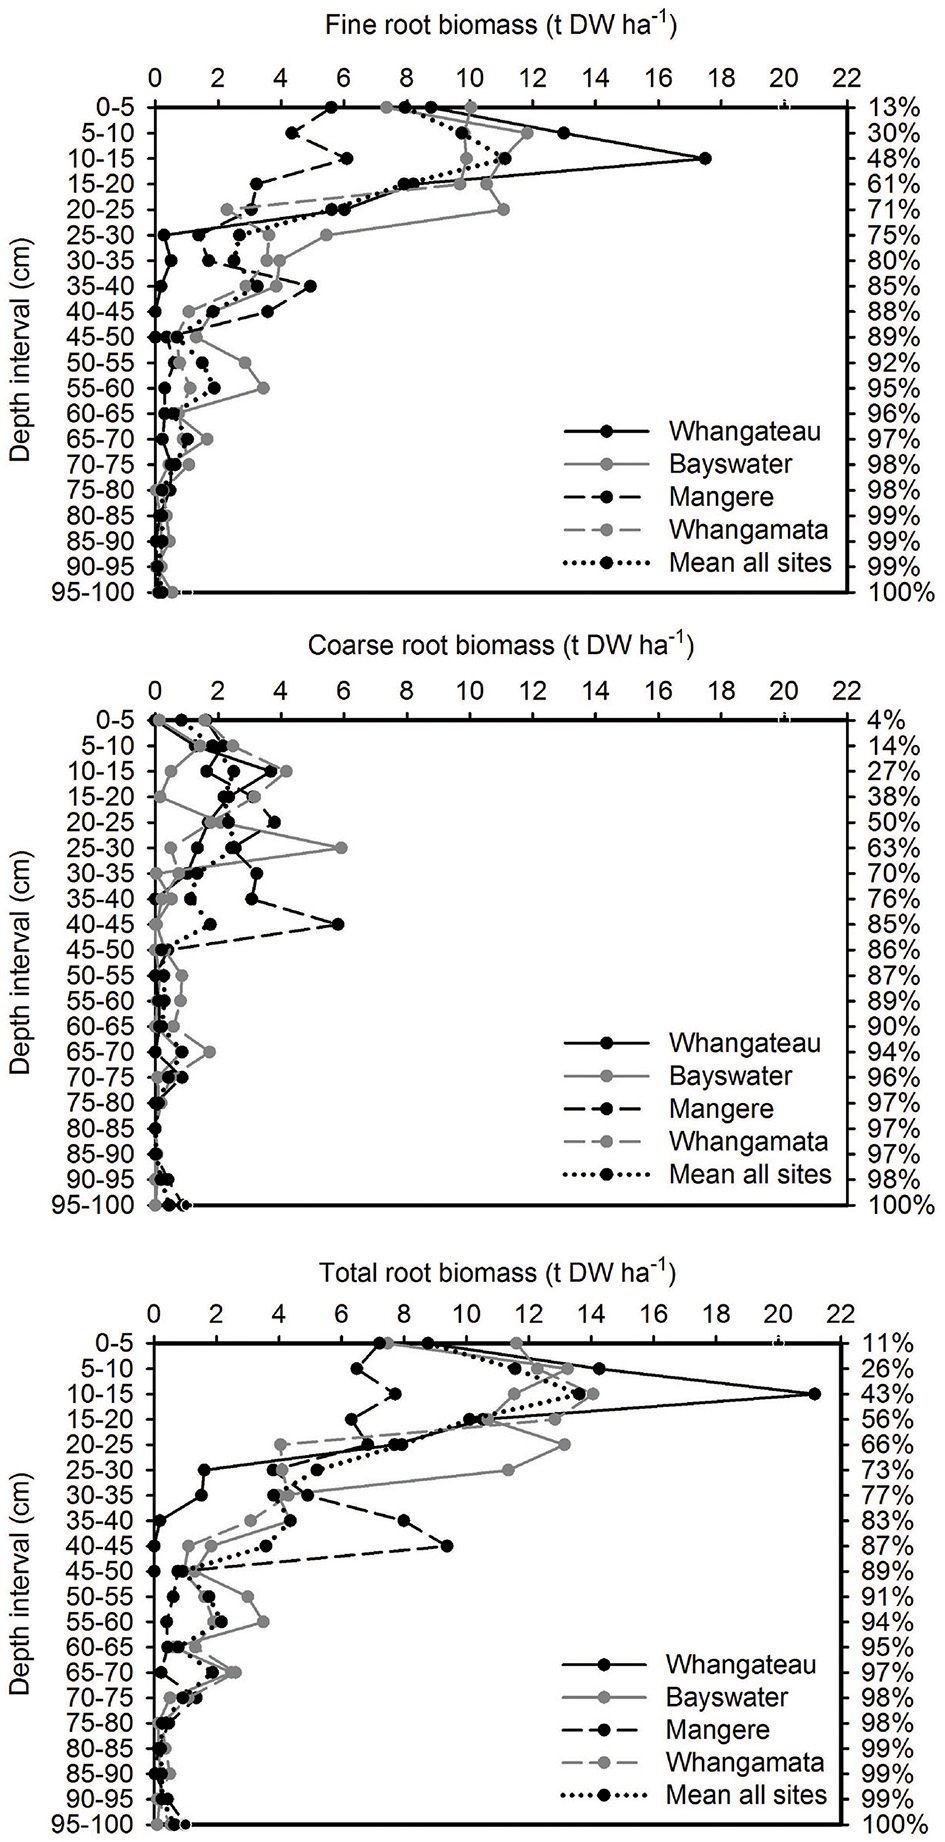
Figure 1. Vertical distribution of root biomass based on 100 cm depth cores (n = 3 per site). Values are t DW ha−1 for each 10 cm depth interval. The cumulative percentage of root biomass captured at increasing depths throughout the sediment column (based on mean from all sites; relative to cores to 100 cm) is shown on the right side of the graph.
The mean C and N concentrations of A. marina roots from shallower 45 cm cores were: fine roots = 32.4% ± 0.8% C and 1.21% ± 0.12% N, coarse roots = 37.9 ± 0.6% C, 0.89 ± 0.11% N. Mean root biomass C and N stocks across sites was 20.9 ± 1.9 t C ha−1 and 0.69 ± 0.17 t N ha−1, respectively. No significant differences were detected in C or N stocks between sites (H = 3.22, df = 4, p = 0.52 and H = 8.86, df = 4, p = 0.07, respectively; Table 2).
The below-ground allometric equations were based on shallower 45 cm root biomass cores, extrapolated to 100 cm depth, collected from five A. marina forests (Table 1). Above-ground measures of mangrove biomass were found to be poor predictors of below-ground biomass or C stocks (r2 ≤ 0.16). The strongest predictor of below-ground biomass (g DW and g C) was distance from the seaward edge (r2 ≥ 0.69, p < 0.001). The strongest predictor of below-ground biomass (g N) was a combination of above-ground biomass and distance from root cores to individual trees (r2 = 0.39, p < 0.001; Table 3).
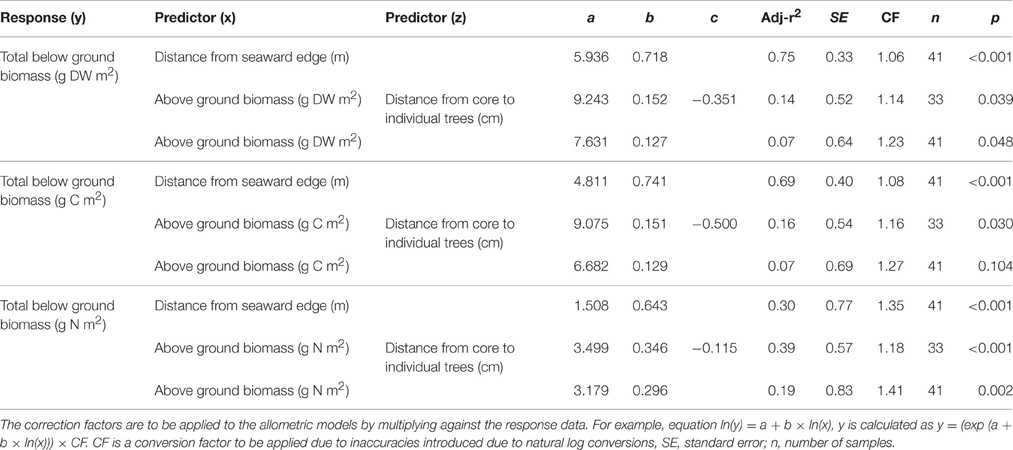
Table 3. Allometric equations for temperate Avicennia marina subsp. australasica below-ground biomass, carbon and nitrogen stocks to 100 cm depth.
Below:above-ground biomass ratios ranged from 0.7:1 (Mangere) to as high as 6.6:1 (Bayswater), with significant differences detected between sites (H = 13.65, df = 4, p = 0.008; Table 2). Above-ground biomass was negatively correlated with below:above-ground ratios across sites (ρ = 0.81, p < 0.001). No significant correlation was observed between below:above-ground ratios and below-ground biomass (ρ = 0.27, p = 0.08), or between below:above-ground ratio and the distance from seaward edge (ρ = 0.03, p = 0.84) across sites.
Sediment Total Carbon and Nitrogen Stocks
Sediment total (inorganic plus organic) C and N stocks were distributed more evenly throughout the sediment column than root biomass, with 56.7 ± 4.9% C (Figure 2) and 57.1 ± 5.8% N (Figure 3) located within the top 50 cm of the sediment column, relative to total values to 100 cm. Sediment total C stocks peaked in the top 10 cm of the sediment column at Whangateau and Whangamata (≥15 t C ha−1), before falling to ≤ 7 tons per ha−1 at deeper intervals. In comparison, at Bayswater and Mangere sediment total C stocks peaked in the top 20 cm of the sediment column (≥15 t C ha−1), and remained elevated compared to Whangateau and Whangamata throughout deeper layers (Figure 2). Sediment total N stocks showed greater variability throughout the sediment column than total C stocks. The highest sediment total N stocks were observed at Bayswater (Figure 3).
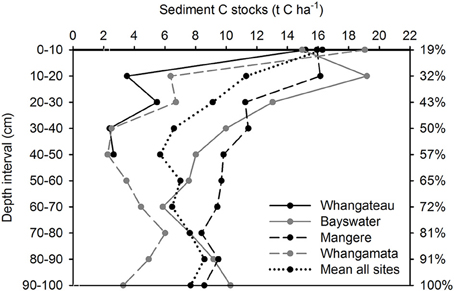
Figure 2. Vertical distribution of sediment total carbon (organic plus inorganic) stocks based on 100 cm depth cores (n = 3 per site). Values are t C ha−1 for each 10 cm depth interval. The cumulative percentage of sediment carbon measured at increasing depths throughout the sediment column (based on mean from all sites; relative to cores to 100 cm) is shown on the right side of the graph.
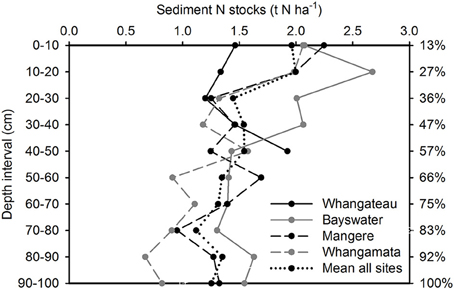
Figure 3. Vertical distribution of sediment total nitrogen stocks to 100 cm. Values are t N ha−1 for each 10 cm depth interval. The cumulative percentage of sediment nitrogen captured at increasing depths throughout the sediment column (based on mean from all sites; relative to cores to 100 cm) is shown on the right side of the graph.
Mean sediment total C and N stocks to 100 cm depth were 81.4 ± 9.4 t C ha−1 and 14.6 ± 1.7 t N ha−1 across sites. Sediment total C stocks ranged from 51.5 ± 9.7 (Whangateau) to 111.6 ± 4.4 t C ha−1 (Mangere), with significant differences detected between sites (F = 24.76, df = 3, p < 0.001; Table 2). Significant differences (F = 9.02, df = 2, p = 0.016) were also detected between sediment total C stocks with increasing distance from the seaward edge, increasing from 64.68 ± 17.42 t C ha−1 at 10 m to 95.75 ± 17.21 t C ha−1 at 100 m across sites (Figure 4). No significant differences were detected in sediment total N stocks between sites (F = 0.39, df = 3, p = 0.76), or at differing distances from the seaward edge across sites (F = 1.66, df = 3, p = 0.27).
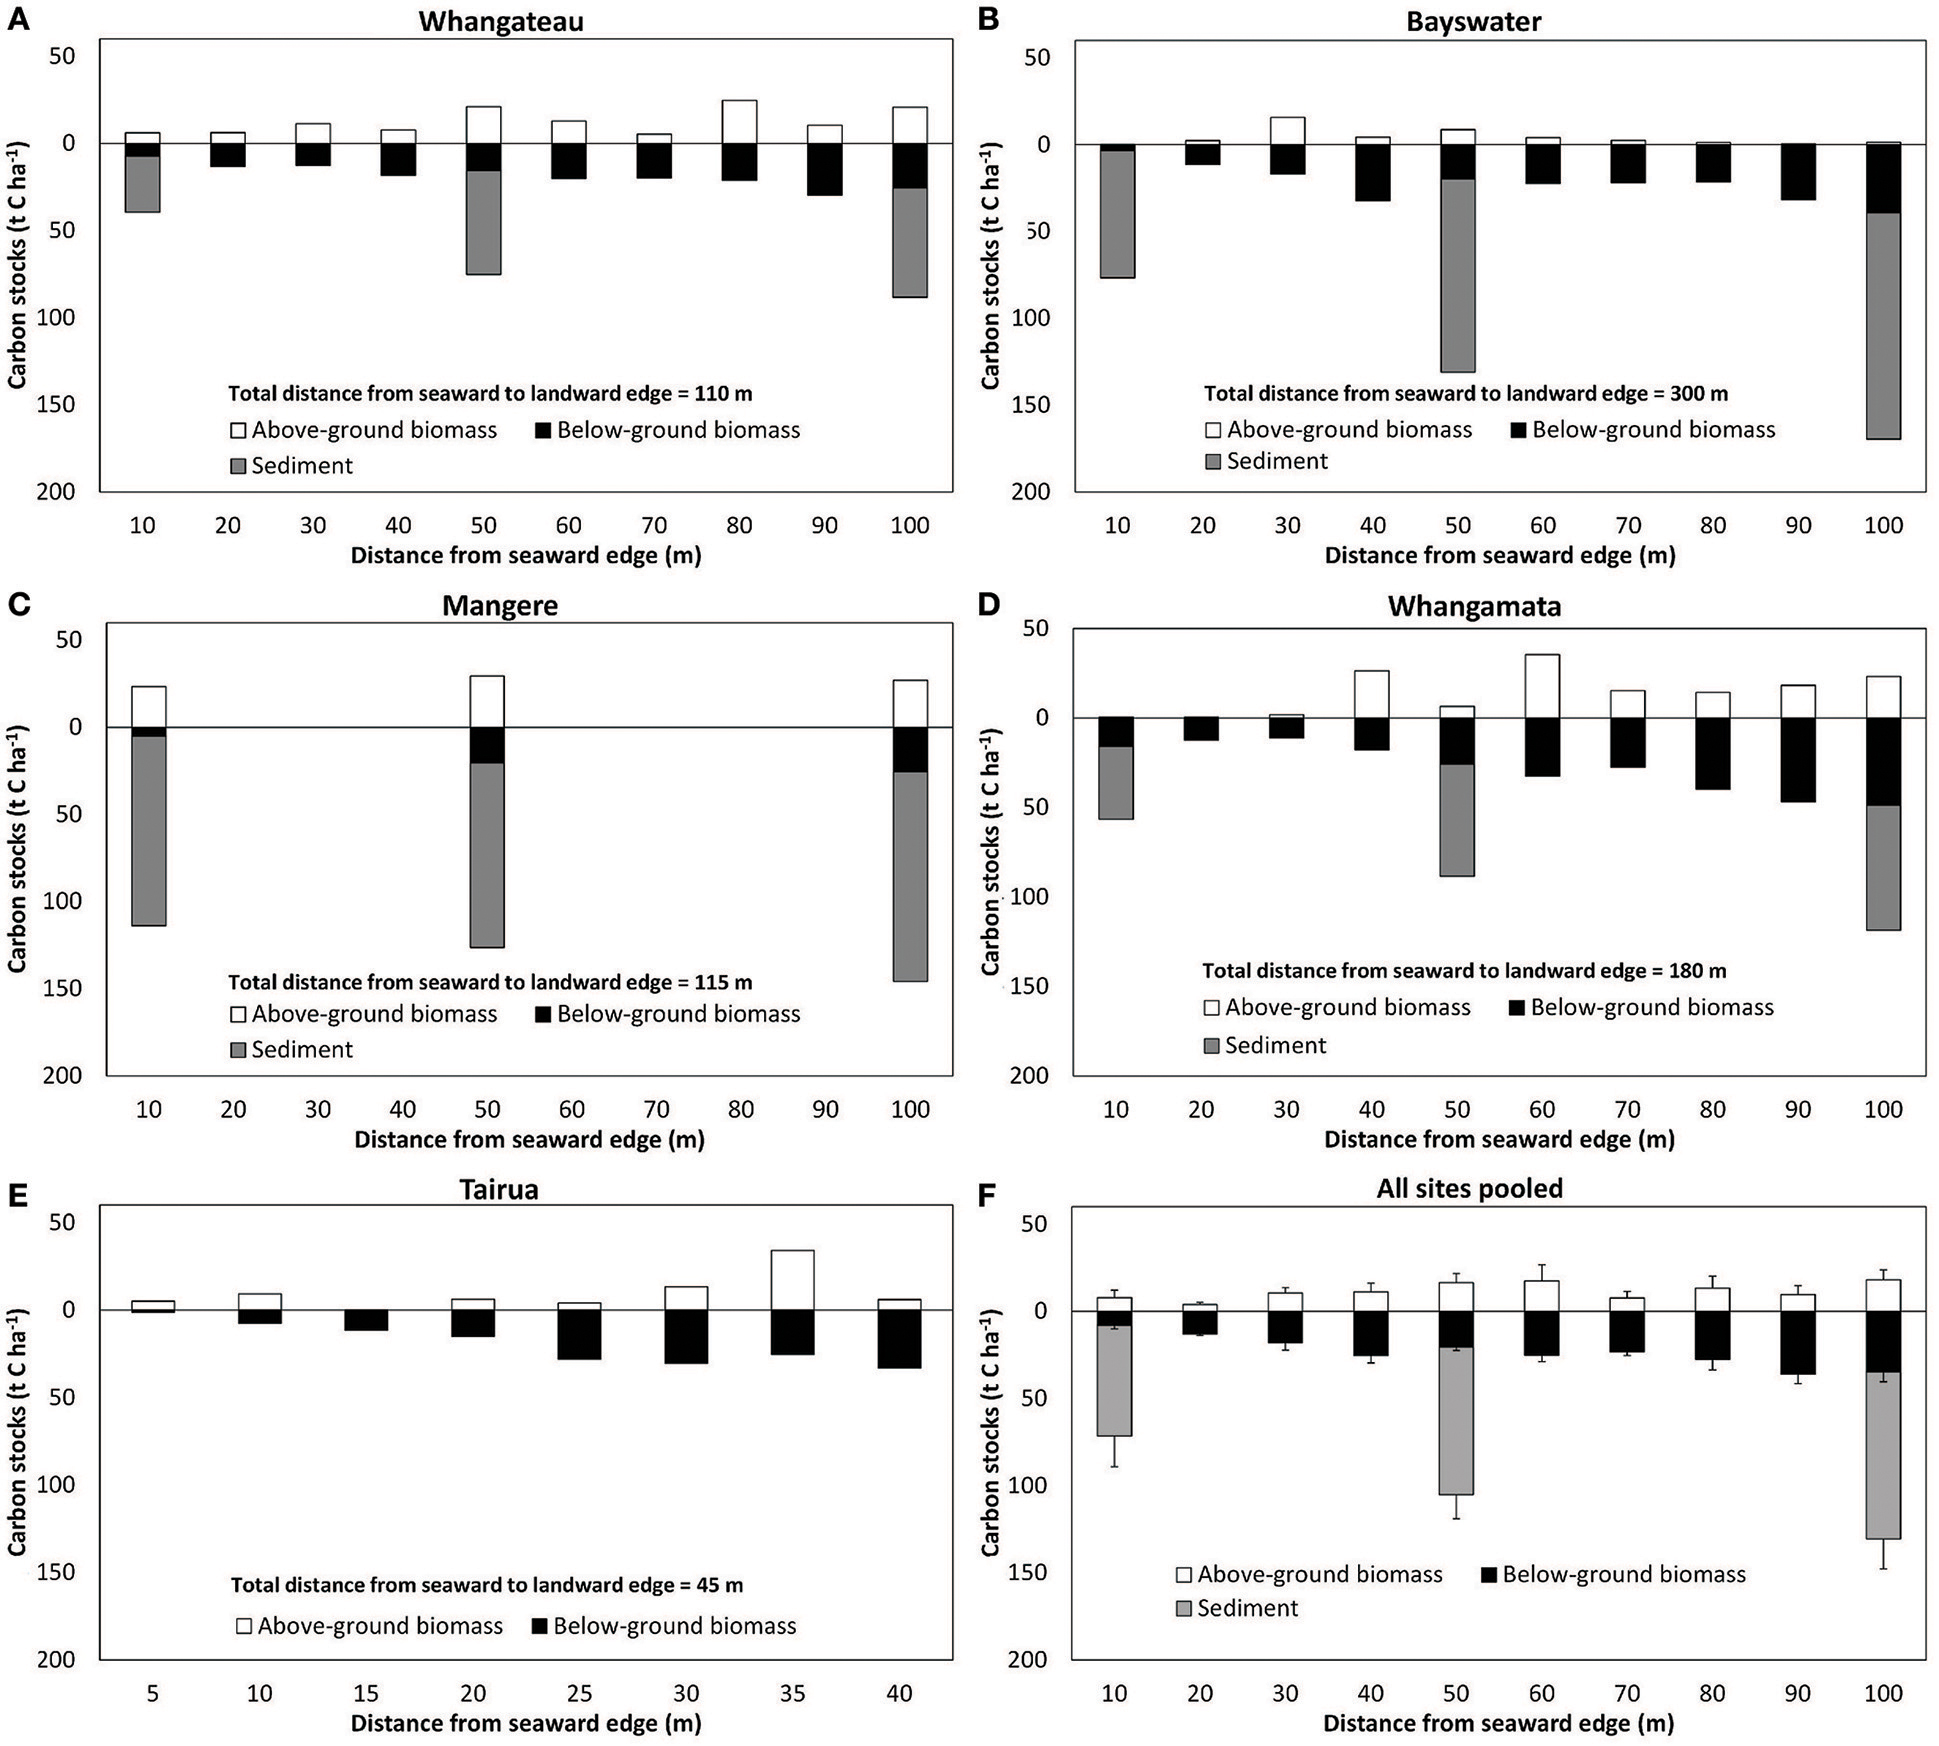
Figure 4. Above and below-ground C stocks in Avicennia marina subsp. australasica forests with distance from the seaward edge. (A–E) are individual sites (n = 1 per sampling position), (F). All sites pooled values are mean ± SE (n = 5 sites). Below-ground C values to 100 cm depth, and below-ground biomass values extrapolated to 100 cm depth as detailed in the methodology. Note difference in x axis for Tairua due to modified sampling design for this narrower mangrove stand, and lack of sediment cores taken at Tairua. Sediment samples were only collected at 10, 50, and 100 m positions from the seaward edge.
Mean sediment C:N ratios were 3.4 ± 0.6:1 at 10 m, 7.4 ± 1.9:1 at 50 m, and 8.0 ± 0.9:1 at 100 m. Significant differences (F = 6.85, df = 2, p = 0.03) were detected between 10 and 50, and 10 and 100 m, intervals.
Total Ecosystem Carbon and Nitrogen Stocks in Temperate A. marina Forests
An estimated 116.1 ± 15.9 t C ha−1 and 15.7 ± 1.1 t N ha−1 was stored within temperate mangrove biomass (above and below-ground) and sediment to 100 cm depth (total ecosystem C and N) across sites (Table 2). Significant higher total ecosystem C stocks were observed at Mangere (155.2 ± 7.6) and Bayswater (131.0 ± 3.5), compared to Whangamata (99.6 ± 7.2) and Whangateau (82.6 ± 3.5; F = 14.59, df = 3, p < 0.05). Total ecosystem C stocks from all sites pooled increased with distance from the seaward edge, from 79.4 ± 19.0 t C ha−1 (10 m) to 148.6 ± 14.2 t C ha−1 (100 m; Figure 4), with significant differences detected between 10, 50, and 100 m (F = 23.23, df = 2, p = 0.001). This trend was consistently observed at individual sites (Figure 4). No significant differences were detected in total ecosystem N stocks between sites (F = 0.31, df = 3, p = 0.82), or at differing distances from the seaward edge (F = 1.31, df = 2, p = 0.34).
Discussion
Mangrove ecosystems are currently undergoing rapid changes in area due to deforestation, changes in land use, and climate (Lovelock et al., 2010; McLeod et al., 2011; Saintilan et al., 2014). Unlike the tropics, where rapid declines in mangrove area have been recorded in recent decades (Valiela et al., 2001; Duke et al., 2007; McLeod et al., 2011), temperate mangroves in New Zealand are expanding in area due to increased sedimentation and climatic factors (Morrisey et al., 2010). In this study we determined above and below-ground biomass, C and N stocks in five temperate A. marina subsp. australasica forests in New Zealand. This information can be used to assess both above and below-ground mangrove biomass and the costs and benefits of changes in mangrove area in regards to C and N stocks.
Below-Ground Biomass and Allometry of Temperate A. marina Forest
Our below-ground biomass values of 45.9 to 70.9 t DW ha−1 (Table 2) are at the low end of values reported for other temperate (30 to 160 t DW ha−1; Briggs, 1977; Lichacz et al., 1984; Saintilan, 1997a) and tropical mangrove forests (28 to 273 t ha−1; Komiyama et al., 2008). Lower biomass in temperate mangroves has been attributed to physiological adaptations to low temperatures which limit tree growth (Morrisey et al., 2010). Distance from the seaward edge was the best predictor of root biomass and C stocks (Table 3). This was possibly related to the age of the forest, with younger mangroves located at the expanding seaward edge. Other studies found above-ground biomass measures such as trunk circumference are good predictors for below-ground biomass in A. marina (r2 > 0.8; Comley and McGuinness, 2005; Patil et al., 2014). The poor relationship between above and below-ground biomass and C stocks in our study may be associated with a shift in biomass partitioning due to environmental conditions (McKee, 1995; Pezeshki et al., 1997; Naidoo, 2009; Alongi, 2011; Castañeda-Moya et al., 2013). For example, factors such as low sedimentation (Lovelock et al., 2007), high salinity (Saintilan, 1997b; Ball, 1998), extreme weather events (Osland et al., 2014), light limitation (McKee, 1995), and increased water depth or flooding (Ye et al., 2003) have been linked to low above-ground biomass in mangrove. Mangroves have also been shown to allocate more biomass below-ground due to nutrient limitation (McKee, 1995; Naidoo, 2009; Alongi, 2011), low soil redox conditions (Pezeshki et al., 1997), high sulfide concentrations, and permanent flooding (Castañeda-Moya et al., 2013).
We observed below:above-ground biomass ratios from 0.7:1 (Mangere) to as high as 6.6:1 (Bayswater). This illustrates the significance of below-ground biomass to total biomass and emphasizes the importance of including below-ground biomass in estimates of total biomass and C and N stocks within temperate A. marina ecosystems. As below-ground biomass was not significantly different between sites and showed no significant correlation with below:above-ground ratios (ρ = 0.27, p = 0.08; Table 2), differences in ratios between sites appear to be due to differences in above-ground biomass. This suggests that above-ground biomass has a higher plasticity to environmental conditions than below-ground biomass. Other studies have also shown that below-ground biomass is a substantial component of total A. marina tree biomass, linked to factors such as salinity (Saintilan, 1997a), tree age (Briggs, 1977), and grain size (Lichacz et al., 1984). Over 65% of total root biomass was located in the top 25 cm of the sediment column in our study. Similar observations have been made for C. tagal growing in Thailand (Komiyama et al., 2000) and Kandelia obovata growing in Japan (Khan et al., 2007).
Total Ecosystem Carbon and Nitrogen Stocks in Temperate A. marina Forests
On average 81.4 ± 9.4 16.8 t C ha−1 was stored in the sediment to 100 cm depth. The total amount of C stored in above and below-ground biomass plus sediment was 117.1 ± 16.8 t C ha−1. These values are within the range observed in other temperate mangrove systems (Howe et al., 2009; Saintilan et al., 2013), yet lower than those values reported from tropical mangrove forests (Table 4; Fujimoto et al., 1999; Alongi et al., 2003; Chmura et al., 2003). Lower C stocks in temperate mangrove forest are predominantly a result of lower mangrove biomass (as described above), as well as lower sediment C stocks. In tropical studies the mangrove forest is typically growing in peat based sediments (Fujimoto et al., 1999; Chmura et al., 2003; Vegas-Vilarrúbia et al., 2010; Donato et al., 2011) while temperate mangrove forests are typically growing in mineral sediments (Howe et al., 2009; Saintilan et al., 2013).
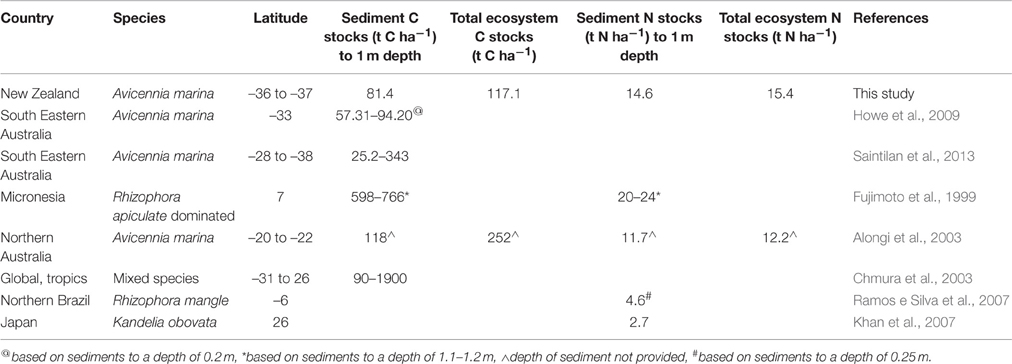
Table 4. Sediment and total ecosystem stocks of carbon and nitrogen within mangrove forests.
We note that differences in site selection are also likely to contribute to differences in total ecosystem C and N stocks between studies. At sites where the mangrove forest is larger in area, total ecosystem C and N stocks are likely to be significantly higher as root biomass and sediment C stocks tend to increase logarithmically with distance from the seaward edge (Figure 4; Table 3; Yang et al., 2013). In addition, as our measurements were conducted toward the seaward edge of the mangrove stands, where mangrove may have only recently established (Morrisey et al., 2010), it is likely that biomass and in particular sediment organic C stocks are lower compared to locations where mangrove have been present for a longer time (Lovelock et al., 2010). This is consistent with observations at Mangere where the mangrove forest has increased in area in the past 20 years (Table 1). Mangrove biomass and sediment C and N at 10 m (occupied for 10 years) and at 50 m (occupied for 20 years) from the seaward edge was found to be lower than at 100 m from the seaward edge (occupied for >20 years; Tables 1, 2).
Mean sediment C:N ratios of 3.4 to 9 observed in this study are lower than observed in the tropics (7–27; Bouillon et al., 2003), suggesting a higher proportion of organic matter derived from marine or estuarine sources at our sites (Bouillon et al., 2003). An increasing gradient of sediment C:N was also observed with increasing distance from the seaward edge of mangrove forests in our study, consistent with an increase in the proportion of terrestrial or mangrove derived organic matter (Thornton and McManus, 1994; Bouillon et al., 2003) with distance from the seaward edge.
Our values for root biomass and total sediment N stocks (15.4 ± 1.0 t N ha−1) are comparable with tropical A. marina growing in northern Australia (root biomass composed of 0.45–0.75% N, ~0.08–0.3 t N ha−1 stored in root biomass, Table 4; Alongi et al., 2003). Our total sediment N stocks are also comparable with other tropical mangrove forests (Fujimoto et al., 1999; Ramos e Silva et al., 2007), yet higher than temperate K. obovata sediment in Japan (Khan et al., 2007; Table 4). We speculate that the comparable sediment N stocks yet lower sediment C stocks in our study may be due to a higher proportion of N input originating from external sources (Bouillon et al., 2003), in comparison to peat based organic material (Fujimoto et al., 1999; Chmura et al., 2003; Vegas-Vilarrúbia et al., 2010; Donato et al., 2011).
Carbon and Nitrogen Value in Temperate A. marina Forests
Temperate mangroves currently occupy ~1.4% of global mangrove area (Morrisey et al., 2010). The global geographic distribution of mangrove is changing due to mangrove loss in the tropics (Duke et al., 2007; Spalding et al., 2010; Donato et al., 2011; Giri et al., 2011) and expansion in temperate regions (Morrisey et al., 2010). Approximately 40–50% of temperate mangrove forests are found in New Zealand (Morrisey et al., 2010). However, A. marina is one of the most commonly occurring mangrove species globally, found throughout the tropics, with the largest geographic range of all mangrove (Morrisey et al., 2010).
Mangrove expansion has led to numerous legal and illegal mangrove clearances throughout New Zealand (Morrisey et al., 2010; Lundquist et al., 2014). Following the procedure described in Donato et al. (2011), the clearing of mangrove forests and associated sediment disturbance was estimated to result in a 100% loss of C stored in mangrove biomass, a 75% loss of C from the top 30 cm of the sediment, and 35% loss from deeper layers of the sediment. Based on this calculation we estimate that the clearance of temperate A. marina area across our study sites could result in a loss of 79 t C ha−1 and 8.3 t N ha−1, to a depth of 100 cm. Based on the conservative NZU pricing we estimate the C-value of the loss of temperate A. marina forests at US $490 ha−1. In addition, the removal of 1 ton of N in estuarine systems has been valued at approximately US $15000 (Newell et al., 2002; Piehler and Smyth, 2011; Beseres Pollack et al., 2013). This is equivalent to US $124000 per ha−1 of A. marina forest, assuming a similar calculation applies. Conversely, as New Zealand's mangrove is estimated to be increasing in area by 1068 ha−1 year−1, we estimate the value of the additional C stocks to be approximately US $523,000 year−1, based on the same calculation. This value increases considerably if estimates by Moore and Diaz (2015) are used (US $18.6 million year−1).
These values are considerable and do not include the monetary value of other ecosystem services provided by intact mangrove, or the cost of mangrove clearance operations, which range from US$2000 to $33000 ha−1 in New Zealand (Murray, 2013; AC, 2015). We note that in the case of mangrove clearance, rather than a rapid loss of C immediately following clearance, the majority of this loss is expected to occur over a number of years to decades following clearance (Bulmer et al., 2015) due to the slow decomposition of organic matter within mangrove sediment (Gladstone-Gallagher et al., 2013). Similarly, a gain of 65.6 t C ha−1 (79 t C ha−1 less 13.4 t C ha−1 derived from above-ground biomass) following mangrove expansion is estimated to take 74 years based on C accrual rates in temperate A. marina sediment of 0.89 t C ha−1 year−1 (Howe et al., 2009).
Conclusions
We found that the amount of C and N stored in temperate mangrove forests is considerable. Our results imply that changes in temperate mangrove area are likely to result in large scale changes in coastal C and N stocks. For mangrove forests where below-ground C and N stocks make up a large proportion of total C and N stocks, such as A. marina, the inclusion of below-ground biomass and sediment to total C and N stocks is essential. The results of this study can be used to inform management decisions for estuarine and coastal systems, currently undergoing rapid changes in mangrove area.
Author Contributions
RB, CL, LS designed, implemented, interpreted, and wrote-up the study. RB analyzed the dataset.
Conflict of Interest Statement
The authors declare that the research was conducted in the absence of any commercial or financial relationships that could be construed as a potential conflict of interest.
Acknowledgments
We thank Jenny Hillman, Will McKay, and Erica Gibbs for field assistance. We would also like to acknowledge NIWA Freshwater and Estuaries Centre core funding for this project (project #FWEH1402 and FWEH1502, “Mangrove ecosystem services”).
References
AC (2015). Auckland Council (AC) Proposed Auckland Unitary Plan. Section 32 report. Appendix 3.32.7.
AC (2016). Auckland Council GIS Viewer. Available online at: http://maps.aucklandcouncil.govt.nz/aucklandcouncilviewer (Accessed on January 25, 2016).
Alongi, D., Clough, B., Dixon, P., and Tirendi, F. (2003). Nutrient partitioning and storage in arid-zone forests of the mangroves Rhizophora stylosa and Avicennia marina. Trees 17, 51–60. doi: 10.1007/s00468-002-0206-2
Alongi, D. M. (2011). Early growth responses of mangroves to different rates of nitrogen and phosphorus supply. J. Exp. Mar. Biol. Ecol. 397, 85–93. doi: 10.1016/j.jembe.2010.11.021
Ball, M. C. (1998). Mangrove species richness in relation to salinity and waterlogging: a case study along the Adelaide river floodplain, northern Australia. Glob. Ecol. Biogeogr. Lett. 7, 73–82. doi: 10.2307/2997699
Beauchamp, J. J., and Olson, J. S. (1973). Corrections for bias in regression estimates after logarithmic transformation. Ecology 54, 1403–1407. doi: 10.2307/1934208
Beseres Pollack, J., Yoskowitz, D., Kim, H.-C., and Montagna, P. A. (2013). Role and value of nitrogen regulation provided by oysters (Crassostrea virginica) in the Mission-Aransas estuary, Texas, USA. PLoS ONE 8:e65314. doi: 10.1371/journal.pone.0065314
Bouillon, S., Dahdouh-Guebas, F., Rao, A. V. V. S., Koedam, N., and Dehairs, F. (2003). Sources of organic carbon in mangrove sediments: variability and possible ecological implications. Hydrobiologia 495, 33–39. doi: 10.1023/A:1025411506526
Briggs, S. V. (1977). Estimates of biomass in a temperate mangrove community. Aust. J. Ecol. 2, 369–373. doi: 10.1111/j.1442-9993.1977.tb01151.x
Bulmer, R. H., Lundquist, C. J., and Schwendenmann, L. (2015). Sediment properties and CO2 efflux from intact and cleared temperate mangrove forests. Biogeosciences 12, 6169–6180. doi: 10.5194/bg-12-6169-2015
Bulmer, R. H., Schwendenmann, L., and Lundquist, C. J. (2016). Allometric models for estimating aboveground biomass, carbon and nitrogen stocks in temperate Avicennia marina forests. Wetlands. doi: 10.1007/s13157-016-0793-0. [Epub ahead of print].
Canadell, J. G., and Raupach, M. R. (2008). Managing forests for climate change mitigation. Science 320, 1456–1457. doi: 10.1126/science.1155458
Cane, M. A. (2005). The evolution of El Niño, past and future. Earth Planet. Sci. Lett. 230, 227–240. doi: 10.1016/j.epsl.2004.12.003
Castañeda-Moya, E., Twilley, R. R., and Rivera-Monroy, V. H. (2013). Allocation of biomass and net primary productivity of mangrove forests along environmental gradients in the Florida Coastal Everglades, USA. For. Ecol. Manage. 307, 226–241. doi: 10.1016/j.foreco.2013.07.011.
Chmura, G. L., Anisfeld, S. C., Cahoon, D. R., and Lynch, J. C. (2003). Global carbon sequestration in tidal, saline wetland soils. Glob. Biogeochem. Cycles 17, 1–12. doi: 10.1029/2002GB001917
Comley, B. W. T., and McGuinness, K. A. (2005). Above- and below-ground biomass, and allometry, of four common northern Australian mangroves. Aust. J. Bot. 53, 431–436. doi: 10.1071/BT04162
Donato, D. C., Kauffman, J. B., Murdiyarso, D., Kurnianto, S., Stidham, M., and Kanninen, M. (2011). Mangroves among the most carbon-rich forests in the tropics. Nature Geosciences 4, 293–297. doi: 10.1038/ngeo1123
Duke, N. C., Meynecke, J.-O., Dittmann, S., Ellison, A. M., Anger, K., Berger, U., et al. (2007). A world without mangroves? Science 317, 41–42. doi: 10.1126/science.317.5834.41b
Ellis, J., Nicholls, P., Craggs, R., Hofstra, D., and Hewitt, J. (2004). Effects of terrigenous sedimentation on mangrove physiology and associated macrobenthic communities. Mar. Ecol. Prog. Ser. 270, 71–82. doi: 10.3354/meps270071
Fujimoto, K., Imaya, A., Tabuchi, R., Kuramoto, S., Utsugi, H., and Murofushi, T. (1999). Belowground carbon storage of Micronesian mangrove forests. Ecol. Res. 14, 409–413. doi: 10.1046/j.1440-1703.1999.00313.x
Gergis, J. L., and Fowler, A. M. (2009). A history of ENSO events since A.D. 1525: implications for future climate change. Clim. Change 92, 343–387. doi: 10.1007/s10584-008-9476-z
Giri, C., Ochieng, E., Tieszen, L., Zhu, Z., Singh, A., Loveland, T., et al. (2011). Status and distribution of mangrove forests of the world using earth observation satellite data. Glob. Ecol. Biogeogr. 20, 154–159. doi: 10.1111/j.1466-8238.2010.00584.x
Gladstone-Gallagher, R. V., Lundquist, C. J., and Pilditch, C. A. (2013). Mangrove (Avicennia marina subsp. australasica) litter production and decomposition in a temperate estuary. N.Z. J. Mar. Freshw. Res. 48, 24–37. doi: 10.1080/00288330.2013.827124
Harty, C. (2009). Mangrove planning and management in New Zealand and South East Australia – A reflection on approaches. Ocean Coast. Manag. 52, 278–286. doi: 10.1016/j.ocecoaman.2009.03.001
Howe, A. J., Rodríguez, J. F., and Saco, P. M. (2009). Surface evolution and carbon sequestration in disturbed and undisturbed wetlandsoils of the Hunter estuary, southeast Australia. Estuar. Coast. Shelf Sci. 84, 75–83. doi: 10.1016/j.ecss.2009.06.006
Hume, T. M., and Herdendorf, C. E. (1988). A geomorphic classification of estuaries and its application to coastal resource management—A New Zealand example. Ocean Shoreline Manag. 11, 249–274. doi: 10.1016/0951-8312(88)90022-7
IPCC (2013). “Climate Change 2013: the physical science basis,” in Contribution of Working Group I to the First Assessment Report of the Intergovernmental Panel on Climate Change, eds T. F. Stocker, D. Qin, G.-K. Plattner, M. Tignor, S. K. Allen, J. Boschung, A. Nauels, Y. Xia, V. Bex, and P. M. Midgley (Cambridge; New York, NY: Cambridge University Press), 1535.
Khan, M. N., Suwa, R., and Hagihara, A. (2007). Carbon and nitrogen pools in a mangrove stand of Kandelia obovata (S., L.) Yong: vertical distribution in the soil–vegetation system. Wetlands Ecol. Manag. 15, 141–153. doi: 10.1007/s11273-006-9020-8
Komiyama, A., Havanond, S., Srisawatt, W., Mochida, Y., Fujimoto, K., Ohnishi, T., et al. (2000). Top/root biomass ratio of a secondary mangrove (Ceriops tagal (Perr.) C.B. Rob.) forest. For. Ecol. Manag. 139, 127–134. doi: 10.1016/S0378-1127(99)00339-4
Komiyama, A., Ong, J. E., and Poungparn, S. (2008). Allometry, biomass, and productivity of mangrove forests: a review. Aquat. Bot. 89, 128–137. doi: 10.1016/j.aquabot.2007.12.006
Lichacz, W., Hardiman, S., and Buckney, R. (1984). Below-ground biomass in some intertidal wetlands in New South Wales. Wetlands (Aust). 4, 56–62.
LINZ (2014). Land Information New Zealand Tide predictions. Available online at: http://www.linz.govt.nz/hydro/tidal-info/tide-tables (Accessed on October 17, 2014).
Lovelock, C. E., Sorrell, B. K., Hancock, N., Hua, Q., and Swales, A. (2010). Mangrove forest and soil development on a rapidly accreting shore in New Zealand. Ecosystems 13, 437–451. doi: 10.1007/s10021-010-9329-2
Lovelock, C., Feller, I., Ellis, J., Schwarz, A., Hancock, N., Nichols, P., et al. (2007). Mangrove growth in New Zealand estuaries: the role of nutrient enrichment at sites with contrasting rates of sedimentation. Oecologia 153, 633–641. doi: 10.1007/s00442-007-0750-y
Lundquist, C. J., Morrisey, D. J., Gladstone-Gallagher, R. V., and Swales, A. (2014). “Managing mangrove habitat expansion in New Zealand,” in Mangrove Ecosystems of Asia, eds I. Faridah-Hanum, A. Latiff, K. R. Hakeem, and M. Ozturk (NewYork, NY: Springer), 415–438.
Mackey, A. (1993). Biomass of the mangrove Avicennia marina near Brisbane, South-eastern Queensland. Mar. Freshw. Res. 44, 721–725. doi: 10.1071/MF9930721
McKee, K. L. (1995). Interspecific variation in growth, biomass partitioning, and defensive characteristics of neotropical mangrove seedlings: response to light and nutrient availability. Am. J. Bot. 82, 299–307. doi: 10.2307/2445575
McLeod, E., Chmura, G. L., Bouillon, S., Salm, R., Björk, M., Duarte, C. M., et al. (2011). A blueprint for blue carbon: toward an improved understanding of the role of vegetated coastal habitats in sequestering CO2. Front. Ecol. Environ. 9, 552–560. doi: 10.1890/110004
Moore, F. C., and Diaz, D. B. (2015). Temperature impacts on economic growth warrant stringent mitigation policy. Nat. Clim. Change 5, 127–131. doi: 10.1038/nclimate2481
Morrisey, D. J., Swales, A., Dittmann, S., Morrison, M. A., Lovelock, C. E., and Beard, C. M. (2010). “The ecology and management of temperate mangroves,” in Oceanography and Marine Biology, eds R. N. Gibson, R. J. A. Atkinson, and J. D. M. Gordon (Boca Raton: CRC Press), 43–160.
Murray, C. (2013). An Assessment of Cost Benefit Analysis Approaches to Mangrove Mangement. Auckland Council Technical Report, TR2013/006. Auckland Council.
Naidoo, G. (2009). Differential effects of nitrogen and phosphorus enrichment on growth of dwarf Avicennia marina mangroves. Aquat. Bot. 90, 184–190. doi: 10.1016/j.aquabot.2008.10.001
Newell, R. I. E., Cornwell, J. C., and Owens, M. S. (2002). Influence of simulated bivalve biodeposition and microphytobenthos on sediment nitrogen dynamics: a laboratory study. Limnol. Oceanogr. 47, 1367–1379. doi: 10.4319/lo.2002.47.5.1367
Osland, M. J., Day, R. H., Larriviere, J. C., and From, A. S. (2014). Aboveground allometric models for freeze-affected black mangroves Avicennia germinans): equations for a climate sensitive mangrove-marsh ecotone. PLoS ONE 9:e99604. doi: 10.1371/journal.pone.0099604
Paerl, H. W. (2006). Assessing and managing nutrient-enhanced eutrophication in estuarine and coastal waters: interactive effects of human and climatic perturbations. Ecol. Eng. 26, 40–54. doi: 10.1016/j.ecoleng.2005.09.006
Patil, V., Singh, A., Naik, N., and Unnikrishnan, S. (2014). Estimation of carbon stocks in avicennia marina stand using allometry, CHN analysis, and GIS methods. Wetlands 34, 379–391. doi: 10.1007/s13157-013-0505-y
Pezeshki, S. R., DeLaune, R. D., and Meeder, J. F. (1997). Carbon assimilation and biomass partitioning in Avicennia germinans and Rhizophora mangle seedlings in response to soil redox conditions. Environ. Exp. Bot. 37, 161–171. doi: 10.1016/S0098-8472(96)01051-9
Piehler, M. F., and Smyth, A. R. (2011). Habitat-specific distinctions in estuarine denitrification affect both ecosystem function and services. Ecosphere 2, 1–17. doi: 10.1890/ES10-00082.1
Ramos e Silva, C. A., Oliveira, S. R., Rêgo, R. D. P., and Mozeto, A. A. (2007). Dynamics of phosphorus and nitrogen through litter fall and decomposition in a tropical mangrove forest. Mar. Environ. Res. 64, 524–534. doi: 10.1016/j.marenvres.2007.04.007
Saintilan, N. (1997a). Above- and below-ground biomass of mangroves in a sub-tropical estuary. Mar. Freshw. Res. 48, 601–604. doi: 10.1071/MF97009
Saintilan, N. (1997b). Above- and below-ground biomasses of two species of mangrove on the Hawkesbury River estuary, New South Wales. Mar. Freshw. Res. 48, 147–152. doi: 10.1071/MF96079
Saintilan, N., Rogers, K., Mazumder, D., and Woodroffe, C. (2013). Allochthonous and autochthonous contributions to carbon accumulation and carbon store in southeastern Australian coastal wetlands. Estuar. Coast. Shelf Sci. 128, 84–92. doi: 10.1016/j.ecss.2013.05.010
Saintilan, N., Wilson, N. C., Rogers, K., Rajkaran, A., and Krauss, K. W. (2014). Mangrove expansion and salt marsh decline at mangrove poleward limits. Glob. Chang. Biol. 20, 147–157. doi: 10.1111/gcb.12341
Sprugel, D. G. (1983). Correcting for bias in log-transformed allometric equations. Ecology 64, 209–210. doi: 10.2307/1937343
Tam, N. F. Y., Wong, Y. S., Lan, C. Y., and Chen, G. Z. (1995). Community structure and standing crop biomass of a mangrove forest in Futian Nature Reserve, Shenzhen, China. Hydrobiologia 295, 193–201. doi: 10.1007/BF00029126
Thornton, S. F., and McManus, J. (1994). Application of organic carbon and nitrogen stable Isotope and C/N Ratios as source Indicators of organic matter provenance in estuarine systems: evidence from the Tay Estuary, Scotland. Estuar. Coast. Shelf Sci. 38, 219–233. doi: 10.1006/ecss.1994.1015
Valiela, I., Bowen, J. L., and York, J. K. (2001). Mangrove forests: one of the world's threatened major tropical environments. Bioscience 51, 807–815. doi: 10.1641/0006-3568(2001)051[0807:MFOOTW]2.0.CO;2
Valiela, I., and Cole, M. L. (2002). Comparative evidence that salt marshes and mangroves may protect seagrass meadows from land-derived nitrogen loads. Ecosystems 5, 92–102. doi: 10.1007/s10021-001-0058-4
Vaquer-Sunyer, R., and Duarte, C. M. (2008). Thresholds of hypoxia for marine biodiversity. Proc. Natl. Acad. Sci. U.S.A. 105, 15452–15457. doi: 10.1073/pnas.0803833105
Vegas-Vilarrúbia, T., Baritto, F., López, P., Meleán, G., Ponce, M. E., Mora, L., et al. (2010). Tropical Histosols of the lower Orinoco Delta, features and preliminary quantification of their carbon storage. Geoderma 155, 280–288. doi: 10.1016/j.geoderma.2009.12.011
Yang, J., Gao, J., Cheung, A., Liu, B., Schwendenmann, L., and Costello, M. J. (2013). Vegetation and sediment characteristics in an expanding mangrove forest in New Zealand. Estuar. Coast. Shelf Sci. 134, 11–18. doi: 10.1016/j.ecss.2013.09.017
Keywords: blue carbon, mangrove, below-ground biomass, Avicennia, allometry, nitrogen
Citation: Bulmer RH, Schwendenmann L and Lundquist CJ (2016) Carbon and Nitrogen Stocks and Below-Ground Allometry in Temperate Mangroves. Front. Mar. Sci. 3:150. doi: 10.3389/fmars.2016.00150
Received: 06 June 2016; Accepted: 04 August 2016;
Published: 23 August 2016.
Edited by:
Iris Eline Hendriks, University of the Balearic Islands, SpainReviewed by:
Jorge Luis Gutiérrez, Grupo de Investigación y Educación en Temas Ambientales, ArgentinaMaria Vernet, University of California, San Diego, USA
Copyright © 2016 Bulmer, Schwendenmann and Lundquist. This is an open-access article distributed under the terms of the Creative Commons Attribution License (CC BY). The use, distribution or reproduction in other forums is permitted, provided the original author(s) or licensor are credited and that the original publication in this journal is cited, in accordance with accepted academic practice. No use, distribution or reproduction is permitted which does not comply with these terms.
*Correspondence: Richard H. Bulmer, bulmer.richard@gmail.com