Predicting the Composition of Polychaete Assemblages in the Aegean Coast of Turkey
 Marika Galanidi
 Gokhan Kaboglu
 Kemal C. Bizsel
- Institute of Marine Sciences and Technology, Dokuz Eylül University, İzmir, Turkey
Benthic infaunal species and communities have been extensively used to evaluate quality of the marine environment. Within the MSFD, community composition is addressed most commonly through Descriptor 6 (Seafloor integrity), criterion 6.2 (Condition of benthic communities). At the same time, the Directive has stipulations for addressing and assessing indicators linked with pressures in an explicitly spatial manner. At larger scales, achieving this through point sampling may be impractical or unfeasible; hence predictive methods are being increasingly employed to produce the large scale spatial data that are often required for marine spatial planning and management. The aim of the current work was to develop statistical and spatial modeling tools that can predict the distribution of soft-sediment benthic polychaetes in the Aegean coast of Turkey. To do that, we employed Species Archetype Models (SAMs), a novel analytical and modeling framework which uses mixture models to cluster species responses to the environment, producing a number of “archetypal” responses assumed to represent species with similar ecological/physiological tolerances. Polychaete presence/absence data were obtained from the literature and modeling was performed against environmental variables reflecting the main natural and anthropogenic gradients in the region. The resulting models are interpreted in light of the sensitivity/tolerance classification scheme for benthic invertebrates. Three Species Archetypes were identified through the analysis. In brief, Species Archetype 1 consists of the most prevalent species in the dataset and primarily follows the salinity and temperature gradients. Species Archetype 2, present in the central and southern Aegean, is dominated by sensitive and indifferent species and responds negatively to chlorophyll a, whereas Species Archetype 3 represents mostly tolerant and opportunistic polychaetes with increased probability of occurrence in eutrophic, shallow, inshore areas throughout the region. Predictive performance was constrained by the information contained in our data. These results from a limited data set show promise that SAMs as a modeling tool can offer valuable insights into patterns of benthic species distribution and coexistence and increase our capacity to provide predictive advice.
Introduction
The Marine Strategy Framework Directive is the current legal framework under which EU Member States are required to assess and protect the health of the marine environment with the ultimate target of achieving “Good Environmental Status” (EU, 2008). Understanding the links between the different components of marine ecosystems and the pressures resulting from human activities is a key element of the conceptual framework underpinning the MSFD and a prerequisite for the effective management of the seas (Smith et al., 2014; Berg et al., 2015). At the same time, the Directive has stipulations for addressing and assessing indicators linked with pressures in an explicitly spatial manner. This has a number of implications for the design of monitoring and assessment strategies, starting from defining meaningful and relevant ecological scales to demonstrate state-pressure links (Lynam et al., 2015) and establish the “naturalness” or natural background variability of the system in order to set reference conditions for assessment or environmental targets for management (Van Hoey et al., 2010). Strengthening this knowledge base can be greatly aided by modeling tools and predictive methods for the distribution of species and communities according to their responses to environmental parameters (Reiss et al., 2015).
Benthic infaunal species and communities, due to their space-use patterns and well-documented relationships with various forms of ecological stress (Gray and Elliott, 2009), are a biotic group that has been proven highly appropriate to demonstrate natural and anthropogenic impacts to the seabed and is extensively used to evaluate the quality of the marine environment (Muxika et al., 2005; Dimitriou et al., 2012; HELCOM, 2013). Community composition of the benthos is addressed within the MSFD most commonly through Descriptor 6 (Seafloor integrity), criterion 6.2 (Condition of benthic communities) and is currently better addressed by what we could call traditional ecological indices (Piroddi et al., 2013). These are based on the Pearson and Rosenberg paradigm (Pearson and Rosenberg, 1978) that describes the responses and succession of benthic invertebrates to the organic enrichment gradient and generally rely on the proportion of opportunistic to sensitive species in benthic samples (Carletti and Heiskanen, 2009). Modeling capabilities that can produce information and indicators to address community condition are currently lacking (Piroddi et al., 2015; Tedesco et al., 2016) and the development of habitat suitability models is encouraged in order to address this gap (Tedesco et al., 2016).
Current approaches for the assessment of soft-sediment benthic habitats within the framework of the MSFD include 3 steps, (i) defining habitat types, (ii) setting reference/target conditions taking into account the natural background variability of each habitat, and (iii) choosing suitable indicators for assessment (Van Hoey et al., 2013). With respect to the first step, predictive modeling of community composition has been extensively employed to integrate the biological components of the seabed with physical characteristics in order to define and map benthic habitats. This is usually accomplished with some application of the “assemble first–predict later” approach, sensu Ferrier and Guisan (2006), whereby communities or species groups are usually first delineated through algorithmic multivariate analyses, followed by modeling of these entities against environmental parameters (Degraer et al., 2008; Buhl-Mortensen et al., 2014, 2015; Gonzalez-Mirelis and Buhl-Mortensen, 2015; Gogina et al., 2016; Rubidge et al., 2016). While variations of this strategy have served the modeling community well, they have their shortcomings and limitations. For instance, distance-based methods have been criticized for confounding location and dispersion effects by misspecifying the mean-variance relationship in the data (Warton et al., 2012) with severe consequences in identifying “characteristic” taxa and detecting multivariate effects. As another example, sites that are not well classified in the “assemble” step and are commonly assumed to represent transitional communities result in entities that are either poorly predicted (Gogina et al., 2016) or are discarded from the “predict” step (Degraer et al., 2008), resulting in information loss that can be substantial for limited data sets.
A recent surge of interest in model-based methods for the analysis of multivariate data has resulted in an expanding number of statistical tools that offer an alternative to site-based multivariate analyses by making species or species groups the response unit, thereby allowing formal description and inference about their relationship with environmental variables and a greater flexibility in modeling species co-existence (Warton et al., 2015b). These include methods for unconstrained ordination (Hui et al., 2014; Hui, 2015), correspondence analysis (Pledger and Arnold, 2014), exploring community-environment associations and fitting predictive models (Wang et al., 2012), model selection (Madon et al., 2013). A major challenge however when modeling multiple species responses to the environment is how to reduce the number of coefficients in the model based on ecologically meaningful criteria (Dunstan et al., 2013b; Warton et al., 2015a), both for computational but also for interpretability reasons. For soft sediment benthos this is even more pertinent since, with the exception of habitat forming and alien/invasive species, it is the response of the assemblage that is usually of greater interest.
A statistical approach that achieves model reduction by “seeking shared patterns in environmental filtering” (Ovaskainen et al., 2016) is Species Archetype Models (SAMs) (Dunstan et al., 2011). SAMs is a regression-based modeling method which uses mixture models to cluster species responses to the environment, producing a number of “archetypal” responses assumed to represent species that have similar ecological/physiological tolerances. As such they are likely to respond to pressures in a similar manner and consequently require similar management measures. SAMs have been used so far for purposes of bioregionalization (Woolley et al., 2013), exploring competing concepts of community assembly (Leaper et al., 2014) and investigating fish-assemblages' responses to bottom trawling pressure (Foster et al., 2015).
In the current study Species Archetype Models are employed to examine group responses of soft-sediment polychaetes to natural and anthropogenic gradients and produce modeling tools to predict their distribution in the Aegean coast of Turkey. Aiming to present modeling outputs that can be interpreted according to the same principles underlying the assessment of benthic community condition, the resulting models are presented in light of the sensitivity/tolerance classification scheme for benthic invertebrates (Grall and Glémarec, 1997). Thus, this approach brings together elements of habitat modeling with the concept of sensitivity to disturbance (used here as a collective term that encompasses a number of different impact sources eliciting similar responses–Rosenberg, 2001; Muxika et al., 2005; Josefson et al., 2009; De Backer et al., 2014). Combined with the ability of SAMs to model simultaneously species clustering with their response to the environment, it is believed that this modeling framework can offer valuable insights into the drivers of benthic assemblage composition and the scales at which significant patterns occur.
Methods
Data
Benthic Data
The biological data consist of a matrix of polychaete presence/absence (total of 327 taxa) by 52 sites. Samples were collected in August 2011 with a Van Veen grab sampling an area of 0.1 m2 during a pollution monitoring project —see (Çinar and Dagli, 2013) for details–and the locations are presented in Figure 1. Species present in at least 5 stations were divided into Ecological Groups according to the sensitivity/tolerance classification scheme as summarized in Grall and Glémarec (1997).
Group I: Species very sensitive to organic enrichment and present in normal conditions.
Group II: Species indifferent to enrichment, always present in low densities with non-significant variations in time.
Group III: Species tolerant of excess organic matter enrichment. These species may occur in normal conditions but their populations are stimulated by organic enrichment.
Group IV: Second-order opportunistic species. These are the small species with a short life cycle, adapted to a life in reduced sediment where they can proliferate.
Group V: First-order opportunistic species. These are the deposit feeders that proliferate in sediments reduced up to the surface.
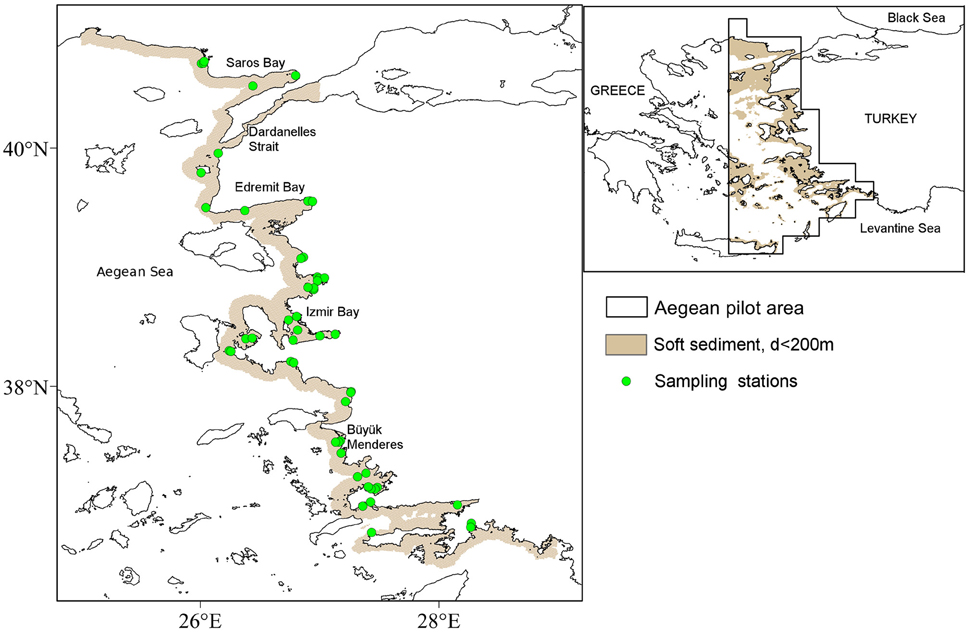
Figure 1. Small map: Aegean Sea with the extent of the Aegean pilot area defined within the DEVOTES project and soft-sediment areas of the seabed with depths <200 m in light brown. Big map: Model prediction area (i.e., shallow, soft-sediment areas extending up to 10 km from the mainland coastline) in light brown with sampled locations for benthic polychaetes.
Species were assigned sensitivity scores (Ecological Group shown in Table S1) following a national database constructed specifically for the benthic invertebrates of Turkish waters (TUBITAK-MRC and MoEU-GDEM, 2014; Çinar et al., 2015). The choice of a local classification database as opposed to a more widely used one (e.g., the AMBI classification database) was driven by findings that species can shift their tolerances between biogeographic regions with different dominant environmental gradients (Zettler et al., 2013) and the need to adjust species classification to ecological groups identified for the Aegean by Simboura and Reizopoulou (2007) and Çinar et al. (2012).
Environmental Data
A number of publically available gridded data were screened and predictors were chosen (Table 1) based on their relevance to benthic infauna distribution patterns. Sea Surface Temperature is used to define broad biogeographical regions (related to species distributions at geological timescales) and, together with salinity define different water masses, whereas bottom temperature and salinity are directly relevant to species' physiological tolerances. Salinity can be particularly important in areas of substantial freshwater input such as shallow and estuarine environments (Reiss et al., 2015). In this study, we used winter (February data) and summer (August data) bottom temperature and salinity in order to capture the seasonal gradients observed along the coast. Euphotic depth determines the depth at which photosynthesis can occur and macrophytes can exist. This can be important for the benthos, especially in the current study where a number of samples were collected from within or around Posidonia oceanica beds. Primary production is the most common descriptors of trophic condition for marine waters.
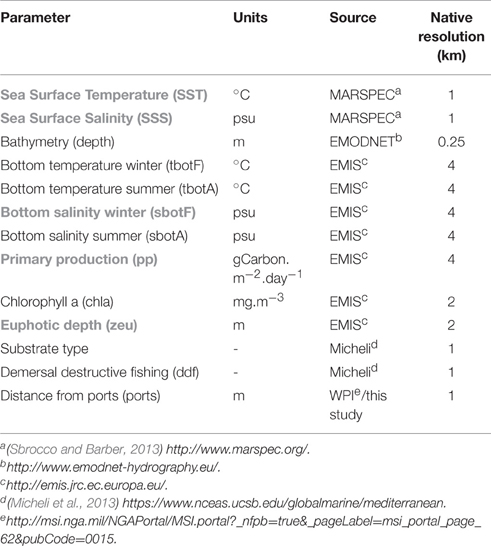
Table 1. Environmental variables considered for modeling polychaete assembalges (abbreviations in brackets used throughout the document, variables highlighted with gray were removed from the analysis due to collinearity problems).
As far as pressure variables are concerned, chlorophyll a concentration was regarded as a measure of eutrophication. Demersal destructive fishing is one of the most important anthropogenic activities with well-known and documented impacts on the benthos (Kaiser et al., 2006; Hiddink et al., 2009). The fishing pressure index included in this study was constructed from spatial disaggregation of landings data and is used in full knowledge of its limitations and criticisms (Halpern et al., 2008; Heath, 2008) especially regarding its reliability to represent impacts on the seabed. Distance from major ports was considered as a pressure variable encompassing a number of processes, such as increased turbidity and disturbance from re-suspension, ship-based pollution and the presence of exotic/invasive polychaete species transferred by ballast water, an issue well-documented in Izmir Bay (Çinar et al., 2006, 2012).
All environmental layers we initially clipped to the extent of the eastern Aegean pilot area (Figure 1) defined for the DEVOTES project (http://www.devotes-project.eu/study-sites/), projected to geographic projection Lambert Azimuthal Equal Area centered on the Mediterranean sea and resampled by bilinear interpolation to a common resolution of 1 km2. Rasters were subsequently masked by the extent of the soft sediment areas at depths of 0–200 m, (layer extracted from https://www.nceas.ucsb.edu/globalmarine/mediterranean). Finally, model predictions were restricted to soft-sediment areas of the seabed extending up to 10 km from the shore, in order to reduce the extent of unsampled locations in covariate space. 10 km is an arbitrarily chosen distance which covers all sampled locations (largest distance from the coastline for any sampling site was approximately 9 km). Data coverage was not the same for all environmental layers; poor fit between the end of the predictor layer and the coastline were filled by interpolation. Point values of the predictor variables at the 52 stations were extracted from continuous layers with the extract function of the raster package (ref) in R. Spatial analysis was carried out in R (R Core Team, 2014) and SAGA GIS (Conrad et al., 2015).
Chlorophyll a and distance from ports were log(x+1) transformed prior to analysis. Collinearity of the environmental variables was investigated with the Variance Inflation Factor method with a cut-off threshold of 3 and with Spearman's correlation coefficient >0.7. Primary production, euphotic depth and chlorophyll a were highly collinear; retaining chlorophyll a in the predictor data set reduced the VIF to acceptable levels and was considered preferable as it indicates both trophic conditions and eutrophication pressure. Similarly, Sea Surface Temperature and Sea Surface Salinity were correlated with each other (at r > 0.7) and with bottom temperature and were discarded from further analysis, as was winter bottom salinity with summer bottom salinity. It was considered that high summer bottom salinity better reflects stress imposed on benthic organisms within the range of salinity values investigated and was thus included in the data set. For final mapped outputs of selected predictor variables (Table 1) see Figure S1.
Modeling
Multi-species responses to environmental variables were modeled by mixing generalized linear models (GLMs) employing finite mixture models in a method developed by Dunstan et al. (2011) and implemented in the R package “SpeciesMix” (Dunstan et al., 2013a). The finite mixture model has the capability to identify species with statistically indistinguishable responses to environmental gradients, parametrize the individual GLMs and cluster them into one or more common generalized linear models without any supervision. The resulting models are termed Species Archetypes and may represent one or many species that have similar ecological/physiological tolerances. The estimation of the group composition occurs simultaneously with the estimation of the shared response, such that the fitted models return both the probability of a species belonging to a particular species archetype and the model components (coefficients and standard errors) of the archetypal GLMs which describe the response of that entire group to the environment (Leaper et al., 2014).
Because species are classified into archetypes in a probabilistic manner (Hui et al., 2013), it is possible by a species to be represented by more than one archetype, and the probabilities of species membership to archetypes (tau) are an indication of how well a species response is aligned with each archetypal response. In order for all species to be assigned to an archetype, membership in the present study was defined based on a probability threshold of 0.5, however, the implications of different membership probabilities are discussed later in the manuscript, following Foster et al. (2015), who consider a probability>0.8 to mean that a species is strongly affiliated to the particular Archetype, whereas probabilities between 0.5 and 0.8 are interpreted as indicative of species membership to an Archetype.
In our analyses linear and quadratic terms were considered in order to increase the flexibility of the models to capture species responses (Leaper et al., 2014; Woolley et al., 2013) and covariates were standardized to zero mean and unit standard deviation to avoid dimensional issues. The biological response matrix included taxa present in at least 5 stations (109 taxa). Model selection was performed in two steps. (I) Determining the number of archetypes (G) was achieved by comparing models fitted with all covariates (including linear and quadratic terms) with different numbers of species archetypes; the model with the lowest Bayesian Information Criterion (BIC) is considered the most parsimonious and is used to select the number of archetypes. Multiple starts were performed in order to avoid convergence at local maxima (Dunstan et al., 2013b). (II) Further variable selection was based on minimisation of the BIC and examination of the Standard Errors (SEs) of the coefficients for the model terms (with optimum G determined in the previous step). Coefficients with high relative standard errors (RSE) are considered of lower importance. Moreover, coefficients which never exhibited low SEs and RSEs for any of the Species Archetypes were preferentially removed from the model. The model with the lowest BIC was retained for predictive mapping of the resulting Species Archetypes' distribution.
Covariate effects of the final model predictors were also visualized with partial effects plots were the effect of each covariate is modeled separately, while all other covariates are held at their respective means.
The performance of the models was evaluated for individual species. We did not fit individual species models. Rather, expected probabilities of occurrence were calculated for every species i per station j (εij) from the predicted probability of occurrence of each archetype per station and the species tau for each archetype (given in Table S1) according to the formula.
where pj is the probability of occurrence of each archetype for station j and taui is the membership probability of species i for each archetype.
Predictions were obtained with the function predict. archetype in the SpeciesMix package from the fitted archetype models, hence no individual model selection was performed.
The terms were added, since the combined probability of presence of each species in all archetypes (sum of tausi) cannot be higher than 1 and the probability of presence of each archetype in every station is independent of the probability of presence of all other archetypes in the same location.
Once expected and observed frequencies were obtained and tabulated per species and station, model performance was assessed in two ways. Model accuracy was assessed with Spearman's correlation coefficient and discriminatory power (ability to correctly predict absences and presences) with the Area Under the receiver operator characteristic (ROC) Curve with the package modEvA (Barbosa et al., 2015).
Results
Initial model selection was performed for values of G ranging from 1 to 8 and the number of Archetypes that minimized the Bayesian Information Criterion was G = 3 (BIC = 5727, Table S1). Subsequent variable selection for three Species Archetypes retained summer bottom salinity, winter bottom temperature, depth, chlorophyll a and distance from port as predictors. Quadratic terms for bottom temperature and salinity were also included in the most parsimonious model with BIC = 5714.
Archetype membership for most of the species was well estimated with probability values close to 1, particularly for Species Archetype 1 (Table S1). Out of the 109 modeled taxa only 8 were indicatively affiliated with an Archetype (0.5 < tau < 0.8) and most of them belong to Species Archetype 3. Species Archetype 2 (SA2) contains the highest number of species (S = 60), followed by Species Archetype 3 (SA3) with 28 species and Species Archetype 1 (SA1) which represents the 21 most frequently observed species.
In terms of composition, all three archetypes seem to be dominated by species belonging to ecological groups EGII (disturbance indifferent) and EGIII (tolerant) (Figure 2). What differentiates them is the higher relative representation of EGII in Species Archetype II, the relative proportions of the other ecological groups and the species identities of each archetype (see Table S1). A close inspection of histograms in Figure 2 reveals two clear trends; an increase in disturbance sensitive and indifferent species as we move from SA3 to SA1 and finally SA2 and a respective decrease in the relative proportion of tolerant and opportunistic species. Species identities are also important in understanding the composition of the archetypes; thus Species Archetype 1 contains no first-order opportunists but species indicative of transitional assemblages, such as Lumbrineris geldiay, Monticellina heterochaeta, Sigambra tentaculata, Aricidea claudiae. On the other hand, first-order opportunists (EGV), such as Prionospio fallax and Heteromastus filiformis, are found in Species Archetype 3, together with the second-order opportunists (EGIV) Mediomastus, Lanice conchilega, Pseudopolydora pulchra, and Podarkeopsis galangaui and many disturbance tolerant species. Two notable exceptions here are the species Schistomeringos rudolphi and Spio decoratus, which, although they are opportunists, were classified in Species Archetype 2 (SA2), where one can find all but one of the sensitive to disturbance species (EGI), a much lower proportion of EGIII species and only these two opportunists.
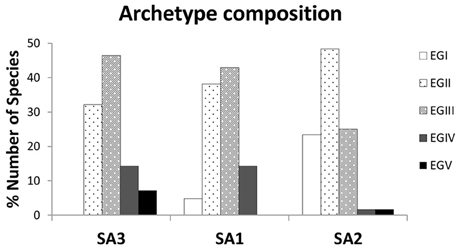
Figure 2. Composition of the 3 Species Archetypes in terms of percentage of species belonging to each ecological tolerance group (sensitivity scores assigned according to the Turkish national database). Definition of species tolerance groups: EGI, disturbance sensitive; EGII, disturbance indifferent; EGIII, disturbance tolerant; EGIV, second-order opportunist; EGV, first order opportunist.
The regression coefficients and associated standard errors (Table 2) describe the relationship of the archetypes with the environmental variables, whereas the shape of the responses is illustrated in the partial effects plots of Figure 3. The importance of each covariate is considered to increase as its relative standard error decreases. Thus, Species Archetype 1 is predominantly determined by summer bottom salinity, displaying a strong quadratic response with highest probability of presence at intermediate salinity values. At the same time, it responds negatively to chlorophyll a and depth but these variables are of secondary importance. Species Archetype 1 is the most widespread of the three archetypes and follows mostly the large scale environmental gradients in the region (Figures 4A,D, Figure S1). Its strong affinity with bottom salinity results in the avoidance of the less saline Northern Aegean waters and a higher probability of occurrence in the central Aegean. It is also less likely to be encountered in the eutrophic waters of inner and middle Izmir Bay and in the deeper parts of the south-eastern Aegean.
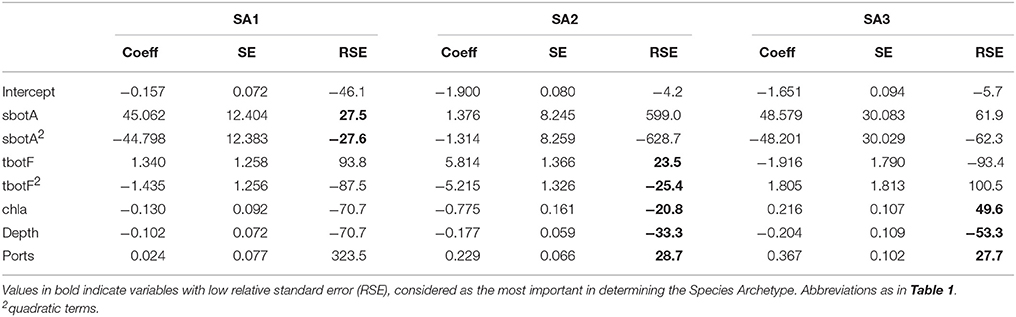
Table 2. Coefficients (coeff), Standard Errors (SE) and Relative Standard Errors (RSE) for the environmental predictors of the most parsimonious model for all Species Archetypes.
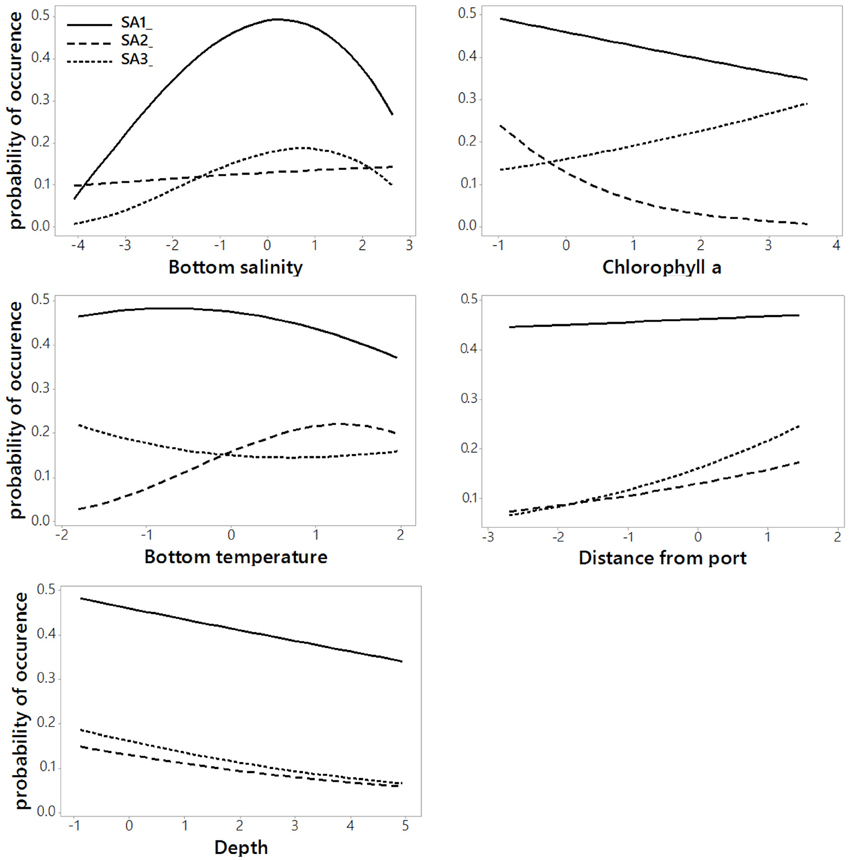
Figure 3. Partial effects plots of Species Archetype responses to each predictor variable when all other variables are held constant at their respective means. Values on the x-axis are standardized to zero mean and unit standard deviation.
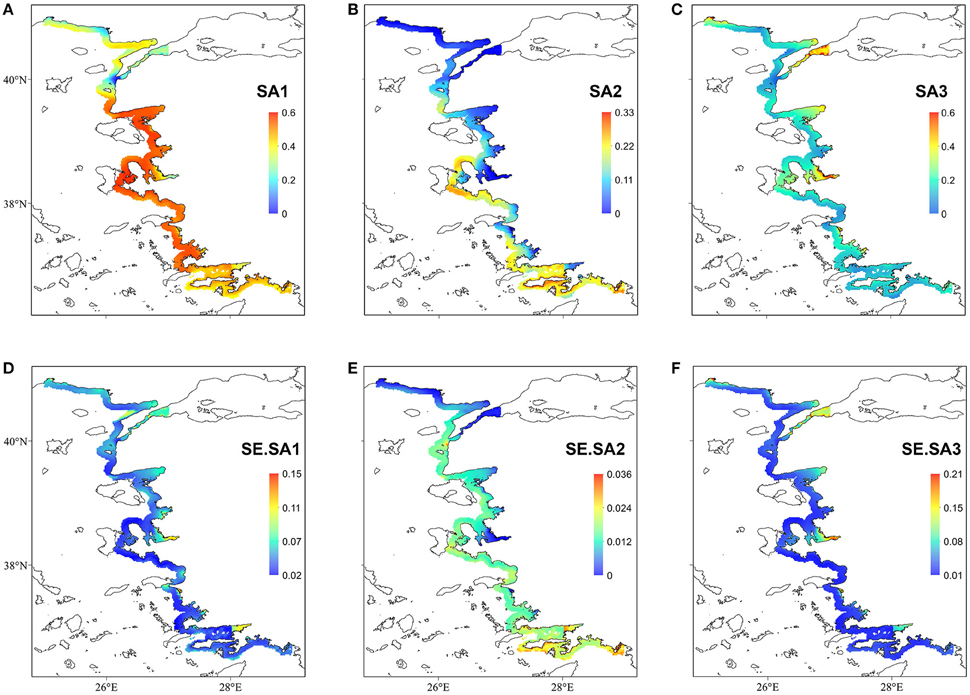
Figure 4. Top panel: Probability of occurrence of the three Species Archetypes (A) SA1; (B) SA2; (C) SA3. Bottom panel: prediction standard errors (D) SE.SA1; (E) SE.SA2; (F) SE.SA3. Notice the different scale bars in each map.
The response of Species Archetype 2 to the environment seems to be better defined by the covariates, judging by the size of the relative SEs. Its probability of presence generally increases with winter bottom temperature to level off close to the high temperature values encountered in the southernmost region of the region (Figure S1). It is also more likely to be present in deeper waters, away from ports and responds negatively to chlorophyll a concentration (Figure 4B). Species Archetype 2 has a more patchy distribution, predicted with the lowest degree of uncertainty (prediction SE.SA2, Figure 4E). Even though it contains most of the modeled species (present in 5-21 stations), it is characterized by the lowest probabilities of occurrence. It shows a higher affinity for deeper, more exposed areas of the coastline, particularly of the central and southern Aegean and is predicted to be mostly absent from shallow, inshore areas.
Species Archetype 3 is characterized by weaker associations with the predictor variables, it does however respond positively to chlorophyll a and shows a similar response pattern to bottom salinity as SA1. Its probability of occurrence decreases linearly with depth but increases with increasing distance from ports. Species Archetype 3 has a very localized predicted distribution with moderately high probability of presence in a few inshore areas throughout the whole Aegean coast (Figures 4C,F). These are regions that coincide with areas of high chlorophyll a concentration (Figure S1). While there is a certain degree of overlap in the distribution of archetype 1 with the other two archetypes, model predictions for Species Archetypes 2 and 3 indicate that they almost never occur together. Uncertainty in the estimation of the model parameters was higher for archetype 3 and had a similar magnitude and spatial pattern as SA1.
The predictive accuracy of the Species Archetype models for individual species is generally moderate, with less than half the modeled species displaying significant Spearman correlation coefficients between observed and predicted values (Table 3, Table S1). Predictive performance increases not only with decreasing species prevalence, (with more species from Species Archetypes 2 and 3 being accurately predicted and very few from SA1), but also with the number of species represented by each archetype. Similar behavior is observed for the discriminatory power of the models, which is moderate for archetypes 1 and 3 but markedly better for archetype 2 with more than 60% of its species being very well predicted with AUC>0.7.
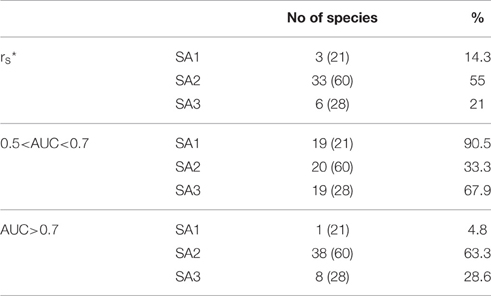
Table 3. Summary of the predictive performance of the Species Archetype Models, evaluated by species and expressed as the number and the percentage of species with rs: Spearman's rank correlation coefficient, where * denotes significant values at the p < 0.05 level and AUC: Area Under the ROC Curve (numbers in parentheses are total number of species for each archetype).
Discussion
Species Archetype Modeling is a model-based approach that classifies species objectively, in an unsupervised way, into groups according to their responses to environmental (Woolley et al., 2013; Leaper et al., 2014) and/or pressure gradients (Foster et al., 2015). In the current study an attempt was made to integrate the influence of environmental and relevant pressure parameters on benthic species distribution patterns and assess the resulting predictive models. The Species Archetypes that emerged are interpreted on the basis of a long-standing classification scheme of their member species along the tolerance to disturbance gradient. Additional functional traits were not considered since the sensitivity scores essentially synthesize a number of morphological, life-history and life-style traits (Paganelli et al., 2012) and can represent different combinations of their modalities.
The species archetypes arrived at by this modeling technique are not “traditional” communities as commonly defined per site based on species composition. They are groups of species with statistically similar responses to environmental parameters and their presence is not mutually exclusive. The final assemblage in a location will result from the co-occurrence of species from all the Archetypes that are likely to be found in that environmental setting. As such, it does not need to conform to pre-defined “community types” and this offers increased flexibility to predict co-occurrences in scenarios of environmental conditions that have not yet been encountered (Ferrier and Guisan, 2006). Polychaete species indifferent or tolerant to pollution are able to exist in a large range of environmental conditions and this is demonstrated by their common membership in all three Species Archetypes. The mixed composition of the archetype groups corroborates the long-standing knowledge that Mediterranean benthic fauna is generally evenly distributed with no one species naturally displaying strong dominance (Carletti and Heiskanen, 2009). In the case were presence/absence data is used instead of abundances, these differences may be even less pronounced (Muxika et al., 2012), particularly for EGII species which are “always present in low densities” and EGIII species, which “may occur in normal conditions but their populations are stimulated by organic enrichment.” With the above in mind, the relative distribution and dominance of groups EGII and EGIII in the three archetypes is not surprising. However, it is the relative proportion of the other Ecological Groups that differentiates the three archetypes, as well as their responses to environmental variables, discussed in more detail below.
Species Archetype 1, with its widespread distribution, primarily reflects the main biogeographic gradients in the Aegean, determined by salinity, temperature and basin/sub-basin scale circulation patterns (Durrieu de Madron et al., 2011). The colder, more productive waters of the Northern Aegean above the Dardanelles, resulting from the inflow of riverine waters along the northern coast and brackish, rich Black Sea water through the Turkish Straits system, constitute a distinct sub-region of the study area (Velaoras and Lascaratos, 2010; Sayın et al., 2011), where SA1 is less likely to be found compared to the Central Aegean. Another faunistically distinct region is observed where the Aegean meets the Levantine Sea and extends to the Bodrum Peninsula. The south-eastern Aegean is the point of entry of warm, hypersaline Levantine waters, where the thermohyaline and atmospheric forcing result in a clear and oxygen rich water column and reduced organic carbon fluxes to the bottom (Lykousis et al., 2002), creating an “ocean margin” environment. SA1 therefore could be regarded as a persistent faunal group of the central Aegean coast of Turkey which avoids the most stressful environments. It may be argued that the delineation of Species Archetype1, consisting of the most common taxa, is largely determined by species prevalence. This modeling issue, resulting from mixing GLMs on all the parameters including the intercept, has been acknowledged in previous studies (Dunstan et al., 2013b; Hui et al., 2013) and may mask, to some degree, the strength of association of species based on shared responses. However, member species of archetype 1, such as Lumbrineris geldiay, Monticellina heterochaeta, Sigambra tentaculata, Aricidea claudiae have been reported to occur together and characterize transitional assemblages in previous studies of Izmir Bay (Doğan et al., 2005; Ergen et al., 2006; Çinar et al., 2012) and Edremit Bay (Albayrak et al., 2007) at locations that concur with the current distribution; it is hence believed that SA1 is a valid response group. Moreover, the absence of any second-order opportunists and the relative proportion of the other Ecological Groups would place it in the slightly to moderately disturbed conditions of a degradation model for benthic community health (see Borja et al., 2000; Simboura and Zenetos, 2002; Muxika et al., 2012).
Modeled species at the two ends of the disturbance tolerance spectrum are almost never grouped together under the same Archetype. Stress sensitive and indifferent species with high ecological requirements dominate Species Archetype 2 which is primarily characterized by its negative response to chlorophyll a, a reliable indicator of eutrophication (HELCOM, 2009) and its higher affinity for the south-eastern Aegean. Previous studies of the area have reported rich fauna with high diversity values (Ergen and Çinar, 1994; Pancucci-Papadopoulou et al., 1999; Okuş et al., 2007) and attributed it to the hydrodynamic regime and the influence of Levantine waters. The composition of SA2 points to undisturbed/slightly disturbed conditions, or an assemblage of good to high status. Although the coexistence of opportunists (in low numbers) with sensitive species is predicted by degradation models for benthic faunal structure at slightly disturbed conditions (Grall and Glémarec, 1997; Borja et al., 2000), the inclusion of Schistomeringos rudolphi and Spio decoratus in SA2, both of which are documented opportunists and pollution indicators (Simboura and Zenetos, 2002; Çinar et al., 2015), is somewhat inconsistent with the general patterns of the current results and problematic for prediction purposes. A possible reason could be the use of presence/absence data in the current study that contains less information than abundance data, which, for opportunistic species in particular, is a determining property. Abundance data are anticipated to produce response curves and membership patterns that will more accurately represent species responses to pressures, particularly eutrophication. Another reason could be population fluctuations of these species (e.g., Doğan et al., 2005; Çinar et al., 2006, 2012, for comparison with previously reported data), and a lack of temporal replication to capture these fluctuations.
Species Archetype 3 is a species group devoid of sensitive taxa and with the highest overall representation in opportunistic species generally regarded as pollution indicators. In contrast with the EGIV species of archetype 1, which are relatively long-lived, free living predators, the opportunists of SA3 are burrowing or tube-building deposit-feeders, characteristic of reduced sediments. The predicted extent of SA3 largely coincides with shallow, inshore areas in response to their high chlorophyll a concentration. This is particularly true for bays and gulfs with high urban pressure and around estuaries and lagoons, where sediment and nutrient loads are generally high, confirming expectations of where high numbers of tolerant and opportunistic species may be found. More specifically, Saros Bay receives nutrient rich discharges from the Evros (Meric) river and Black Sea water, Edremit Bay is impacted by increasing summer housing development, olive oil industry and bottom trawl fisheries (Kucuksezgin et al., 2013), Izmir Bay is an intensely urbanized and industrialized area with a major shipping port and the Büyük Menderes river delta receives large amounts of, mostly untreated, municipal and industrial waste through the adjoining river basin (Yesilirmak and Anac, 2008). The Dardanelles strait is a water body heavily impacted by sewage pollution and intense shipping traffic (Ateş et al., 2014) and, even though benthic data from the Dardanelles were not used for the parametrization of the models in the current work, existing studies have reported generally moderate to poor ecological status throughout the strait (Ateş and Katağan, 2011) and a comparable polychaete composition, with 16 out of the 28 SA3 species and 16 out of 21 SA1 species present in the northern part, close to the Marmara Sea (Çinar et al., 2011). Thus, SA3 is considered to represent moderately disturbed conditions based on summer samples (which generally display higher status, compared with autumn or winter samples - Çinar et al., 2012, 2015). Contrary to our expectations, this archetype's response to distance from port seems to be counter-intuitive in that it is predicted more likely to occur away from port areas. The environmental setting of the ports included in the analysis is far from homogeneous and, with the exception of the port of Izmir, which is a large international port situated in a shallow, sheltered bay, the rest are small to medium ports/harbors in relatively exposed areas with steeper seabed slopes. Thus, the initial assumptions about the processes this predictor would represent were either not met or were relevant at different scales in the majority of cases, in which case capturing the impacts of this pressure would require a different grain of sampling. Nevertheless, distance from port emerged as the most influential predictor of archetype 3 distribution and it is possible that its spatial pattern co-varies with the spatial structure of a different variable that truly affects the distribution of tolerant and opportunistic polychaetes in a negative way.
A number of environmental parameters with well established relationships with the benthos, namely hydrodynamic variables, such as current speed and wave orbital velocity (Jenness and Duineveld, 1985; Wright et al., 1987, 1997; Hall et al., 1994) and sediment characteristics, particularly granulometric composition and organic carbon content (Snelgrove and Butman, 1994; Degraer et al., 1999; Ellingsen, 2002; Van Hoey et al., 2004; Çinar et al., 2012, 2015) were not addressed in this study due to the lack of available data layers of sufficient resolution and information. Even though, at the scale studied here, the sedimentary environment may be of lesser importance for predicting distributions due to its small scale variability (Reiss et al., 2011), missing explanatory variables and the inherent uncertainty in the existing predictors have undoubtedly affected the uncertainty in predictions and subsequent model performance.
Uncertainty in SAMs is propagated through the analysis from the raw data to the final probability estimates, with standard errors of regression coefficients estimated from the variance-covariance matrix and standard errors of the fitted probabilities calculated from the model components and measures of uncertainty (Dunstan et al., 2011). It thus follows that better estimated archetypes with lower relative standard errors will display lower uncertainty values; such is the case for archetype 2, while uncertainty increases for archetypes 1 and 3. This can reflect how well the individual species' responses are aligned with their respective archetypical response (Woolley et al., 2013); indeed archetype 3 has the largest proportion of indicatively affiliated species (Table S1). Furthermore, uncertainty and predictive performance improve with the number of species represented by each archetype, in agreement with findings that the more observations a group response contains the better it is predicted (Elith and Leathwick, 2007; Gogina et al., 2016). For archetypes 1 and 3 it is possible that the smaller number of included species is not adequate for an accurate characterization of the group response or that these groups have a more heterogeneous species composition. More importantly, each archetype may be better defined by a slightly different set of covariates and variable selection simultaneously across all archetypes may fail to demonstrate that (Hui et al., 2015). As an alternative, separate models could have been developed with a different statistical method once the appropriate number of archetypes had been established. However, one of the attractive features in the SAMs approach is the unsupervised classification of species into group responses, which can change as variable selection progresses and predictor terms are dropped from the models (i.e., the posterior probability of group membership tau for each species may change and adjustments to the final species groupings will occur accordingly). Thus, it was considered that the benefits of proceeding with the SAMs analytical framework outweighed the potential drawbacks of simultaneous variable selection.
Species Archetype Modeling is a novel methodology that is continuously being developed and refined. There is certainly scope for improvement in many aspects, such as variable selection and model evaluation, use of species-specific intercepts in the models, adopting a different archetype model (e.g., Generalized Additive Model or Boosted Regression Tree in place of a GLM). While some of these issues are already being addressed (Dunstan et al., 2013b; Foster et al., 2015; Hui et al., 2015), they are still a work in progress and have not yet been implemented in an available software tool (Scott Foster, personal communication). Other modeling issues on the other hand, such as addressing species interactions through the inclusion of latent variables for instance, are more challenging and remain to be investigated (Dunstan et al., 2013b; Warton et al., 2015a). Nevertheless, SAMs have been shown to outperform single species GLMs in big data sets, especially when the ratio of the number of species to the number of stations is high, as they borrow strength from common species and even perform better than single GAMs for very rare species (Hui et al., 2013).
At appropriate scales, benthic species archetypes can complement existing efforts for the bioregionalization of the Aegean and the Mediterranean (Reygondeau et al., 2014), as Woolley et al. (2013) have demonstrated for south-western Australia and provide “an appropriate statistical method that can link the ecological information to the pressures” (Foster et al., 2015) as we have demonstrated here for benthic polychaetes and eutrophication. From a spatial management and planning perspective the use of archetype groups is attractive because it can summarize a large amount of complex information in a robust and parsimonious way that offers ease of interpretation. The archetypes of benthic polychaetes identified in this study may constitute a departure from our conventional scheme of delineating marine benthic communities, they do however offer an alternative and intuitive way to study and visualize the distribution of benthic species groups at scales that incorporate both biogeographical and more localized, often human-induced or enhanced, processes. In this regard, possibilities could be envisaged for the development of distributional (ICES, 2016) or surveillance indicators (Shepard et al., 2015) from such a modeling approach.
Distributional indicators can help identify drivers and directions of change in a spatially explicit manner and serve as a first “alarm bell” that problems have occurred which require managers' attention and further study or mitigation measures (ICES, 2016). Moreover, they can provide valuable information on the natural background variability of different sections of an area under study. At the sub-regional scale the current SAMs confirm the ecological significance and the geographic extent of the three Aegean biogeographic areas (northern, central and southern) specifically for benthic polychaetes of shallow soft sediments, which are however a good proxy for the whole benthic community. At more local scales, they provide a good indication of areas where eutrophication impacts to the benthos are more strongly manifested. It is in these areas, where SA1 is complemented by or replaced with SA3 that distributional shifts or expansion of either of these two archetypes will be informative for management purposes. Similarly, areas of overlap, or substitution of SA1 with SA2 is where “mostly undisturbed” conditions may be sought for the central and southeastern Aegean, after water bodies and typologies have been established (for Turkish waters see TUBITAK-MRC and MoEU-GDEM, 2014). In contrast, our results indicate that “reference conditions” or “naturalness” for the northern Aegean will be somewhat different and mostly characterized by indifferent and tolerant species. It is recommended that monitoring schemes take into account the transition zones between the three Archetypes, where the direction of change in response to pressures may be better detected and visualized.
Conclusions
Within the limitations of the information contained in our datasets, our application of SAMs captured both the natural and the adequately quantified pressure gradients, distinguished the responses of sensitive and opportunistic benthic polychaetes and performed rather well in predicting their distribution. It thus serves as a first step to demonstrate the potential of this modeling framework to strengthen our knowledge base about the ways and the scales at which benthos respond to natural and anthropogenic gradients and offer insights into patterns of species co-existence, supporting the implementation of area oriented monitoring and assessment.
Author Contributions
Conceived and designed the study: MG, GK, and KB. Sourced and screened the data: KB, GK, and MG. Analyzed the data and wrote the paper: MG. All authors reviewed the manuscript.
Funding
This manuscript is a result of the DEVOTES (DEVelopment Of innovative Tools for understanding marine biodiversity and assessing good Environmental Status - http://www.devotes-project.eu) project funded by the European Union (7th Framework Program “The Ocean of Tomorrow” Theme, grant agreement no. 308392).
Conflict of Interest Statement
The authors declare that the research was conducted in the absence of any commercial or financial relationships that could be construed as a potential conflict of interest.
Acknowledgments
The Turkish Ministry of Environment and Urbanization/General Directorate of Environmental Management is gratefully acknowledged for making available the report on the “Integrated pollution monitoring project in Aegean and Mediterranean Seas,” coordinated by Derinsu Underwater Engineering.
Supplementary Material
The Supplementary Material for this article can be found online at: https://www.frontiersin.org/article/10.3389/fmars.2016.00154
References
Albayrak, S., Balkıs, H., and Çinar, M. E. (2007). Shallow-water soft bottom macrozoobenthic communities from Edremit Bay (NE Aegean Sea). Belgian J. Zool. 137, 127–132.
Ateş, A., and Katağan, T. (2011). Recent data on the effects of sewage pollution on the assemblage of decapod crustaceans in the Dardanelles (the Turkish Straits System). J. Black Sea Mediterr. Environ. 17, 90–115.
Ateş, A. S., Katağan, T., Sezgin, M., Özdilek, H. G., Berber, S., and Bulut, M. (2014). The effects of some domestic pollutants on the cumacean (Crustacea) community structure at the coastal waters of the Dardanelles, Turkey. Arthropods 3, 27–42.
Barbosa, A. M., Brown, J. A., Jimenez-Valverde, A., and Real, R. (2015). modEvA: Model Evaluation and Analysis. R package version 1.0/r72. Available online at: http://R-Forge.R-project.org/projects/modeva/
Berg, T., Fürhaupter, K., Teixeira, H., Uusitalo, L., and Zampoukas, N. (2015). The Marine Strategy Framework Directive and the ecosystem-based approach - pitfalls and solutions. Mar. Pollut. Bull. 96, 18–28. doi: 10.1016/j.marpolbul.2015.04.050
Borja, A., Franco, J., and Perez, V. (2000). A marine Biotic Index to establish the ecological quality of soft-bottom benthos within European estuarine and coastal environments. Mar. Pollut. Bull. 40, 1100–1114. doi: 10.1016/S0025-326X(00)00061-8
Buhl-Mortensen, L., Buhl-Mortensen, P., Dolan, M. F. J., and Holte, B. (2015). The MAREANO programme – A full coverage mapping of the Norwegian off-shore benthic environment and fauna. Mar. Biol. Res. 11, 4–17. doi: 10.1080/17451000.2014.952312
Buhl-Mortensen, L., Buhl-Mortensen, P., Dolan, M. J. F., and Gonzalez-Mirelis, G. (2014). Habitat mapping as a tool for conservation and sustainable use of marine resources: some perspectives from the MAREANO Programme, Norway. J. Sea Res. 100, 46–61. doi: 10.1016/j.seares.2014.10.014
Carletti, A., and Heiskanen, A. (2009). Reports Water Framework Directive intercalibration technical report. Part 3: Coastal and Transitional waters. JRC Scientific and Technical.
Çinar, M. E., Bakır, K., Öztürk, B., Katağan, T., Dağlı, E., Açık, Ş., et al. (2015). TUBI (TUrkish Benthic Index): A new biotic index for assessing impacts of organic pollution on benthic communities. J. Black Sea Mediterr. Environ. 21, 135–168.
Çinar, M. E., and Dagli, E. (2013). Polychaetes (Annelida: Polychaeta) from the Aegean and Levantine coasts of Turkey, with descriptions of two new species. J. Nat. Hist. 47, 911–947. doi: 10.1080/00222933.2012.752543
Çinar, M. E., Dagli, E., and Açik, S. (2011). Annelids (Polychaeta and Oligochaeta) from the Sea of Marmara, with descriptions of five new species. J. Nat. Hist. 45, 2105–2143. doi: 10.1080/00222933.2011.582966
Çinar, M. E., Katagan, T., Öztürk, B., Bakir, K., Dagli, E., Açik, S., et al. (2012). Spatio-temporal distributions of zoobenthos in soft substratum of Izmir Bay (Aegean Sea, eastern Mediterranean), with special emphasis on alien species and ecological quality status. J. Mar. Biol. Assoc. U.K. 92, 1457–1477. doi: 10.1017/S0025315412000264
Çinar, M. E., Katagan, T., Öztürk, B., Egemen, Ö., Ergen, Z., Kocatas, A., et al. (2006). Temporal changes of soft-bottom zoobenthic communities in and around Alsancak Harbor (Izmir Bay, Aegean Sea), with special attention to the autecology of exotic species. Mar. Ecol. 27, 229–246. doi: 10.1111/j.1439-0485.2006.00102.x
Conrad, O., Bechtel, B., Bock, M., Dietrich, H., Fischer, E., Gerlitz, L., et al. (2015). System for Automated Geoscientific Analyses (SAGA) v. 2.1.4. Geosci. Model Dev. 8, 1991–2007. doi: 10.5194/gmd-8-1991-2015
De Backer, A., Van Hoey, G., Coates, D., Vanaverbeke, J., and Hostens, K. (2014). Similar diversity-disturbance responses to different physical impacts: three cases of small-scale biodiversity increase in the Belgian part of the North Sea. Mar. Pollut. Bull. 84, 251–262. doi: 10.1016/j.marpolbul.2014.05.006
Degraer, S., Verfaillie, E., Willems, W., Adriaens, E., Van Lancker, V., and Vincx, M. (2008). Habitat suitability as a mapping tool for macrobenthic communities : an example from the Belgian part of the North Sea. Cont. Shefl Res. 28, 369–379. doi: 10.1016/j.csr.2007.09.001
Degraer, S., Vincx, M., Meire, P., and Offringa, H. (1999). The macrozoobenthos of an important wintering area of the common scoter (Melanitta nigra). J. Mar. Biol. Assoc. U.K. 79, 243–251. doi: 10.1017/S0025315498000277
Dimitriou, P. D., Apostolaki, E. T., Papageorgiou, N., Reizopoulou, S., Simboura, N., Arvanitidis, C., et al. (2012). Meta-analysis of a large data set with water framework directive indicators and calibration of a benthic quality index at the family level. Ecol. Indic. 20, 101–107. doi: 10.1016/j.ecolind.2012.02.008
Doğan, A., Çinar, M. E., Önen, M., Ergen, Z., and Katağan, T. (2005). Seasonal dynamics of soft bottom zoobenthic communities in polluted and unpolluted areas of Izmir Bay (Aegean Sea). Senckenb. Maritima 35, 133–145. doi: 10.1007/BF03043182
Dunstan, P. K., Foster, S. D., and Darnell, R. (2011). Model based grouping of species across environmental gradients. Ecol. Modell. 222, 955–963. doi: 10.1016/j.ecolmodel.2010.11.030
Dunstan, P. K., Foster, S. D., and Darnell, R. (2013a). SpeciesMix: Fit Mixtures of Archetype species. R package version 0.3.1. Available online at: http://CRAN.R-project.org/package=SpeciesMix
Dunstan, P. K., Foster, S. D., Hui, F. K. C., and Warton, D. I. (2013b). Finite mixture of regression modeling for high-dimensional count and biomass data in ecology. J. Agric. Biol. Environ. Stat. 18, 357–375. doi: 10.1007/s13253-013-0146-x
Durrieu de Madron, X., Guieu, C., Sempéré, R., Conan, P., Cossa, D., D'Ortenzio, F., et al. (2011). Marine ecosystems' responses to climatic and anthropogenic forcings in the Mediterranean. Prog. Oceanogr. 91, 97–166. doi: 10.1016/j.pocean.2011.02.003
Elith, J., and Leathwick, J. R. (2007). Predicting species distributions from museum and herbarium records using multiresponse models fitted with multivariate adaptive regression splines. Divers. Distrib. 13, 265–275. doi: 10.1111/j.1472-4642.2007.00340.x
Ellingsen, K. E. (2002). Soft-sediment benthic biodiversity on the continental shelf in relation to environmental variability. Mar. Ecol. Prog. Ser. 232, 15–27. doi: 10.3354/meps232015
Ergen, Z., and Çinar, M. E. (1994). “Ege Denizi'nde dağilim gösteren Cystoseira fasiyesinin kalitatif ve kantitatif yönden araştırılması,” in XII. Ulusal Biyoloji Kongresi 6_8 (Edirne), 138–149.
Ergen, Z., Çinar, M. E., Dağli, E., and Kurt, G. (2006). Seasonal dynamics of soft-bottom polychaetes in Izmir Bay (Aegean Sea, eastern Mediterranean). Sci. Mar. 70, 197–207. doi: 10.3989/scimar.2006.70s3197
EU (2008). Directive 2008/56/EC of the European Parliament and of the council of 17 June 2008 establishing a framework for community action in the field of marine environmental policy (Marine Strategy Framework Directive). Off. J. Eur. Union 164, 19–40.
Ferrier, S., and Guisan, A. (2006). Spatial modelling of biodiversity at the community level. J. Appl. Ecol. 43, 393–404. doi: 10.1111/j.1365-2664.2006.01149.x
Foster, S. D., Dunstan, P. K., Althaus, F., and Williams, A. (2015). The cumulative effect of trawl fishing on a multispecies fish assemblage in south-eastern Australia. J. Appl. Ecol. 52, 129–139. doi: 10.1111/1365-2664.12353
Gogina, M., Nygård, H., Blomqvist, M., Daunys, D., Josefson, A. B., Kotta, J., et al. (2016). The Baltic Sea scale inventory of benthic faunal communities. ICES J. Mar. Sci. 73:fsv265. doi: 10.1093/icesjms/fsv265
Gonzalez-Mirelis, G., and Buhl-Mortensen, P. (2015). Modelling benthic habitats and biotopes off the coast of Norway to support spatial management. Ecol. Inform. 30, 284–292. doi: 10.1016/j.ecoinf.2015.06.005
Grall, J., and Glémarec, M. (1997). Using biotic indices to estimate macrobenthic community perturbations in the Bay of Brest. Estuar. Coast. Shelf Sci. 44, 43–53. doi: 10.1016/S0272-7714(97)80006-6
Gray, J. S., and Elliott, M. (2009). Ecology of Marine Sediments. New York, NY: Oxford University Press Inc.
Hall, S. J., Raffaelli, D., and Thrush, S. F. (1994). “Patchiness and disturbance in shallow water benthic assemblages,” in Aquatic Ecology: scale, pattern and processes. The 34th Symposium of the British Ecological Society with the American Society of Limnology and Oceanography, University College, Cork, 1992, eds. P. S. Giller, A. G. Hildrew, and D. G. Raffaelli (Oxford: Blackwell Scientific Publications), 333–375.
Halpern, B. S., Walbridge, S., Selkoe, K. A., Kappel, C. V., Micheli, F., D'Agrosa, C., et al. (2008). A global map of human impact in marine ecosystems. Science 319, 948–952. doi: 10.1126/science.1149345
Heath, M. R. (2008). Comment on “a global map of human impact on marine ecosystems.” Science 321:1446b. doi: 10.1126/science.1157390
HELCOM (2009). “Eutrophication in the Baltic Sea – an integrated thematic assessment of the effects of nutrient enrichment and eutrophication in the Baltic Sea region,” in Baltic Sea Environment Proceedings No. 115B.
HELCOM (2013). “State of the soft-bottom macrofauna communities,” in HELCOM Core Indicator Report. Available online at: http://helcom.fi/Core%20Indicators/HELCOM-CoreIndicator_State_of_the_soft-bottom_macrofauna_communities.pdf
Hiddink, J. G., Jennings, S., Kaiser, M. J., Queiros, A. M., Duplisea, D. E., and Piet, G. J. (2009). Cumulative impacts of seabed trawl disturbance on benthic biomass, production and species richness in different habitats. Canadian J. Fisher. Aqua. Sci. 63, 721–736. doi: 10.1139/f05-266
Hui, F. K. C. (2015). BORAL – Bayesian Ordination and Regression Analysis of Multivariate Abundance Data in R. Methods Ecol. Evol. 7, 744–750. doi: 10.1111/2041-210X.12514
Hui, F. K. C., Taskinen, S., Pledger, S., Foster, S. D., and Warton, D. I. (2014). Model-based approaches to unconstrained ordination. Methods Ecol. Evol. 6, 399–411. doi: 10.1111/2041-210X.12236
Hui, F. K. C., Warton, D. I., and Foster, S. D. (2015). Multi-species distribution modeling using penalized mixture of regressions. Ann. Appl. Stat. 9, 866–882. doi: 10.1214/15-AOAS813
Hui, F. K. C., Warton, D. I., Foster, S. D., and Dunstan, P. K. (2013). To mix or not to mix: comparing the predictive performance of mixture models vs. separate species distribution models. Ecology 94, 1913–1919. doi: 10.1890/12-1322.1
ICES (2016). Report of the Working Group on Ecosystem Effects of Fishing Activities (WGECO), Copenhagen, Denmark. ICES CM 2016/ACOM:25.
Jenness, M. I., and Duineveld, G. C. A. (1985). Effects of tidal currents on chlorophyll a content of sandy sediments in the southern North Sea. Mar. Ecol. Prog. Ser. 283–287. doi: 10.3354/meps021283
Josefson, A. B., Blomqvist, M., Hansen, J. L. S., Rosenberg, R., and Rygg, B. (2009). Assessment of marine benthic quality change in gradients of disturbance: comparison of different Scandinavian multi-metric indices. Mar. Pollut. Bull. 58, 1263–1277. doi: 10.1016/j.marpolbul.2009.05.008
Kaiser, M. J., Clarke, K. R., Hinz, H., Austen, M. C. V., Somerfield, P. J., and Karakassis, I. (2006). Global analysis and prediction of the response of benthic biota to fishing. Mar. Ecol. Prog. Ser. 311, 1–14. doi: 10.3354/meps311001
Kucuksezgin, F., Pazi, I., Yucel-Gier, G., Akcali, B., and Galgani, F. (2013). Monitoring of heavy metal and organic compound levels along the Eastern Aegean coast with transplanted mussels. Chemosphere 93, 1511–1518. doi: 10.1016/j.chemosphere.2013.07.058
Leaper, R., Dunstan, P. K., Foster, S. D., Barrett, N. S., and Edgar, G. J. (2014). Do communities exist? Complex patterns of overlapping marine species distributions. Ecology 95, 2016–2025. doi: 10.1890/13-0789.1
Lykousis, V., Chronis, G., Tselepides, A., Price, N. B., Theocharis, A., Siokou-Frangou, I., et al. (2002). Major outputs of the recent multidisciplinary biogeochemical researches undertaken in the Aegean Sea. J. Mar. Syst. 33–34, 313–334. doi: 10.1016/S0924-7963(02)00064-7
Lynam, C., Tempera, F., Teixeira, H., Diesing, M., Stephens, D., Van Leeuwen, S., et al. (2015). Report Describing Spatial Ecosystem Models. Linking Habitats to Functional Diversity and Modelling Connectivity between Regional Seas. Devotes Deliverable 4.2. 1–296.
Madon, B., Warton, D. I., and Araújo, M. B. (2013). Community-level vs species-specific approaches to model selection. Ecography 36, 1291–1298. doi: 10.1111/j.1600-0587.2013.00127.x
Micheli, F., Halpern, B. S., Walbridge, S., Ciriaco, S., Ferretti, F., Fraschetti, S., et al. (2013). Cumulative human impacts on Mediterranean and Black Sea marine ecosystems: assessing current pressures and opportunities. PLoS ONE 8:e79889. doi: 10.1371/journal.pone.0079889
Muxika, I., Borja, A., and Bonne, W. (2005). The suitability of the marine biotic index (AMBI) to new impact sources along European coasts. Ecol. Indic. 5, 19–31. doi: 10.1016/j.ecolind.2004.08.004
Muxika, I., Somerfield, P. J., Borja, A., and Warwick, R. M. (2012). Assessing proposed modifications to the AZTI marine biotic index (AMBI), using biomass and production. Ecol. Indic. 12, 96–104. doi: 10.1016/j.ecolind.2011.04.030
Okuş, E., Yüksek, A., Yılmaz, N., Aslan-Yılmaz, A., Karhan, S. Ü., Öz, M. İ., et al. (2007). Marine biodiversity of datça-bozburun specially protected area (Southeastern Aegean Sea, Turkey). J. Black Sea Mediterr. Environ. 13, 7–17.
Ovaskainen, O., Roy, D. B., Fox, R., and Anderson, B. J. (2016). Uncovering hidden spatial structure in species communities with spatially explicit joint species distribution models. Methods Ecol. Evol. 7, 428–436. doi: 10.1111/2041-210X.12502
Paganelli, D., Marchini, A., and Occhipinti-Ambrogi, A. (2012). Functional structure of marine benthic assemblages using Biological Traits Analysis (BTA): a study along the Emilia-Romagna coastline (Italy, North-West Adriatic Sea). Estuar. Coast. Shelf Sci. 96, 245–256. doi: 10.1016/j.ecss.2011.11.014
Pancucci-Papadopoulou, M. A., Simboura, N., Zenetos, A., Thessalou-Legaki, M., and Nicolaidou, A. (1999). Benthic invertebrate communities of Nw rodos (Rhodes) island (Se Aegean Sea) as related to hydrological regime and geographical location. Isr. J. Zool. 45, 371–393.
Pearson, T. H., and Rosenberg, R. (1978). Macrobenthic succession in relation to organic enrichment and pollution of the marine environment. Oceanogr. Mar. Biol. Annu. Rev. 16, 229–311.
Piroddi, C., Lynam, C. P., Teixeira, H., Smith, C., Alvarez, M. C., Mazik, K., et al. (2013). Available models for biodiversity and needs for development. Devotes Deliverable 4.1.
Piroddi, C., Teixeira, H., Lynam, C. P., Smith, C., Alvarez, M. C., Mazik, K., et al. (2015). Using ecological models to assess ecosystem status in support of the European Marine Strategy Framework Directive. Ecol. Indic. 58, 175–191. doi: 10.1016/j.ecolind.2015.05.037
Pledger, S., and Arnold, R. (2014). Multivariate methods using mixtures: correspondence analysis, scaling and pattern-detection. Comput. Stat. Data Anal. 71, 241–261. doi: 10.1016/j.csda.2013.05.013
R Core Team (2014). R: A language and Environment for Statistical Computing, Vienna: R Foundation for Statistical Computing.
Reiss, H., Birchenough, S., Borja, A., Buhl-Mortensen, L., Craeymeersch, J., Dannheim, J., et al. (2015). Benthos distribution modelling and its relevance for marine ecosystem management. ICES J. Mar. Sci. 72, 297–315. doi: 10.1093/icesjms/fsu107
Reiss, H., Cunze, S., König, K., Neumann, H., and Kröncke, I. (2011). Species distribution modelling of marine benthos: a North Sea case study. Mar. Ecol. Prog. Ser. 442, 71–86. doi: 10.3354/meps09391
Reygondeau, G., Irisson, J. O., Ayata, S., Gasparini, S., Benedetti, F., Albouy, C., et al. (2014). Definition of the Mediterranean Eco-regions and Maps of Potential Pressures in These Eco-regions. Perseus Deliverable 1.6. 1–45.
Rosenberg, R. (2001). Marine benthic faunal successional stages and related sedimentary activity. Sci. Mar. 65, 107–119. doi: 10.3989/scimar.2001.65s2107
Rubidge, E. M., Gale, K. S. P., and Curtis, J. M. R. (2016). Community ecological modelling as an alternative to physiographic classifications for marine conservation planning. Biodivers. Conserv. 25, 1899–1920. doi: 10.1007/s10531-016-1167-x
Sayın, E., Eronat, C., Uçkaç, S., and Beşiktepe, S. T. (2011). Hydrography of the eastern part of the aegean sea during the eastern mediterranean transient (EMT). J. Mar. Syst. 88, 502–515. doi: 10.1016/j.jmarsys.2011.06.005
Sbrocco, E. J., and Barber, P. H. (2013). MARSPEC: ocean climate layers for marine spatial ecology. Ecology 94, 979. doi: 10.1890/12-1358.1
Shepard, S., Greenstreet, S. P. R., Piet, G. J., Rindorf, A., and Dickey-Collas, M. (2015). Surveillance indicators and their use in implementation of the Marine Strategy Framework Directive. ICES J. Mar. Sci. 72, 2269–2277. doi: 10.1093/icesjms/fsv131
Simboura, N., and Zenetos, A (2002). Benthic indicators to use in Ecological Quality classification of Mediterranean soft bottom marine ecosystems, including a new Biotic Index. Mediterr. Mar. Sci. 3, 77–111. doi: 10.12681/mms.249
Simboura, N., and Reizopoulou, S. (2007). A comparative approach of assessing ecological status in two coastal areas of Eastern Mediterranean. Ecol. Indic. 7, 455–468. doi: 10.1016/j.ecolind.2006.05.003
Smith, C., Papadopoulou, N., Barnard, S., Mazik, K., Patrício, J., Elliott, M., et al. (2014). Conceptual models for the effects of marine pressures on biodiversity. Devotes Proj. Deliv. 1.1, 1–82.
Snelgrove, P. V. R., and Butman, C. A. (1994). Animal-sediment relationships revisited: cause versus effect. Oceanogr. Mar. Biol. Annu. Rev. 32, 111–177.
Tedesco, L., Piroddi, C., Kamari, M., and Lynam, C. (2016). Capabilities of Baltic Sea models to assess environmental status for marine biodiversity. Mar. Policy 70, 1–12. doi: 10.1016/j.marpol.2016.04.021
TUBITAK-MRC MoEU-GDEM (2014). “Marine and coastal waters quality determination and classification project (DeKoS),” in ÇTÜE 5118703, Report No. ÇTÜE.13.155 (Final Report) (Gebze-Kocaeli).
Van Hoey, G., Borja, A., Birchenough, S., Buhl-Mortensen, L., Degraer, S., Fleischer, D., et al. (2010). The use of benthic indicators in Europe: from the water framework directive to the Marine Strategy Framework Directive. Mar. Pollut. Bull. 60, 2187–2196. doi: 10.1016/j.marpolbul.2010.09.015
Van Hoey, G., Degraer, S., and Vincx, M. (2004). Macrobenthic community structure of soft-bottom sediments at the Belgian Continental Shelf. Estuar. Coast. Shelf Sci. 59, 599–613. doi: 10.1016/j.ecss.2003.11.005
Van Hoey, G., Permuy, D. C., Vandendriessche, S., Vincx, M., and Hostens, K. (2013). An ecological quality status assessment procedure for soft-sediment benthic habitats: weighing alternative approaches. Ecol. Indic. 25, 266–278. doi: 10.1016/j.ecolind.2012.09.024
Velaoras, D., and Lascaratos, A. (2010). North-Central Aegean Sea surface and intermediate water masses and their role in triggering the Eastern Mediterranean Transient. J. Mar. Syst. 83, 58–66. doi: 10.1016/j.jmarsys.2010.07.001
Wang, Y., Naumann, U., Wright, S. T., and Warton, D. I. (2012). Mvabund- an R package for model-based analysis of multivariate abundance data. Methods Ecol. Evol. 3, 471–474. doi: 10.1111/j.2041-210X.2012.00190.x
Warton, D. I., Blanchet, F. G., O'Hara, R. B., Ovaskainen, O., Taskinen, S., Walker, S. C., et al. (2015a). So many variables: joint modeling in community ecology. Trends Ecol. Evol. 30, 766–779. doi: 10.1016/j.tree.2015.09.007
Warton, D. I., Foster, S. D., De'ath, G., Stoklosa, J., and Dunstan, P. K. (2015b). Model-based thinking for community ecology. Plant Ecol. 216, 669–682. doi: 10.1007/s11258-014-0366-3
Warton, D. I., Wright, S. T., and Wang, Y. (2012). Distance-based multivariate analyses confound location and dispersion effects. Methods Ecol. Evol. 3, 89–101. doi: 10.1111/j.2041-210X.2011.00127.x
Woolley, S. N. C., Mccallum, A. W., Wilson, R., O'Hara, T. D., and Dunstan, P. K. (2013). Fathom out: biogeographical subdivision across the Western Australian continental margin - a multispecies modelling approach. Divers. Distrib. 19, 1506–1517. doi: 10.1111/ddi.12119
Wright, L. D., Prior, D. B., Hobbs, C. H., Byrne, R. J., Schaffner, L. C., and Green, M. O. (1987). Spatial variability of bottom types in the lower Chesapeake Bay and adjoining estuaries and inner shelf. Estuar. Coast. Shelf Sci. 24, 765–784. doi: 10.1016/0272-7714(87)90151-X
Wright, L. D., Schaffner, L. C., and Maa, J. P. Y. (1997). Biological mediation of bottom boundary layer processes and sediment suspension in the lower Chesapeake Bay. Mar. Geol. 141, 27–50. doi: 10.1016/S0025-3227(97)00061-3
Yesilirmak, E., and Anac, S. (2008). Water quality parameters of Buyuk Menderes river, Turkey. Asian J. Chem. 20, 2882–2890.
Keywords: polychaetes, species archetype model, composition, community-level model, Aegean, benthic invertebrates, ecological groups, soft-sediment
Citation: Galanidi M, Kaboglu G and Bizsel KC (2016) Predicting the Composition of Polychaete Assemblages in the Aegean Coast of Turkey. Front. Mar. Sci. 3:154. doi: 10.3389/fmars.2016.00154
Received: 15 June 2016; Accepted: 15 August 2016;
Published: 31 August 2016.
Edited by:
Angel Borja, AZTI, SpainReviewed by:
Silvana Noemi Raquel Birchenough, Centre for Environment, Fisheries and Aquaculture Science, UKGenoveva Gonzalez-Mirelis, Institute of Marine Research, Norway
Copyright © 2016 Galanidi, Kaboglu and Bizsel. This is an open-access article distributed under the terms of the Creative Commons Attribution License (CC BY). The use, distribution or reproduction in other forums is permitted, provided the original author(s) or licensor are credited and that the original publication in this journal is cited, in accordance with accepted academic practice. No use, distribution or reproduction is permitted which does not comply with these terms.
*Correspondence: Marika Galanidi, marika.galanidi@deu.edu.tr