The Physiological Response of Picophytoplankton to Temperature and Its Model Representation
 Beate Stawiarski
 Erik T. Buitenhuis
 Corinne Le Quéré
- Tyndall Centre for Climate Change Research, School of Environmental Sciences, University of East Anglia, Norwich, UK
Picophytoplankton account for most of the marine (sub-)tropical phytoplankton biomass and primary productivity. The contribution to biomass among plankton functional types (PFTs) could shift with climate warming, in part as a result of different physiological responses to temperature. To model these responses, Eppley's empirical relationships have been well established. However, they have not yet been statistically validated for individual PFTs. Here, we examine the physiological response of nine strains of picophytoplankton to temperature; three strains of picoprokaryotes and six strains of picoeukaryotes. We conduct laboratory experiments at 13 temperatures between –0.5 and 33°C and measure the maximum growth rates and the chlorophyll a to carbon ratios. We then statistically validate two hypotheses formulated by Eppley in 1972: The response of maximum growth rates to temperature (1) of individual strains can be represented by an optimum function, and (2) of the whole phytoplankton group can be represented by an exponential function Eppley (1972). We also quantify the temperature-related parameters. We find that the temperature span at which growth is positive is more constrained for picoprokaryotes (13.7–27°C), than for picoeukaryotes (2.8–32.4°C). However, the modeled temperature tolerance range (ΔT) follows an unimodal function of cell size for the strains examined here. Thus, the temperature tolerance range may act in conjunction with the maximum growth rate to explain the picophytoplankton community size structure in correlation with ocean temperature. The maximum growth rates obtained by a 99th quantile regression for the group of picophytoplankton or picoprokaryotes are generally lower than the rates estimated by Eppley. However, we find temperature-dependencies (Q10) of 2.3 and of 4.9 for the two groups, respectively. Both of these values are higher than the Q10 of 1.88 estimated by Eppley and could have substantial influence on the biomass distribution in models, in particular if picoprokaryotes were considered an independent PFT. We also quantify the increase of the chlorophyll a to carbon ratios with increasing temperature due to acclimation. These parameters provide essential and validated physiological information to explore the response of marine ecosystems to a warming climate using ocean biogeochemistry models.
Introduction
Picophytoplankton contribute 26–56% to the global phytoplankton biomass (Buitenhuis et al., 2013) and about half of the global ocean primary productivity (Grossman et al., 2010). They dominate over wideocean areas, such as the oligotrophic subtropical gyres, and decrease polewards relative to other phytoplankton (Alvain et al., 2008; Buitenhuis et al., 2012). They play a significant role in the recycling of organic matter within the microbial loop of the surface ocean (Azam et al., 1983; Fenchel, 2008), but contribute little to the sinking of particulate matter to the intermediate and deep ocean (Michaels and Silver, 1988). With the projected extension of the oligotrophic subtropical gyres as a consequence of climate warming (Polovina et al., 2008), the recycling of nutrients within the microbial loop and consequently the contribution of picophytoplankton to the phytoplankton community may gain more importance in the marine biogeochemical cycles (Morán et al., 2010).
Temperature is an important environmental variable that determines, directly or indirectly, the biomass, productivity, and cell composition of all phytoplankton groups, single species and even ecotypes (Eppley, 1972; Sarmiento, 2004; Zinser et al., 2007). In particular, temperature directly affects the physiological processes that regulate the growth rates, the temperature span at which growth rates are positive, and the chlorophyll a to carbon ratios, among others (Eppley, 1972; Raven and Geider, 1988). In the field, temperature also influences the physical dynamics of the water column and the availability of nutrients and light (Eppley, 1972; Behrenfeld et al., 2006; Johnson et al., 2006), making it difficult to isolate the specific effect of temperature.
The contribution of picophytoplankton to the phytoplankton biomass was shown to correlate with in situ temperature (Agawin et al., 2000; Morán et al., 2010). Also a direct effect of temperature on the phytoplankton community size structure was found in the global ocean (Mousing et al., 2014; López-Urrutia and Morán, 2015). However, Marañón et al. (2014) argue that the correlation between temperature and size structure is due to an indirect effect through nutrient supply as they did not find a direct effect of temperature when data from similar nutrient supply regimes were used.
To isolate the specific effect of temperature on the physiology of different phytoplankton groups, representative laboratory strains must be used under controlled nutrient conditions. Furthermore, physiological temperature relevant parameters need to be defined and quantified to identify groups with common traits. It is well established that the maximum growth rate of phytoplankton at optimum conditions is correlated with the cell size and can be represented by a unimodal function of cell size, with decreasing maximum growth rates above and below 2 μm (Chisholm et al., 1992; Bec et al., 2008). This correlation has been shown to be independent of the optimum temperature (Chen et al., 2014) or nutrient supply (Bec et al., 2008), but other temperature-related parameters, such as the temperature tolerance range, have not yet been tested against cell size. It is essential to gain a detailed understanding of the effect of temperature on the physiology to constrain all relevant parameters in ocean biogeochemistry models. These models explicitly represent different phytoplankton and zooplankton groups with common traits, namely PFTs, to make projections about the implications of a warming climate on the marine ecosystem and its biogeochemical cycles (Le Quéré et al., 2005).
Ocean biogeochemistry models use the generalized equation proposed by Eppley (1972) for modeling the response of maximum growth rates of a phytoplankton community to temperature. Eppley formulated two major hypotheses: First, the maximum growth rates of individual species can be represented by an optimum function in response to temperature, and second, the maximum growth rates of a phytoplankton community can be represented by an exponential function in response to temperature. In addition, he formulated an equation which describes the exponential fit to the upper limit of the maximum growth rates of a phytoplankton community in response to temperature (Equation 1 in Eppley, 1972). Neither of these two hypotheses was statistically verified in Eppley (1972). Montagnes et al. (2003) showed that the maximum growth rates of most individual species are better represented by a linear fit than an exponential fit, but they did not consider an optimum fit, nor did they test the whole phytoplankton community. Bissinger et al. (2008) showed that the upper 99th quantile of the maximum growth rates of a mixed phytoplankton community can be represented by an exponential fit in response to temperature, with a Q10 value similar to Eppley (1972), but with a higher maximum growth rate at 0°C. However, Bissinger et al. (2008) did not test other functions.
Temperature also affects the chlorophyll a to carbon ratio (θ) of phytoplankton (Geider, 1987). This effect needs to be quantified when using chlorophyll a from field observation to estimate biomass, growth rates, or the community composition. For example, its divinyl derivatives are measured by satellites to identify the picoprokaryote Prochlorococcus sp. within a phytoplankton assemblage in the field (Chisholm et al., 1992; Alvain et al., 2005). However, the chlorophyll a to carbon ratio is a variable component within the cell. Generally, it decreases with temperature due to low temperature chlorosis, slower metabolic reactions or the increase in lipids to maintain membrane fluidity (Geider, 1987). The variability of the chlorophyll a to carbon ratio can be amplified by exposure to high light intensities (Geider, 1987). A positive effect of temperature on light-harvesting components and a negative effect on photoprotective components has previously been found between 16 and 24°C for picoprokaryotes and picoeukaryotes (Kulk et al., 2012). However, more data over a wide range of temperatures need to be collected to identify and quantify significant relationships.
The present study will investigate the influence of temperature on the physiology of nine picophytoplankton strains, with the aim of informing the representation of picophytoplankton in ocean biogeochemistry models. It will specifically: (a) quantify the response of maximum growth rates to temperature; (b) evaluate the two hypotheses of Eppley (1972); (c) extract the temperature-related parameters, separately for individual strains and the group of picoprokaryotes, picoeukaryotes, and picophytoplankton; and investigate the relationship (d) between cell size and the temperature-related parameters, and (e) between the chlorophyll a to carbon ratio and temperature.
Materials and Methods
Cultures and Experimental Setup
Representative strains of picophytoplankton from diverse taxonomic classes were obtained from the Roscoff culture collection (RCC, Vaulot et al., 2004), to investigate the effect of temperature on the maximum growth rates of picophytoplankton. They include three picoprokaryotes, represented by Synechococcus sp. (RCC 30), a high light (HL), and a low light (LL) ecotype of Prochlorococcus sp. (RCC 296 and 162, respectively), as well as the picoeukaryotes Bolidomonas pacifica (RCC 212), which was recently renamed as Triparma eleuthera (Ichinomiya et al., 2016), Micromonas pusilla (RCC 1677), Picochlorum sp. (RCC 289), Nannochloropsis granulata (RCC 438), Imantonia rotunda (RCC 361), and Phaeomonas sp. (RCC 503) (Table 1). All strains were grown in artificial seawater medium (ESAW) (Berges et al., 2001) with ammonium [882 μM (NH4)2SO4] as the nitrogen source and addition of 10 nM selenium (Na2SeO3). The physiological experiments in response to temperature were conducted in 55 ml tubes (Pyrex Brand 9826), which were placed into a temperature gradient bar The temperature gradient bar was built with space for 65 culture tubes in 13 rows and 5 columns. A temperature gradient is generated by heating one of the short ends and cooling the other end to achieve a gradient between −0.5 and 33°C. Each tube is lighted by an individual ultrabright LED (Winger WEPW1-S1 1W, 95 Lumen, white), achieving a light intensity of up to 480 μmol photons m−2 s−1 inside the tubes. The LED drivers are connected to mains electricity through a timer in the control unit, running on a 14:10 h light-dark cycle. Light was measured with a Radiometer (Biospherical Instruments Inc. QSL-2101) to be 291 ± 18 μmol photons m−2 s−1 for 8 strains and 81 ± 5 μmol photons m−2 s−1 for the low light Prochlorococcus sp. strain. These values are consistent with the average species specific light saturation levels (Stawiarski, 2014). To exclude any effect of light limitation or light inhibition, near optimum light conditions were chosen for each strain. A separate study with incubations at light intensities between 10 and 720 μmol photons m−2 s−1 has been conducted beforehand. The low light Prochlorococcus strain reached its highest growth rates with light saturation between 64 and 120 μmol photons m−2 s−1, but was light inhibited at light intensities > 120 μmol photons m−2 s−1. All other strains reached light saturation between 120 and 330 m−2 s−1. No light inhibition occurred at light intensities <330 μmol photons m−2 s−1.
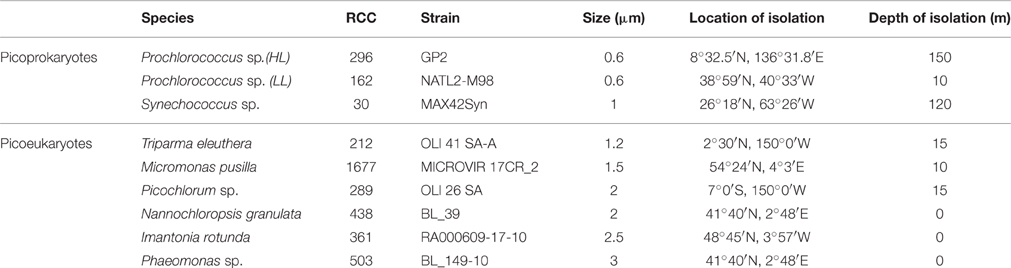
Table 1. Picophytoplankton strains examined within this study, including three strains of picoprokaryotes and six strains of picoeukaryotes, their Roscoff culture collection number (RCC), stain, average cell size (diameter), and location and depth of isolation.
Temperatures were measured with a Grant Squirrel 1000. Thanks to the insulation at the sides and top of the temperature gradient bar, the average temperature gradient is linear (linear regression of temperature difference between adjacent sets of tubes, p = 0.9). However, the middle tubes in each column tend to be slightly colder at the cold end (up to 0.5°C), and as a consequence the standard deviation of the temperature in the five tubes is higher (p = 0.002). To prevent this from biasing the results, measurements are reported at the temperature measured in each tube.
Analyses
For measuring the maximum growth rates, cultures of each strain were acclimated at 13 different temperatures for at least four divisions to reach balanced growth before daily in vivo fluorescence measurements were taken with a Turner Design Fluorometer (10 AU) (Anderson, 2005). Samples were placed in the dark prior to measurements and were measured until the signal stabilized. Only acclimated cultures were used within the present study, hence the fluorescence signal is considered as proportional to the low cell densities which were used (Anderson, 2005). The benefit of using this method instead of collecting cell counts was that the culture tube from the temperature gradient bar fits into the sample slot of the Fluorometer. Thus, no volume needed to be removed from the culture tube. The average cell size of the picophytoplankton strains was either provided by the RCC or obtained from the literature for T. eleuthera (Guillou et al., 1999).
To obtain chlorophyll a to carbon ratios, samples of particulate organic carbon (POC) and chlorophyll a were collected while the culture was still in exponential growth phase. POC was sampled on pre-combusted 13 mm GF/F filters for all strains. A layer of 3 filters was used for both Prochlorococcus sp. strains, because preliminary tests showed that their cells did not pass through, but were too small to remain on a single filter. Medium blanks were collected for each number of filter layers. Samples of chlorophyll a were collected on pre-combusted 25 mm GF/F filters for 7 strains, but on 25 mm polycarbonate filters (0.2 μm) for both Prochlorococcus sp. strains. Both filter types were shown to lead to comparable chlorophyll a results using phytoplankton samples (Hashimoto and Shiomoto, 2000). Depending on the cell density of the culture, between 5 and 20 ml per sample were filtered and rinsed with Milli-Q water. After sampling all filters were frozen in liquid nitrogen immediately, and stored at −80°C until analyses. The cell numbers were measured by flow cytometry (BD Biosciences FACSCalibur, flow cytometer) and the flow rate was calibrated using the method of Marie et al. (2005).
For analysis, the POC samples were dried at 40°C for 24 h, placed into pre-combusted tin capsules and analyzed with an elemental analyser (Exeter Analytical, CE-440 Elemental Analyser), which was calibrated with acetanilide (Exeter Analytical). The chlorophyll a samples were extracted in 10 ml acetone (Fisher Scientific, 99.8+ %) in 15 ml centrifuge tubes and disintegrated by shaking and vortexing. The tubes were then wrapped in aluminum foil and stored at 4°C for 24 h. Prior to analysis, the samples were centrifuged and the supernatant was analyzed in a Fluorescence Spectrometer (PerkinElmer LS 45 Luminescence Spectrometer). After reading a sample, 3 drops of 8% HCl were added into the cuvette to measure the background signal caused by chlorophyll degradation products such as phaeopigments. The concentration of the calibration standard (SIGMA product No C5753) was also obtained prior to analyses (Parson et al., 1984).
Calculations
The maximum growth rates of all strains were calculated by linear regression through at least three consecutive measurements of the log-transformed in vivo fluorescence measurements during the exponential growth phase. To test for the best representation of the response of the maximum growth rates to temperature, a linear, an exponential, and an optimum fit (Equations 1–3) were applied to the maximum growth rate measurements of each strain, of each of the two groups (picoprokaryotes or picoeukaryotes) and also of all strains combined, representative for a group of picophytoplankton.
where μmax is the maximum growth rate, is the maximum growth rate at 0°C, T is the temperature, Q10 is the temperature dependence, which is a measure for the increase of the maximum growth rate with the increase of temperature by 10°C, μOpt is the optimum growth rate, TOpt is the optimum temperature, and △T is half the width of the temperature range at μOpt × exp(−1), which will be referred to as temperature tolerance range, not to be confused with Tmax − Tmin, which will be referred to as the temperature span.
The temperature-related parameters and their standard errors were estimated by minimizing the sum of squares between the fits and the measurements using the Gauss-Newton method in Mystat 12 (Systat software). The obtained parameters were not unique for the optimum fit to the combined data of all strains, because the optimum temperature was indefinite. For this reason, the sum of squares between the model and the data were calculated 15 times with varying starting values and it was found, that there was only a minor variability in the residual sum of squares (<0.03%) and the parameters.
The relative quality of the three fits to equations 1–3 was compared using the Akaike's Information Criterion (AIC), which compares fits with different numbers of parameters (Equation 4, Burnham and Anderson, 1998).
where nobs is the number of observations, σ2 is the standard deviation and nparam is the number of parameters given in the equation of the fit. The lowest AIC value indicates the best fit. Although there is no formally defined significance level associated with the value of AIC, we have used the definition in Burnham and Anderson (1998), who state that if an AIC differs by less than 2 from the lowest value, this fit is also appropriate.
The data were also compared to the exponential fit presented in Eppley (1972) to the upper limit of the maximum growth rates of a mixed group of phytoplankton, which will be referred to as the absolute maximum growth rates, in response to temperature (Equation 5).
where the first constant is and the second constant is the Q10.
To calculate the absolute maximum growth rates for a group of picophytoplankton and picoprokaryotes in response to temperature, we followed the method used by Bissinger et al. (2008). For this, we calculated the upper 99th quantile of the maximum growth rates for both groups by applying a linear quantile regression through the log-transformed maximum growth rates. The Software R with the software package quantreg was used (Koenker, 2006) with a significance level of p < 0.001. The resulting coefficients were then exponentially converted and the fit was compared to the fit presented in Eppley (1972). As an alternative means of showing the absolute maximum growth rates of a picophytoplankton community, we also calculated the linear, exponential and optimum fitthrough the optimum temperatures vs. optimum growth rates of the nine strains only.
Statistical Analysis
To test for significant differences in the maximum growth rates or in the obtained temperature related parameters between the two picophytoplankton groups, the Wilcoxon-Mann–Whitney-U-test was used (p ≤ 0.05, df = 1).To test for cell size related trends of the temperature related parameters, the Mitchell-Olds and Shaw test was used (p ≤ 0.05) (Mitchell-Olds and Shaw, 1987). It tests for an intermediate maximum, in contrast to a monotonic relationship with extreme values at each end. For the linear trends in the response of the chlorophyll a to carbon ratios to temperature, a linear regression was applied and the obtained coefficients were analyzed by one-way ANOVA (p ≤ 0.05).
Results
Temperature-Response of Individual Picophytoplankton Strains
The maximum growth rates of picoprokaryotes range from 0.07 to 0.82 d−1 and of picoeukaryotes from 0.005 to 2.04 d−1 over the full range of tested temperatures (Figure 1). These rates generally increase with temperature up to an optimum temperature (TOpt), above which they decrease (Figure 1) for all individual picophytoplankton strains. The AIC values are also smallest for the optimum fit (Equation 3) for seven of the nine individual strains (Table 2; Figure 1) compared to the linear (Equation 1) or exponential fit (Equation 2). For the two remaining strains, the AIC values for the optimum fit are within the range of an acceptable representation. M. pusilla did not grow at all above the optimum temperature. Therefore, there was no acclimated growth rate above the optimum temperature that would have been needed to get a good fit to the optimum function, and its growth rates are better represented by a linear fit. T. eleuthera grew at only four temperatures, thus the available data for this strain were insufficient to distinguish between the fits. The generally best agreement with the optimum fit suggests that three temperature-related parameters need to be quantified for the representation of the response of growth rates of individual strains to temperature: μOpt, TOpt, and ΔT (Table 3).
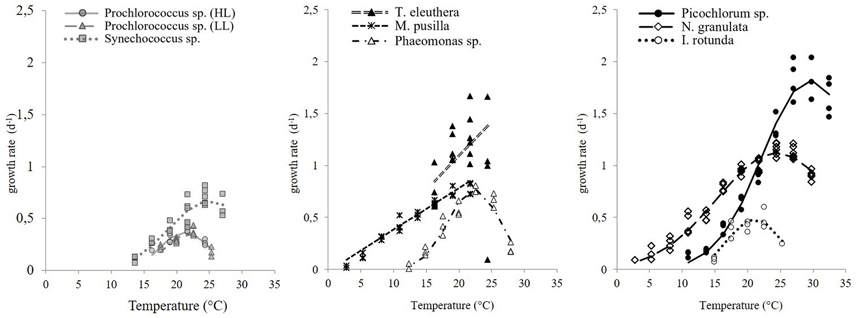
Figure 1. The response of maximum growth rates of picophytoplankton to temperature, including three strains of picoprokaryotes (gray symbols) and six strains of picoeukaryotes (black or white symbols). The lines indicate the best fit chosen by AIC values.
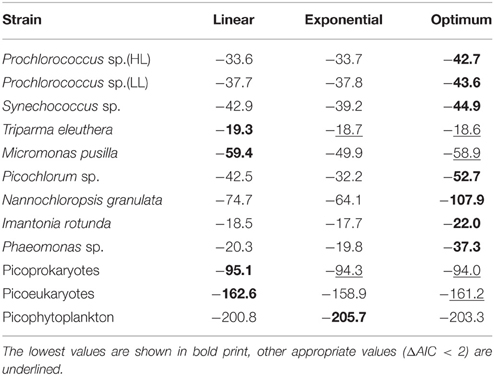
Table 2. AIC values for the linear, exponential and optimum fits for individual picophytoplankton strains, both groups of picoprokaryotes and picoeukaryotes, and picophytoplankton.
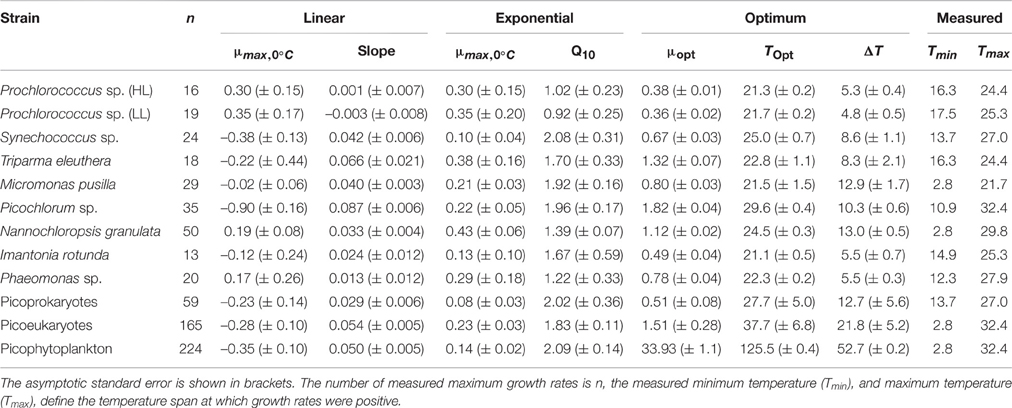
Table 3. Temperature-related parameters for a linear, exponential, and optimum fit to represent the response of the maximum growth rates to temperature for individual picophytoplankton strains, both groups of picoprokaryotes and picoeukaryotes, and picophytoplankton.
The derived optimum growth rates (μOpt) differ significantly (p = 0.04, df = 1) between the two groups, the average for picoprokaryotes is 0.47 ± 0.17 d−1 and for picoeukaryotes it is 1.05 ± 0.47 d−1. The average optimum temperature (TOpt) of the individual strains is 23.3 ± 2.7°C and the temperature tolerance range (ΔT) is 8.2 ± 3.3°C, with no significant difference in these two temperature-related parameters (pTOpt = 0.8; pΔT = 0.12, df = 1) between picoprokaryotes and picoeukaryotes. None of the three temperature-related parameters was correlated with the latitude of isolation of the strains (Figure 2), i.e., tropical strains did not have a significantly higher TOpt than temperate strains. However, the overall temperature span at which the growth rates are positive is narrower for the three investigated strains of picoprokaryotes (13.7–27°C, Table 3) than for the six strains of picoeukaryotes (2.8–32.4°C). Nannochloropsis granulata, M. pusilla and Picochlorum sp., the three intermediate sized picoeukaryotes, grow at the most measured temperatures spanning up to 27°C, which is reflected in their higher ΔT values. Cell size has an effect on the temperature-related parameters for the individual picophytoplankton strains tested within this study. A significant unimodal relationship was found between the temperature tolerance range (ΔT) and cell size (R2 = 0.73, p = 0.018), but not between μOpt (R2 = 0.49, p = 0.17), or TOpt (R2 = 0.25, p = 0.43) and cell size. The cell size at which ΔT is maximal is 1.8 μm (Figure 2). There is also statistical support (p < 0.01, Mitchell-Olds and Shaw test) for a maximum of μOpt at the higher end of measured values of ΔT, although μOpt does not increase significantly with ΔT (p = 0.1, linear regression, one-way ANOVA).
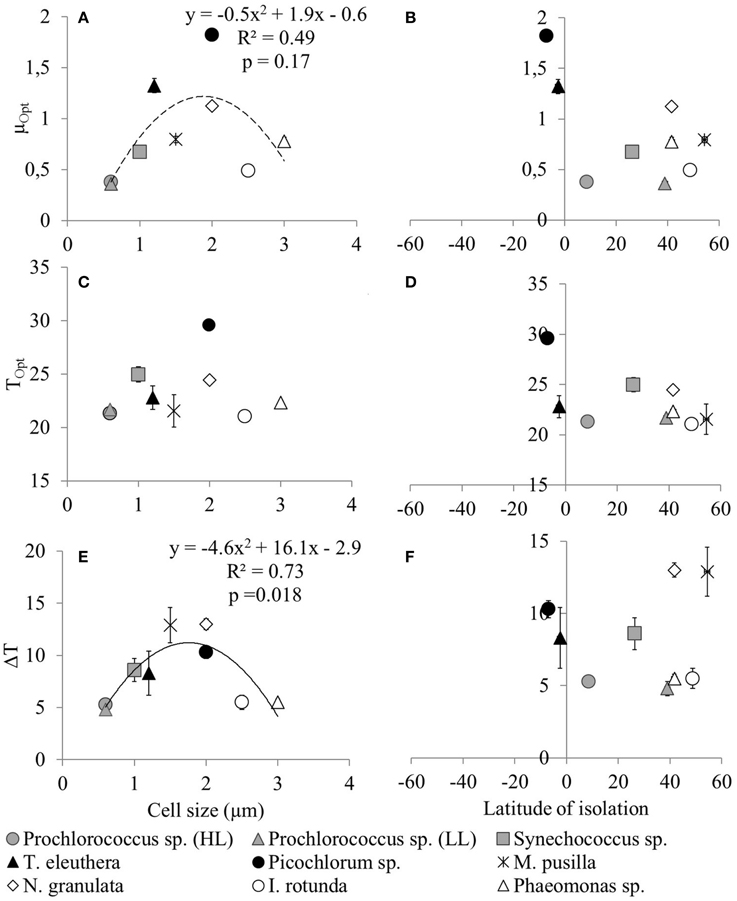
Figure 2. Temperature-related parameters of individual picophytoplankton strains (μopt, Topt and ΔT) as a function of cell size (A,C,E) or latitude of isolation (B,D,F). The temperature-related parameters were obtained from an optimum fit (Equation 3) to the measured maximum growth rates of individual picophytoplankton strains for the representation of the response of maximum growth rates to temperature and are shown in Table 3. Error bars are asymptotic standard errors. Lines indicate unimodal functions [continuous line: Significant, p = 0.018, r2 = 0.728; dotted line: Not significant, p = 0.17, r2 = 0.485, but included because a significant trend was found by Bec et al. (2008)].
Temperature-Response of Picophytoplankton
The maximum growth rates for the picoprokaryotes in response to temperature can be described equally well by all three fits (similar AIC values; Table 2), but the maximum growth rates for the picoeukaryotes are best described by either the linear or the optimum fit. Finally, the maximum growth rates for the group of picophytoplankton are best described by the exponential fit (Figure 3) and can be quantified by the two temperature-related parameters and Q10 (Table 3).
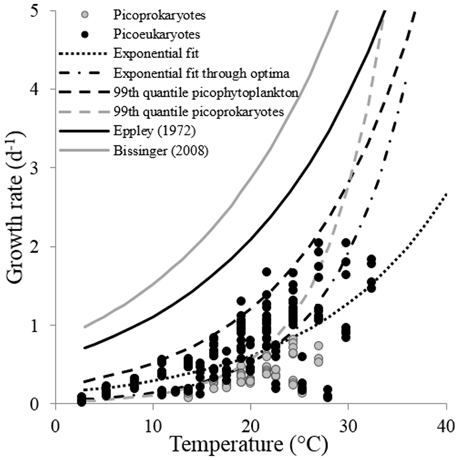
Figure 3. The response of the maximum growth rates of a group of picophytoplankton to temperature. The lines indicate different fits discussed within this study: The exponential fit obtained from Equation (2) (exponential fit), the exponential fit through optimum growth rates at optimum temperatures of individual strains (exponential fit through optima), the exponential fit obtained from a 99th quantile regression to maximum growth rates of both, a group of picophytoplankton (99th quantile picophytoplankton), and a group of picoprokaryotes (99th quantile picoprokaryotes) and the fits presented in Eppley (1972) and Bissinger et al. (2008).
In order to compare the temperature response of the group of picophytoplankton or of picoprokaryotes to the parameters obtained by Eppley (1972) and Bissinger et al. (2008), a fit to the upper exponential 99th quantile of the maximum growth rates was calculated (Figure 3). For the group of picophytoplankton (μpic) the calculated Q10 is 2.3 (Equation 6) but of picoprokaryotes (μpro) the temperature response is stronger and results in a much higher Q10 of 4.9 (Equation 7). For the picoeukaryotes (μeuk) the Q10 would be 2.8 (Equation 8), but the AIC does not give support for an exponential fit as an acceptable representation of the maximum growth rates in response to temperature for this group (Table 2). Hence we will exclude this fit from the further discussion.
The corresponding coefficients for the linear regression to the logarithmically transformed data are presented in Table 4.
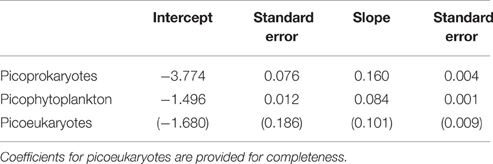
Table 4. Coefficients obtained from a linear 99th quantile regression to the log-transformed maximum growth rates of a group consisting of picoprokaryotes, and of picophytoplankton, using strains examined within this study with standard errors.
A different method to represent the response of the absolute maximum growth rates of the group of picophytoplankton to temperature is to test the fits through the optimum values of the nine strains (Figures 3, 4). With this method, the AIC value is lowest for the linear fit (−5.41), is also appropriate for the exponential fit (−5.3), but clearly better than for the optimum fit (−2.68).
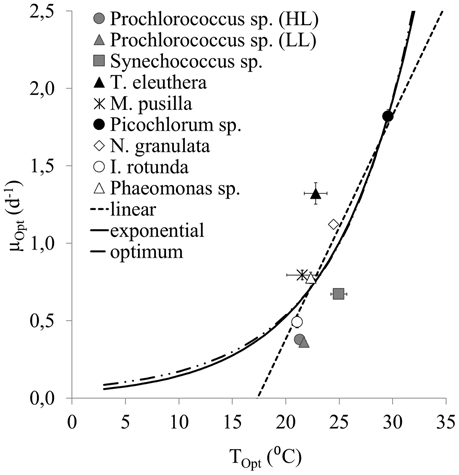
Figure 4. A linear, exponential and optimum fit through optimum growth rates at optimum temperatures of the individual strains examined within this study. Error bars represent the standard error.
Chlorophyll a to Carbon Ratios
The chlorophyll a to carbon ratio (θ) for the group of picophytoplankton increases significantly with temperature between 0.004 and 0.037 g Chl g−1 C (R2 = 0.42, p < 0.001, Figure 5), and can be described by Equation (9).
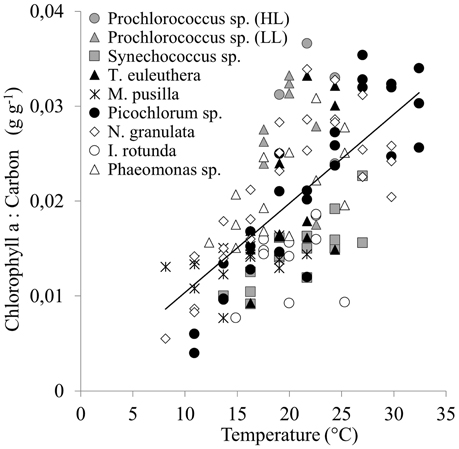
Figure 5. The response of the chlorophyll a to carbon ratios of a group of picophytoplankton to temperature. The line indicates a linear regression including data for all 9 species (Equation 9, r2 = 0.42, p < 0.001).
This relationship is also significant (p ≤ 0.05) for individual strains (see Supplementary Material), unless a strain grew only over a narrow temperature range (both Prochlorococcus sp. strains and Imantonia rotunda), or there was a high variability in the data over a low range of chlorophyll a to carbon ratios (Micromonas pusilla). Four strains show a drop in chlorophyll a to carbon ratio above TOpt (both Prochlorococcus sp. strains, Picochlorum sp., and Nannochloropsis granulata).
The cellular chlorophyll a concentration increases significantly (p < 0.05) with temperature for seven strains (see Supplementary Material). For M. pusilla it becomes significant (p = 0.005) if the four highest outliers over the whole temperature range are excluded. For I. rotunda a significant (p = 0.038) increase in chlorophyll a is found up to its optimum temperature. There is also a stronger significance (p < 0.001) for N. granulata up to its optimum and a decrease, however not significant above its optimum temperature. No significant trend was found for the high light Prochlorococcus sp. strain. Phaeomonas sp. shows a significantly (p = 0.037) decreasing trend with increasing temperature.
The cellular carbon concentration increases significantly with temperature for the low light Prochlorococcus sp. strain (p = 0.004). It decreases significantly for the three picoeukaryotes N. granulata (p < 0.001), Phaeomonas sp. (p = 0.001), and for Picochlorum sp. between 14 and 27°C (p = 0.016). No significant trends were established for the other strains.
Discussion
Temperature-Response of Individual Picophytoplankton Strains
In agreement with the first hypothesis formulated by Eppley (1972), our results show strong evidence that the maximum growth rates of individual picophytoplankton strains in response to temperature are best represented by an optimum function. Thus, the best way to parameterize this response is to describe their optimum growth rates, optimum temperatures, and temperature tolerance ranges.
The optimum growth rates, which were obtained for the individual strains of picoprokaryotes are lower than of picoeukaryotes. This confirms theoretical assumptions concerning the deviation of picophytoplankton from the classical allometric relationship with decreasing maximum growth rate with cell size in this group (Raven, 1998; Bec et al., 2008). The optimum temperatures, are slightly lower for Prochlorococcus sp. than for Synechococcus sp., which is also in agreement with previous studies (Moore et al., 1995; Johnson et al., 2006; Zinser et al., 2007). However, our estimated values are both lower than previously reported values of 24–25 and 28°C, respectively for the two species. There are different reasons which may cause this discrepancy. A possible reason is that none of these studies applied an optimum fit to their results. Instead TOpt was only described as the temperature at which the highest growth rate (μOpt) was measured, even though TOpt and μOpt may be achieved between the tested temperatures. We have shown that the optimum function gives the best fit of the response of growth rates of individual picophytoplankton strains to temperature. We therefore conclude that our technique is more accurate in defining TOpt, because it is able to interpolate between data points and provide error intervals. Another potential reason could be the change of photophysiological properties with temperature. We show that the increase in chlorophyll a to carbon ratio is due to the significant increase in cellular chlorophyll a concentration for most strains. This is in agreement with the expected increase of light harvesting compounds with increasing temperature and is also associated with the decrease of photoprotective compounds (Geider, 1987). This effect may also contribute to the shift of the optimum temperature with light intensity (Geider, 1987). The strains used by Moore et al. (1995) and those in the present study were grown under light saturation. For this an extensive series of light experiments has been conducted for the strains examined here beforehand (Stawiarski, 2014). However, these different strains also have different light optima. Hence, the differences in temperature optima may also be attributed to the natural variability of ecotypes, which may be linked to the adaptation to different light conditions (Johnson et al., 2006; Zinser et al., 2007). The optimum temperatures for picoeukaryotes obtained within the present study are similar to those presented in previous studies (20–25°C) (Throndsen, 1976; Cho et al., 2007). A full description of the light response at constant temperature of some of these strains will be published in a separate paper (Stawiarski et al., in prep.).
TOpt is a common temperature-related parameter, which is used for modeling the distribution of different phytoplankton groups. Our results demonstrate that there are no significant differences in TOpt between picoprokaryotes and picoeukaryotes. Also there is no relationship between optimum temperature or latitude of isolation for the strains examined here, but both groups have been shown to occupy different thermal niches in the field (Buitenhuis et al., 2012). One could argue that culturing conditions may have led to a genetic adaptation and a shift in TOpt, but we found that Picochlorum sp., the tropical strain which has been in culture the longest, shows the strongest deviation (>9°C) from its permanent culturing temperature. Contrary to our results, a study, in which an optimum function was used to obtain temperature-related parameters for 194 different strains of phytoplankton, found that TOpt follows an unimodal function of latitude and annual mean temperature of isolation (Thomas et al., 2012). We may not have found this trend in our data because of the much smaller number of data points we could obtain. However, they also find that TOpt shows considerable deviations from the annual mean temperature in polar and temperate waters, which suggests that TOpt is not the ultimate parameter controlling the distribution. Peak in situ abundances of different phytoplankton groups are not found at optimum temperatures, because of the combination of fluctuations in local temperature and the sharp drop in growth rates above TOpt.
The temperature span at which growth was positive for individual strains in our study is comparable to their in situ distribution. Peak in situ abundances of Prochlorococcus sp. were reported at both lower (19°C) and higher temperatures (25–28°C) than their optimum temperature (Zinser et al., 2007) with strong inhibition above 28°C (Moore et al., 1995). The upper limit of the temperature span for the Prochlorococcus sp. strains presented here is consistent with those results, and the lower limit of the temperature span is consistent with the results of Kulk et al. (2012). We show that some picoeukaryotes grow over a wider span of temperatures than the smaller picoprokaryotes. However, we do not find a direct correlation between ΔT and latitude of isolation, which is in agreement with the study by Thomas et al. (2012). Instead, we find evidence that ΔT, is significantly correlated with picophytoplankton cell size and can be represented by a unimodal function. The bigger picoprokaryote Synechococcus sp. grew over a wider span of temperatures than the smaller Prochlorococcus sp., consistent with earlier studies (Moore et al., 1995; Malinsky-Rushansky et al., 2002; Mackey et al., 2013). Also, the picoeukaryotes of an intermediate size (~2 μm) had a higher ΔT than other-sized members of the group. Together with the higher maximum growth rates of this intermediate size class (Bec et al., 2008) we suggest that their relatively high temperature tolerance range may contribute to their ubiquitous distribution. However, cell size and its variability would explicitly need to be measured over the full range of temperatures to gain a better understanding of this relationship.
We also find that a higher optimum growth rate is achieved by picophytoplankton strains with a high temperature tolerance range. In practice this would favor generalists in the field rather than allowing the coexistence of several specialist strains in different niche spaces. A field study has shown that 90% of analyzed gene sequences of picoeukaryotes can be attributed to Prasinophyceae, of which M. pusilla, an intermediate sized picoeukaryote, is an important member, with higher contributions in temperate and polar areas (Vaulot et al., 2008). In agreement with these results, we show that M. pusilla has a relatively high temperature tolerance range and a relatively high optimum growth rate. However, the study by Vaulot et al. (2008) was biased toward coastal areas and other factors such as light, nutrients, and water column stratification also need to be considered, especially in the open and oligotrophic ocean when investigating the community structure (Johnson et al., 2006; Bouman et al., 2011).
Temperature-Response of Picophytoplankton
In agreement with the second hypothesis formulated by Eppley (1972), our results show that the maximum growth rates for the group of picophytoplankton in response to temperature are best represented by an exponential function (Table 2, Figure 3). This representation is also appropriate for the group of picoprokaryotes alone (Table 2). Hence, for the calculation of the absolute maximum growth rates of these two groups we follow the approach by Bissinger et al. (2008), who confirmed the Q10 (1.88) estimated by Eppley (1972) for a mixed phytoplankton group. Our results show that for a group of picophytoplankton the temperature-dependence is higher and for a group of picoprokaryotes more than twice as high (Table 4, Figure 3, Equations 6, 7) as for this group of mixed phytoplankton. These results are in agreement with recent studies on picophytoplankton, which found a higher Q10 value for picophytoplankton compared to larger species (Chen et al., 2014) and also higher values for picoprokaryotes (3.6–4.4) than for picoeukaryotes (1.7–2) (Kulk et al., 2012). It should be noted that the variance in the data increases with temperature, which could bias the statistical results at small sample size. We found that the main contributor to the increase in variance is the interspecific variation of μopt. However, the average squared residuals have a quite similar distribution as a function of temperature for the three functions. In addition, our sample size of 224 growth rates is large, so that the increase in variance would not bias the results, and we conclude that the comparison of Delta AIC to decide which function fits the data best seems valid despite the increase in variance with temperature in the observations.
The fit to the absolute maximum growth rates of the group of picophytoplankton in response to temperature presented in our study is lower than the fit presented in Eppley (1972). This can be explained by the generally lower maximum growth rates of picophytoplankton compared to those of other phytoplankton groups, e.g., diatoms (Furnas, 1990). The study by Eppley (1972) contained various groups of faster-growing phytoplankton and a substantial number of diatoms (43%). However, Bissinger et al. (2008) showed that a higher proportion of diatoms (68%) would not affect the fit. It is unclear, though, how high the proportion of picophytoplankton was in the database used in Bissinger et al. (2008). The lower absolute maximum growth rates and the higher Q10 of the picophytoplankton examined here compared to mixed phytoplankton highlight the importance of quantifying the response of different phytoplankton groups to temperature individually. Especially in ocean regions where picoprokaryotes dominate the phytoplankton biomass, the influence of their higher Q10 must be considered when modeling the response of the phytoplankton community to increased temperature as a consequence of climate warming.
We find that the group of picoeukaryotes grow over a wider span of temperatures than the smaller picoprokaryotes. Although our sample size of picoeukaryote species is larger than of picoprokaryote species, and we therefore have to be cautious about the interpretation of the wider temperature span of the picoeukaryotes as a group, these sample sizes reflect the diversity in the ocean of the two groups of picophytoplankton. Picoeukaryotes are spread across 12 classes in 4 divisions while there is only one class of picoprokaryotes (Vaulot et al., 2008). In addition, it is well established that picoeukaryotes dominate picophytoplankton biomass in colder waters at latitudes above 40° and have similar biomass at lower latitudes, but the smaller picoprokaryotes are more restricted toward warmer (sub-)tropical ocean waters (Buitenhuis et al., 2012). We therefore suggest that the difference in temperature span between the two groups could be real.
Our results further show that the exponential fit to the optimum growth rates only of all examined strains is lower than the fit to the upper 99th quantile of their maximum growth rates. This is because the maximum growth rates of faster-growing species at sub-optimum temperatures are higher than the optima of slower growing species. The fit through the optima was initially presented as an alternative method for representing the response of the absolute maximum growth rates of a phytoplankton community to temperature by Eppley (1972, Figure 2). However, more data of picophytoplankton strains with optima at lower temperatures would need to be included to distinguish better between these two methods of deriving the absolute maximum growth rates of a phytoplankton community.
Temperature and the Chlorophyll a to Carbon Ratio
Phytoplankton acclimate to the prevailing environmental conditions by changing their cell composition. The chlorophyll a to carbon ratio is an important variable for measuring biomass and primary production and varies between different phytoplankton groups, e.g., diatoms have higher chlorophyll a to carbon ratios compared to picophytoplankton (Geider et al., 1997). In agreement with previous studies (Eppley, 1972; Geider, 1987) we show that with increasing temperature the chlorophyll a to carbon ratio also increases for the group of picophytoplankton. We also show that this effect on the chlorophyll a to carbon ratio is caused by the increase in chlorophyll a concentration with temperature, rather than by a potential decrease of cellular carbon.
We also indicate a drop above the optimum temperature for some individual strains. This reduction in photosynthetic machinery at supra-optimal temperatures is comparable to the effect caused by photoinhibition at high light levels to reduce damage (Geider, 1987) and is thus consistent with the photosynthetic model of Baumert and Petzoldt (2008), which attributes the decrease of growth rate above TOpt to an increase in light inhibition with temperature.
Picophytoplankton and Climate Warming
Picophytoplankton, including both groups of picoprokaryotes and picoeukaryotes, is treated as a single plankton functional type in ocean biogeochemical models (Le Quéré et al., 2015). Hence, the assumption is that it can be represented with a common set of physiological traits. Generally, there is some support for this assumption, as both groups of picophytoplankton are adapted to low nutrient and light conditions because of their high nutrient uptake and light harvesting efficiency compared to other phytoplankton groups (Raven, 1998). Both adaptations could help to explain their better success in oligotrophic (Alvain et al., 2008) and deep mixed water columns (Veldhuis et al., 2005). However, the distribution of picoprokaryotes is inversely related to that of picoeukaryotes in the natural environment (Buitenhuis et al., 2012), and these distributions are correlated with nitrogen concentration and depth of the euphotic layer (Bouman et al., 2011). In addition, temperature was also shown to be an important predictor for the realized ecological niche space of diverse phytoplankton groups (Brun et al., 2015). The temperature span at which growth was positive for Prochlorococcus sp. presented in our study is consistent with the quartile temperature span of the realized ecological niche (16–25°C) in the study by Brun et al. (2015) which uses observations from MAREDAT (Buitenhuis et al., 2013). Unfortunately, they were not yet able to specifically separate the realized ecological niche of picophytoplankton due to the lack of available data on a broader range of species. Our study highlights the importance of quantifying the direct impact of each temperature-related parameter for a large variety of phytoplankton strains to define fundamental ecological niches, which are required for the formulation of ocean biogeochemistry models (Le Quéré et al., 2005), and which aim to represent realized ecological niches as emergent properties (Follows et al., 2007).
With ongoing climate warming, the biomass and productivity of picophytoplankton relative to other phytoplankton could increase due to enhanced water column stratification and lower nutrient availability (Behrenfeld et al., 2006; Morán et al., 2010). The results presented here support a potential advantage for picophytoplankton as a consequence of the higher temperature dependence of their maximum growth rates compared to other phytoplankton groups. Picophytoplankton shows a stronger increase in absolute maximum growth rates with temperature with a Q10 of 2.3 compared to coccolithophores with a Q10 of 1.7 (Buitenhuis et al., 2008), and a mixed phytoplankton community with a Q10 of 1.88 (Eppley, 1972). However, the relative advantage of the temperature dependence of the absolute maximum growth rates of picophytoplankton also needs to be considered within an ecosystem with trophic interactions in a warming climate, where the effect of temperature on the top down control by zooplankton may also alter the phytoplankton community structure.
In addition, we suggest that climate warming may also change the composition of the picophytoplankton community itself. Even though picoprokaryotes may show a stronger increase in biomass in specific regions due to their higher Q10, they are restricted by a narrower temperature tolerance range. The sharp decrease of maximum growth rates above the optimum temperature suggest that the temperature tolerance range is also an influential parameter for the distribution of phytoplankton species and its change with climate warming. We therefore assume that picoprokaryotes will be shifted to higher latitudes or depth. This shift has already been suggested using a neural network model which defines niches of two picoprokaryotes based on temperature, PAR and nutrient availability (Flombaum et al., 2013). However, we also suggest that picoeukaryotes, in particular those of an intermediate size around 2 μm, will be able to increase their contribution to phytoplankton biomass over a wider temperature span.
Authors Contributions
BS conducted the laboratory experiments, analyzed the data, and is the lead author on this paper. EB and CL wrote the project proposal, acquired funding, and put forward some of the hypotheses. All authors co-wrote the manuscript.
Funding
The research leading to these results has received funding from the European Community's Seventh Framework Programme (FP7 2007-2013) under grant agreements n° 238366 (Greencycles II) and 282672 (EMBRACE), and the Natural Environment Research Council grant n° NE/K001302/1(i-MarNet).
Conflict of Interest Statement
The authors declare that the research was conducted in the absence of any commercial or financial relationships that could be construed as a potential conflict of interest.
Supplementary Material
The Supplementary Material for this article can be found online at: https://www.frontiersin.org/article/10.3389/fmars.2016.00164
References
Agawin, N., Duarte, C. M., and Agustí, S. (2000). Nutrient and temperature control of the contribution of picoplankton to phytoplankton biomass and production. Limnol. Oceanogr. 45, 591–600. doi: 10.4319/lo.2000.45.3.0591
Alvain, S., Moulin, C., Dandonneau, Y., and Breon, F. (2005). Remote sensing of phytoplankton groups in case 1 waters from global seaWiFS imagery. Deep Sea Res. Part I Oceanogr. Res. Pap. 52, 1989–2004. doi: 10.1016/j.dsr.2005.06.015
Alvain, S., Moulin, C., Dandonneau, Y., and Loisel, H. (2008). Seasonal distribution and succession of dominant phytoplankton groups in the global ocean: a satellite view. Glob. Biogeochem. Cycles 22, 1–15. doi: 10.1029/2007GB003154
Azam, F., Fenchel, T., Field, J. G., Gra, J. S., and Thingstad, F. (1983). The ecological role of water-column microbes in the sea. Mar. Ecol. Prog. Ser. 10, 257–263.
Baumert, H. Z., and Petzoldt, T. (2008). The role of temperature, cellular quota and nutrient concentrations for photosynthesis, growth and light–dark acclimation in phytoplankton. Limnologica Ecol. Manag. Inland Waters 38, 313–326. doi: 10.1016/j.limno.2008.06.002
Bec, B., Collos, Y., Vaquer, A., Mouillot, D., and Souchu, P. (2008). Growth rate peaks at intermediate cell size in marine photosynthetic picoeukaryotes. Limnol. Oceanogr. 53, 863–867. doi: 10.4319/lo.2008.53.2.0823
Behrenfeld, M. J., O'Malley, R. T., Siegel, D. A., McClain, C. R., Sarmiento, J. L., Feldman, G. C., et al. (2006). Climate-driven trends in contemporary ocean productivity. Nature 444, 752–755. doi: 10.1038/nature05317
Berges, J. A., Franklin, D., and Harrison, P. J. (2001). Evolution of an artificial seawater medium: improvements in enriched seawater, artificial water over the last two decades. J. Phycol. 37, 1138–1145. doi: 10.1046/j.1529-8817.2001.01052.x
Bissinger, J. E., Montagnes, D. J. S., Sharples, J., and Atkinson, D. (2008). Predicting marine phytoplankton maximum growth rates from temperature: improving on the eppley curve using quantile regression. Limnol. Oceanogr. 53, 487–493. doi: 10.4319/lo.2008.53.2.0487
Bouman, H., Ulloa, O., Barlow, R., Li, W. K. W., Platt, T., Zwirglmaier, K., et al. (2011). Water-column stratification governs the community structure of subtropical marine picophytoplankton. Environ. Microbiol. Rep. 241, 1–10. doi: 10.1111/j.1758-2229.2011.00241.x
Brun, P., Vogt, M., Payne, M. R., Gruber, N., O'Brien, C. J., Buitenhuis, E. T., et al. (2015). Ecological niches of open ocean phytoplankton taxa. Limnol. Oceanogr. 60, 1020–1038. doi: 10.1002/lno.10074
Buitenhuis, E. T., Li, W. K. W., Vaulot, D., Lomas, M. W., Landry, M. R., Partensky, F., et al. (2012). Picophytoplankton biomass distribution in the Global Ocean. Earth Syst. Sci. Data 4, 37–46. doi: 10.5194/essd-4-37-2012
Buitenhuis, E. T., Pangerc, T., Franklin, D., Le Quéré, C., and Malin, G. (2008). Growth rates of six coccolithophorid strains as a function of temperature. Limnol. Oceanogr. 53, 1181–1185. doi: 10.4319/lo.2008.53.3.1181
Buitenhuis, E. T., Vogt, M., Moriarty, R., Bednaršek, N., Doney, S. C., Leblanc, K., et al. (2013). MAREDAT: towards a world atlas of MARine ecosystem DATa. Earth Syst. Sci. Data 5, 227–239. doi: 10.5194/essd-5-227-2013
Burnham, K. P., and Anderson, D. R. (1998). “Akaike's information criterion,” in Model Selection and Multimodel Inference: A Practical Information-Theoretic Approach, (New York, NY: Springer Verlag), 42–49. doi: 10.1007/978-1-4757-2917-7_1
Chen, B., Liu, H., Huang, B., and Wang, J. (2014). Temperature effects on the growth rate of marine picoplankton. Mar. Ecol. Prog. Ser. 505, 37–47. doi: 10.3354/meps10773
Chisholm, S. W., Frankel, S. L., Goericke, R., Olson, R., Palenik, B., Waterbury, J. B., et al. (1992). Prochlorococcus marinus Nov. Gen. Nov. Sp.: an oxyphototrophic marine prokaryote containing divinyl chlorophyll a and b. Arch. Microbiol. 157, 297–300. doi: 10.1007/BF00245165
Cho, S. H., Ji, S.-C., Hur, S. B., Bae, J., Park, I.-S., and Song, Y.-C. (2007). Optimum temperature and salinity conditions for growth of green algae chlorella ellipsoidea and nannochloris oculata. Fish. Sci. 73, 1050–1056. doi: 10.1111/j.1444-2906.2007.01435.x
Fenchel, T. (2008). The microbial loop – 25 years later. J. Exp. Mar. Biol. Ecol. 366, 99–103. doi: 10.1016/j.jembe.2008.07.013
Flombaum, P., Gallegos, J. L., Gordillo, R. A., Rincón, J., Zabala, L. L., and Jiao, N. (2013). Present and future global distributions of the marine cyanobacteria Prochlorococcus and Synechococcus. Proc. Natl. Acad. Sci. U.S.A. 110, 9824–9829. doi: 10.1073/pnas.1307701110
Follows, M. J., Dutkiewicz, S., Grant, S., and Chisholm, S. W. (2007). Emergent biogeography of microbial communities in a Model Ocean. Science 315, 1843–1846. doi: 10.1126/science.1138544
Furnas, M. J. (1990). In situ growth rates of marine phytoplankton: approaches to measurement, community and species growth rates. J. Plankton Res. 12, 1117–1151. doi: 10.1093/plankt/12.6.1117
Geider, R. J. (1987). Light and temperature dependence of the carbon to chlorophyll a ratio in microalgae and cyanobacteria: implications for physiology and growth of phytoplankton. New Phytol. 106, 1–34. doi: 10.1111/j.1469-8137.1987.tb04788.x
Geider, R. J., MacIntyre, H. L., and Kana, T. M. (1997). Dynamic model of phytoplankton growth and acclimation:responses of the balanced growth rate and the chlorophyll a:carbon ratio to light, nutrient-limitation and temperature. Mar. Ecol. Prog. Ser. 148, 187–200. doi: 10.3354/meps148187
Grossman, A. R., Mackey, K. R. M., and Bailey, S. (2010). A perspective on photosynthesis in the oligotrophic oceans: hypotheses concerning alternate routes of electron flow1. J. Phycol. 46, 629–634. doi: 10.1111/j.1529-8817.2010.00852.x
Guillou, L., Chrétiennot-Dinet, M. J., Medlin, L. K., Claustre, H., Loiseaux-de Goer, S., and Vaulot, D. (1999). Bolidomonas: a new genus with two species belonging to a new algal class, the Bolidophyceae (Heterokonta). J. Phycol. 35, 368–381.
Hashimoto, S., and Shiomoto, A. (2000). Comparison of GF/F filters and 0.2 and 0.6 μM nuclepore filters on the chlorophyll a retention. Bull. Nat. Res. Inst. Far Seas Fish. 37, 45–48.
Ichinomiya, M., dos Santos, A. L., Gourvil, P., Yoshikawa, S., Kamiya, M., Ohki, K., et al. (2016). Diversity and oceanic distribution of the parmales (Bolidophyceae), a picoplanktonic group closely related to diatoms. ISME J. Int. Soc. Microb. Ecol. doi: 10.1038/ismej.2016.38. [Epub ahead of print].
Johnson, Z. I., Zinser, E. R., Coe, A., McNulty, N. P., Woodward, E. M. S., and Chisholm, S. W. (2006). Niche partitioning among Prochlorococcus ecotypes along ocean-scale environmental gradients. Science 311, 1737–1740. doi: 10.1126/science.1118052
Kulk, G., de Vries, P., van de Poll, W., Visser, R., and Buma, A. (2012). Temperature-dependent growth and photophysiology of prokaryotic and eukaryotic oceanic picophytoplankton. Mar. Ecol. Prog. Ser. 466, 43–55. doi: 10.3354/meps09898
Le Quéré, C., Buitenhuis, E. T., Moriarty, R., Alvain, S., Aumont, O., Bopp, L., et al. (2015). Role of zooplankton dynamics for southern ocean phytoplankton biomass and global biogeochemical cycles. Biogeosci. Discuss. 12, 11935–11985. doi: 10.5194/bgd-12-11935-2015
Le Quéré, C., Harrison, S., Prentice, C., Buitenhuis, E. T., Aumont, O., Bopp, L., et al. (2005). Ecosystem dynamics based on plankton functional types for global ocean biogeochemistry models. Glob. Change Biol. 11, 2016–2040. doi: 10.1111/j.1365-2486.2005.01004.x
López-Urrutia, Á., and Morán, X. A. G. (2015). Temperature affects the size-structure of phytoplankton communities in the ocean. Limnol. Oceanogr. 60, 733–738. doi: 10.1002/lno.10049
Mackey, K. R. M., Paytan, A., Caldeira, K. R., Grossman, A., Moran, D., McIlvin, M., et al. (2013). Effect of temperature on photosynthesis and growth in marine Synechococcus Spp. Plant Physiol. 163, 815–829. doi: 10.1104/pp.113.221937
Malinsky-Rushansky, N., Berman, T., Berner, T., Yacobi, Y. Z., and Dubinsky, Z. (2002). Physiological characteristics of picophytoplankton, isolated from lake kinneret: responses to light and temperature. J. Plankton Res. 24, 1173–1183. doi: 10.1093/plankt/24.11.1173
Marañón, E., Cermeño, P., Huete-Ortega, M., López-Sandoval, D. C., Mouriño-Carballido, B., and Rodríguez-Ramos, T. (2014). Resource supply overrides temperature as a controlling factor of marine phytoplankton growth. PLoS ONE 9:e99312. doi: 10.1371/journal.pone.0099312
Marie, D., Simon, N., and Vaulot, D. (2005). “Phytoplankton cell counting by flow cytometry,” in Algal Culturing Techniques, edited by Robert Andersen and Provasoli-Guillard, ed R. A. Andersen (West Boothbay Harbor, ME: Elsevier/Academic Press), 253–556.
Michaels, A. F., and Silver, M. W. (1988). Primary production, sinking fluxes and the microbial food web. Deep Sea Res. 35, 473–490. doi: 10.1016/0198-0149(88)90126-4
Mitchell-Olds, A. T., and Shaw, R. G. (1987). Regression analysis of natural selection: statistical inference and biological interpretation. Evolution 41, 1149–61.
Montagnes, D. J. S., Kimmance, S. A., and Atkinson, D. (2003). Using Q 10: can growth rates increase linearly with temperature? Aquat. Microb. Ecol. 32, 307–313. doi: 10.3354/ame032307
Moore, L. R., Goericke, R., and Chisholm, S. W. (1995). Comparative physiology of Synechococcus and Prochlorococcus: influence of light and temperature on growth, pigments, fluorescence and absorptive properties. Mar. Ecol. Prog. Ser. 116, 259–275. doi: 10.3354/meps116259
Morán, X. A. G., López-Urrutia, Á., Calvo-Díaz, A., and Li, W. K. W. (2010). Increasing importance of small phytoplankton in a Warmer Ocean. Glob. Change Biol. 16, 1137–1144. doi: 10.1111/j.1365-2486.2009.01960.x
Mousing, E. A., Ellegaard, M., and Richardson, K. (2014). Global patterns in phytoplankton community size structure—evidence for a direct temperature effect. Mar. Ecol. Prog. Ser. 497, 25–38. doi: 10.3354/meps10583
Parson, T. R., Maita, Y., and Lalli, C. M. (1984). A Manual of Chemical and Biological Methods for Seawater Analysis. Chapter 4 Plant Pigments. Oxford: Pergamon Press.
Polovina, J. J., Howell, E. A., and Abecassis, M. (2008). Ocean's least productive waters are expanding. Geophys. Res. Lett. 35, L03618. doi: 10.1029/2007GL031745
Raven, J. (1998). The twelfth tansley lecture. small is beautiful: the picophytoplankton. Funct. Ecol. 12, 503–513. doi: 10.1046/j.1365-2435.1998.00233.x
Raven, J., and Geider, R. J. (1988). Temperature and algal growth. New Phytol. 110, 441–461. doi: 10.1111/j.1469-8137.1988.tb00282.x
Sarmiento, J. L. (2004). Response of ocean ecosystems to climate warming. Glob. Biogeochem. Cycles 18:3003. doi: 10.1029/2003GB002134
Stawiarski, B. (2014). The Physiological Response of 7 strains of Picophytoplankton to Light, Temperature and Nutrients, Including Climate Change Model Simulations. Ph.D. thesis, University of East Anglia. Available online at: http://ethos.bl.uk/OrderDetails.do?uin=uk.bl.ethos.656091
Thomas, M. K., Kremer, C. T., Klausmeier, C. A., and Litchman, E. (2012). A global pattern of thermal adaptation in marine phytoplankton. Science 338, 1085–1088. doi: 10.1126/science.1224836
Throndsen, J. (1976). Occurance and productivity of small marine flagellates. Nor. J. Bot. 23, 269–293.
Vaulot, D., Eikrem, W., Viprey, M., and Moreau, H. (2008). The diversity of small eukaryotic phytoplankton (< 3 μm) in marine ecosystems. FEMS Microbiol. Rev. 32, 795–820. doi: 10.1111/j.1574-6976.2008.00121.x
Vaulot, D., Le Gall, F., Marie, D., Guillou, L., and Partensky, F. (2004). The Roscoff Culture Collection (RCC): a collection dedicated to marine picoplankton. Nova Hedwigia 79, 49–70. doi: 10.1127/0029-5035/2004/0079-0049
Veldhuis, M., Timmermans, K., Croot, P., and Vanderwagt, B. (2005). Picophytoplankton; a Comparative study of their biochemical composition and photosynthetic properties. J. Sea Res. 53, 7–24. doi: 10.1016/j.seares.2004.01.006
Keywords: picophytoplankton, picoeukaryotes, Eppley, phytoplankton growth rates, temperature tolerance, phytoplankton size scaling, physiological parameterization, chlorophyll a to carbon ratio
Citation: Stawiarski B, Buitenhuis ET and Le Quéré C (2016) The Physiological Response of Picophytoplankton to Temperature and Its Model Representation. Front. Mar. Sci. 3:164. doi: 10.3389/fmars.2016.00164
Received: 25 May 2016; Accepted: 24 August 2016;
Published: 09 September 2016.
Edited by:
Christian Lindemann, University of Bergen, NorwayReviewed by:
Aleksandra M. Lewandowska, University of Oldenburg, GermanyGemma Kulk, University of Groningen, Netherlands
Copyright © 2016 Stawiarski, Buitenhuis and Le Quéré. This is an open-access article distributed under the terms of the Creative Commons Attribution License (CC BY). The use, distribution or reproduction in other forums is permitted, provided the original author(s) or licensor are credited and that the original publication in this journal is cited, in accordance with accepted academic practice. No use, distribution or reproduction is permitted which does not comply with these terms.
*Correspondence: Beate Stawiarski, beate.stawiarski@io-warnemuende.de
†Present Address: Beate Stawiarski, Leibniz Institute for Baltic Sea Research Warnemünde, Rostock-Warnemünde, Germany