Phytoplankton Response to Saharan Dust Depositions in the Eastern Mediterranean Sea: A Mesocosm Study
 Anna Lagaria1*
  Manolis Mandalakis2 Paraskevi Mara3
  Nafsika Papageorgiou1
  Paraskevi Pitta1
  Anastasia Tsiola1,4 Margarita Kagiorgi1
  Stella Psarra1
- 1Institute of Oceanography, Hellenic Centre for Marine Research, Heraklion, Greece
- 2Institute of Marine Biology, Biotechnology and Aquaculture, Hellenic Centre for Marine Research, Heraklion, Greece
- 3Department of Chemistry, University of Crete, Heraklion, Greece
- 4Department of Biology, University of Crete, Heraklion, Greece
The response of phytoplankton populations from surface ultra-oligotrophic waters of the Eastern Mediterranean Sea to Saharan dust additions was studied during a 10-day mesocosm experiment in May 2014. A set of triplicate mesocosms entitled “Single Addition” treatment (SA) was amended with Saharan dust once, while another triplicate set entitled “Repetitive Addition” treatment (RA) received the same amount of dust divided into three consecutive daily doses administered within the first three experimental days, both simulating patterns of dust deposition events taking place in the field. In both treatments, dust particles released small amounts of dissolved inorganic nitrogen and phosphorus which stimulated by 2-fold both chlorophyll-a concentration and primary production for a time period of 6 days, as compared to a set of control mesocosms carried out without dust addition. Phytoplankton response was similar in both treatments, regardless of the dust addition pattern, and it evolved through two distinct phases in both cases. The first phase (i.e., 1–2 days after initial addition) was characterized by enhancement of picoplankton chlorophyll-normalized production rates as a result of elevated orthophosphate concentrations while the second phase (i.e., 3–4 days after initial dust addition), was characterized by elevated chlorophyll-normalized production rates corresponding to larger cells (>5 μm) as a result of increased mineral nitrogen concentrations. The stimulated primary production of larger cells was not accompanied by a respective increase in carbon biomass suggesting important top-down control. The major phytoplankton taxa detected during the experiment were Synechococcus, Pelagophytes, and Prymnesiophytes. Estimations of cellular pigment concentrations and carbon-to-chlorophyll ratios of identified groups and differences between prokaryotic and eukaryotic cells are discussed.
Introduction
The Mediterranean Sea is one of the most oligotrophic marine regions worldwide, characterized by a west-east gradient of increasing oligotrophy in terms of macronutrients (nitrogen and phosphorus), biomass and production (Krom et al., 1991; Moutin and Raimbault, 2002; Ignatiades et al., 2009). The depletion of nutrients in the eastern Mediterranean basin, especially in the upper water layer is the main limiting factor of osmotrophs growth (Thingstad and Rassoulzadegan, 1995; Thingstad and Mantoura, 2005; Tanaka et al., 2011). Recent studies have highlighted the impact of atmospheric deposition on the productivity of such oligotrophic systems. It has been suggested that the frequent Saharan and Middle East dust deposition events taking place in the eastern basin (Engelstaedter et al., 2006) may serve as important external sources of bioavailable macro- and trace-nutrients in the surface mixed layer, promoting osmotrophs growth (Marañón et al., 2010; Ternon et al., 2010; Christodoulaki et al., 2013; Giovagnetti et al., 2013; Gallisai et al., 2014).
Microcosm and mesocosm experimental studies performed mostly in NW Mediterranean and the Atlantic Ocean demonstrated that inputs of dust and aerosols enhanced primary production (Ridame and Guieu, 2002; Bonnet et al., 2005; Marañón et al., 2010) and phytoplankton biomass (Guo et al., 2012; Giovagnetti et al., 2013), as well as bacterial abundance (Herut et al., 2005; Marañón et al., 2010) and/or bacterial respiration (Pulido-Villena et al., 2014). However, phytoplankton and heterotrophic prokaryotes did not show a consistently positive response, in terms of biomass and production, to dust additions nor presented similar patterns among all experiments. The biological responses mediated through the release of nutrients from dust particles depended on the environmental conditions (e.g., nutrient regime), the quantity/quality of the dust added and the initial composition and physiological state of the various osmotroph groups present in the sampled seawater. For example, concerning phytoplankton, input of small amounts of dust particles in oligotrophic seawaters of South China Sea did not result in biomass accumulation or community structure changes, while large amounts of dust resulted in the increase of both biomass and photosynthetic efficiency (Guo et al., 2012). During a bioassays experiment performed in the Atlantic Ocean, where a certain amount of dust was added to microcosms representing different degrees of oligotrophy, it was found that primary production was stimulated only in the least oligotrophic waters (Marañón et al., 2010). Moreover, successive dust deposition events may induce different biogeochemical responses (Ternon et al., 2010; Wagener et al., 2010). For example, a mesocosm experiment performed in the NW Mediterranean demonstrated that a first dust addition favored picoplankton while a second addition a few days later induced a response of larger phytoplankton cells (Giovagnetti et al., 2013).
Overall, dust deposition is deemed to serve as a source of nutrients and it is believed to impact the productivity of oligotrophic systems. However, the response of phytoplankton assemblages to dust inputs, in terms of biomass and activity, is still unpredictable. Furthermore, the significance of phytoplankton response over ecological timescales or broad spatial scales is also under question (Volpe et al., 2009; Spivak et al., 2011; Gallisai et al., 2014). In the field, intense dust deposition fluxes may result from either a single strong or several smaller consecutive dust deposition events (Vincent et al., 2016 and references therein). The majority of previous mesocosm experiments have studied the response of plankton community to single dust additions. In our study, we performed both single and consecutive dust additions in well-controlled mesocosms in order to investigate how the magnitude and time intervals between consecutive Saharan dust deposition events affect phytoplankton activity and community structure in an ultra-oligotrophic site of the east Mediterranean Sea. Moreover, we investigated which, if any, phytoplankton groups were particularly favored by the supply of new nutrients resulting from the dissolution of dust particles. Finally, we examined whether dust additions could stimulate significant physiological changes in phytoplankton cells (e.g., cellular pigment content, C:Chla ratio). To accomplish these objectives, we monitored the response of autotrophic community, through size fractionated chlorophyll and production measurements as well as single cell counts and pigment analysis.
Materials and Methods
Experimental Set Up and Sampling
The experiment, undertaken within the ADAMANT project, was performed in May 2014 in the mesocosm facilities of the Hellenic Centre for Marine Research in Crete, Greece. A detailed description of the mesocosms' setup and experimental design is presented in Pitta et al., (in review). Briefly, 27 m3 of pelagic seawater were collected from 10 m depth at a shelf site aboard the R/V FILIA and were transferred to mesocosm installations using acid-clean tanks (1 m3 each). Three sets of three mesocosms (a total of nine polyethylene containers up to 3 m3 each) were filled with the collected seawater. The mesocosms were deployed in a large, land-based tank with running surface sea water allowing temperature control and were covered with a screen mesh in order to reduce light intensity by approximately 30%. Three mesocosms were amended with 4 g Saharan dust each, on day zero (“Single Addition” treatment, SA), another set of three mesocosms received three consecutive dust additions of 1, 2, and 1 g on days 0, 1, and 2, respectively ('Repetitive Addition' treatment, RA), while three mesocosms were run without dust addition and used as controls (CNT). The total quantity of dust added (4 g) to the mesocosms corresponded to a final concentration of ca. 1.3 mg L−1 and was selected to represent realistic atmospheric deposition events in the east Mediterranean Sea (Pitta et al., in review).
The experiment lasted 10 days in total (D0–D9) and sampling for the analysis of mineral nutrients, size fractionated chlorophyll a and primary production, phytoplankton pigments, and picoplankton (<2 μm) cell counts took place every day before any dust addition. Sampling for cell counting of autotrophic nanoplankton (2–20 μm) and microplankton (>20 μm), by microscopy methods, took place every second day due to their long analysis time. Nevertheless, the specific sampling strategy was considered adequate for the detection of potential changes in community structure.
Mineral Nutrients
Nitrate (), nitrite (), and ammonium () were measured according to Strickland and Parsons (1972) while orthophosphate () was measured according to Rimmelin and Moutin (2005). Total dissolved inorganic nitrogen (DIN) is estimated by the sum of , , and .
Chlorophyll-a per Size Class
The amount of chlorophyll-a corresponding to picoplankton (<2 μm, pChla), small nanoplankton (2–5 μm, snChla), and larger nano- and microplankton (>5 μm, nμChla) was determined according to the fluorometric acidification method (Holm-Hansen et al., 1965). Water samples of 1 L were collected from each mesocosm and sequentially filtered through 5, 2, and 0.2 μm polycarbonate filters (47 mm diameter) under low vacuum pressure. Filters were kept frozen at −20°C until analysis. Extraction was performed in 90% acetone solution overnight and the measurements were performed with a TURNER TD700 fluorometer. Total chlorophyll-a (Chla) was derived by summing up the concentrations of chlorophyll-a in all three size classes.
Phytoplankton Pigments
Phytoplankton pigments were determined by High Performance Liquid Chromatography analysis (HPLC). 2L seawater were filtered through GF/F filters (25 mm) under low vacuum pressure (<150 mmHg). The filters were immediately placed in liquid nitrogen and stored at −80°C until analysis. The filters were immersed in 3 mL of acetone, disrupted in an ice-bath using a sonication probe for 1.5 min (50% amplitude, 0.5 cycle) and incubated at −20°C overnight. Prior to extraction, each filter was spiked with 20 μL of an internal standard solution (β-apo-8′-carotenal 3 ng μL−1). All sample extracts were clarified by centrifugation (10000 rpm for 10 min), as well as by filtration through a 0.2 μm syringe filter (Whatman ReZist, PTFE, 0.2 μm pore size, 13 mm diameter). The filter extracts were analyzed using an Agilent 1260 Infinity Binary Pump HPLC system (Agilent Technologies) equipped with a Poroshell 120 column (EC-C18, 150 × 3 mm, 2.7 μm particles; Agilent Technologies). A detailed description of the applied chromatographic conditions is provided in Lagaria et al. (2016). The abbreviations of detected pigments and calculated sums of pigments are presented in Table 1.
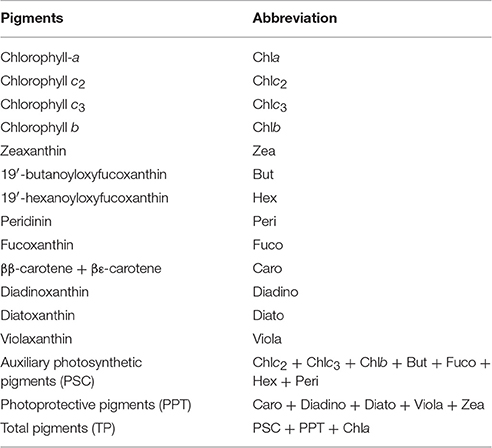
Table 1. Abbreviations of detected pigments and calculated pigment sums.
Pigment data were further processed with the CHEMTAX software (Mackey et al., 1996) in order to calculate the relative contribution of the different functional phytoplankton groups to total phytoplankton biomass (in chlorophyll units). Although several pigments are known to be present in multiple phytoplankton groups, CHEMTAX algorithm is able to break down phytoplankton composition by considering a large suite of pigments simultaneously. The selection of the chemotaxonomic groups to be included in CHEMTAX analysis was based on the main pigment markers detected by HPLC, in conjunction with observations made by flow-cytometry and optical microscopy about phytoplankton composition. To avoid potentially unreliable initial pigment:Chla ratios, sixty ratio matrices were generated by adjusting each of the pigment ratios according to a random function described in Wright et al. (2009). The best 10% of the outputs, based on lower Root Mean Square (RMS) errors, were selected as starting matrices to determine the contribution of each class to TChla concentration.
Primary Production
Three light and one dark 320 mL polycarbonate bottles filled with seawater sample from each mesocosm bag were spiked with 5 μCi of NaH14CO3 tracer each and incubated in the land-based tank, under natural temperature, and daylight conditions for approximately 3 h around midday (Steemann-Nielsen, 1952). After incubation, water samples were filtered through 5, 2, and 0.2 μm polycarbonate filters (47 mm diameter) under low vacuum pressure (<50–150 mmHg). The filters were acidified in order to remove excess NaH14CO3 and their radioactivity (disintegrations per minute, dpm) was measured in a scintillation counter after the addition of 4 mL scintillation cocktail. Primary production rate (PP) was calculated by subtracting the dpm of the dark bottles from the respective light ones. A value of 26400 mg C m−3 was used for the concentration of dissolved inorganic carbon and a value of 1.05 was applied for the isotopic discrimination factor. PP corresponding to picoplankton (0.2–2 μm, pPP), small nanoplankton (2–5 μm, snPP) and larger nano- and microplankton (>5 μm, nμPP) was assessed by subtraction of the respective filters.
Phytoplankton Abundance and Carbon Biomass Estimations
For counts of cyanobacteria and autotrophic eukaryotic cells of size <2 μm that usually belong to various phytoplankton groups (Marie et al., 2006), herein called “pico-eukaryotes,” 2 mL duplicate water samples were fixed with glutaraldehyde (0.5% final concentration), deep-frozen in liquid nitrogen and kept at −80°C until analysis. Analysis was performed in thawed samples without prior staining and cells were distinguished based on their autofluorescence signals in a FACSCalibur flow cytometer according to Marie et al. (1997). Carbon biomass was calculated from cell counts assuming a carbon content of 151 fg C cell−1 for Synechococcus sp. (mean values obtained from Bertilsson et al., 2003; Worden et al., 2004; Marañón et al., 2013) and 471 fg C cell−1 for pico-eukaryotes, value derived assuming a biovolume of 2.6 μm3 cell−1 and the conversion factor 183 fg C μm−3 (Caron et al., 1995).
Counts of autotrophic nanoflagellates (ANF) were performed on 30 mL samples by applying cell fixation with borax-buffered formalin (final concentration 2% formaldehyde), filtration on black polycarbonate (Poretics) filters with 0.6 μm pore-size, staining with DAPI (Porter and Feig, 1980) and enumeration using epifluorescence microscopy. The specific cells were distinguished using UV excitation, and categorized into five size-classes (2–3 μm, 3–5 μm, 5–7 μm, 7–10 μm, and >10 μm) using an ocular micrometer. Formulas of approximate geometric shapes were used to calculate cell biovolume using the measurements of cell length and width. Then, biovolumes were converted into carbon biomass using 183 fg C μm−3 (Caron et al., 1995).
Counting of larger phytoplankton cells, i.e., coccolithophores, diatoms and dinoflagellates (approx. >7 mm cell size) was performed with inverted microscopy on 100 mL water samples preserved in alkaline Lugol's solution (2% final concentration; Utermöhl, 1958). They were identified down to genus or species level and the mean cell biovolume for each species/taxon was calculated using its size measures (e.g., length, width) and appropriate simulations of its geometric shape according to Hillebrand et al. (1999). Then, cell volumes were converted to carbon biomass applying appropriate conversion factors per genus or species (Verity et al., 1992; Montagnes et al., 1994).
Statistics
For comparison of the various variables among the CNT, SA, and RA treatments during the entire experimental period (D0–D9) a repeated measurements ANOVA (RM-ANOVA) was performed. For this analysis, data were log-transformed in order to meet homogeneity of variance. In addition, a principal component analysis (PCA) was performed with standardized data in order to reduce the dimensionality of variables and detect response phases of phytoplankton community to dust inputs. Selected phytoplankton parameters (e.g., chlorophyll-a, primary production, and chlorophyll-normalized production per size fraction, phytoplankton groups derived by CHEMTAX) were used as independent variables in PCA. Moreover, concentrations of mineral and organic nutrients (presented in Pitta et al., in review) were added as supplementary variables in order to see how they were correlated with the selected variables used to build the PCA.
Results
Initial Characteristics of Sampled Seawater and Dust Additions
The surface water sampled from the Cretan Sea displayed particularly low inorganic nutrient concentrations. and were close to or in certain samples below the detection limit of the applied methods and together represented 26% of DIN. The initial DIN: (N:P) ratio was approximately 10. Chla and PP presented low values (Table 2) typical of surface oligotrophic waters. Cyanobacteria were only comprised by Synechococcus sp. populations while Prochlorococcus sp. were absent. Synechococcus sp. was the most abundant phytoplankton group, followed by pico-eukaryotes (Table 2). Autotrophic nanoflagellates (ANF) were mostly comprised from cells in the 2–5 μm size range, which accounted 84% of the initial ANF abundance. Dinoflagellates were mostly comprised by <20 μm cells and presented quite low abundance (Table 2). Very few diatoms and coccolithophores (<30 cells L−1) were detected in the sampled water.
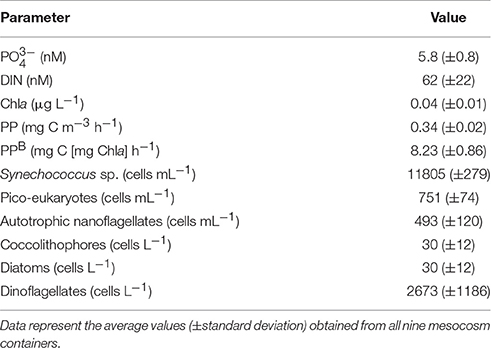
Table 2. Initial characteristics of seawater collected for mesocosm experiments (Day 0, prior to any dust additions).
Detailed results of dust composition and nutrient analysis are presented in Pitta et al., (in review). Briefly, the amendment of each 3 m3 mesocosm with 4 g dust resulted in adding 10 nM , 55 nM , 2 nM , and 69 nM dissolved organic nitrogen (DON). This addition resulted in 100 and 30% enrichment of DIN and , respectively. The temporal pattern of mineral nutrients concentrations during the experiment is presented in Figure 1. The concentration of DIN (Figure 1A) was significantly affected by dust additions (RM-ANOVA, p < 0.001). concentration was slightly higher in the dust treatments, especially in the RA, than in the CNT during the first four experimental days after initial dust addition (Figure 1B). Nevertheless, concentration was not found to be significantly different among treatments and CNT over the whole experimental period (RM-ANOVA, p > 0.05).
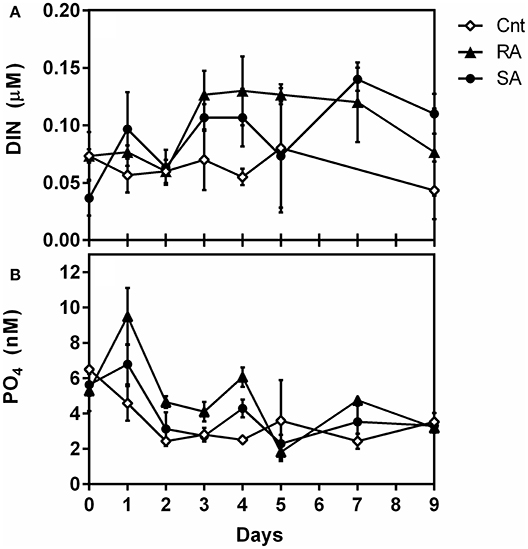
Figure 1. Concentrations of (A) Dissolved inorganic nitrogen (DIN, μM) and (B) orthophosphate (, nM) during the experiment. CNT, Control; RA, Repetitive Addition treatment; SA, Single Addition treatment.
Response of Phytoplankton Photosynthetic Parameters
Chlorophyll-a
Both SA and RA dust additions caused a significant positive effect on Chla concentrations as compared to CNT (RM-ANOVA, p < 0.001). In the SA treatment, Chla presented the highest increase (by 1.8-fold) 2 days after dust addition (D2) and remained higher than CNT until Day 6, after which it decreased to CNT levels (Figure 2A). In the RA treatment, Chla presented the highest increase (by 1.6-fold) on D4 and decreased to CNT level after D6 (Figure 2A).
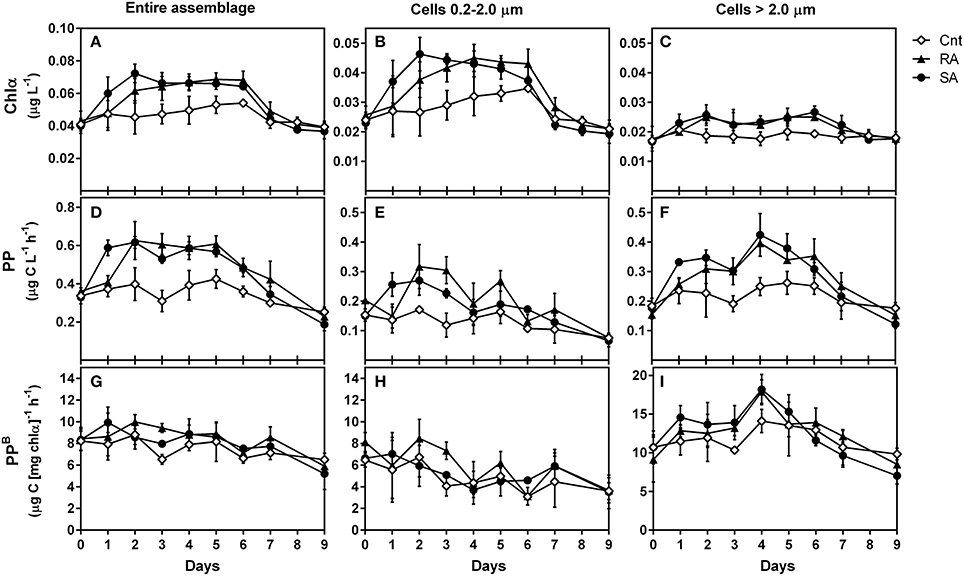
Figure 2. Chlorophyll a (Chla, μg L−1), primary production (PP, μg C L−1 h−1), and normalized-to-chlorophyll production (PPB, μg C [μg chla]−1 h−1) for the entire phytoplankton assemblage (A, D, G, respectively), as well as for the 0.2–2 μm (B, E, H, respectively) and >2 μm (C, F, I, respectively) size classes during the experiment. CNT, Control; RA, Repetitive Addition; SA, Single Addition.
The amount of chlorophyll-a corresponding to picoplankton (pChla) was also significantly affected by dust additions (RM-ANOVA, p < 0.01) and presented a similar pattern to total Chla (Figure 2B). The highest increase of pChla was 2-fold on D2 in SA and 1.5-fold on D4 in RA. The amount of chlorophyll-a corresponding to cells >2 μm (Figure 2C) presented a 1.5-fold increase on D2 in both SA and RA and remained higher than CNT levels until D6 but this response was not found to be significant compared to CNT (RM-ANOVA, p > 0.05). However, when considering the 2–5 μm size fraction alone (data not shown), dust additions had a significant positive effect on the respective Chla amount (RM-ANOVA, p = 0.04). On average, during the experimental period, picoplankton (0.2–2 μm) contributed 59–60% to total chlorophyll-a, while the contribution of 2–5 μm and >5 μm cell sizes were 19–20% and 20–21%, respectively.
Primary Production
Besides Chla, primary production was also stimulated by dust additions (RM-ANOVA, p < 0.001). PP increased by 1.8-fold on D2 both in SA and RA and remained high until D6 after which it decreased to CNT levels (Figure 2D). The production rates that corresponded to picoplankton (0.2–2 μm) and to >2 μm cells were both positively affected by dust additions as compared to CNT (RM-ANOVA, p < 0.05 and p < 0.01, respectively). pPP rate increased by 1.8-fold during D1–D2 in SA and by 1.5-fold during D2–D3 in RA (Figure 2E) while production rate of cells >2.0 μm increased by 2.5-fold on D4 in both treatments (Figure 2F). On average, during the experimental period, picoplankton was responsible for 38–41% of total primary production, while phytoplankton cells of size 2–5 μm and >5 μm were responsible for 20–25% and 38–39%, respectively.
The chlorophyll-normalized production (PPB) indicates the efficiency of producing organic carbon per unit of chlorophyll a. PPB of the entire phytoplankton assemblage (Figure 2G) and of picoplankton (Figure 2H) were not affected by dust additions (RM-ANOVA, p > 0.05). Generally, PPB decreased at the end of the experiment. The chlorophyll-normalized production of cells >2 μm presented higher values than picoplankton, and was significantly affected by dust additions (RM-ANOVA, p < 0.01). It presented a 1.7-fold increase on D4 in both treatments (Figure 2I).
Phytoplankton Pigments
Generally, a limited number of pigments were detected throughout the mesocosm experiment. The most abundant diagnostic pigments were Hex, Zea, But and Fuco (Table 1) which are typically found in Prymnesiophytes, Cyanobacteria, Pelagophytes, and Prymnesiophytes/Diatoms, respectively. Moreover, traces (< 5 ng L−1) of Chlb (typical of Prasinophytes, Chlorophytes) and Peri (typical of Dinoflagellates) were occasionally detected. Hex increased significantly in both SA and RA as compared to CNT (RM-ANOVA, p < 0.001), presenting the highest concentrations on D2 and D3, respectively (Figure 3A). Similarly, an almost 2-fold increase was observed for But and Fuco 4 days after the initial addition of dust in both treatments (Figures 3C,D). Nevertheless, only the response of Fuco proved to be significantly different between CNT and dust treatments (RM-ANOVA, p < 0.001). Zea (Figure 3B) was also shown to be significantly influenced by dust additions as compared to CNT (RM-ANOVA, p < 0.001), but it presented a different temporal pattern compared to the other pigments; its concentration increased by 1.7-fold in both treatments on D2 and remained high during the entire experimental period.
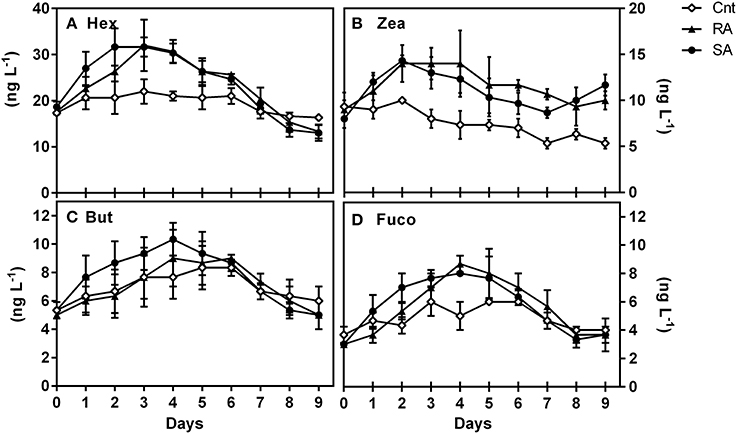
Figure 3. Concentrations (ng L−1) of major diagnostic pigments during the experiment, (A) 19′ hexanoyloxyfucoxanthin (Hex), (B) Zeaxanthin (Zea), (C) Fucoxanthin (Fuco), and (D) 19′-butanoyloxyfucoxanthin (But). CNT, Control; RA, Repetitive Addition; SA: Single Addition.
With regard to phytoplankton pigment indices (Table 1), the ratio of auxiliary photosynthetic pigments to total pigments (PSC:TP) increased from 0.32 to 0.38 during the experimental days D2–D5 (Figure 4B). In particular, the ratio of chlorophylls b and c over TP presented slightly higher value than the CNT in the SA on D1–2 and in both SA and RA on D5 (Figure 4A). On the other hand, the respective ratio of photoprotective pigments (Table 1) showed a gradual increase after D6 followed by a sharp decrease on the last day of the experiment (Figure 4C). These variations were significant on the time scale (RM-ANOVA, p < 0.01) although no significant difference was detected among CNT and dust treatments (RM-ANOVA, p > 0.05).
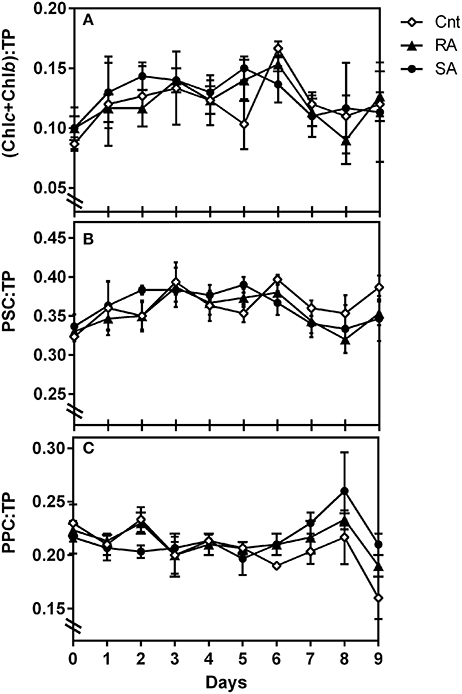
Figure 4. Pigment indices (ratios) during the experiment. Chlb, Chlorophyll b; Chlc, Chlorophyll c2 and c3; PSC, Photosynthetic pigments; PPC, Protoprotective pigments; TP, Total pigments. CNT, Control; RA, Repetitive Addition; SA, Single Addition.
Phytoplankton Community
Cell Abundance and Carbon Biomass
Among all identified phytoplankton groups, only picoplankton cell numbers were significantly affected by dust (RM-ANOVA, p < 0.01). Synechococcus abundance progressively increased after D1 in both treatments presenting an almost 2-fold increase on D3–D4 and remained high until the end of the experiments (Figure 5A). Pico-eukaryotes were also significantly affected by dust additions as compared to CNT (RM-ANOVA, p < 0.05); presenting higher abundances on D4 in both SA and RA compared to the CNT (Figure 5B). In general, the least abundant autotrophic nanoflagellates and dinoflagellates presented higher cell numbers in the SA treatment, but it was not possible to identify any statistical significant differences against the control conditions, most likely as a result of the large variance (CV = 0.3–0.6) accompanying those measurements (Figures 5C,D). Generally, large sized cells were not detected throughout the experimental period. Microphytoplankton cells (>20 μm), such as diatoms and large dinoflagellates, as well as larger nanoflagellates (>10 μm), were practically absent.
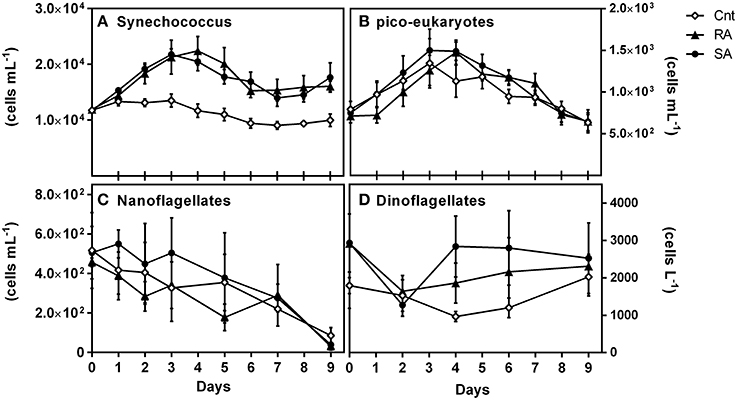
Figure 5. Abundances of (A) Synechococcus sp. (cells mL−1), (B) pico-eukaryotes (cells mL−1), (C) Nanoflagellates (cells mL−1) and (D) Dinoflagellates (cells L−1) during the experiment. CNT, Control; RA, Repetitive Addition; SA, Single Addition.
The carbon biomass of individual phytoplankton groups, derived from cell counts and biovolume/carbon conversion factors (see methods), followed the temporal patterns of the respective abundances, as shown in Figure 5. Total phytoplankton carbon biomass was significantly affected by dust additions (RM-ANOVA, p < 0.01), presenting 1.5- and 1.3-fold increase in SA and RA, respectively, on D3 (Figure 6). Generally, phytoplankton carbon biomass in SA was significantly higher than in RA. When considering both dust treatments, Synechococcus carbon biomass ranged from 1.8 to 3.3 μg C L−1 throughout the experimental period. It represented 45–77% of phytoplankton carbon biomass in RA and 42–77% in SA, with the highest relative contribution recorded at the end of the experiment. ANF carbon biomass ranged from 0.1 to 2.0 μg C L−1, representing 4–41 and 5–44% of phytoplankton carbon biomass in the RA and SA treatment, respectively, with the minimum relative contribution recorded at the end of the experiment. In the untreated CNT, Synechococcus biomass ranged from 1.4 to 2.0 μg C L−1 while ANF biomass ranged from to 0.4 1.8 μg L−1. The respective contributions were 43–63% for Synechococcus and 15–44% for ANF. ANF during the experimental period were mostly comprised from cells in the 2–5 μm size range (Figure 6) which accounted on average 64% of ANF carbon biomass. Carbon biomass of autotrophic dinoflagellates ranged from 0.10 to 0.23 μg C L−1 in CNT, from 0.14 to 0.29 μg C L−1 in RA and from 0.10 to 0.30 μg C L−1 in SA, constantly representing <10% of phytoplankton carbon biomass throughout the experiment (data not shown).
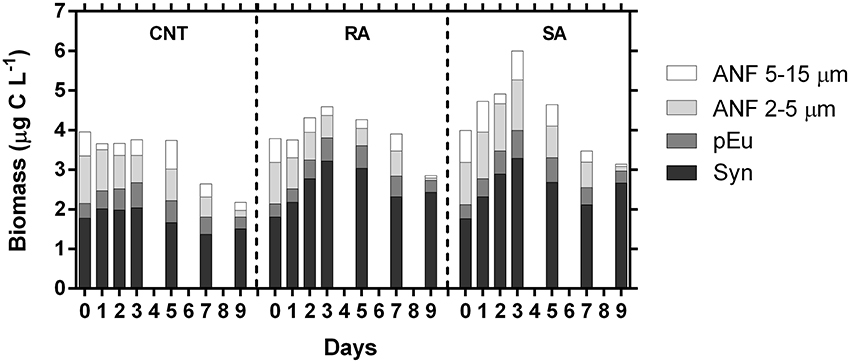
Figure 6. Estimated carbon biomass (μg C L−1) of major phytoplankton groups during the experiment. ANF, Autotrophic nanoflagellates; pEu, pico-Eukaryotes; Syn, Synechococcus sp. CNT, Control; RA, Repetitive Addition; SA, Single Addition.
The carbon-to-chlorophyll (C:Chla) ratio of the entire phytoplankton community, derived by total carbon biomass estimates and total chlorophyll measurements, was not significantly affected by dust additions (RM-ANOVA, p > 0.05). C:Chla ranged on average from 62 (±10) to 101 (±2) in the CNT and from 71 (±9) to 101 (±15) in the dust treatments (RA and SA). In all cases, the highest value was recorded at D0, prior to dust additions (data not shown).
CHEMTAX Analysis of Phytoplankton Functional Groups
CHEMTAX analysis was run with the entire pigment dataset. Three phytoplankton functional groups (Prymnesiophytes, Pelagophytes, and Cyanobacteria-type 2 (for Synechococcus sp., Higgins et al., 2011) were selected for CHEMTAX analysis, based on the major diagnostic pigments detected (Hex, But, Fuco, Zea) and phytoplankton cells indentified by light/epifluorescence microscopy and flow-cytometry. Since diatoms were not present, fucoxanthin was attributed to Prymnesiophytes and Pelagophytes. Moreover, Zeaxanthin was entirely attributed to Cyanobacteria-type 2 (Synechococcus sp.), as Prochlorococcus sp. cells were not detected throughout the experiment. It should also be stressed that peridinin, a typical biomarker of dinoflagellates was almost undetectable in our study and thus the specific chemotaxonomic group was not included in the CHEMTAX analysis. The final pigment:Chla ratios derived by CHEMTAX for the three functional groups under investigation are shown in Table 3.
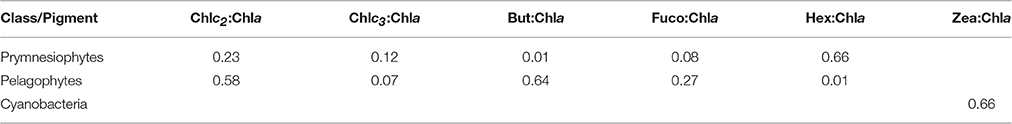
Table 3. Final optimized pigment ratios of the three phytoplankton functional groups under investigation, as determined by CHEMTAX analysis.
CHEMTAX results for Cyanobacteria (Figure 7A) reproduced the abundance and carbon biomass pattern of Synechococcus (Figure 5A). Indeed, the levels of Cyanobacteria (in chlorophyll units) showed a strong correlation with Synechococcus carbon biomass (r = 0.84, n = 90, p < 0.0001). Moreover, prymnesiophytes (Figure 7C) presented a similar pattern with total Chla concentrations (Figure 2A) while the pattern of Pelagophytes (Figure 7B) was similar to that of pico-eukaryotes (Figure 5B). The levels of prymnesiophytes and pelagophytes (in chlorophyll units) derived by CHEMTAX were compared with the carbon biomass of different size classes of flagellates (nanoflagellates and pico-eukaryotes). Prymnesiophytes presented significant correlations with all size classes, while Pelagophytes were strongly associated only with pico-eukaryotes (Table 4).
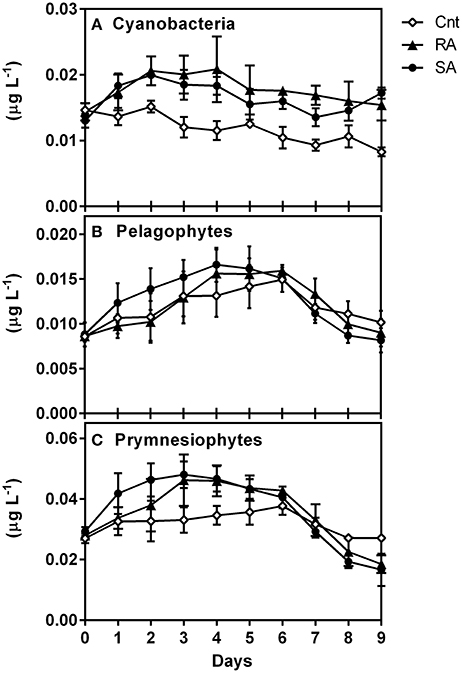
Figure 7. Response of phytoplankton groups to dust additions as determined by pigment/Chemtax analysis (in chlorophyll units, μg L−1), (A) Cyanobacteria, (B) Pelagophytes and (C) Prymnesiophytes. CNT, Control; RA, Repetitive Addition; SA, Single Addition.
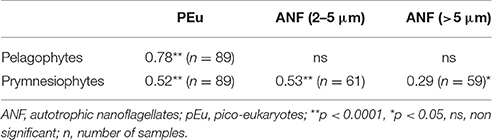
Table 4. Pearson's correlation matrix of Pelagophytes and Prymnesiophytes (in chlorophyll units, μg L−1) determined by CHEMTAX analysis with carbon biomass (μg C L−1) of different size classes of flagellates.
Specific Characteristics of Phytoplankton Groups
The fluorometric measurements of chlorophyll-a per size fractions were used in conjunction with the CHEMTAX results. The amount of chlorophyll-a that corresponds to pico-eukaryotes (ChlapEu) would be:
where pChla is the amount of chlorophyll-a corresponding to picoplankton (<2 μm), as measured by fluorometry, and Chlacyano is the amount of chlorophyll-a corresponding to Cyanobacteria (Synechococcus sp.), as derived by CHEMTAX. As revealed in the previous section, pelagophytes belonged entirely to the picoplankton size class. Consequently, the fluorometrically measured chlorophyll-a in cells >2 μm (Chla>2) may be attributed only to Prymnesiophytes that fall within the nanoplankton size fraction (Chlaprymne>2). Thus:
Meanwhile, the amount of chlorophyll-a that corresponds to pico-eukaryotes (ChlapEu) estimated from Equation (1) may be attributed to both pelagophytes (Chlapelago) and prymnesiophytes that fall within the picoplankton size fraction (Chlaprymne <2). Therefore:
Using these equations, pico-eukaryotes in the CNT mesocosms were calculated to consist of 42% prymnesiophytes and 58% pelagophytes. Assuming that this composition is also applicable to cell counts and carbon biomass of pico-eukaryotes, we estimated the cellular pigment amount of each group (Table 5). We here present values only from the CNT mesocosms. The respective values from SA and RA did not exhibit any significant differences from CNT.
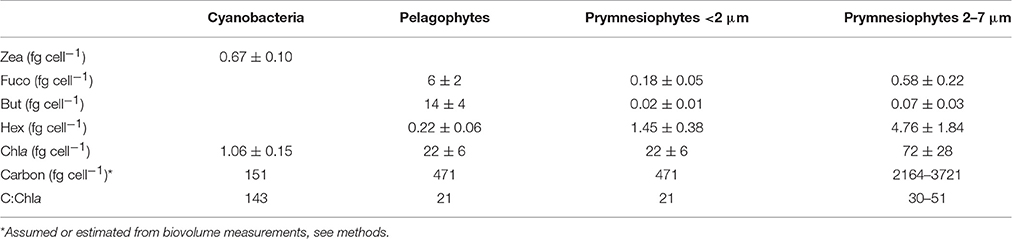
Table 5. Cellular pigments' concentration (fg cell−1) and carbon-to-chlorophyll ratio of the three major phytoplankton functional groups.
Phytoplankton Response to Dust Additions through PCA
To further evaluate the response of phytoplankton community among the different samples (sampling days of CNT, SA, and RA) principal component analysis (PCA) was applied. The phytoplankton parameters used as independent variables in this analysis included chlorophyll-a, primary production and chlorophyll-normalized production per size fraction, as well as biomass of cyanobacteria, pelagophytes and prymnesiophytes (in chlorophyll units as derived from CHEMTAX analysis), while the concentrations of mineral and organic nutrients were used as supplementary variables. The first two principal components (PCs) explained 61.3 and 16.2%, respectively, of the total variance of phytoplankton data. The score plot of PC1 versus PC2 describes the relationships among samples (Figure 8A), while the relationships among variables are displayed in the loading plot of PC1, PC2 (Figure 8B). According to the score plot (Figure 8A), two clusters of samples were spotted in the lower left and upper left quadrant, indicating significant differences in phytoplankton community. Both clusters were well separated from the other samples along the first principal component while they segregated from each other along the second principal component (Figure 8A). The samples on the right side of PCA plot included all sampling days of CNT and the last sampling days (D7–D9) of RA and SA treatments, representing the untreated mesocosm conditions and the end of treatment status. The cluster in the lower left side of the plot included D1–D2 of SA and D2–D3 of RA, representing a first response phase of the phytoplankton community while the cluster in the upper left side of the panel included D3–D5 of SA and D4–D5 of RA, representing a second phase of response. According to the loadings plot (Figure 8B), the first cluster of samples (lower left quadrant) was mostly characterized by higher normalized-production rates of picoplankton (pPPB) which were correlated with and DON, as shown by their position on PC2. The second cluster (upper, left quadrant) was characterized by relatively higher concentration of Pelagophytes and higher chlorophyll normalized-production rate of cells >5.0 μm (nμPPB), which were correlated with DIN concentration.
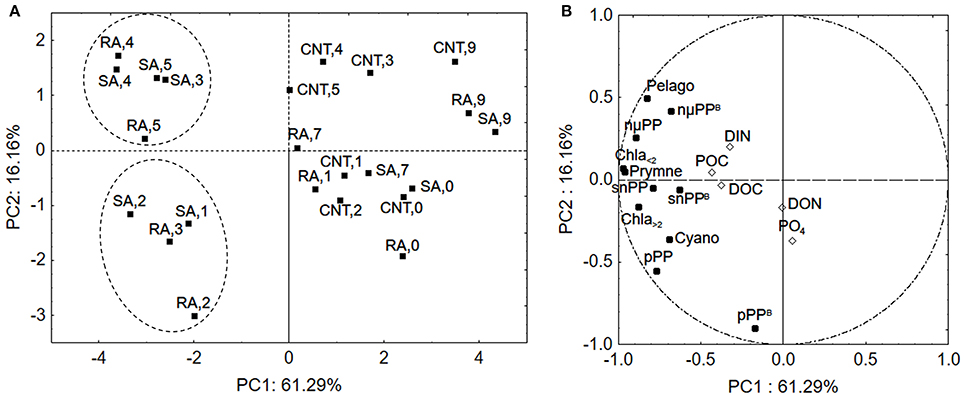
Figure 8. Principal Component Analysis (A) score plot and (B) loading plot for phytoplankton community in samples. The numbers represent the experimental days for CNT, Control; RA, Repetitive Addition; SA, Single Addition. DIN, Dissolved inorganic nitrogen; PO4, Orthophosphate; DOC, Dissolved organic carbon; DON, Dissolved organic nitrogen; POC, Particulate organic carbon; Chla<2, Chla>2: Chlorophyll-a of cells <2 μm and >2 μm, respectively, pPP, snPP, nmPP: Production rates of cells <2 μm, 2–5μm, >5μm, respectively, pPPB, snPPB, nmPPB: Chlorophyll-a normalized production rates of cells <2 μm, 2–5μm, >5μm, respectively, Cyano, Cyanobacteria; Pelago, Pelagophytes; Prymne, Prymnesiophytes.
Discussion
The Effect of Dust Addition Treatments on Phytoplankton Activity and Structure
In the present study, mesocosm experiments were performed using ultra-oligotrophic surface waters from the east Mediterranean basin (Cretan Sea) in order to investigate the short-term response of phytoplankton community to Saharan dust deposition. It is known that phytoplankton community in the surface waters of the east Mediterranean Sea presents N and P co-limitation during the spring/summer period (Psarra et al., 2005; Thingstad et al., 2005; Zohary et al., 2005; Pitta et al., 2016; Tsiola et al., 2016). Initial conditions revealed the oligotrophic status of the collected seawater presenting particularly low concentrations of nutrients and chlorophyll as well as an apparent N-deficiency (N:P = 10). However, this N:P ratio includes certain elements of uncertainty, since concentrations of and were close to the detection limit of the applied method. A single addition of ca. 1.3 μg L−1 Saharan dust in mesocosms seawater (SA treatment), representing natural deposition events in the east Mediterranean, caused the enrichment of initial DIN and concentrations by 100 and 30%, respectively. This enrichment, in turn, resulted in stimulating total chlorophyll-a concentration and primary production by almost 2-folds for a time period of 6 days. An increase of the overall phytoplankton carbon biomass was also observed, but this effect was less pronounced (1.5-fold). The positive response of phytoplankton to dust addition is largely in accordance with many previous microcosm and mesocosm experiments performed in oligotrophic low nutrients low chlorophyll (LNLC) sites, such as in the east ((Herut et al., 2005); Tsagaraki et al., in review) and west Mediterranean basins (Bonnet et al., 2005; Lekunberri et al., 2010; Romero et al., 2011; Ridame et al., 2014), in the Atlantic Ocean (Marañón et al., 2010) and in South China Sea (Guo et al., 2012).
Besides the single-addition experiment, additional mesocosm containers were subjected to three consecutive inoculations with smaller amounts of Saharan dust (RA treatment) in order to better simulate the recurrent pattern of Saharan dust events in the eastern Mediterranean, where continuing dust deposition events may occur over a period of several days (Meloni et al., 2008; Gaetani and Pasqui, 2014; Vincent et al., 2016). The sum of the three dust additions equaled the amount of dust added in the SA treatment. Interestingly, the combination of the three successive inoculations of Saharan dust resulted in a similar response of the phytoplankton assemblage to the single addition, both quantitatively and qualitatively. However, the response of the system in the RA treatment showed a 1-day delay, as compared to the SA treatment. In particular, the first addition of dust did not exert any discernible effect either on total chlorophyll-a or on primary production rate, but both parameters increased significantly after the second dust addition. These results indicate that small consecutive dust events may trigger ecosystem productivity in a similar way to single larger deposition events, at least when they are of an overall equivalent level and exceed a certain threshold. In our study, this threshold was reached after the second dust addition in RA (3 g dust in total) which corresponded to a final concentration of 1 μg To our knowledge, there are no previous studies investigating the impact of successive dust additions in ultra-oligotrophic systems, while only one mesocosm study has been conducted in the west Mediterranean (DUNE experiment) where a secondary addition was performed 6 days after the initial one (Guieu et al., 2014). In that study, the first addition of dust caused an increase of the concentration and the consequent enhancement of both chlorophyll-a and primary production for a time period of 6 days (Ridame et al., 2014), which was similar to that experienced in our study. The second addition, 6 days later, caused the increase of both and concentrations for several days and resulted in even larger increases of phytoplankton biomass and production (Ridame et al., 2014).
It is of particular interest that in our study chlorophyll-a and primary production rates presented maxima 1–2 days after initial dust addition and remained higher than those in the untreated controls for 6 days. This temporal pattern is different than what has been observed in previous mesocosm experiments investigating the response of Cretan Sea surface waters to the addition of inorganic nutrients (N and/or P) during summer, where chlorophyll-a and production reached maxima at the fourth experimental day and decreased thereafter (Pitta et al., 2016). A basic difference is the level of nutrients concentrations in the two studies. The study of Pitta et al. (2016) was conducted during late summer (September) and concentrations of mineral nutrients were steadily close to or below detection limits, while concentrations were comparatively higher in our study. However, the relatively elongated period of phytoplankton response could also be attributed to dissimilarities in the response of the various phytoplankton size groups. By using PCA, we were able to distinguish two phases of phytoplankton response. The first phase, 1–2 days after first additions, was characterized by higher normalized-to-chlorophyll production rates of picoplankton while the second one, three to 4 days after initial dust additions, was mostly associated with higher normalized-to-chlorophyll production rate of the larger cells (>5 μm). In the DUNE experiment, it was also found that primarily picoplankton responded to first dust input while the second addition led to increases of nano- and microplankton (Giovagnetti et al., 2013).
Picoplankton is known to prevail under oligotrophic conditions and surface seawaters in particular, characterized by an extreme depletion of nutrients and high irradiances, as they are believed to have an ecological advantage over bigger phytoplankton cells in these environments (Magazzù and Decembrini, 1995; Raven et al., 2005; Veldhuis et al., 2005; Siokou-Frangou et al., 2010), due to their competent capacity to acquire nutrients (Agawin et al., 2000). This competitive advantage of small cells is generally attributed to their higher surface area to volume ratios, which facilitate the diffusion of nutrients through cell membranes (Moore et al., 2013). Another factor that governs nutrient uptake by phytoplankton cells is the binding affinity of nutrients with the transport proteins embedded in the cell's membrane. For example, high affinity transporters operate most efficiently at low substrate concentrations (Lin et al., 2016). In a study performed in the Mediterranean Sea, it was shown that Synechococcus cells, have a high affinity for orthophosphate and higher uptake rates than eukaryotic autotrophs (Moutin et al., 2002). In our study, Synechococcus represented the largest part of picoplankton assemblage both in terms of abundance and carbon biomass while PCA showed that the higher normalized production rate of picoplankton was correlated with concentration indicating that picoplankton was most probably, quickly favored by bioavailable phosphorus released from dust particles. Additionally, as shown by PCA analysis, it is possible that DON released from dust particles played an auxiliary role in stimulating cyanobacteria, in the first response phase. This is not suprising since there is evidence that cyanobacteria can assimilate some small labile components of DON (Zubkov et al., 2003; Wawrik et al., 2009). DIN seemed to accumulate after the first two experimental days (Figure 1) mostly influencing the larger phytoplankton cells in the second response phase as shown by PCA analysis.
The effect of dust additions on carbon biomass of phytoplankton groups was less evident than the response of chlorophyll-a and primary production. Partly, this may be due to the large standard variations of cell counts. However, the difference in the response between the photosynthetic parameters and carbon biomass may be also explained by intracellular cycling of newly fixed carbon (Marra, 2009; Halsey et al., 2010). It has been proposed that newly fixed carbon may be catabolized for ATP and reductant generation within the period of a cell cycle (Halsey et al., 2010, 2013). The increase of phytoplankton carbon biomass was mostly attributed to the accumulation of Synechococcus sp., which was found to represent >70% of phytoplankton carbon biomass at the end of the experiment. A slight effect was also observed for picoeukaryotes, the cell numbers and carbon biomass of which presented a modest increase at the fourth experimental day. With the exception of picoplankton groups, no significant effect of dust was found on the carbon biomass of any other group. To note that, microscope analysis showed that particularly large cells such as microplanktonic diatoms or dinoflagellates were practically absent. Abundance and carbon biomass of nanoflagellates significantly decreased during the experiment, although production of cells >2.0 μm showed a positive response to dust addition. This implies that there was a strong grazing pressure on them. It was found that ciliates which are their main predators presented an increase at the end of the experiment (Pitta et al., in review). Furthermore, recent studies have shown that many small flagellates may be mixotrophic, grazing on cyanobacteria and heterotrophic bacteria (Frias-Lopez et al., 2009; Unrein et al., 2014). The decline of populations of mixotrophic nanoflagellates would extenuate their grazing pressure on cyanobacteria, resulting in the accumulation of the latter as was observed in our study.
The Effect of Dust Additions on Physiological Characteristics of Phytoplankton Cells
In both RA and SA, primary production rates reached maximum values quicker than the respective chlorophyll-a or carbon biomass, indicating that the phytoplankton assemblage quickly became metabolically active by assimilating the new nutrients released from dust particles, but without resulting in the built up of new biomass. An increase of the auxiliary photosynthetic pigments (Table 1) would promote the efficiency of the photosynthetic rate, since their role is to extend the range of light that can be absorbed and used for photosynthesis (Brunet et al., 2011). Indeed, pigment analysis showed that the relative importance of accessory photosynthetic pigments (e.g., Chlc in particular), over total pigments increased after dust additions (Figure 4). Although this increase was not found to be statistically significant among treatments, it may still represent a meaningful finding. It has been shown that pigment ratios generally present small variations due to co-variations of pigments and chlorophyll-a (Trees et al., 2000; Rodríguez et al., 2006). In the DUNE experiment, a similar chlorophyll-a and production response pattern was observed, with primary production presenting 2-fold increase 24 h after dust addition while chlorophyll increased rather gradually (Ridame et al., 2014). In that study, it was found that cellular pigment concentrations increased after dust additions (Giovagnetti et al., 2013).
The normalized-to-chlorophyll production of larger cells was estimated to be much higher than that of picoplanktonic cells, implying that larger cells were more efficient in producing organic carbon per unit of chlorophyll a. In particular, picoplankton was found to account for approximately 60% of the total chlorophyll and 40% of the total primary production, while the respective contributions of the >2 μm cells were 40 and 60%. Such a disproportionate contribution of picoplankton cells to phytoplankton biomass and production has been also reported in previous studies (Marañón et al., 2001; Fernández et al., 2003), and it has been suggested to result from the higher light utilization efficiency of larger phytoplankton cells.
Pigment/CHEMTAX analysis (Figure 7) generally reproduced the response patterns observed by cell counts (Figure 5) and enabled the identification of the major phytoplankton taxa present in our experiment (Synechococcus, Pelagophytes, and Prymnesiophytes). In combination with cell counts, pigment/CHEMTAX analysis showed that Prymnesiophytes belonged both to picoplankton and nanoplankton size class while Pelagophytes belonged entirely to picoplankton (Table 4). The combination of all methods (pigment/CHEMTAX analysis, cell counts and fluorometric chlorophyll-a measurements per size fraction) enabled also the determination of some characteristics of the three groups, such as cellular pigment concentrations and C:Chla ratios (Table 5). For example, the cellular zeaxanthin content of Synechococcus was found to be 0.67 fg cell−1 on average. This value is lower than values reported from cultures under nutrient replete conditions (Kana et al., 1988), but within the range of values reported from the DUNE experiment with natural surface populations (Giovagnetti et al., 2013). Studies have shown that nutrients regime may influence the cellular content of pigments and that under nutrient-depletion conditions, as is the case of Mediterranean surface waters, the pigment content may be reduced (Kana and Glibert, 1987; Morel et al., 1993; Henriksen et al., 2002). In the DUNE experiment, for example, where the concentrations of mineral nutrients after dust additions increased by several-folds, much more than in our experiment (e.g., >20-fold for reaching concentrations >3 μM), it was found that cellular zeaxanthin content increased (Giovagnetti et al., 2013; Ridame et al., 2014). In our study, the estimated cellular pigment concentrations and C:Chla ratios of specific phytoplankton groups in our experiments, were not found to be significantly affected by dust additions. This may be attributed to the relatively smaller amounts of mineral nutrients released from dust particles (e.g., <60 nM for ).
It is worth mentioning that, while such specific phytoplankton parameters are of great importance for both experimental and modeling studies, it is particularly difficult to assess their actual values when dealing with complex datasets from natural populations. The present mesocosm experiments offer valuable estimates for those parameters and specific results are here summarized for the CNT mesocosms. Our estimates of the cellular chlorophyll-a content (Table 4) are generally within the range of values reported so far for picoplankton which are derived considering together prokaryotic and eukaryotic cells of size <2 μm (Brunet et al., 2006, 2008; Giovagnetti et al., 2013). In our study, due to the absence of large sized cells and the few phytoplankton taxa present, we were able to provide separate values for prokaryotic and eukaryotic cells. Our results showed that Synechococcus presented much lower cellular chlorophyll-a concentrations than pico-eukaryotes (Table 4), while they presented the highest C:Chla ratios (~140). All these estimates should be generally used with caution since they are strongly affected by both the pigment:Chla ratios used and the chosen carbon conversion factors. In particular, CHEMTAX optimizes pigment:Chla ratios for each specific data set (Mackey et al., 1998), which in our case concerns populations in surface ultra-oligotrophic waters collected in early summer and consequently may not be relevant in other areas, depth layers or seasons. Moreover, a higher cellular carbon concentration for Synechococcus, e.g., 250 fg C cell−1 (Kana and Glibert, 1987), would result in a C:Chla ratio around 235, while higher cellular carbon concentrations for pico-eukaryotes, such as 530 fg C cell−1 (Worden et al., 2004) and 836 fg C cell−1 (Verity et al., 1992) would result in a C:Chla around 24 and 38, respectively. In spite of the variability of estimates, our results showed that there were differences in the intrinsic properties between Synechococcus and pico-eukaryotes populations which may be indicative of their different response patterns to dust additions.
Moreover, the estimated C:Chla of the entire phytoplankton assemblage which ranged between 62 and 101, as derived from phytoplankton carbon biomass and total chlorophyll measurements, seems as a rough mean value of the cellular C:Chla ratios of the major phytoplankton groups reported above. This highlights the fact that C:Chla ratio, a parameter often requested in modeling studies and used as a constant (Tsiaras et al., in review), varies in function of both carbon biomass and cellular chlorophyll as well as in function of community composition. Nevertheless, the estimated range of C:Chla in our study is in accordance with values reported from surface oligotrophic waters in the Aegean Sea (Lagaria et al., 2016), the Sargasso Sea (Malone et al., 1993), and the Atlantic Ocean (Marañón, 2005).
In summary, Saharan dust additions representing two different patterns of natural atmospheric deposition events in ultra-oligotrophic seawater of the eastern Mediterranean Sea during early summer, resulted in stimulating phytoplankton production and to a lesser degree carbon biomass for a time period of 6 days. The two patterns of dust deposition events (SA and RA) tested in our study were found to have similar impact on the system. Our results showed that picoplankton was quickly favored by the small amounts of new nutrients released from dust particles, especially from bioavailable phosphorus, to be followed by nanoplankton cells, 2 days later, mostly favored by increased mineral nitrogen levels. Additionally, our findings highlighted differences in the intrinsic properties (cellular pigment amounts, C:Chla ratios) of prokaryotic and eukaryotic cells. Our study indicates that Saharan dust deposition events taking place in the east Mediterranean Sea may be significant over the ecological timescales of some days to 1 week and further highlights the importance of atmospheric deposition on the productivity and functioning of LNLC ecosystems.
Author Contributions
Planning of the original experimental design and carrying out of experiment and sampling: AL, PP, AT, and SP. Pigment analysis: AL and MM. Chlorophyll a fluorometric analysis: NP. Flow cytometry cell counting: AT. Light microscopy cell counting: PM. Epifluorescence microscopy cell counting: MK. Writing up manuscript and critical reading/revision: AL, MM, PP, AT, and SP.
Conflict of Interest Statement
The authors declare that the research was conducted in the absence of any commercial or financial relationships that could be construed as a potential conflict of interest.
Acknowledgments
The ADAMANT project—“Atmospheric deposition and Mediterranean sea water productivity” (project code nr/MIS:383551) was implemented through the Operational Program “Education and Lifelong Learning 2007–2013” (CCI:2007GRO5UPO002) of the National Strategic Reference Framework (NSRF), more specifically through the Research Funding Program: “THALES” and has been co–financed by the European Union (European Social Fund— ESF) and Greek national funds. Funding was also provided by the AegeanMarTech project (“THALES” project code nr/MIS:383548) through grants to AL and PM. We wish to thank E. Dafnomili and S. Zivanovic for support with nutrients analysis.
References
Agawin, N. S. R., Duarte, C. M., and Agustí, S. (2000). Nutrient and temperature control of the contribution of picoplankton to phytoplankton biomass and production. Limnol. Oceanogr. 45, 591–600. doi: 10.4319/lo.2000.45.3.0591
Bertilsson, S., Berglund, O., Karl, D. M., and Chisholm, S. W. (2003). Elemental composition of marine Prochlorococcus and Synechococcus: implications for the ecological stoichiometry of the sea. Limnol. Oceanogr. 48, 1721–1731. doi: 10.4319/lo.2003.48.5.1721
Bonnet, S., Guieu, C., Chiaverini, J., Ras, J., and Stock, A. (2005). Effect of atmospheric nutrients on the autotrophic communities in a low nutrient, low chlorophyll system. Limnol. Oceanogr. 50, 1810–1819. doi: 10.4319/lo.2005.50.6.1810
Brunet, C., Casotti, R., and Vantrepotte, V. (2008). Phytoplankton diel and vertical variability in photobiological responses at a coastal station in the Mediterranean Sea. J. Plankton Res. 30, 645–654. doi: 10.1093/plankt/fbn028
Brunet, C., Johnsen, G., Lavaud, J., and Roy, S. (2011). “Pigments and photoacclimation processes,” in Phytoplankton Pigments, eds Z. Roy, C. Llwellyn, E. S. Egeland, and G. Johnsen (New York, NY: Cambridge University Press), 445–471.
Brunet, C., Gasotti, R., Vantrepotte, V., Corato, F., and Conversano, F. (2006). Picophytoplankton diversity and photoacclimation in the Strait of Sicily (Mediterranean Sea) in summer. I. Mesoscale variations. Aquat. Microb. Ecol. 44, 127–141. doi: 10.3354/ame044127
Caron, D., Dam, H. G., Kremer, P., Lessard, E. J., Madin, L. P., Malone, T. C., et al. (1995). The contribution of microorganisms to particulate carbon and nitrogen in surface waters of the Sargasso Sea near Bermuda. Deep Sea Res. I 42, 943–972. doi: 10.1016/0967-0637(95)00027-4
Christodoulaki, S., Petihakis, G., Kanakidou, M., Mihalopoulos, N., Tsiaras, K., and Triantafyllou, G. (2013). Atmospheric deposition in the Eastern Mediterranean. A driving force for ecosystem dynamics. J. Mar. Syst. 109–110, 78–93. doi: 10.1016/j.jmarsys.2012.07.007
Engelstaedter, S., Tegen, I., and Washington, R. (2006). North African dust emissions and transport. Earth Sci. Rev. 79, 73–100. doi: 10.1016/j.earscirev.2006.06.004
Fernández, E., Maranón, E., Morán, X. A. G., and Serret, P. (2003). Potential causes for the unequal contribution of picophytoplankton to total biomass and productivity in oligotrophic waters. Mar. Ecol. Prog. Ser. 254, 101–109. doi: 10.3354/meps254101
Frias-Lopez, J., Thompson, E., Waldbauer, J., and Chiisholm, S. W. (2009). Use of stable isotope-labelled cells to identify active grazers of picocyanobacteria in ocean surface waters. Environ. Microbiol. 11, 512–525. doi: 10.1111/j.1462-2920.2008.01793.x
Gaetani, M., and Pasqui, M. (2014). Synoptic patterns associated with extreme dust events in the Mediterranean Basin. Reg. Environ. Change 14, 1847–1860. doi: 10.1007/s10113-012-0386-2
Gallisai, R., Peters, F., Volpe, G., Basart, S., and Baldasano, J. M. (2014). Saharann dust deposition may affect phytoplankton growth in the Mediterranean Sea at ecological time scales. PLoS ONE 9:e110762. doi: 10.1371/journal.pone.0110762
Giovagnetti, V., Brunet, C., Conversano, F., Tramontano, F., Obernosterer, I., Ridame, C., et al. (2013). Assessing the role of dust deposition on phytoplankton ecophysiology and succession in a low-nutrient low-chlorophyll ecosystem: a mesocosm experiment in the mediterranean sea. Biogeosciences 10, 2973–2991. doi: 10.5194/bg-10-2973-2013
Guieu, C., Dulan, G., Rodame, C., and Pondaven, P. (2014). Introduction to project DUNE, a DUst experiment in a low nutrient, low chlorophyll ecosystem. Biogeosciences 11, 425–442. doi: 10.5194/bg-11-425-2014
Guo, C., Yu, J., HO, Y.-T., Wang, L., Song, S., Kong, L., et al. (2012). Dynamics of phytoplankton community structure in the South China Sea in response to the East Asian aerosol input. Biogeosciences 9, 1519–1536. doi: 10.5194/bg-9-1519-2012
Halsey, K. H., Milligan, A. J., and Behrenfeld, M. J. (2010). Physiological optimization underlies growth rate-independent chlorophyll-specific gross and net primary production. Photosynth. Res. 103, 125–137. doi: 10.1007/s11120-009-9526-z
Halsey, K. H., O'Malley, R. T., Graff, J. R., Milligan, A. J., and Behrenfeld, M. J. (2013). A common partitioning strategy for photosynthetic products in evolutionarily distinct phytoplankton species. New Phytol. 198, 1030–1038. doi: 10.1111/nph.12209
Henriksen, P., Riemann, B., Kaas, H., Sørensen, H. M., and Sørensen, H. L. (2002). Effects of nutrient-limitation and irradiance on marine phytoplankton pigments. J. Plankton Res. 24, 835–858. doi: 10.1093/plankt/24.9.835
Herut, B., Zohary, T., Krom, M. D., Mantoura, R. F. C., Piita, P., Psarra, S., et al. (2005). Response of East Mediterranean surface water to Saharann dust: on-board microcosm experiment and field observations. Deep Sea Res. II 52, 3024–3040. doi: 10.1016/j.dsr2.2005.09.003
Higgins, H. W., Wright, S. W., and Schlüter, L. (2011). “Quantitative interpretation of chemotaxonomic pigment data,” in Phytoplankton Pigments, eds Z. Roy, C. Llwellyn, E. S. Egeland, and G. Johnsen (New York, NY: Cambridge University Press), 257–313.
Hillebrand, H., Dürselen, C. D., Kirschtel, D., Pollingher, U., and Zohary, T. (1999). Biovolume calculation for pelagic and benthic microalgae. J. Phycol. 35, 403–424. doi: 10.1046/j.1529-8817.1999.3520403.x
Holm-Hansen, O., Lorenzen, C. J., Holmes, R. W., and Strickland, J. D. H. (1965). Fluorometric determination of chlorophyll. J. Cons. Perm. Int. Explor. Mer. 30, 3–15.
Ignatiades, L., Gotsis-Skretas, O., Pagou, K., and Krasakopoulou, E. (2009). Diversification of phytoplankton community structure and related parameters along a large-scale longitudinal east-west transect of the Mediterranean Sea. J. Plankton Res. 31, 411–428. doi: 10.1093/plankt/fbn124
Kana, T. M., and Glibert, P. M. (1987). Effect of irradiance up to 2000 E m−2 s−1 on marine Synechococcus WH7803-I. Growth, pigmentation, and cell composition. Deep Sea Res. 34, 479–495. doi: 10.1016/0198-0149(87)90001-X
Kana, T. M., Glibert, P. M., Goericke, R., and Welschmeyer, N. (1988). Zeaxanthin and β-carotene in Synechococcus WH7803 respond differently to irradiance. Limnol. Oceanogr. 33, 1623–1627.
Krom, M. D., Kress, N., Brenner, S., and Gordon, L. I. (1991). Phosphorus limitation of primary productivity in the Eastern Mediterranean Sea. Limnol. Oceanogr. 36, 424–432. doi: 10.4319/lo.1991.36.3.0424
Lagaria, A., Mandalakis, M., Mara, P., Frangoulis, F., Karatsolis, B. Th., Pitta, P., et al. (2016). Phytoplankton variability and community structure in relation to hydrographic conditions in the NE Aegean frontal area (NE Mediterranean Sea). Cont. Shelf Res. doi: 10.1016/j.csr.2016.07.014
Lekunberri, I., Lefort, T., Romero, E., Vázquez-Domíngue, E., Romera-Castillo, C., Marrasé, C., et al. (2010). Effects of a dust deposition event on coastal marine microbial abundance and activity, bacterial community structure and ecosystem function. J. Plankton Res. 32, 381–396. doi: 10.1093/plankt/fbp137
Lin, S., Litaker, R. W., and Sunda, W. G. (2016). Phosphorus physiological ecology and molecular mechanisms in marine phytoplankton. J. Phycol. 52, 10–36. doi: 10.1111/jpy.12365
Mackey, D. J., Higgins, H. W., Mackey, M. D., and Holdsworth, D. (1998). Algal class abundances in the western equatorial Pacific: estimation from HPLC measurements of chloroplast pigments using CHEMTAX. Deep Sea Res. I 45, 1441–1468. doi: 10.1016/S0967-0637(98)00025-9
Mackey, M. D., Mackey, D. J., Higgins, H. W., and Wright, S. W. (1996). CHEMTAX - A program for estimating class abundances from chemical marker: application to HPLC measurements of phytoplankton pigments. Mar. Ecol. Prog. Ser. 144, 265–283.
Magazzù, G., and Decembrini, F. (1995). Primary production, biomass and abundance of phototrophic picoplankton in the Mediterranean Sea: a review. Aquat. Microb. Ecol. 9, 97–104. doi: 10.3354/ame009097
Malone, T. C., Pike, S. E., and Conley, D. J. (1993). Transient variations in phytoplankton productivity at the JGOFS Bermuda time series station. Deep Sea Res. I 40, 903–924.
Marañón, E. (2005). Phytoplankton growth rates in the Atlantic subtropical gyres. Limnol. Oceanogr. 50, 299–310. doi: 10.4319/lo.2005.50.1.0299
Marañón, E., Cermeño, P., López-Sandoval, C., Rodríguez-Ramos, T., Sobrino, C., Huerte-Ortiga, M., et al. (2013). Unimodal size scaling of phytoplankton growth and the size dependence of nutrient uptake and use. Ecol. Lett. 16, 371–379. doi: 10.1111/ele.12052
Marañón, E., Fernández, A., Mouri-o-Carballido, B., Martínez-García, S., Teira, E., Cermeño, P., et al. (2010). Degree of oligotrophy controls the response of microbial plankton to Saharann dust. Limnol. Oceanogr. 55, 2339–2352. doi: 10.4319/lo.2010.55.6.2339
Marañón, E., Holligan, P. M., Barciela, R., González, N., Mouri-o, B., Pazó, V., et al. (2001). Patterns of phytoplankton size structure and productivity in contrasting open-ocean environments. Mar. Ecol. Prog. Ser. 216, 43–56. doi: 10.3354/meps216043
Marie, D., Partensky, F., Jacquet, S., and Vaulot, D. (1997). Enumeration and cell cycle analysis of natural populations of marine picoplankton by flow cytometry using the nucleic acid stain SYBR Green, I. Appl. Environ. Microbiol. 63, 186–193.
Marie, D., Zhu, F., Balagué, V., Ras, J., and Vaulot, D. (2006). Eukaryotic picoplankton communities of the Mediterranean Sea in summer assessed bymolecular approaches (DGGE, TTGE, QPCR). FEMS Microbiol. Ecol. 55, 403–415. doi: 10.1111/j.1574-6941.2005.00058.x
Marra, J. (2009). Net and gross productivity: weighing in with 14C. Aquat. Microb. Ecol. 56, 123–131. doi: 10.3354/ame01306
Meloni, D., Di Sarra, A., Monteleone, F., Pace, G., Piacentino, S., and Sferlazzo, D. M. (2008). Seasonal transport patterns of intense Saharann dust events at the Mediterranean island of Lampedusa. Atmos. Res. 88, 134–148. doi: 10.1016/j.atmosres.2007.10.007
Montagnes, S. J. D., Berges, A. J., Harrison, J. P., and Taylor, F. J. R. (1994). Estimating carbon, nitrogen, protein, and chlorophyll a from volume in marine phytoplankton. Limnol. Oceanogr. 39, 1044–1060.
Moore, C. M., Mills, M. M., Arrido, K. R., Berman-Frank, I., Bopp, L., Boyd, P. W., et al. (2013). Processes and patterns of oceanic nutrient limitation. Nat. Geosci. 6, 701–710. doi: 10.1038/ngeo1765
Morel, A., Ahn, Y.-H., Partensky, F., Vaulot, D., and Claustre, H. (1993). Prochlorococcus and Synechococcus: a comparative study of their optical properties in relation to their size and pigmentation. J. Mar. Syst. 51, 617–649. doi: 10.1357/0022240933223963
Moutin, T., and Raimbault, P. (2002). Primary production, carbon export and nutrients availability in western and eastern Mediterranean Sea in early summer 1996 (MINOS cruise). J. Mar. Syst. 33–34, 273–288. doi: 10.1016/S0924-7963(02)00062-3
Moutin, T., Thingstad, T. F., Van Wambeke, F., Marie, D., Slawyk, G., Raimbault, P., et al. (2002). Does competition for nanomolar phosphate supply explain the predominance of the cyanobacterium Synechococcus? Limnol. Oceanogr. 47, 1562–1567. doi: 10.4319/lo.2002.47.5.1562
Pitta, P., Nejstgaard, J. C., Tsagaraki, T. M., Zervoudaki, S., Egge, J. K., Frangoulis, C., et al. (2016). Confirming the “Rapid phosphorus transfer from microorganisms to mesozooplankton in the Eastern Mediterranean Sea” scenario through a mesocosm experiment. J. Plankton Res. 38, 502–521. doi: 10.1093/plankt/fbw010
Porter, K. G., and Feig, Y. S. (1980). The use of DAPI for identifying and counting of aquatic microflora. Limnol. Oceanogr. 25, 943–948.
Psarra, S., Zohary, T., Krom, M. D., Mantoura, R. F. C., Polychronaki, T., Stambler, N., et al. (2005). Phytoplankton response to a Lagrangian phosphate addition in the Levantine Sea (Eastern Mediterranean). Deep Sea Res. II 52, 2944–2960. doi: 10.1016/j.dsr2.2005.08.015
Pulido-Villena, E., Baudoux, A.-C., Obernosterer, I., Landa, M., Caparros, J., Catala, P., et al. (2014). Microbial food web dynamics in response to a Saharann dust event: results from a mesocosm study in the oligotrophic Mediterranean Sea. Biogeosciences 11, 337–371. doi: 10.5194/bgd-11-337-2014
Raven, J. A., Finkel, Z. V., and Irwin, A. J. (2005). Phytoplankton: bottom-up and top-down controls on ecology and evolution. Vie Milieu 55, 209–215. doi: 10.3410/f.1015747.389046
Ridame, C., Dekaezemacker, J., Guieu, C., Bonnet, S., L'Helguen, S., and Malieu, F. (2014). Contrasted Saharann dust events in LNLC environments: impact on nutrient dynamics and primary production. Biogeosciences 11, 4783–4800. doi: 10.5194/bg-11-4783-2014
Ridame, C., and Guieu, C. (2002). Saharan input of phosphate to the oligotrophic water of the open western Mediterranean Sea. Limnol. Oceanogr. 47, 856–869. doi: 10.4319/lo.2002.47.3.0856
Rimmelin, P., and Moutin, T. (2005). Re-examination of the MAGIC Method to determine low orthophosphate concentration in seawater. Anal. Chim. Acta 548, 174–182. doi: 10.1016/j.aca.2005.05.071
Rodríguez, F., Chauton, M., Johnsen, G., Andresen, K., Olsen, I. M., and Zapata, M. (2006). Photoacclimation in phytoplankton: implications for biomass estimates, pigment functionality and chemotaxonomy. Mar. Biol. 148, 963–971. doi: 10.1007/s00227-005-0138-7
Romero, E., Peters, F., Marrasé, C., Guadayol, O., Gasol, J. M., and Weinbauer, M. G. (2011). Coastal Mediterranean plankton stimulation dynamics through a dust storm event: an experimental simulation. Estuar. Coast. Shelf Sci. 93, 27–39. doi: 10.1016/j.ecss.2011.03.019
Siokou-Frangou, I., Christaki, U., Mazzocchi, M. G., Montresor, M., Ribera d'Alcalá, M., et al. (2010). Plankton in the open mediterranean Sea: a review. Biogeosciences 7, 1543–1586. doi: 10.5194/bg-7-1543-2010
Spivak, A. C., Vanni, M. J., and Mette, E. M. (2011). Moving on up: can results from simple aquatic mesocosm experiments be applied across broad spatial scales? Freshw. Biol. 56, 279–291. doi: 10.1111/j.1365-2427.2010.02495.x
Steemann-Nielsen, E. (1952). The use of radioactive carbon (14C) for measuring organic production in the sea. J. Cons. Int. Explor. Mer. 18, 117–140.
Strickland, J. D., and Parsons, T. R. (1972). A practical handbook of seawater analysis. J. Fish. Res. Board Can. 167, 71–76.
Tanaka, T., Thingstad, T. F., Christaki, U., Colombet, J., Cornet-Barthaux, V., Courties, C., et al. (2011). Lack of P-limitation of phytoplankton and heterotrophic prokaryotes in surface waters of three anticyclonic eddies in the stratified Mediterranean Sea. Biogeosciences 8, 525–538. doi: 10.5194/bg-8-525-2011
Ternon, E., Guieu, C., Loýe-Pilot, M.-D., Leblond, N., Bosc, E., Gasser, B., et al. (2010). The impact of Saharann dust on the particulate export in the water column of the North Western Mediterranean Sea. Biogeosciences 7, 809–826. doi: 10.5194/bg-7-809-2010
Thingstad, T. F., Krom, M. D., Mantoura, R. F. C., Flaten, G. A. F., Groom, S., Herut, B., et al. (2005). Nature of phosphorus limitation in the ultraoligotrophic Eastern Mediterranean. Science 309, 1068–1071. doi: 10.1126/science.1112632
Thingstad, T. F., and Mantoura, R. F. C. (2005). Titrating excess nitrogen content of phosphorous-deficient eastern Mediterranean surface water using alkaline phosphatase activity as a bio-indicator. Limnol. Oceanogr. Meth. 3, 94–100. doi: 10.4319/lom.2005.3.94
Thingstad, T. F., and Rassoulzadegan, F. (1995). Nutrient limitations, microbial food webs, and ‘biological C-pumps’: suggested interactions in a P-limited Mediterranean. Mar. Ecol. Prog. Ser. 117, 299–306. doi: 10.3354/meps117299
Trees, C. C., Clark, D. K., Bidigare, R. R., Ondrusek, M. E., and Mueller, J. L. (2000). Accessory pigments versus chlorophyll a concentrations within the euphotic zone: a ubiquitous relationship. Limnol. Oceanogr. 45, 1130–1143. doi: 10.4319/lo.2000.45.5.1130
Tsiola, A., Pitta, P., Fodelianakis, S., Pete, R., Magiopoulos, I., Mara, P., Psarra, S., et al. (2016). Nutrient limitation in surface waters of the oligotrophic eastern Mediterranean Sea: an enrichment microcosm experiment. Microb. Ecol. 71, 575–588. doi: 10.1007/s00248-015-0713-5
Unrein, F., Gasol, J. M., Not, F., Forn, I., and Massana, R. (2014). Mixotrophic haptophytes are key bacterial grazers in oligotrophic coastal waters. ISME J. 8, 164–176. doi: 10.1038/ismej.2013.132
Utermöhl, H. (1958). Zur vervollkommnung der quantitativen Phytoplankton Methodik. Mitt. Int. Ver. Theor. Angew. Limnol. 9, 1–38.
Veldhuis, M. J. W., Timmermans, K. R., Croot, P., and van der Wagt, B. (2005). Picophytoplankton; a comparative study of their biochemical composition and photosynthetic properties. J. Plankton Res. 53, 7–24. doi: 10.1016/j.seares.2004.01.006
Verity, P. G., Robertson, C. Y., Tronzo, C. R., Andrews, M. G., Nelson, J. R., and Sieraki, M. E. (1992). Relationships between cell volume and the carbon and nitrogen content of marine photosynthetic nanoplankton. Limnol. Oceanogr. 37, 1434–1446.
Vincent, J., Laurent, B., Losno, R., Bon Nguyen, E., Roullet, P., Sauvage, S., et al. (2016). Variability of mineral dust deposition in the western Mediterranean basin and south-east of France. Atmos. Chem. Phys. 16, 8749–8766. doi: 10.5194/acp-16-8749-2016
Volpe, G., Banzon, V. F., Evans, R. H., Santoleri, R., Mariano, A. J., and Sciarra, R. (2009). Satellite observations of the impact of dust in a low-nutrient, low chlorophyll region: fertilization or artifact? Global Biogeochem. Cycle 23:GB3007. doi: 10.1029/2008GB003216
Wagener, T., Guieu, C., and Leblond, N. (2010). Effects of dust deposition on iron cycle in the surface Mediterranean Sea: results from a mesocosm seeding experiment. Biogeosciences 7, 3769–3781. doi: 10.5194/bg-7-3769-2010
Wawrik, B., Callaghan, A. V., and Bronk, D. A. (2009). Use of inorganic and organic nitrogen by Synechococcus spp. and diatoms on the west florida shelf as measured using stable isotope probing. Appl. Environ. Microbiol. 75, 6662–6670. doi: 10.1128/AEM.01002-09
Worden, A. Z., Nolan, J. K., and Palenik, B. (2004). Assessing the dynamics and ecology of marine picophytoplankton: the importance of the eukaryotic component. Limnol. Oceanogr. 49, 168–179. doi: 10.4319/lo.2004.49.1.0168
Wright, S. W., Ishikawa, A., Marchant, H. J., Davidson, A. T., van den Enden, R. L., and Nash, G. V. (2009). Composition and significance of picophytoplankton in Antarctic waters. Polar Biol. 32, 797–808. doi: 10.1007/s00300-009-0582-9
Zohary, T., Herut, B., Krom, M. D., Mantoura, R. F. C., Pitta, P., Psarra, S., et al. (2005). P-limited bacteria but N and P co-limited phytoplankton in the Eastern Mediterranean—a microcosm experiment. Deep Sea Res. I 52, 3011–3023. doi: 10.1016/j.dsr2.2005.08.011
Zubkov, M. V., Fuchs, B. M., Tarran, G. A., Burkill, P. H., and Amann, R. (2003). High rate of uptake of organic nitrogen compounds by Prochlorococcus cyanobacteria as a key to their dominance in oligotrophic oceanic waters. Appl. Environ. Microbiol. 69, 1299–12304. doi: 10.1128/AEM.69.2.1299-1304.2003
Keywords: atmospheric deposition, ultra-oligotrophic conditions, phytoplankton pigments, productivity, carbon-to-chlorophyll ratio
Citation: Lagaria A, Mandalakis M, Mara P, Papageorgiou N, Pitta P, Tsiola A, Kagiorgi M and Psarra S (2017) Phytoplankton Response to Saharan Dust Depositions in the Eastern Mediterranean Sea: A Mesocosm Study. Front. Mar. Sci. 3:287. doi: 10.3389/fmars.2016.00287
Received: 20 September 2016; Accepted: 21 December 2016;
Published: 09 January 2017.
Edited by:
Angel Borja, AZTI, SpainReviewed by:
Gianluca Volpe, Istituto di Scienze dell'Atmosfera e del Clima—CNR, ItalyMarcos Mateus, Universidade de Lisboa, Portugal
Savvas Genitsaris, Aristotle University of Thessaloniki, Greece
Copyright © 2017 Lagaria, Mandalakis, Mara, Papageorgiou, Pitta, Tsiola, Kagiorgi and Psarra. This is an open-access article distributed under the terms of the Creative Commons Attribution License (CC BY). The use, distribution or reproduction in other forums is permitted, provided the original author(s) or licensor are credited and that the original publication in this journal is cited, in accordance with accepted academic practice. No use, distribution or reproduction is permitted which does not comply with these terms.
*Correspondence: Anna Lagaria, lagaria@hcmr.gr