Long Term Flux of Saharan Dust to the Aegean Sea around the Attica Region, Greece
 Vasiliki Vasilatou1,2
  Manousos Manousakas1
  Maria Gini1
  Evangelia Diapouli1
  Michael Scoullos2
  Konstantinos Eleftheriadis1*
- 1Environmental Radioactivity Laboratory, National Centre of Scientific Research “Demokritos,” Institute of Nuclear & Radiological Sciences & Technology, Energy & Safety, Agia Paraskevi, Greece
- 2Division III, Environmental Chemistry, Department of Chemistry, University of Athens, Athens, Greece
In this study, Particulate Matter (PM) samples, collected during 2 summer and 2 winter months over a long-term period (1984–2012) at a suburban site in Athens (Greece), were used in order to examine the connection between Sahara dust long range transport events and mass concentrations of the aerosol mineral component, as well as the relative abundance of specific crustal components. As a result, the average deposition flux of dust to the Aegean Sea around the Attica Region, during days with Sahara dust transport events, was calculated. The elemental concentration of aerosol samples was determined by means of ET-AAS, ED-XRF. Mineral dust was chemically reconstructed by using the elemental concentrations of the crustal species based on their common oxides. Two different air mass transport models (HYSPLIT and FLEXTRA) were used for the identification of the days with dust transport events. The dust deposition velocity of the particles was calculated by using Stokes drag law, while the dust deposition flux was calculated taking into account the mean particle size of the aerosol coarse size fraction, which is dominated by the transported crustal component during Sahara dust intrusions. The mineral dust contribution was higher in summer, when dry weather conditions prevail. The Ca/Fe ratio was examined for all years, since this ratio is often used for the identification of Saharan dust events. For the years 1996 and 1998 the Ca/Fe ratio indicates an influence by local urban generated dust. The dust deposition flux per day of a Sahara intrusion event varied from 61 to 199 μg/m2 with an average value of 131 ± 41 μg/m2. The total dust deposition over the 4 month measuring period ranged from 237 to 2935 μg/m2.
Introduction
Dust is primary aerosol arising from mechanical processes and may be generated either naturally or by anthropogenic activities. Natural dust occurs when wind blows over land surfaces, either producing or re-suspending particles, it is mainly coarse in size and dominated by mineral species (silicon, calcium, potassium, magnesium etc.). On the other hand, anthropogenic dust may contain large quantities of carbon and several metals (copper, zinc, iron, magnesium, calcium etc.) contributing to ambient aerosol in both coarse and fine aerosol sizes (Athanasopoulou et al., 2010).
The atmosphere of the Mediterranean region is often affected by long range transport events and aerosol formation through intense photochemical activity (Lazaridis et al., 2005). The aerosols that reach the area originate from areas with different characteristics such as Sahara desert and the industrialized areas of N/NE Europe (Bardouki et al., 2003). Sahara dust transport events frequently occur during spring and autumn, contributing up to 25% of the prevailing air masses which covers Central and Eastern Europe as well as part of the western Turkey (Remoundaki et al., 2011). Annually, 1–3 billion tons of mineral dust is emitted into the atmosphere from arid-semiarid areas and the most important source regions are situated in Northern Africa. Saharan and Sahel sources are responsible for 50–70% of the global dust emission (Escudero et al., 2010; Varga et al., 2014). The increased dust concentrations during heavy dust outbreaks often result in exceedances of the daily PM10 limit values set by EU (2008/EC/50) in many countries such as Spain, Italy, and Greece and raise the overall concentration levels of particulate matter (PM) in ambient air (Varga et al., 2014). Dust transport events have been identified as a major type of intense aerosol episodes in the greater Mediterranean basin, accounting for 71.5% of all extreme episodes in the area (Gkikas et al., 2016). Pey et al. (2013) have studied the occurrence of African dust outbreaks in the Mediterranean basin over a 11 year period (2001–2011) and concluded that African dust may be considered the largest PM10 source in regional background sites (35–50% of PM10), with peak contributions reaching up to 80% of the PM10 mass. According to Querol et al. (2009), African dust contribution to PM10 concentrations recorded at regional background sites is higher in the eastern in comparison to the western Mediterranean basin, reaching up to 9–10 μg m−3 on a yearly basis. Similarly, Diapouli et al. (2016) report mean annual African dust contribution to PM10 concentrations at urban sites in Southern Europe ranging from 21% (in Athens) to around 2% in the western Mediterranean (Milan, Barcelona, and Porto).
The input of Saharan dust has important effects on the chemistry of the Mediterranean aerosols (Kallos et al., 2006). Depending on the path followed by the air masses, aerosol composition in the different Mediterranean receptor sites may vary (Lazaridis et al., 2006; Semb et al., 2007; Samoli et al., 2011) and have different constituents such as sulfate (Levin et al., 1996) and metals, e.g., Zn, As, and Pb (Sun et al., 2005). For instance, desert dust particles transferred to Barcelona will be probably enriched with elements originating from anthropogenic sources during their path over the Spanish peninsula, compared to dust particles reaching Athens that usually follow a route over the Mediterranean Sea (Samoli et al., 2011).
The Athens Metropolitan area is a large urban center and an important source of anthropogenic pollutants. Athens is located in a climatic sensitive region such as the Mediterranean Sea, where the prevailing air masses may be characterized by diverse aerosol properties such as desert dust from the Sahara and the aged polluted plumes from Western and Eastern Europe (Eleftheriadis et al., 1998, 2014). However, Attica is a peninsula extending into the Aegean Sea and the strong events of dust intrusions observed there, are also characteristic of the surrounding marine area.
The aim of this study was to calculate the average deposition flux of dust to the Aegean Sea around the Attica Region in Greece, during days with Sahara dust transport events. Elemental concentration data from PM samples collected at a suburban site in Athens were used in order to quantify the aerosol mineral component and subsequently the dust deposition flux in the area, during dust transport events. In addition, the relationship between Sahara dust phenomena and the atmospheric concentration of elements such as Calcium and Iron was investigated.
Materials and Methods
Sampling
The measurement campaign took place at Demokritos monitoring station which is located at NCSR “Demokritos” campus in Athens, Greece (Figure 1). The sampling station is located at the North East corner of the Greater Athens Metropolitan Area in a suburban area on the hillside of Hymettus mountain (270 m a.s.l.) and can be considered as an urban background site (Triantafyllou et al., 2016). The station is away from direct emission sources in a vegetated area (mainly pine trees), partially influenced by the Athens metropolitan area and partially by the incoming air from the North East, which is representative of Regional atmospheric aerosol conditions.
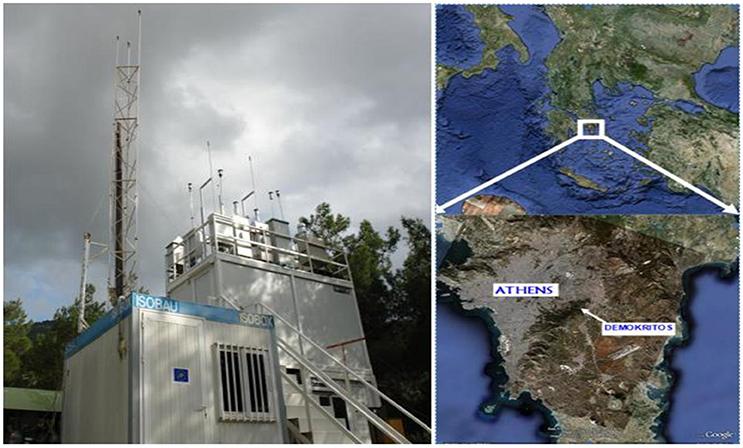
Figure 1. Map of Demokritos station.
Two long range transport models (HYSPLIT and FLEXTRA) were used to identify the sampling days with Sahara dust events. Only the samples from days with Sahara dust events were used in the current study.
Total Suspended Particles (TSP, Particulate Matter sampled from the ambient air with no threshold in size, except limitations in aspiration efficiency of the sampling head, usually aerodynamic diameters up to 50 μm) samples were collected for many years of the period 1984–2006 (1984, 1986, 1988, 1990, 1992, 1994, 1996, 1998, 2000, 2002, 2006) and specifically during the months January–February for the winter season and June–July for the summer one (4 month sampling period for each year). We consider the measurements for 2011–2012 as 1 year measurements (measurements for the summer period of 2011 and for winter period of 2012). The samples were collected on Whatman 41 cellulose filters, with 47 mm diameter, and by using a low volume sampler with a flow rate of 2.1 m3/h. In addition, PM10 (airborne particles with diameter up 10 μm) samples were collected on PTFE Whatman filters, 47 mm diameter with 1 μm pore size, during summer (June–July) and winter period of 2012 (January–February). The sampler was operating at 23.8 l/min.
All filters were loaded into clean polystyrene Petri dishes after sampling and were stored for subsequent analysis (Manousakas et al., 2013).
Chemical Analyses
Two analytical techniques were used for the elemental analysis of the collected samples, ET-AAS (for the years 1984–1996) and ED-XRF (for the years 1998–2012).
Electrothermal Atomic Absorption Spectrometer (ET-AAS)
ET-AAS was used for the determination of the concentration of three elements, Ca, Mg, and Fe (for the years 1984–1996). The instrument used was a Varian 220 spectrometer equipped with a GTA 110 graphite furnace and flame atomic absorption spectrometry. The metal Fe was analyzed using the graphite furnace technique while Mg and Ca were analyzed using flame technique. These metals have been selected because they can be tracers for Saharan dust transport as well as anthropogenic atmospheric pollution. Filter blanks and blank field samples were also prepared and analyzed together with the samples, and the concentrations measured were subtracted from sample measurements (Karanasiou et al., 2005).
Extraction of total metal content was accomplished through microwave assisted digestion of the samples by the use of 2 ml of concentrated HNO3 65% and 1 ml of HF 40%. All reagents used for the digestion procedures were of analytical grade quality or better (HNO3 suprapure 65% Merck, HF suprapure 40%Merck; Karanasiou et al., 2005). HNO3 is usually the first choice for the digestion, because of its strong oxidizing potential. On the other hand, HF has the ability to digest silicon containing compounds (Manousakas et al., 2014). All digestions were performed on a domestic microwave oven. The microwave digestion program settings are presented in Table 1. The calibration standards were obtained from Merck and Carlo Erba. Ultrapure water from a Millipore Milli-Q System was used for the preparation of the solutions. Palladium was used as modifier for Pb (as Pd, 10 g/l) and Mg for V [as Mg(NO3)2, 10 g/l]. For Ca and Mg solutions, La2O3 (10% w/v) was added to eliminate interferences, while Caesium Chloride (0.5% w/v) was added to the K solutions. All modifiers were of suprapure grade and were obtained from Merck. Hollow cathode lamps were used as radiation sources for all elements. ET-AAS conditions were carefully optimized for the compensation or elimination of interferences (Karanasiou et al., 2009).
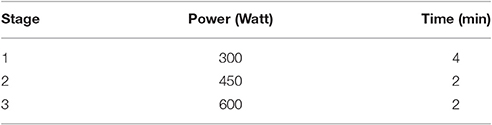
Table 1. Program settings of microwave digestion of airborne particulate matter (Karanasiou et al., 2005).
Energy Dispersive X-Ray Fluorescence Spectroscopy (ED-XRF)
The samples of the years 1998–2012 were analyzed for eight elements (Mg, Al, Si, Ca, K, Ti, Fe, Na) by ED-XRF.A secondary target-XRF spectrometer was used (Epsilon 5 by PANanalytical, the Netherlands), which consists of a side-window low power X-ray tube with a W/Sc anode (spot size 1.8–2.1 cm, 100 kV max voltage, 6 mA current, 600 W maximum power consumption). The characteristic X-rays emitted from the sample are detected by a Ge X-ray detector (PAN-32, with 140 eV FWHM at MnKα, 30 mm2 and 5 mm thick Ge crystal with 8 μm Be window).
For the calibration of the system, both elemental and multi elemental standards were used. In particular, 7 μm thin standards on 6.3 μM (MgF2, SiO, KCl, CaF2, Fe, Al, and Zn), and 1 custom made thin target on Kapton (Ti) were used. The calibration was tested using the SRM 2783 by NIST. Each sample was analyzed for 120 min, while laboratory filter blanks were also analyzed to evaluate analytical bias.
Air Mass Trajectories
Two models were used to investigate the transport path of the air masses reaching the sampling site and to identify the sampling days which can be characterized as Sahara dust events: Hybrid Single-Particle Lagrangian Integrated Trajectory model (HYSPLIT; Stein et al., 2015) and FLEXTRA (Stohl et al., 2005). These models simulate the long-range and mesoscale transport of tracers from point or area sources, using interpolated measured or modeled meteorological fields and accounting for atmospheric processes such as diffusion and dry and wet deposition. They may be used forward in time to simulate the dispersion of tracers from their sources, or backward in time to determine potential source contributions for a given receptor site (Stohl et al., 2005). In the present study, both models were used to gather information about the origin of the observed aerosols. Three dimensional trajectories were computed for the coordinates 38 N, 23.8 E (Demokritos station), at 8:00 and 19:00 UTC by HYSPLIT, and at 0:00, 6:00, 12:00, and 18:00 by FLEXTRA. The calculations by HYSPLIT were made for 300, 700, and 1000 m a.g.l. (above ground level) height and for 180 h backwards, while FLEXTRA model produced 7 day backward air masses trajectories, and at three heights [500, 1000, and 1500 m a.s.l. (above sea level)]. FLEXTRA model can provide information from 1996 onwards. Only African dust transport events verified by both models were identified as such and were used in this study.
Dust Deposition Flux Calculation
Dry deposition refers to the removal of dust particles from the atmosphere in the absence of precipitation. Dry deposition of ambient aerosol particles includes gravitational settling, Brownian diffusion, impaction, and turbulent transfer to the surface (Li et al., 2008; Perez et al., 2011). However, dust particles are in the size range where gravitational settling can be considered as the controlling factor for their deposition velocity (Gao et al., 1997; Schepanski et al., 2009). Gravitational settling is one of the main and most efficient processes of particle removal from the atmospheric environment (Perez et al., 2011). In this study, the dust deposition velocity of the particles was calculated by using Stokes drag law. According to Stokes drag law, the settling of particles is attributed to gravity and the drag forces can be considered as proportional to the relative velocity between particle and fluid, under the assumption that the particles are in spherical shape. The dust deposition velocity (vd) was defined as:
Where, vg is the gravitational settling velocity, dp is the particle aerodynamic diameter, ρa is the air density (g/cm3), ρp is the particle density (g/cm3), g the gravitational constant (m3 kg−1 s−2), v the air viscosity, and Cc the Cunningham slip correction factor.
As it is presented in Equation (1), the particle density and size are the two key parameters in determining the deposition velocity. When the size distribution of the dust is known, it can be often simulated by a lognormal Gaussian distribution (Eleftheriadis and Colbeck, 2001). The median mass size diameter of the lognormal distribution can be considered as the characteristic parameter to define the mean size of dust particles. In this study, the coarse fraction was approximated as having one mean size, the Mass Median Aerodynamic Diameter (MMAD). As far as for the density of the coarse particles (i.e., dust particles), it can be considered equal to 2.6 g/cm3 (Schepanski et al., 2009; Chen et al., 2011). However, when the equivalent aerodynamic diameter is used to define the particle size, the density of the particles can be considered equal to 1 g/cm3.
Then, the dust deposition flux Fd is calculated by multiplying the particle mass concentration Cm by their deposition velocity vd, as follows (Lin et al., 1994):
where Cm, is the dust mass concentration in μg/m3, vd is the deposition velocity in m/s, and Fd is the flux in μg/m2/s.
Results and Discussion
Calculation of Mineral Component
In Figure 2, the percentage of the Sahara dust event days (number of event days to total number of sampling days) for the sampling period is presented. According to Figure 2, Sahara dust events are more frequent during winter period than during summer period, except for the years 1992 and 2000.
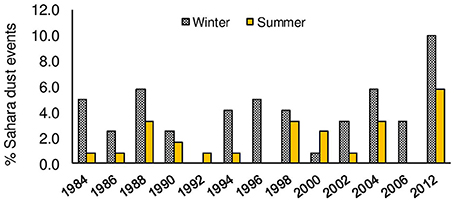
Figure 2. Percentage of Sahara dust event for the two season of the measurement period (1984–2012).
Mineral dust was chemically reconstructed by using the elemental concentrations of the crustal species Al, Si, Ti, and Fe plus non sea salt fraction of Na, Mg, Ca, and K, all multiplied by factors to convert them to their common oxides. More specific soil dust was calculated as: 1.35*Na + 1.66*Mg + 1.89*Al + 2.14*Si + 1.21*K + 1.4 Ca + 1.67*Ti + 1.43*Fe (Nava et al., 2012). Because Al, Si, and Ti concentrations were not determined by ET-AAS, they were estimated from the remaining known mineral components, based on the typical ratios for the site, calculated from XRF measurements. The mean mineral dust contribution during the studied 4 month period ranged from 2 to 13 μg/m3, with an average value of 8 μg/m3. The year with the highest mineral dust concentration is 1988 while the lowest is recorded on 1992. Mineral contribution was higher during the summer season, as expected due to drier conditions. The seasonal variability for the different years is presented in Figure 3. The intensity of the dust events might also be higher during summer. This is in agreement with other studies (Morales-Baquero et al., 2013).
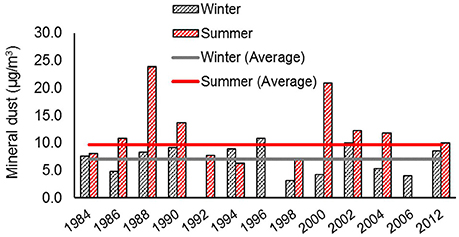
Figure 3. Mineral dust contribution in μg/m3, for the years 1984–2012 for winter (gray) and summer period (red).
The Ca/Fe ratio was examined for all years, since this ratio is often used for the identification of Saharan dust events. The typical value of this ratio for Sahara dust identification ranges from 2 to 5 (Guieu et al., 2002; Remoundaki et al., 2011). The average value of the Ca/Fe ratio for all years was 8.5, although for most of the years the ratio ranged from 1.5 to 5 (Figure 4). Mineral dust concentration is always the product of two different dust sources, transported dust and locally produced or/and resuspended dust. Even though all the samples used in the current study corresponded to days with Sahara dust events, local dust contribution is not always negligible, depending also on the intensity of the dust transport event. The high value of the Ca/Fe ratio for the years 1994 and 1996 indicates higher impact from local soil, which is rich in calcite, as well as from city dust, which often includes Ca-rich dust produced from construction activities (Athanasopoulou et al., 2010). This observation highlights that during days with transport events the contribution from local dust may be equally or even more significant than transported dust, especially during periods with intense construction activity. In these cases, the Ca/Fe ratio may allow us to exclude these data from the long-term impact of the deposited flux to the marine environment. They rather represent the influence of local conditions and dust generation mechanisms.
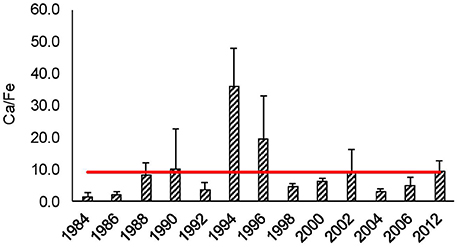
Figure 4. Average Ca/Fe ratio for the years 1984–2012. Red line indicates the mean Ca/Fe ratio.
Total Deposition of Sahara Dust
To calculate the total deposition during the days with Sahara dust events, a mean mass size distribution of ambient aerosol was used, based on size distribution measurements performed in previous studies (Smolık et al., 2003; Athanasopoulou et al., 2010). The measurements for the study of Athanasopoulou et al. (2010) were conducted at the same sampling site, in Ag. Paraskevi, Attica. The measurement campaign in Smolık et al. (2003) took place at the Mediterranean marine background site of Finokalia, Crete. Measurements of size distributions are sparse but the characteristics of dust transport in these cases is very similar. In order to improve the statistics of the most representative size distribution for these dust events, a mean size distribution was calculated from all measurements. The mean distribution was fitted by the sum of log-normal distributions, applying the procedure described by Hussein et al. (2005), also applied in Zwozdziak et al. (2017). The average mass size distribution, normalized by the total mass is presented in Figure 5. The size distribution appeared to have two peaks: one in the fine size fraction with Mass Median Aerodynamic Diameter (MMAD) equal to 0.41 μm and standard deviation of 1.47, and one in the coarse size fraction with MMAD equal to 5.00 μm and standard deviation of 2.45. According to the literature in the area (Smolık et al., 2003; Gerasopoulos et al., 2007), the dust mostly contributes to the coarse size fraction, whereas anthropogenic sources mostly contribute to the fine size fraction. Thus, the modal characteristics of the coarse mode were used for the calculation of the dry deposition velocity (dp = MMAD) and dust deposition flux.
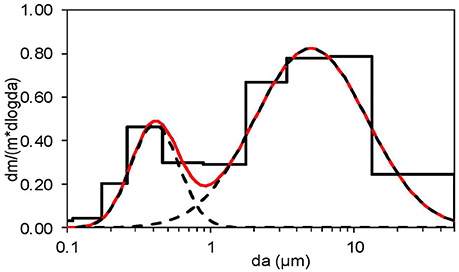
Figure 5. Average mass size distribution of ambient aerosol during Sahara dust events. The mass distribution was normalized by total mass concentration. The red line displays the inverted size distribution assuming a sum of lognormal modes. Black broken line displays these two modes (coarse and fine).
The deposition flux was calculated using Equation (2) based on the concentration of the mineral fraction of PM. The dust deposition flux per Sahara day varied from 61 to 199 μg/m2 with an average value of 131 ± 41 μg/m2. For most of the years the deposition flux was higher in dry (summer) than in wet period (winter; Figure 6). The flux varied from 48 to 1654 μg/m2/event day in the winter period and from 95 to 364 μg/m2/event day in summer period. The higher values in the summer period may be expected due to the lack of wet removal process during the long-range transport in the dry period and the additional dust injected locally by resuspension during dry conditions.
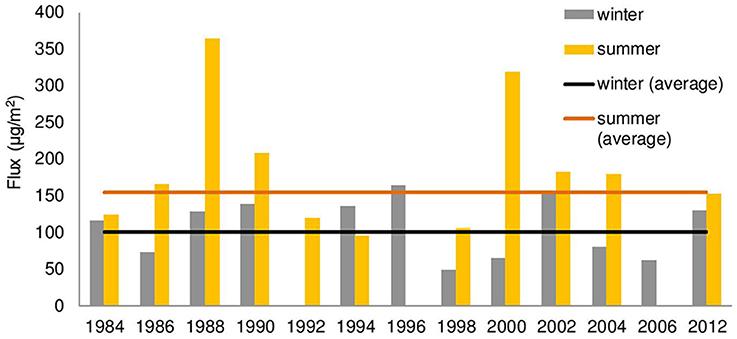
Figure 6. Twenty-four hours dust deposition flux in μg/m2 for the years 1984–2012 for winter (gray) and summer period (yellow).
Table 2 summarizes the total dust deposition for the winter and summer measuring periods, for every year. The deposition for the 4 months studied period ranged from 237 to 2935 μg/m2 with an average value of 1148 μg/m2. It is known than in Eastern Mediterranean the maximum of occurrence of Sahara dust event is during spring time (Pey et al., 2013). Therefore, the periods we examine in winter and summer may include only part of the Sahara dust deposition affecting the marine environment annually. From intensive studies where the whole year was examined, we can have a measure of the deposition occurring during the rest of the year. For example for 2013 (Diapouli et al., 2016), the events recorded during January–February and June–July were 30 with a mean 24 h net Saharan dust concentration of 1.8 μg/m3 while, during the remaining months, 86 events were recorded with a 6.1 μg/m3 mean net Saharan dust 24 h concentration.
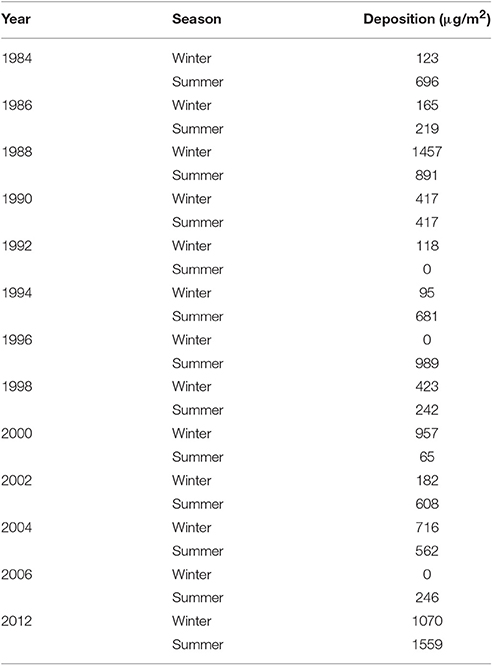
Table 2. Total deposition flux of dust in μg/m2 for the studied winter and summer period of each year.
For the years 1996 and 1998 where the Ca/Fe ratio indicates an influence by local urban generated dust, results may not be representative for the deposition in the marine environment.
Conclusions
In this study, the mineral dust contribution and deposition rate were calculated for Sahara dust event days for a number of years. PM samples were collected during 2 winter and 2 summer months, oven a long-term period (1984–2012). The samples were analyzed for major elements and mineral dust was chemically reconstructed by using the elemental concentrations of the common oxides of the crustal species Al, Si, Ti, and Fe plus non sea salt fraction of Na, Mg, Ca, and K.
Sahara dust events in the winter period (January–February) are more frequent than in the summer period (June–July) for most of the years of the period under study. However, the mineral dust contribution is higher in summer period because of dry weather conditions which favor the accumulation of dust due to decreased wet deposition and high resuspension rate. This is an indication that the deposition flux calculated here may be quite representative for the marine environment during winter, while it may be somewhat overestimated for the Saharan dust flux in the marine environment during summer. In addition, the intensity of the dust events might be higher during summer.
The examination of Ca/Fe ratio revealed that occasionally the contribution of local dust may be significant. For instance, the high value of the Ca/Fe ratio for the years 1994 and 1996 indicates higher impact from local soil than from Sahara dust. Local soil is rich in calcite. City dust also, often includes Ca-rich dust produced from construction activities. The flux varied from 48 to 165 μg/m2/event day in the winter period and from 95 to 364 μg/m2/event day in the summer period. The total dust deposition over the 4 month measuring period ranged from 237 to 2935 μg/m2. The year with the highest total dust deposition was 1996 during which the contribution of local dust to the total dust inventory was significant.
According to the results, no clear trend in the annual changes of the number of dust transport events or the dust flux and deposition during the studied period is observed. That fact is another indication that dust transport events are very complex phenomena that are affected by many different factors such as meteorology, which can vary quite significantly every year.
Author Contributions
KE, MS, and VV designed the study. VV and MM conducted the trace element analysis performed uncertainty analysis on the data and performed the long range transport study with back trajectory analysis and interpretation. MG provided the size distribution analysis of impactor data evaluated the relevance to Sahara dust and calculated the mean size for deposition calculations. ED evaluated the time series results and assisted with the mass estimation of dust content. KE, VV, and ED edited the manuscript.
Conflict of Interest Statement
The authors declare that the research was conducted in the absence of any commercial or financial relationships that could be construed as a potential conflict of interest.
Acknowledgments
This work was funded by EnTeC FP7: Capacities Program (REGPOT -2012-2013-1, FP7, ID:316173).
References
Athanasopoulou, E., Tombrou, M., Russel, A. G., Karanasiou, A., Eleftheriadis, K., and Dandou, A. (2010). Implementation of road and soil dust emission parameterizations in the aerosol model CAMx: applications over the greater Athens urban area affected by natural sources. J. Geophys. Res. 115:D17301. doi: 10.1029/2009JD013207
Bardouki, H., Liakakou, H., Economou, C., Sciare, J., Smolik, J., Zdimal, V., et al. (2003). Chemical composition of size-resolved atmospheric aerosols in the eastern Mediterranean during summer and winter. Atmos. Environ. 37, 195–208. doi: 10.1016/S1352-2310(02)00859-2
Chen, G., Ziemba, L., Chu, D., Thornhill, K., Schuster, G., Winstead, E., et al. (2011). Observations of Saharan dust microphysical and optical properties from the Eastern Atlantic during NAMMA airborne field campaign. Atmos. Chem. Phys. 11, 723–740. doi: 10.5194/acp-11-723-2011
Diapouli, E., Manousakas, M., Vratolis, S., Vasilatou, V., Pateraki, S., Bairachtari, K., et al. (2016). Airuse-life+: estimation of natural source contributions to PM10 and PM2.5 concentration levels in Southern Europe. Implications to compliance with limit values. Atmos. Chem. Phys. Discuss. 1–25. doi: 10.5194/acp-2016-781
Eleftheriadis, K., Balis, D., Ziomas, I., Colbeck, I., and Manalis, N. (1998). Atmospheric aerosol and gaseous species in Athens, Greece. Atmos. Environ. 32, 2183–2191. doi: 10.1016/S1352-2310(97)00412-3
Eleftheriadis, K., and Colbeck, I. (2001). Coarse atmospheric aerosol: size distributions of trace elements. Atmos. Environ. 35, 5321–5330. doi: 10.1016/S1352-2310(01)00304-1
Eleftheriadis, K., Oschenkuhn, K., Lymperopoulou, T., Karanasiou, A., Razos, P., and Ochsenkuhn-Petropoulou, M. (2014). Influence of local and regional sources on the observed spatial and temporal variability of size resolved atmospheric aerosol mass concentrations and water-soluble species in the Athens metropolitan area. Atmos. Environ. 97, 252–261. doi: 10.1016/j.atmosenv.2014.08.013
Escudero, M., Stein, A. F., Draxler, R. R., Querol, X., Alastuey, A., Castillo, S., et al. (2010). Source apportionment for African dust over the Western Mediterranean using the HYSPLIT model. Atmos. Res. 99, 518–527. doi: 10.1016/j.atmosres.2010.12.002
Gao, Y., Arimoto, R., Duce, R., Zhang, X., Zhang, G., An, Z., et al. (1997). Temporal and spatial distributions of dust and its deposition to the China Sea. Tellus 49B, 172–189. doi: 10.3402/tellusb.v49i2.15960
Gerasopoulos, E., Koulouri, E., Kalivitis, N., Kouvarakis, G., Saarikoski, S., Mäkelä, T., et al. (2007). Size-segregated mass distributions of aerosols over Eastern Mediterranean: seasonal variability and comparison with AERONET columnar size-distributions. Atmos. Chem. Phys. 7, 2551–2561. doi: 10.5194/acp-7-2551-2007
Gkikas, A., Basart, S., Hatzianastasiou, N., Marinou, E., Amiridis, V., Kazadzis, S., et al. (2016). Mediterranean intense desert dust outbreaks and their vertical structure on remote sensing data. Atmos. Chem. Phys. 16, 8609–8642. doi: 10.5194/acp-16-8609-2016
Guieu, C., Loye-Pilot, M. D., Ridame, C., and Thomas, C. (2002). Chemical characterization of the Saharan dust end-member: some biogeochemical implications for the Western Mediterranean Sea. J. Geophys. Res. 107, 4258. doi: 10.1029/2001JD000582
Hussein, T., Hameri, K., Aaltoa, P., Paateroa, P., and Kulmala, M. (2005). Modal structure and spatial–temporal variations of urban and suburban aerosols in Helsinki—Finland. Atmos. Environ. 39, 1655–1668. doi: 10.1016/j.atmosenv.2004.11.031
Kallos, G., Papadopoulos, A., Katsafados, P., and Nickovic, S. (2006). Transatlantic Saharan dust transport: model simulation and results. J. Geophys. Res. 111:D09204. doi: 10.1029/2005JD006207
Karanasiou, A. A., Thomaidis, N. S., Eleftheriadis, K., and Siskos, P. A. (2005). Comparative study of pretreatment methods for the determination of metals in atmospheric aerosol by electrothermal atomic absorption spectrometry. Talanta 65, 1196–1202. doi: 10.1016/j.talanta.2004.08.044
Karanasiou, A., Siskos, P., and Eleftheriadis, K. (2009). Assessment of source apportionment by positive matrix factorization analysis on fine and coarse urban aerosol size fractions. Atmos. Environ. 43, 3385–3395. doi: 10.1016/j.atmosenv.2009.03.051
Lazaridis, M., Eleftheriadis, K., Smolik, J., Colbeck, I., Kallos, G., Drossinos, Y., et al. (2006). Dynamics of fine particles and photo-oxidants in the Eastern Mediterranean (SUB-AERO). Atmos. Environ. 40, 6214–6228. doi: 10.1016/j.atmosenv.2005.06.050
Lazaridis, M., Spyridaki, A., Solberg, S., Smolík, J., Zdímal, V., Eleftheriadis, K., et al. (2005). Mesoscale modeling of combined aerosol and photo-oxidant processes in the Eastern Mediterranean. Atmos. Chem. Phys. 5, 927–940. doi: 10.5194/acp-5-927-2005
Levin, Z., Ganor, E., and Gladstein, V. (1996). The effects of desert particles coated with sulfate on rain formation in the Eastern Mediterranean. J. Appl. Meteorol. 35, 1511–1523. doi: 10.1175/1520-0450(1996)035<1511:TEODPC>2.0.CO;2
Li, F., Ginoux, P., and Ramaswamy, V. (2008). Distribution, transport, and deposition of mineral dust in the Southern Ocean and Antarctica: contribution of major sources. J. Geophys. Res. 113:D10207. doi: 10.1029/2007JD009190
Lin, J. J., Kenneth, E., Noll, T. M., and Holsen, T. N. (1994). Dry deposition velocities as a function of particle size in the ambient atmosphere. Aerosol Sci. Technol. 20, 239–252. doi: 10.1080/02786829408959680
Manousakas, M., Eleftheriadis, K., and Papaefthymiou, H. (2013). Characterization of PM10 sources and ambient air concentration levels at Megalopolis City (Southern Greece) located in the vicinity of lignite-fired plants. Aerosol Air Qual. Res. 13, 804–817. doi: 10.4209/aaqr.2012.09.0239
Manousakas, M., Papaefthymiou, H., Eleftheriadis, K., and Katsanou, K. (2014). Determination of water-soluble and insoluble elements in PM2.5 by ICP-MS. Sci. Total Environ. 493, 694–700. doi: 10.1016/j.scitotenv.2014.06.043
Morales-Baquero, R., Pulido-Villena, E., and Reche, I. (2013). Chemical signature of Saharan dust on dry and wet atmospheric deposition in the south-western Mediterranean region. Tellus B: Chem. Phys. Meteorol. 65, 1–11. doi: 10.3402/tellusb.v65i0.18720
Nava, S., Becagli, S., Calzolai, G., Chiari, M., Lucarelli, F., Prati, P., et al. (2012). Saharan dust impact in central Italy: an overview on three years elemental data records. Atmos. Environ. 60, 444–452. doi: 10.1016/j.atmosenv.2012.06.064
Perez, C., Haustein, K., Janjic, Z., Jorba, O., Huneeus, N., Baldasano, J. M., et al. (2011). Atmospheric dust modeling from meso to global scales with the online NMMB/BSC-dust model – part 1: model description, annual simulations and evaluation. Atmos. Chem. Phys. 11, 13001–13027. doi: 10.5194/acp-11-13001-2011
Pey, J., Querol, X., Alastuey, A., Forastiere, F., and Stafoggia, M. (2013). African dust outbreaks over the Mediterranean Basin during 2001–2011: PM10 concentrations, phenomenology and trends, and its relation with synoptic and mesoscale meteorology. Atmos. Chem. Phys. 13, 1395–1410. doi: 10.5194/acp-13-1395-2013
Querol, X., Pey, J., Pandolfi, M., Alastuey, A., Cusack, M., Perez, N., et al. (2009). African dust contributions to mean ambient PM10 mass-levels across the Mediterranean Basin. Atmos. Environ. 43, 4266–4277. doi: 10.1016/j.atmosenv.2009.06.013
Remoundaki, E., Bourliva, A., Kokkalis, P., Mamouri, R., Papayannis, A., Grigoratos, T., et al. (2011). PM10 composition during an intense Saharan dust transport event over Athens (Greece). Sci. Total Environ. 409, 4361–4372. doi: 10.1016/j.scitotenv.2011.06.026
Samoli, E., Kougea, E., Kassomenos, P., Analitis, A., and Katsouyanni, K. (2011). Does the presence of desert dust modify the effect of PM10 on mortality in Athens. Greece. Sci. Total Environ. 409, 2049–2054. doi: 10.1016/j.scitotenv.2011.02.031
Schepanski, K., Tegen, I., and Macke, A. (2009). Saharan dust transport and deposition towards the tropical northern Atlantic. Atmos. Chem. Phys. 9, 1173–1189. doi: 10.5194/acp-9-1173-2009
Semb, A., Hanssen, J. E., Francois, F., Maenhaut, W., and Pacyna, J. M. (2007). Long range transport and deposition of mineral matter as a source for base cations. Water Air Soil Pollut. 85, 1933–1940. doi: 10.1007/BF01186117
Smolık, J., Zdımal, V., Schwarz, J., Lazaridis, M., Havranek, V., Eleftheriadis, K., et al. (2003). Size resolved mass concentration and elemental composition of atmospheric aerosols over the Eastern Mediterranean area. Atmos. Chem. Phys. 3, 2207–2216. doi: 10.5194/acp-3-2207-2003
Stein, A. F., Draxler, R. R., Rolph, G. D., Stunder, B. J. B., Cohen, M. D., and Ngan, F. (2015). NOAA's HYSPLIT atmospheric transport and dispersion modeling system. Bull. Am. Meteorol. Soc. 96, 2059–2077. doi: 10.1175/BAMS-D-14-00110.1
Stohl, A., Forster, C., Frank, A., Seibert, P., and Wotawa, G. (2005). Technical note: the Lagrangian particle dispersion model FLEXPART version 6.2. Atmos. Chem. Phys. 5, 2461–2474. doi: 10.5194/acp-5-2461-2005
Sun, Y., Zhuang, G., Wang, Y., Zhao, X., Li, J., Wang, Z., et al. (2005). Chemical composition of dust storms in Beijing and implications for the mixing of mineral aerosol with pollution aerosol on the pathway. J. Geophys. Res. 110:D24209. doi: 10.1029/2005JD006054
Triantafyllou, E., Diapouli, E., Tsilibari, E. M., Adamopoulos, A. D., Biskos, G., and Eleftheriadis, K. (2016). Assessment of factors influencing PM mass concentration measured by gravimetric & beta attenuation techniques at a suburban site. Atmos. Environ. 131, 409–417. doi: 10.1016/j.atmosenv.2016.02.010
Varga, G., Ujvari, G., and Kovacks, J. (2014). Spatiotemporal patterns of Saharan dust outbreaks in the Mediterranean Basin. Aeolian Res. 15, 151–160. doi: 10.1016/j.aeolia.2014.06.005
Zwozdziak, A., Gini, M. I., Samek, L., Rogula-Kozlowska, W., Sowka, I., and Eleftheriadis, K. (2017). Implications of the aerosol size distribution modal structure of trace and major elements on human exposure, inhaled dose and relevance to the PM2.5 and PM10 metrics in a European pollution hotspot urban area. J. Aerosol. Sci. 103, 38–52. doi: 10.1016/j.jaerosci.2016.10.004
Keywords: surface flux, Sahara dust, elemental composition, deposition, mineral fraction
Citation: Vasilatou V, Manousakas M, Gini M, Diapouli E, Scoullos M and Eleftheriadis K (2017) Long Term Flux of Saharan Dust to the Aegean Sea around the Attica Region, Greece. Front. Mar. Sci. 4:42. doi: 10.3389/fmars.2017.00042
Received: 30 September 2016; Accepted: 06 February 2017;
Published: 22 February 2017.
Edited by:
Angel Borja, AZTI, SpainReviewed by:
Eric Josef Ribeiro Parteli, University of Cologne, GermanyJose M. Baldasano, Polytechnic University of Catalonia, Spain
Copyright © 2017 Vasilatou, Manousakas, Gini, Diapouli, Scoullos and Eleftheriadis. This is an open-access article distributed under the terms of the Creative Commons Attribution License (CC BY). The use, distribution or reproduction in other forums is permitted, provided the original author(s) or licensor are credited and that the original publication in this journal is cited, in accordance with accepted academic practice. No use, distribution or reproduction is permitted which does not comply with these terms.
*Correspondence: Konstantinos Eleftheriadis, elefther@ipta.demokritos.gr