Reconstructing the History and the Effects of Mechanization in a Small-Scale Fishery of Flores, Eastern Indonesia (1917–2014)
 Victoria C. Ramenzoni
- Socio Economics Group, Harte Research Institute, Texas A&M University–Corpus Christi (TAMUCC), Corpus Christi, TX, USA
The number of studies on small-scale fishing communities has grown considerably over the past 30 years. Evidence on how the process of mechanization and technological expansion has affected traditional small-scale fishers in peripheral regions, however, is less abundant. For areas like Eastern Indonesia that are now facing important challenges in governance and resource degradation, lack of information impairs the design of long-term environmental solutions. This article explores the changes in fishing participation and per capita seafood intake in a small-scale fishery in Flores, Eastern Indonesia over the past 100 years (1917–2014). By combining multiple sources of information (ethnographic, observational, nutritional, and historical) to reconstruct the story of stocks, fishing effort, and consumption of marine products, long-term trajectories, and trends in resource use practices are identified. Findings underline that mechanization and commercialization can have dire repercussions on food security and job stability within small-scale fishing sectors, especially if these processes are not part of comprehensive community development programs. The article concludes that understanding the outcomes of mechanization at the fringes of more centralized systems is essential to navigate the trade-offs among poverty reduction, economic growth, and environmental degradation.
Introduction
Understanding local patterns of resource use has become a priority for coastal and fishery managers (Staples et al., 2004; Charles, 2011; Bavinck et al., 2015). To identify characteristics that may impede participatory governance, researchers have begun to explore the challenges that fishing communities face as they transition through processes of industrialization, mechanization, and market integration (Andersson and Ngazi, 1998; Bavinck et al., 2013). Historically, the transformation of local fisheries is often a result of intensive technological and capital development promoted by government and non-government agencies (MacFadyen and Corcoran, 2002). Yet, mechanization and commercialization can have dire repercussions on food security and job stability within small-scale fishing sectors, especially if these processes are not part of comprehensive community development programs (Ahmed, 1992; De la Cruz Modino and Pascual-Fernández, 2013; Donkersloot and Menzies, 2015). For example, higher capture efficiency through gear substitution, motorization, and the rapid adoption of new fishing devices can deflate market prices, increase competition, and introduce conflicts of access forcing individuals to exit the fishery (Bailey et al., 1987; Muhammad and Susilo, 1995; Andersson and Ngazi, 1998). In order to enhance the understanding of the impacts associated with development and modernization, this article explores the changes in fishing participation and per capita seafood intake in a small-scale fishery in Flores, Eastern Indonesia in the past 100 years (1917–2014).
While the number of studies on fishing communities has grown considerably since the 1980s, evidence on how the process of mechanization has affected traditional small-scale fishers after major industrial and technological fishing expansion is less abundant (Ahmed, 1992; Chuenpagdee, 2011, p. 23; Pascual-Fernández and De la Cruz Modino, 2011). Furthermore, research on subsistence fisheries in tropical regions and the social and environmental trade-offs associated with economic development has concentrated in studying densely populated areas (Cribb and Ford, 2009). Vast productive regions of the Eastern Indian Ocean, such as Eastern Indonesia, being at the fringes of more centralized policies have received little to no attention (Fox, 2005; Fox et al., 2009; Tull, 2009; Christensen and Tull, 2014).
Despite lower demographic densities, dependence on natural resources in these areas can be high as large sections of the population are still engaged in subsistence farming, fishing, and animal husbandry (Barlow and Gondowarsito, 2009; Resosudarmo and Jotzo, 2009; Stacey et al., 2011). These areas are also characterized by widespread poverty, high rates of infant mortality, and low incomes, which has made them a target for state and international aid. The tendency of government and conservation programs to concentrate in a reduced number of hotspots such as Raja Ampat in Papua New Guinea, Komodo National Park in Flores, or Wakatobe National Park in Sulawesi, and the lack of effective enforcement makes Eastern Indonesia an attractive location for illegal fishing, mining, and logging operations (Varkey et al., 2010; Mangubhai et al., 2012; Wright and Lewis, 2012). Unfortunately, limitations in the scope of environmental management efforts have consequences for ecological diversity that transcend the local and provincial scale.
The main goal of this article is to reconstruct the historical trajectories followed by Endenese communities in Eastern Indonesia as a result of development and modernization policies that occurred predominantly in central regions of the archipelago. Building from historical ecology and ethnographic research, this study discusses fishing participation and the consumption of marine products before and after the implementation of provincial plans to incentivize production. Analyzing what causes changes in resource use, the article reflects on the repercussions of capital-intensive fisheries, technological modernization, and alimentary policies for communities on the fringes of economic and political centers.
A study of this nature contributes to the understanding of how practices and behaviors, albeit shaped by local policies, are also a byproduct of both the continuities and discontinuities in national and regional administration. It is contended that different patterns of development take shape as a dynamic expression of these realities and their effects at the household level (Allison and Ellis, 2001; Lenselink, 2002). Their history of resource use should be taken into account to generate new patterns of economic growth that are environmentally sustainable and do not exacerbate poverty (Béné, 2003; Allison and Kelling, 2009; Béné and Allison, 2010; Christensen and Tull, 2014). While considered peripheral in their geographical location, fishing communities like the Endenese are not isolated or disconnected from major economic centers (Wolf and Eriksen, 2010). Failure to capture these interconnections in policies and proposed governance solutions allows for the continuation of non-sustainable and illegal operations that have serious consequences for biodiversity conservation (Heazle and Butcher, 2007). As a consequence, fishery governance policies in Indonesia and other parts of the world will benefit from looking at the periphery to develop solutions across multiple geographical and institutional scales.
Historical Reconstructions in Data Poor Fisheries
As shown by recent studies (Pauly and Zeller, 2014; Piroddi et al., 2015; Zeller et al., 2015), historical reconstructions can offer important lessons for future management policies seeking to modify local practices or to implement different systems of resource tenure. Rather than a definitive baseline, reconstructions represent an initial characterization of a fishery's production (Jacquet et al., 2010; Blythe et al., 2013; Pauly and Zeller, 2014). While many of these historical projections rely on official statistics, reports, and qualitative data such as interviews and anecdotal sources (Blythe et al., 2013), long-term observational or behavioral evidence is rarely available to correct retrospective estimates in data poor fisheries (Silvestre and Pauly, 1997). Additionally, reconstructions are often based on estimations of effort that do not consider the diversity of gear and capacity that a small-scale fishery might exhibit. This affects both the internal and external validity of findings, and constrains their implications.
In Eastern Indonesia, there are noticeable limitations on the coverage and quality of official statistics (Stacey et al., 2011). In the 1970s, the Indonesian central government imposed a general protocol for collecting fishery's information to address some of these issues (Bailey et al., 1987). The protocol is implemented unevenly at the provincial and regency level. For example, in Ende, the absence or lack of functionality of fishing auction offices has lead researchers to collect most measurements in regional markets. Measurements are then projected to calculate monthly and annual level figures. Estimations of yields often suffer from underreporting or the conflation of results with other regencies. Along with serious problems in consistency and transparency, in many cases the process behind estimations remains unknown.
Complementing historical information with behavioral research, this article has three objectives. First, the evolution of the small-scale fishery from 1917 to 2014 is reconstructed through the generation of time series of landings, fishing effort, labor, and seafood consumption at the district level. Second, annual estimates of landings and per capita fish consumption are formulated from observational, nutritional, and ethnographic data. Proposed estimates, which in the case of fishing households condense prolonged research and track seasonal changes and can help contextualize historical reconstructions from official data. Third, the article explores potential explanations for changes in fishing participation over time.
It is important to acknowledge that, given the lack of comprehensive records, reconstructed figures are preliminary. Suffering from limitations in terms of the measurement of effort and in the consideration of environmental factors, proposed reconstructions are corrected with systematic observations and extensive research on site. They represent an initial attempt at characterizing the production of the fishery and its significance in terms of production that can be of value to resource managers and scholars (Jacquet et al., 2010; Blythe et al., 2013; Pauly and Zeller, 2014).
Methods
Study Site: The Endenese Fishery
The study area is in the District of Ende, Eastern province of Nusa Tenggara Timur, Indonesia (Figure 1). Limited to the south by the Savu oceanic basin and to the north by the Flores Sea, this area is known for its coral reefs and pelagic fishing grounds. In 2014, the population was 280,076 people ascribing to different ethnic groups including Bajau and Bugis immigrants (BPSE, 1984–2014). Small-scale fisheries in Ende operate under the local fishing commission, following district, provincial, and central government management rules. As a consequence of decentralization, fishing rights are defined at the village level for areas that are <2 miles offshore. With the exclusion of trawling (pukat harimau), dynamite, and cyanide, there are virtually no restrictions to total allowed gear or any rules about bycatch. Fishing licenses (surat perikanan) are required if operating beyond the district area (>12 miles) in other regencies like Manggarai or Komodo. Only a small fraction of fishermen (<5%) venture on weeklong trips to other regencies in search for sharks, snappers, or large tunas. Hence, the majority of fishing occurs along the shorelines and relies on canoes, small-motorized plank boats, or medium size purse seiners (<5 tons; Ramenzoni, 2015). In 2011–2012, the local fishing commission reported around 2,500 boats according to a census of fishing effort. Survey data from sampled communities for the same period indicates negligible differences with official reports in the number of active fishermen. According to questionnaires of fishing profile, the most prevalent fishing gear includes small gillnets (mesh size of 2.5–12 cm), troll lines, and hand line fishing. Common captured species comprise Scombridae, Clupeidae, Lutjanidae, Serranidae, and Carangidae families (Ramenzoni, 2013). While bigger fleets out of the ports of Kupang and Benoa, Bali, operate pole and line fishing vessels in the offshore regions of the Savu and Timor Seas and in the Indian Ocean (Stacey et al., 2011), Ende has no medium or large scale fishing industry. There is also no fishing auction in the regency and refrigeration is very limited. Most of the catch is sold at the regional markets.
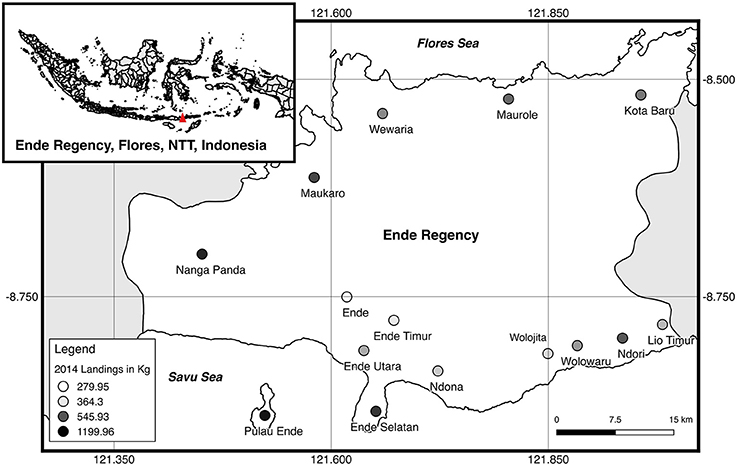
Figure 1. Map of ende regency. This map shows the most important subdistrics in Ende regency and reported landings in 2014. Most productive subdistrics are Pulau Ende and Nanga Panda.
In the past years, conservation and transnational institutions have called attention to the high level of non-sustainable exploitation and resource degradation in the Savu and Flores Seas (Ingles et al., 2008; Munasik et al., 2011; Achmad et al., 2013). Fishermen have observed sharp reductions of fish populations, with benthic, elasmobranch, and coral species suffering a dramatic decline (Fox, 2005; Blaber et al., 2009; Tull, 2009; Christensen and Tull, 2014). The action of foreign vessels has been reported since the early 2000s, which may further compromise the integrity of marine stocks. In 2013, there were talks and provincial plans for establishing dedicated coastal zones for conservation and ecotourism, and for attracting investment to develop fishing industries and fishing cooperatives (Munasik et al., 2011). More information on the historical context affecting Indonesian small-scale fisheries can be found in Table 1. The table shows a transition between an extractive colonial regime mostly concentrated in agricultural development to a nascent democratic republic, a military regime, and finally a neo-liberal democracy. The management of the fisheries reflected the need for economically sustainable food sources in the context of a rapidly growing population, echoing major trends observed in other parts of the developing world.
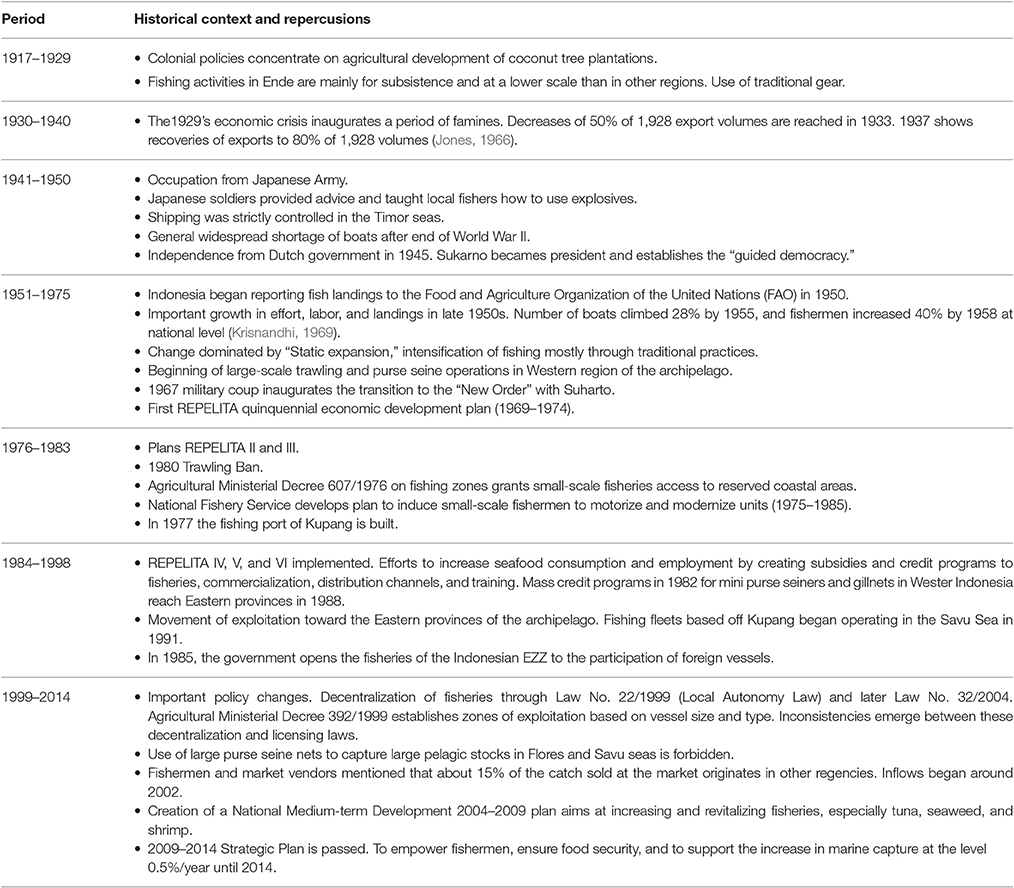
Table 1. Main historical events affecting a small-scale fishery through economic development programs and institutional policies in Ende, Nusa Tenggara Timur.
Catch Reconstructions
Approach 1: Historical Data and Archival Sources
Data were collected during three field seasons in May–August 2009, November 2010–January 2011, and June 2011–January 2013. Research objectives, protocols for data collection, and instruments were reviewed and approved by the Institutional Review Board of the University of Georgia (IRB 2010-10808-2) before any activities begun. Research permits were also procured through RISTEK, the Indonesian government agency that oversees international research and from the proper authorities (Propinsi NTT, Kabupaten Ende). Authors followed strict ethical procedures as outlined by the IRB and have no conflicts of interest to report. Archival research was conducted in Ende and Maumere (Flores, Indonesia), in Yogyakarta and Jakarta (Java, Indonesia), at the Royal Tropical Institute (Koninklijk Instituut voor de Tropen) in Amsterdam and at the Catholic Archives at Radboud University in Nijmegen (The Netherlands). The main sources of district level statistical information were the Bureau of Statistics of Ende (Badan Pusat Statistik Ende or BPSE), the Bureau of Statistics of Nusa Tenggara Timur Ende (Badan Pusat Statistik Nusa Tenggara Timur or BPSN), and the Fishing Commission of Ende District (Dinas Kelautan dan Perikanan or DKP). These offices produce numerous yearbooks and reports that were complemented and consolidated to derive time series.
The processes of reconstruction for population, landings, effort, and labor were completed by adopting a similar approach to Palomares and Heymans (2006) (Zeller et al., 2006, 2007, 2015), Piroddi et al. (2015), and Pauly and Zeller (2014). Reconstructions were informed by archival research, literature reviews, and the combination of multiple data sets from local and provincial agencies and FAO FISHSTATJ. Anchor points extracted from sources, were used to interpolate missing data when information was not available. When assumptions were required, proposed values were highly conservative and corrected by consulting at least two historical sources. See Tables 2, 3 for a description of data sources, anchor points, and estimations. Specifications are provided for particular years when calculations required adjustments. For example, Table 2 presents information on demographic reconstructions while Table 3 gives consideration to landings, effort, and number of active fishermen. In both cases, retrospective estimations are derived from anecdotal and colonial sources for the first half of the twentieth century; therefore, values should be considered as approximations. Information from neighboring districts such as Sikka and Kupang is used to control and extrapolate missing values. It is only at the beginning 1961 that official census data, local and regional statistics, and FAO reports become available. Figures from national, provincial, and district level sources such as BPSE and BPSN are reconciled by corroborating captures with yearbooks for other provinces. For more detail consult methodological annex.
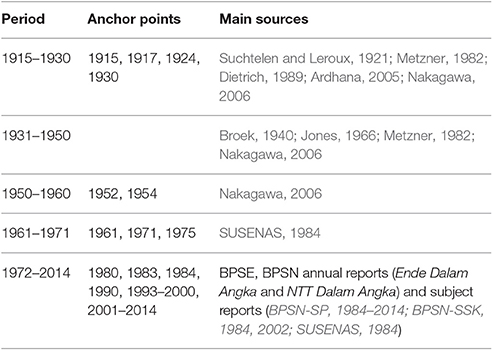
Table 2. Anchor points and main sources used for estimating population figures from 1917 to 2014.
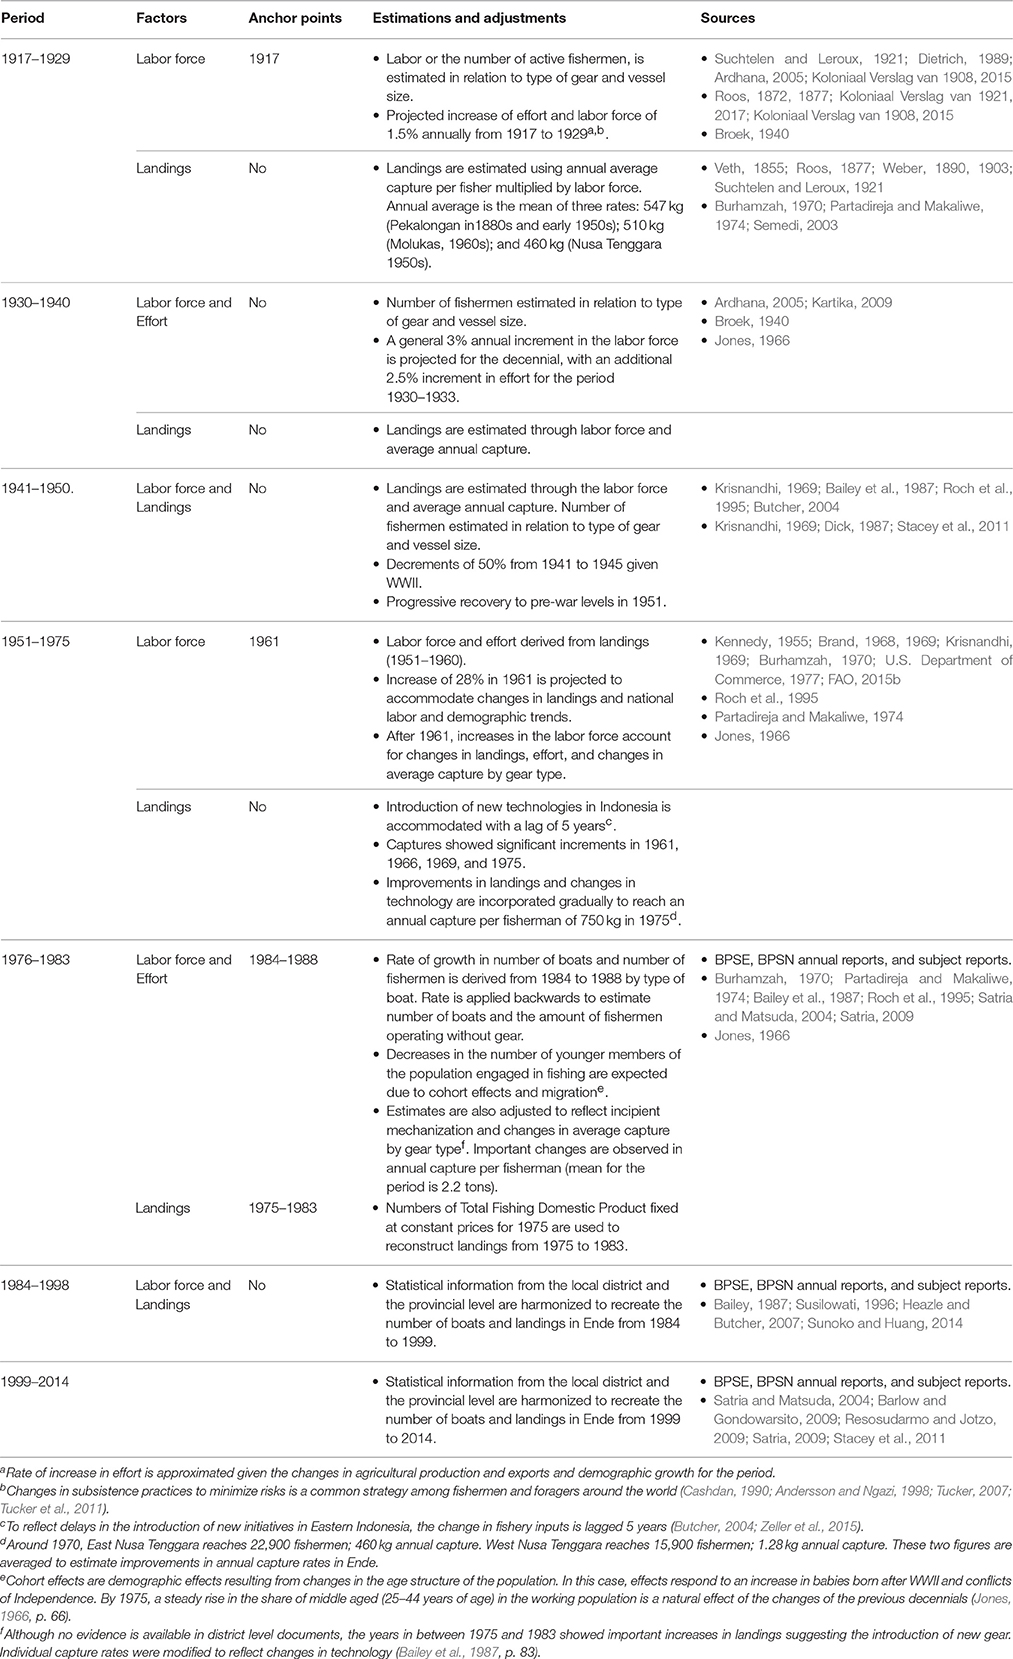
Table 3. List of estimations and evidence used to reconstruct effort, landings, and number of active fishers from 1917 to 2014.
Weights and transformations for reconstructions of landings, effort, and number of active fishermen.
To report landings and captures, the total amount of kilograms in tons is used without disaggregating by type of species or family. Capture is considered to be determined only by the level of fishing effort. Paucity of reliable meteorological datasets for the period before 1971 prevented the systematic consideration of environmental factors in reconstructions.
To standardize effort defined as number of boats, the different types of boats were weighted on the basis on their tonnage and potential optimal catch (Widodo et al., 2004). The estimation of catchability was very conservative and responded to observations of returns at the port of Ende (see Methodological Annex). To establish the effort for a year, weights were multiplied by the number and types of boats. The Catch per Unit of Effort or CPUE was calculated annually as the ratio between landings and effort.
Labor was operationalized as the number of fishermen including individuals with and without boats. To calculate the number of individuals fishing with boats (owners or crew members) the average sizes of crew by type of boat were used. Estimations of crew sizes derived from observations and historical sources (consult methodological annex and Table 3 for more details). For fishermen operating without gear, a ratio of 0.60 to the total number of individuals operating with boats was initially implemented. This proportion reflected an estimate of gear (nets) to boats, and was adjusted throughout the series to reflect changes brought by military conflicts, mechanization, and intensification of effort.
Approach 2: Field Observations
From June 2011 until January 2013, the author resided in Ende and Pulau Ende where she conducted intensive ethnographic, observational, and ecological research with the aid of two local field assistants. In total 132 surveys and about 120 semi-structured interviews were carried out among active fishermen in the village of Ipy in Ende, and in Rendo Rate Rua, Ekoreko, and Meti Numba in Pulau Ende following purposive sampling techniques. During interviews, fishermen provided information on fishing activities, seasonality, and historical and environmental changes in the fishery. Surveys allowed for a more systematic collection of data in relation to activity hours, gear used, average catch per season, catch sharing practices, income, and government or private support. In addition to fishing questionnaires and interviews, 113 households (adults) from two villages (Ipy and Rendo Rate Rua) were surveyed regarding their patterns of consumption of marine products. Weighing of portions and special foods was done with a 3,840 BLTBL™ Digital Nutritional Scale in Pulau Ende.
To monitor household fishing effort (the number of trips to capture fish) observations and voluntary diary logs were used at two villages (Ekoreko and Rendo Rate Rua) in Pulau Ende from September 2011 until July 2012 (10 months). The sample was balanced according to type of gear and data collection methods, with 20 fishermen being monitored daily by the main researcher and 20 individuals completing daily self-reports. Participants for self-reports were recruited after 8 months of residence, based on informally observed fishing frequency. Incentives for completing the logs were offered weekly during control visits and included fishing hooks, line, coffee, rice, and sugar. A total of 1,515 (766 canoe, 749 motorboat) fishing trips were recorded, including hour of departure, return, type of boat and gear, and total number of fish caught by species. Fish could not be weighted, as the catch would be sold at sea or right after return to port. In all cases, species were recorded in the local name and then identified with Reef Fish Identification Guides during focus groups and interviews with fishermen (Allen, 1999; Allen et al., 2005).
In addition to fishermen, 33 full time vendors were interviewed at the regional market to explore inflow of fish from other regencies and relations between offer and demand for seafood. Participants were recruited following purposive sampling techniques. It is estimated that this represents about 75% of vendors operating at any given time. The semi-structured interview tool included questions about the daily averages of fish sold according to size and species. Averages were requested in terms of units of fish and not in kg, and for small pelagic individuals vendors were asked about the approximate number of buckets commercialized daily. Other questions included fluctuations in catches, the presence of vendors from other regencies, and prices.
Finally, ecological research involved the monitoring of meteorological conditions. Two weather Davis Vantage Pro stations were placed in Ende and Pulau Ende by the main researcher. Measurements included temperature max and minimums, humidity, barometric pressure, wind direction and intensity, and lunar cycle and were taken from August 2011 to December 2012 every half hour. This information was used to reconcile effort data and to explain phases with no activity or low catches.
Projecting resource extraction
To estimate resource extraction for the district, primary data obtained through household surveys was combined with observations of fishing effort (1,515 events). It is assumed that fishing observations and survey results were representative of the whole fishing population (~7.000 fishing households; BPSE) in the area of study; and that fisheries were mostly artisanal and subsistence based. Because returns of observed fishing expeditions were in number of fish and not in kilograms, catch was disaggregated according to species and the units of fish captured were multiplied by each species average weight. In 2011–2012, 9% of the catch composed by varied demersal and benthic organisms, and 91% small pelagic and coral reef individuals. Kembung, also known as short or Indian mackerel (Rastrelliger brachysoma) was the most frequent species captured. A scombrid that inhabits shallow areas, kembung has an average weight that oscillates between 100 and 300 grams. A value of 200 grams was used as the standard weight per unit of fish. Also in 2011–2012, the mean CPUE estimated for small canoes was about 27.1 units of fish trip−1 day−1. This brings about a mean estimate of 7 kg trip−1 day−1. For motorboats, the mean CPUE was 49.8 units of fish trip−1 day−1, or approximately a mean of 12 kg trip−1 day−1. Results are very similar to estimates reported for Banggi subsistence and artisanal fisheries of Banggi, Malaysia (Teh et al., 2007, 2011). Annual captures are calculated by multiplying the mean observed CPUE of 2011–2012, 8.5 kg trip−1 day−1, by the reported number of days fishing (19 days a month, with 9 months of operation, totaling 171 days a year). This figure was then, multiplied by the number of active fishermen for a particular year to obtain the total amount of catches in kg. The estimate provided a second measure to qualify historical reconstructions.
Projecting consumption of marine products
To approximate of the amount of marine resources consumed by Ende, annual estimates of fish consumption were generated for both fishing and farming households (Table 4). Per capita annual consumption in fishing households was estimated through observations from nutritional surveys conducted in 2011–2012 among Endenese fishing households. Surveys assessed the frequency of fish consumption by main species per week and season and fish portion sizes. For farming households, estimates were derived from the 1984 national social survey (SUSENAS; BPSN, 1984–2014) and from nutritional research conducted in the regency in the early 1990s (Reinhard, 1997). In order to back cast rates to 1917, estimates were calculated with national per capita fish intake indices from FAO as well as academic and anecdotal sources. To elevate these values to the population level, intake estimates were multiplied by the number of farming and fishing households present in the area (see Annex).
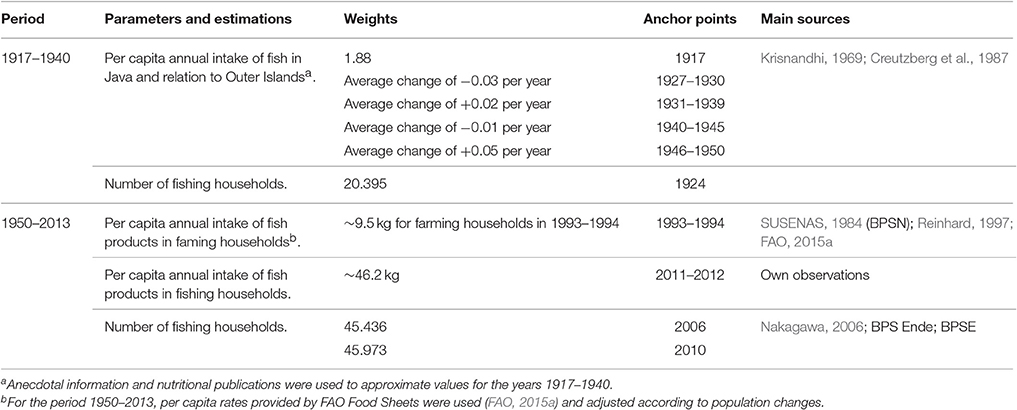
Table 4. List of parameters, weights, and evidence used to reconstruct consumption of marine products from 1917 to 2014.
Projected reconstructions have several limitations. For example, lack of reliable data of catch compositions from 1917 to 1984 prevented the inclusion of changes in consumption levels of different fish species that probably affected overall consumption patterns. In addition, changes in annual per capita intake and other measures were modeled in a linear way. Finally, surveys with vendors from the regional fish market of Mbongawani, Ende, were used to provide context on the offer and demand of fish products. All datasets supporting the conclusions of this article are included within the article and its additional files.
Data Analyses
All statistical analyses were conducted in JMPro 11. Simple correlation, regression, and exploratory cluster analyses were used to approximate the relation between changes in landings, effort, labor, seafood consumption levels, and population figures for the period 1951–2014. The years between 1917 and 1950 were not included in these analyses as reconstructions were based on extrapolations of numbers of fishermen and demography. Landings were log- transformed to reduce skewness in the data. To further study behavior and accuracy of reconstructions, paired-samples t-tests were used. First, the changes in the number of fishermen through time were evaluated through point analysis. Moving averages were calculated to smooth changes between individual data points, and the data series was partitioned into two periods for comparison (1951–1964 and 1965–1984). Second, the similarity between historical reconstructions of landings based on sources and official statistics and projections derived from observational data was assessed. In this second comparison, the series was also divided into two smaller temporal levels (1975–2014 and 1951–1975) to compare the performance of different individual annual catch rates.
The Maximum Sustainable Yield (MSY) and Maximum Sustainable Effort (MSE) for the period between 1975 and 2014 were calculated to evaluate the state of stocks and potential excesses in effort. The time period chosen responds to the quality and reliability of data. Information about landings was obtained from provincial and district level reports and no historical reconstructions or projections were included. In order to approximate demersal and neritic productivity to evaluate the state of the stocks, Dalzell and Pauly's log-linear models (Dalzell and Pauly, 1990; Tomascik et al., 1997) were applied. Through spatial statistical analysis primary productivity from 2011 to 2012 and bathymetry values were extracted for an area of 45 km from the port of Ende. The threshold of 45 km was selected as the maximum distance fishing boats might travel in one single trip given technological limitations (Semedi, 2003). It is assumed that, if oceanographic conditions were the same or better, MSY and MSE figures might reflect the potential productivity of fishing grounds in the early 1900s. Equation parameters can be found in Methodological Annex.
Results
Historical Reconstructions: Changes in Landings, Effort, and Labor
Total capture by Endenese fishermen from 1917 to 2014 was estimated at 342,561 ± 2,573 tons. The values for the reconstructed time series can be found in Table 5.
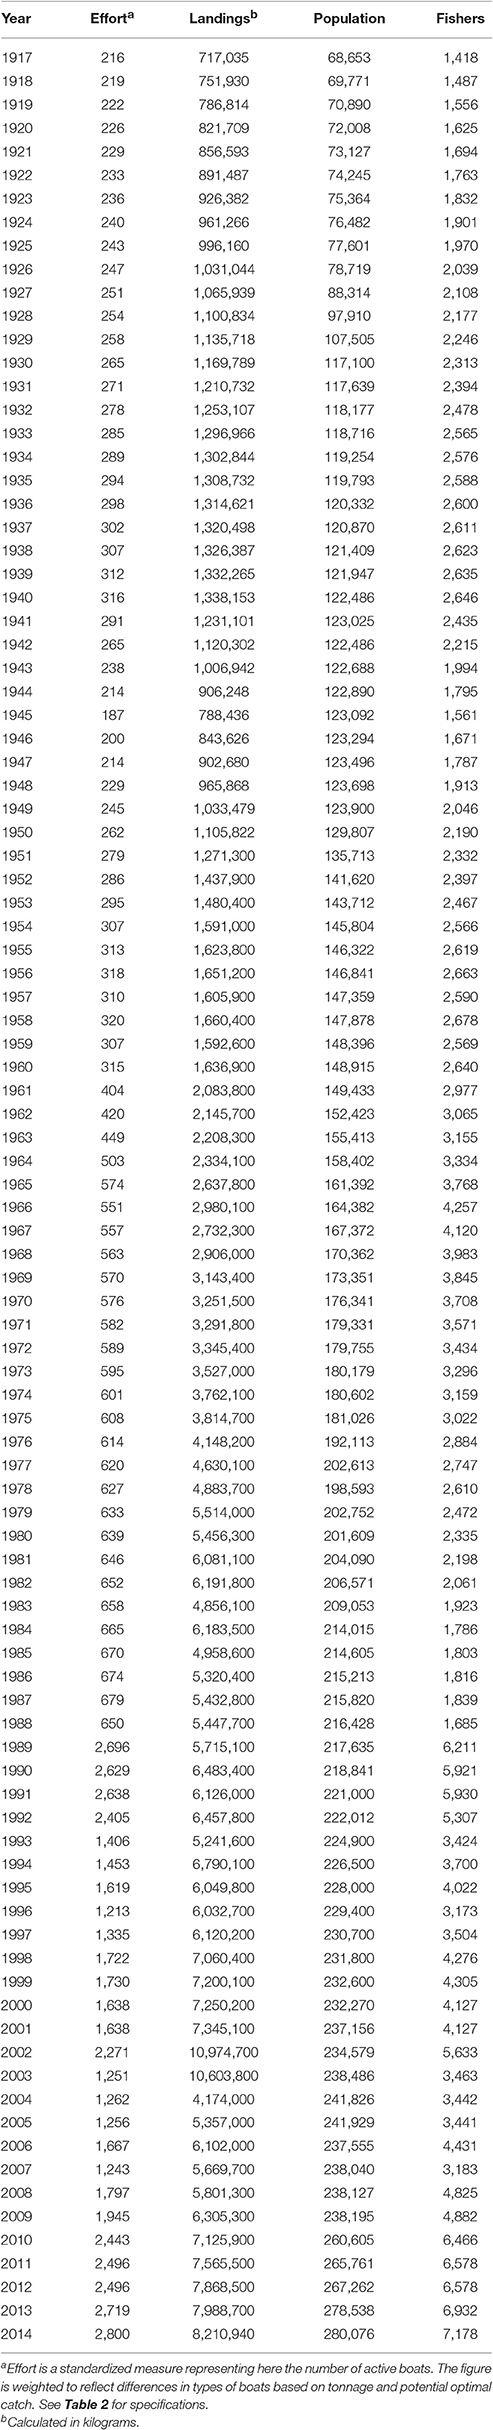
Table 5. Reconstructed time series of effort, landings, population, and number of active fishers at the regency of Ende, Flores, province of Nusa Tenggara Timur, Eastern Indonesia.
Estimations of Ende's productivity for demersal and pelagic species, and including only Savu's fishing grounds, are placed around 5,900 tons a year at best biological levels. Considering this figure as a proxy measuring the sustainability of the fishery, it is possible to hypothesize that exploitation was not intense from the first decades of the 1900s and into the early 1980s. Annual mean captures fell between 2,290 ± 1,600 tons. In 1989 reconstructions indicate that stocks might have been intensively exploited or exploited beyond sustainable limits. Effort and capture numbers exceed the parameters recommended by the Schaeffer MSY model (Figure 2). Through the mid-1990s and early 2000s, catches showed important oscillations reflecting an overall mild increasing trend. The increment, however, is not proportional to the changes in effort, which might suggest an overall excess of boats. The decrease in catch per unit of effort between 1990 and 1985 is about two and a half times.
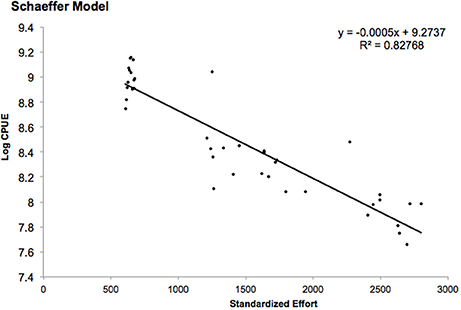
Figure 2. Schaeffer model. The regression line explains the association between the log of catch per unit of effort (CPUE) and effort. As effort increases, the log of CPUE decreases. The linear fit is highly significant, with an Adjusted R2of 0.82. The recommended maximum effort is 1,843 units of boats. The Maximum Sustainable Yield is estimated at 7,223 tons.
Observations of decreases in productivity are also supported by conversations and interviews with fishermen and market vendors. While changes in captures and landings were often discussed, fishermen also mentioned a modification in targeted species in the 1990s and 2000s. This shift was toward small pelagic stocks like mackerel tuna (Euthynnus affinis), skipjacks (Katsuwonus pelamis), sardines and anchovies (Clupeidae families), and scads (Carangidae families), and responded to the reduction of captures of large tunas and elasmobranchs, along with oscillations in the capture of reef and demersal species.
Concerning efficiency in captures, the reconstructed series of annual catch rates shows that individual productivity was relatively low until the beginning of the 1970s (Figure 3). The peak in fishing catch rates occurs in 1984, when the number of boats is 851 and the number of active fishermen is smaller in comparison to previous decades (BPSE). In 1989, the number of boats increases several orders along with the number of fishers. Individual productivity, however, falls back to early 1970s' values. The following years bring a steep increase in catch rates, that peaks in 2003 and decreases again toward 2014, when annual individual productivity is 1,134 kg. The catch per unit of effort shows a similar behavior, with steeper increments in 1984 and more pronounced declines in the 2000s (Figure 3). Overall, both measures indicate a decreasing trend for the past 30 years and provide further evidence of intensive exploitation of stocks.
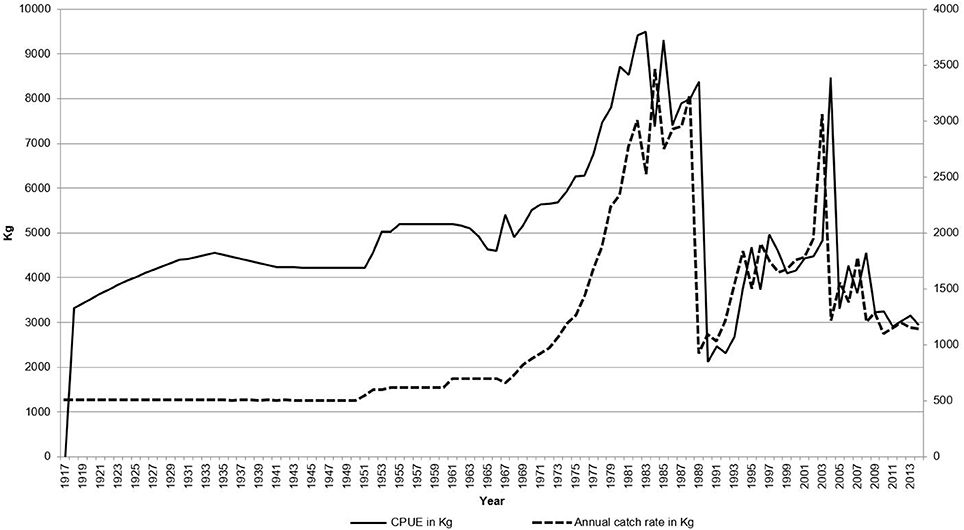
Figure 3. Time series of annual catch rates and CPUE. Chart shows the evolution of catch rates (annual landings divided by number of fishermen) and CPUE (catch-per-unit of effort; landings divided by standardized number of boats) for the period 1917–2014. Observe that both reconstructed measures peak in the mid-1980s, to decline in early 1990s. A second peak occurs in early 2000s.
The number of active fishers, or the labor force (Figure 4), exhibits a somewhat linear increase in reconstructions from 1917 to the early 1940s, and then from 1945 to the mid-1960s. In 1965 the working force averages 4,000. This figure reflects important increases in the number of fishermen at the national level as well as the impacts of population recovery and higher fertility rates after the war. The inference is substantiated in government documents, reports, and academic articles from the 1950 and 1960s that indicate important changes in the structure of age cohorts, mechanization, and landings in the country. The first year for which official statistics are available on labor composition in the district is 1984. Then, about 1,800 people seem to be participating in the fishery.
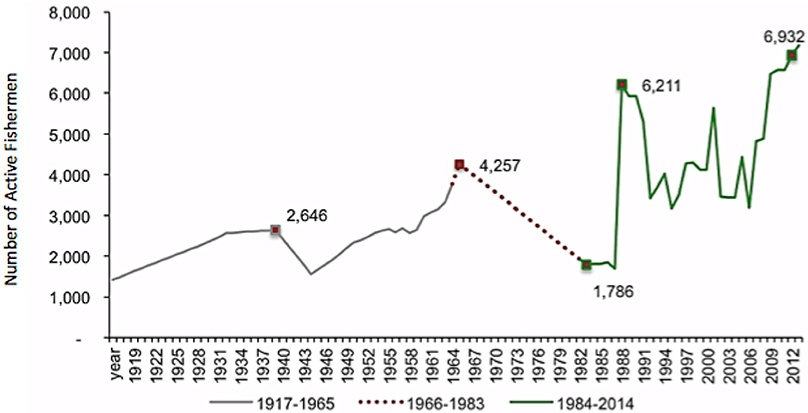
Figure 4. Time series of numbers of active fishers as reconstructed by historical data. The curve shows a bimodal distribution (Normal Mixture), with a potential change in moving averages occurring in the mid-1980s.
If comparing the two temporal markers, between 1966 and 1984, a 60% reduction in the working force seems to occur. As it will be discussed later, this sharp contraction can be an effect of overestimation errors given the use of anchor points, extrapolations from other regencies, and anecdotal evidence during the reconstruction. It can also be a factor of source accuracy and of changes on how statistics were reported at the district, provincial, and national levels. Another hypothesis that will be presented later is that the contraction of the labor force can be explained by the nature of the mechanization process in Ende. This speaks of a lack of policies directed at small-scale sectors of the fishery, of the instability in the job market, and of a complex scenario of demographic changes and migration.
After 1989, marked oscillations occur in the number of individuals participating in the fishery. Data points for this period are derived from official reports at the district and provincial levels with few inconsistencies (BPSE). When comparing the most recent decades against the reconstructions for the decennials 1950s, 1960s, and 1970s and for the early years of 1980s, a change can be observed in how the number of fishermen evolves over time. If the period is divided into two smaller equal sections (1955–1984, 1985–2014), and moving averages for each section are analyzed with a T-test for paired samples, differences are found to be significant (T = 4.00; p = 0.0004). Barring problems with accuracies in the reconstruction, the differences between the two temporal sections indicate that the number of jobs became even more unstable or variable after 1989.
Reconstructions of consumption of marine products: changes in per capita intake of seafood and market demand
Total consumption of seafood for the district is estimated at 201,300 ± 1,400 tons from 1917 to 2014 with average per capita fish consumption of 11.2 ± 4 kg per year (Table 6, Figure 5). The average is slightly inferior to estimates reported for Pacific Island countries (Zeller et al., 2006, 2007). This is not unusual, as Endenese fisheries have remained at subsistence levels. Only a much-reduced proportion of captures is destined to exports and this includes demersal and coral fisheries as well as elasmobranch products. Changes in fish intake have most likely occurred with modifications in catch per unit of effort over time and economic programs. The most critical developments influencing fishing households seem to have taken place after the 1960s and 1970s with the intensification of effort, increases in catch rates and landings, and the reduction of prices for fish products (BPSN). Farming households also began to incorporate seafood regularly into their diets with changes in roads and infrastructure along with health and nutritional programs.
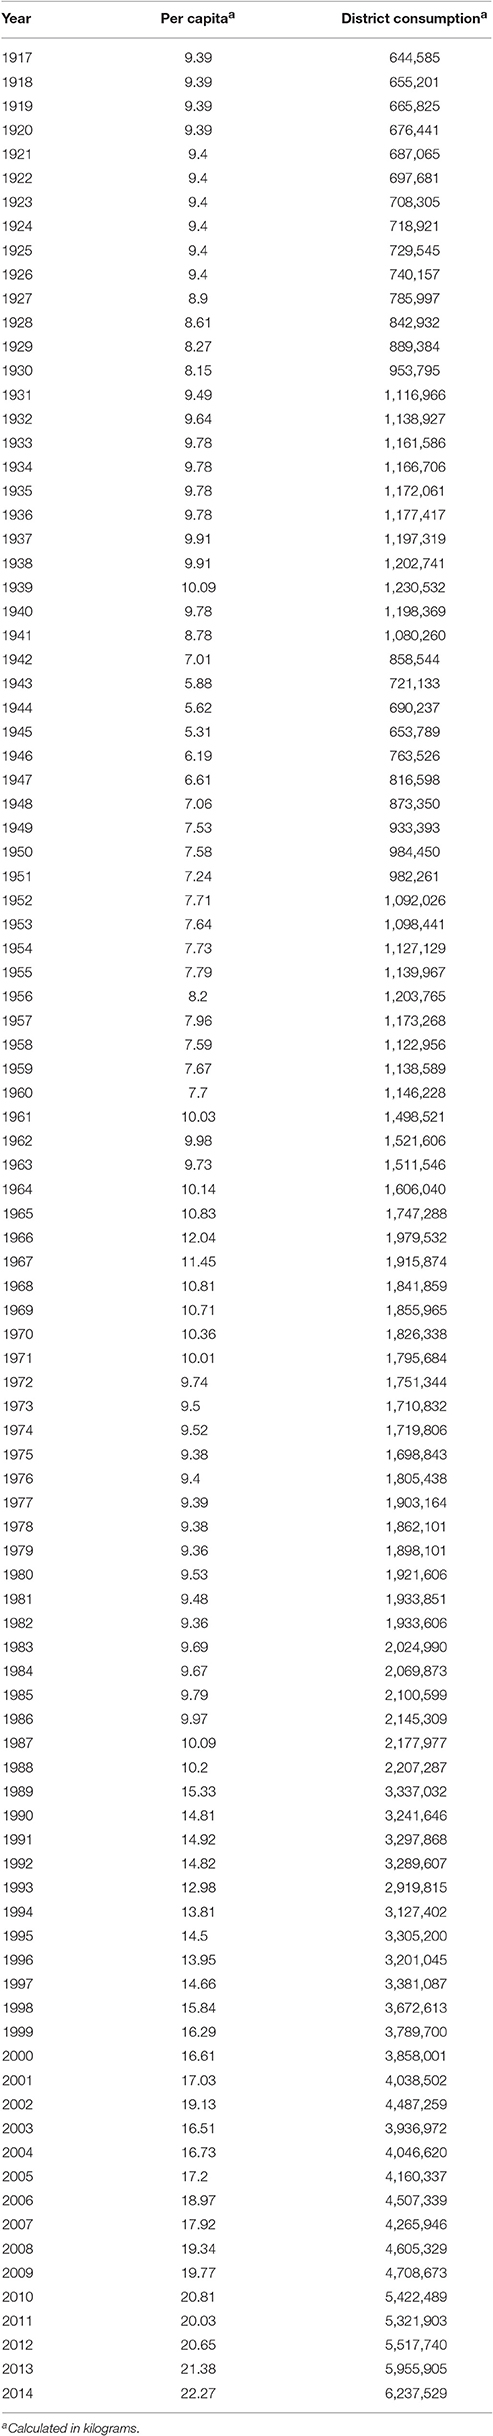
Table 6. Reconstructed time series of Per Capita seafood consumption and total consumption for Ende regency, Flores, province of Nusa Tenggara Timur, Eastern Indonesia.
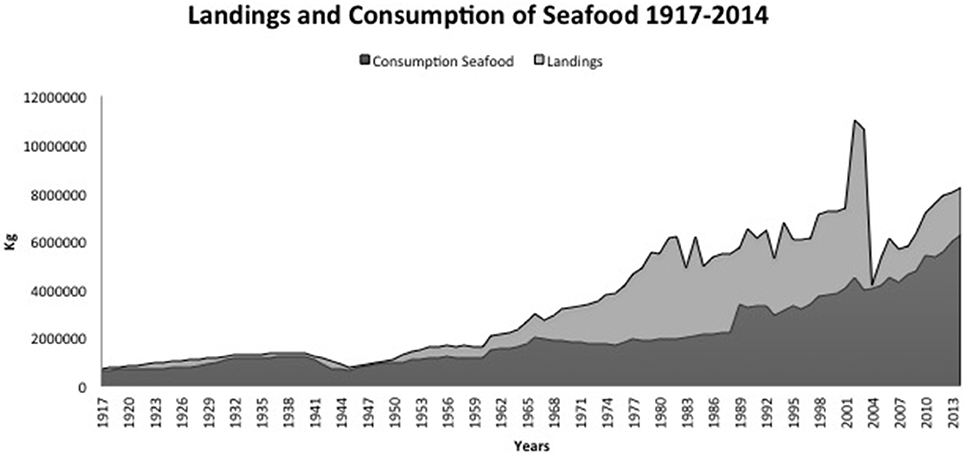
Figure 5. Landings and Consumption of Seafood from 1917 to 2014. Consumption of seafood and fish derived products increased in a continuous trend from early 1960s and reached 22 kg in the 2010s (see Table 4 for details).
Interviews with market vendors showed that, on any given day, the demand for seafood was capable of absorbing, and sometimes exceeded, offer. The market brings together about 125 vendors a day, a large fraction of which depends on partners from other towns to obtain fish. On average, five trucks a day (load of 350 kgs) come from the neighboring regencies of Sika (Sika and Maumere) and Nanga Keo (Bajawa). A conservative approach suggests that ~15% of what is reported as sold could have originated in other regencies. This inflow of fish started about 10–12 years ago and may correspond to the high levels of fluctuation in landings experienced in that period. Finally, it should be noted that even when total captures are growing, landings for some species have declined. For example, market vendors mentioned that small tuna and sardine are among the species most frequently sold, while on average, only 1 unit and a half of large size fish is commercialized per vendor per day.
Historical reconstructions vs. observed effort
To evaluate how historical reconstructions of landings matched retrospective projections for 1950–2014 based on observed effort, T-tests for paired samples were used (Table 7). Comparisons did not include the period between 1917 and 1949 as both reconstructed series relied on number of active fishermen to calculate landings. However, starting 1950, historical reconstructions built from FAO datasets and provincial or local statistics, while retrospective projections interpolated captures by multiplying observed annual capture by number of fishers per year (see Section Methods). For the most recent period spanning from 1975 to 2014, no differences were found between historical and observed reconstructions relying on an average capture of 8.5 kg trip−1 day−1. While there is an absolute difference of 81,826 kg between the means of both groups, the T-test reports a non-significant difference and a 0.54 correlation. For 1950 to 1975, the comparison of historically reconstructed landings and observed landings with an annual capture average of 4.75 kg trip−1 day−1 has a correlation of 0.73. The T-test is also non-significant (DF: 24) and the absolute difference between the two means is 152,589 kg. Overall, these results seem to indicate that a change of annual average captures per fisher per trip occurred in the late 1960s, early 1970s. The lower correlation in 1975–2014 between the two series could be a reflection of the oscillation in landings as shown in the data, as well as instability in individual capture rates.
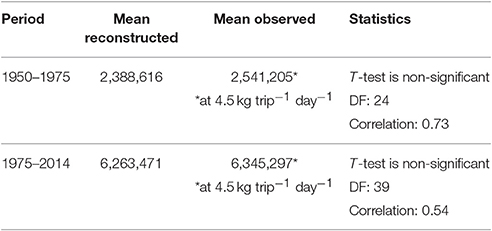
Table 7. Comparisons between reconstructions and observed effort.
To explore the associations between factors, simple regressions with landings as the dependent variable and population numbers, projected effort, and consumption as explanatory variables (Figure 6) were used. In all cases, polynomial fits modeled associations better with respective R2 of 0.93, 0.76, and 0.86. Changes in the relation between variables happen at different temporal times, mostly around the mid-1970, the 1980s, or the 1990s. For example, while landings and population numbers seem to increase somewhat proportionally until 1975, in 1976 data points become more dispersed. The relation between consumption and landings for the period 1951–2014 also shows higher dispersion in the 1980s and 1990s and some clustering. Regarding effort, the distribution of observations is more clearly clustered around three groups of data points (2200, 1200, and 680 units of standardized effort). Clusters capture the transitions and oscillations in variables occurring from the 1970s to the 2000s.
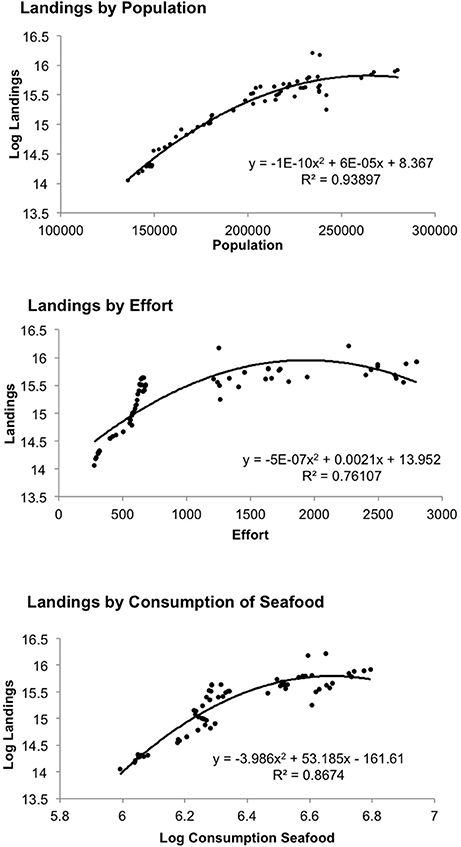
Figure 6. Associations. Graphs interpret the relations among reconstructed landings, effort, and consumption. Changes in the relation between variables occur at around the mid-1970, the 1980s, and through the 1990s and 2000s.
Discussion
Historical reconstructions complemented by observational and nutritional information provide evidence of the singular trajectory followed by Endenese fishing communities over the past 100 years. At the local level, Ende transitioned from a cash crop economy with marginal use of marine resources, to a society that consistently relies on fish as a source of protein and is intensively exploiting its stocks. This transition is seen in the reconstructions as a 10-fold increase in total landings and a five times increase in per capital fish consumption among farming sectors. Moreover, the fishery quadrupled the number of active fishers throughout the years. But, while the district's landings, marine products consumption, and population show increasing figures over time, this growth is not uniform. For example, the number of active fishermen, CPUE and annual capture rates, or standardized effort, do not seem to follow a simple linear trend, and show changes in mean values over time. To understand how these variables fluctuate, it is important to consider the larger historical context in which changes occurred. Ende embodies the case of a fishery that, because of its peripheral location, was exposed to discontinuous development and modernization policies. In tandem with the modifications in effort and consumption patterns instituted by the policies themselves, this characteristic probably exacerbated non-sustainable outcomes and had important effects within communities.
The germ of modernization and mechanization policies can be historically placed in the new economic direction adopted by post-Independence Indonesia during the late 1960s. Emerging from centuries of colonial domination, the new Indonesian state concentrated its efforts to boost the local economy and reduce staggering rates of poverty. In fisheries, actions were directed at achieving self-sufficiency in seafood production and the substitution of imports. These actions took place, initially, in the Western provinces of the archipelago. From 1951 to 1968 a sharp rise in the number of fishermen and fishing boats was experienced (Yamamoto, 1980). As a consequence, the amount of fish landed doubled by the end of 1960s (Krisnandhi, 1969). In 1967, with a change in government and the beginning of the New Order, a new economic direction was introduced. A set of quinquennial development programs, named REPELITA (Rencana Pembangunan Lima Tahun), run from 1969 to1999 and oriented efforts predominantly to the development of the agricultural industry and food production. New regulations created an inflow of foreign investment that was directed at the modernization of fishing sectors (U.S. Department of Commerce, 1977). The growth of offshore fishing was encouraged, giving impetus to the creation of new fishing fleets and the industrialization of operations. With the introduction of trawlers and large purse seiners, exports rose from USD $2 million in 1969 to $85 million in 1975 (U.S. Department of Commerce, 1977, p. 96). Modifications in productivity and gear had dire consequences to both fishermen and fisheries alike (Bailey, 1987; Bailey et al., 1987; Roch et al., 1995).
In Eastern Indonesia and particularly in Nusa Tenggara Timur, systematic changes associated to the development of productive sectors began to occur in the 1970s (Partadireja and Makaliwe, 1974). The implementation of the first REPELITA economic programs initially focused on communication, transportation, and infrastructure. Although it was recognized that development had to start by cementing the local economies, agricultural sectors only received 5% of the total budget. Within this distribution, most funds were allocated to animal husbandry and improvement of agricultural crops like cotton and coffee. In 1970, fishery contributions to the GDP of the province were almost three times the amount reported for 1969 suggesting important advances in captures (Partadireja and Makaliwe, 1974, p. 35). What created these increases remains uncertain. However, the allocation for fishery expenditures rose in 1972/1973 budgets (Partadireja and Makaliwe, 1974, p. 38). This was similar to what happened in the provinces of Bali, Moluccas, and Irian Jaya (Bailey et al., 1987). In these regions, captures of demersal and pelagic stocks improvemed with the introduction of large-scale gear. Increases in capture, however, should not be considered as an indication that modernization was taking place uniformly and across all fishery subsectors (Bailey et al., 1987, p. 42). In many locations, and especially in the eastern regions, practices still continued to rely on traditional boats (Partadireja and Makaliwe, 1974, p. 47; Butcher, 2004).
Mechanization of small-scale fisheries in the Nusa Tenggara province was very limited until the 1980s. The adoption of new technologies was constrained by a general lack of credits and government policies directed at facilitating technological transfer (Cribb and Ford, 2009). Other limitations were the availability of new equipment and gear, and the distance to centers of technological dissemination. With changes in infrastructure and communication brought by REPELITA plans in the 1970s and early 1980s, and the operation of large scale fishing fleets in the Eastern regions, exposure to technology gradually increased. As it has been observed for other small-scale fisheries in Southeast Asia and in Africa, the assimilation of new technologies probably modified the composition of fishing effort within communities and created competition between modernized and traditional fishermen (Ahmed, 1992; Andersson and Ngazi, 1998). Higher capture efficiency through gear substitution and motorization can deflate market prices, forcing households to invest in new technologies or to exit the fishery altogether (Bailey et al., 1987; Muhammad and Susilo, 1995). While this reservoir of labor could be absorbed by other sectors in the fishing industry, such as seafood processing or commercialization, in Eastern Indonesia there were very few industries, even less so directed at fisheries (Resosudarmo and Jotzo, 2009). Most likely, additional work effort engrossed the lines of infrastructure, commercial, and government service employment. But, where motorization outpaced both industrial and economic growth or effort concentrated in the hands of few, local fishing communities were most likely becoming poorer (Semedi, 2003).
The process of labor contraction was anticipated in the Western provinces by the evaluation of results from the 1973 national fishing survey by the FAO (Yamamoto, 1980). For example, it was noted that in early 1970s there was an excessive number of small-scale fishermen in the northern coasts of Java, and in other regions like Riau in Sumatra. Increases in efficiency of the fisheries in these regions were to be attained by reducing the numbers of individuals directly engaged in fishing (Yamamoto, 1980). While the creation of a middle fishing sector through technological development was highly desirable as a means to reduce poverty and to improve productivity of non-industrialized areas, it was also recognized that mechanization alone was not an adequate solution (Muhammad and Susilo, 1995). If the process was not accompanied by the introduction of economic alternatives at the community level, it could exacerbate economic deficiencies and be the “cause of serious social problems” (Yamamoto, 1980, p. 6.1.5; De la Cruz Modino and Pascual-Fernández, 2013; Donkersloot and Menzies, 2015). In fact, dramatic conflicts arose between trawlers and small-scale fishermen in the immediate years throughout the Western Provinces and Irian Jaya (Bailey, 1987; Roch et al., 1995).
In the case of Ende, historical reconstructions showed that the number of active fishermen experienced gradual increases until the1940s, when labor fell due to military conflicts. Activities recovered after the cease of hostilities, and continued to grow steadily into the 1960s. After 1965, a marked decrease of almost 60% in the working force occurred in the lapse of 20 years. High instability and posterior recovery of the number of individuals engaged in the fishery happened between 1987 and 2014. The particular trajectory followed by the labor force in the years in between 1965 and 1984 could be a result of inaccuracies in the process of reconstruction. For example, they may reflect errors in anchoring values due to underestimation of earlier figures. However, it could also be interpreted as evidencing an economic contraction of the number of individuals operating in the fishery given the introduction of technological innovation and mechanization. Additionally, demographic effects might explain a reduction of available labor as the age structure of the population pyramid shifted. While statistical information is scant, there are several pieces of evidence that may support this conclusion.
• For instance, fishermen mentioned that nylon nets began to substitute heavier traditional materials such as cotton or vegetal fibers by the late 1960s. Sailboats remained in use until the mid-1980s, when access to outboard engines became more common. Older fishermen did not recall any government aid directly supporting their activities, but emphasized that improvements were based on individual initiative. Traditional shipping and trade between Ende, Bima, and Ujung Padang, made the circulation of these innovations possible. However, not all fishermen had the means to mechanize, and credits were infrequent. The first mention of provincial support and an increase in fishing effort occurs in 1989 (BPSE). This is not surprising, as REPELITA programs seem to have focused on aquaculture and the development of infrastructure such as ports.
• Secondly, considering that no trawling or industrial fishing has ever been established or operated off Ende, observed increases in landings in 1976 might point to an improvement in the efficiency within the small-scale sector. The composition of effort in 1984 shows the existence of 62 motorboats (<5 tons) and of 6 larger-scale motorized vessels (>5 tons). This is markedly different from 1917, where the number of ships of similar tonnage totaled 14.
• Thirdly, whereas close to 1970, the number of fishermen in East Nusa Tenggara was roughly placed at 23,000 (Partadireja and Makaliwe, 1974, 47), in 1983 there were 15,611 fishing households, or ~18,000 fishermen (BPSE, vi). Hence, indicating reduction of 22% of the number of individuals engaged in the fishery. The report also mentioned that while productivity was kept high, the contraction in manpower in all agricultural sectors was compensated by a migration of workers to areas of commerce and infrastructure.
• Finally, the impacts of demographic changes and inter-island migration should not be overlooked. After WWII, population numbers experienced significant rates of growth (Jones, 1966). As a result, by late 1950s, an inflow of younger individuals was available to join the active work force. By 1965, a renewed emphasis of migration programs, and the creation of jobs in other spheres of the local and regional administration could have meant a reduction of individuals willing to engage in fishing. By 1975, the number of people in the age bracket between 25 and 44 years of age probably tied or surpassed the younger cohorts. Combined to low life expectancy rates (Resosudarmo and Jotzo, 2009) the effect of an older population of workers may have also contributed to lower levels of active engagement in the fishery.
In addition to changes in the composition of the labor force, with the expansion in mechanization in 1970s–1980s, the sustainability of marine resources in the archipelago at large started to decline. In the western Indonesian seas, the central government responded by introducing several measures that sought to protect small-scale fisheries, such as a general ban on all trawling operations. Moreover, during the mid-1980s the general government began to pursue the rationalization and fair allocation of economic growth in the sector by passing several pieces of legislation to protect smaller sectors. This direction took an important role in the quinquennial economic plans, REPELITA V (1989–1994) and REPELITA VI (1994–1999). In 1985, however, the central government modified licensing processes and allowed for the creation of joint ventures. As a result, the fisheries of the Indonesian EZZ became open to the participation of foreign vessels (Sunoko and Huang, 2014).
In Eastern Indonesia, where degradation was not perceived as a threat, the central and the regional government pursued an increase in the number of large vessels fishing for skipjack and tunas operating off ports such as Benoa, Bali and Kupang, Timor. In Ende, modernization continued to prosper with rapid growth in the number of motorized boats. In 1989, through provincial programs, effort quadrupled (BPSE). However, by 1993, the number of boats and landings declined almost 30% suggesting a reduction of fish stocks. Evidence from reconstructions and interviews suggests as signs of overfishing or overexploitation (Reitz, 2004; Carder et al., 2007). It is also in 1992 that Flores suffered a devastating earthquake and tsunami that may also account for the changes in effort. In the following years, landings recovered showing a slow increasing trend due to provincial aid (BPSE). But, this trend was not stable. Throughout the mid-1990s and early 2000s, the level of effort oscillated given new decentralization policies and repercussions of the 1997/1999 El Niño-La Niña events. For example, changes in landings and catch compositions were experienced in other fisheries in Eastern Indonesia in the years before and after 1997 that may have influenced active participation in the fishery (Blaber et al., 2005; Stacey et al., 2011). Tied to success in landings and sustainable aid, the labor force also experienced fluctuations. It is also at this time that immigration to Malaysia and neighboring countries began to rise (Barlow and Gondowarsito, 2009).
At the general level, REPELITA VI marked the beginning of decentralization efforts in natural resource management of fisheries, forestry, and irrigation to provincial and local authorities (Susilowati, 1996). However, the implementation of decentralization policies run into several impediments that include lack of personnel trained in fisheries and lack of trust among different institutions (Satria and Matsuda, 2004; Barlow and Gondowarsito, 2009). All of these limitations seemed to be true in the case of Ende. In 2002, another influx of boats increased effort with landings reaching unprecedented numbers for 2002 and 2003. In 2004, yields fell to 60% of previous reported numbers, remaining at similar or lower levels in comparison to the previous decade. This result may reflect the conflation of incentivization policies with environmental pressures introduced by 2002–2004 El Niño-La Niña events. Changes in ecological conditions probably created new stressors to threatened fishing stocks. The level of effort was incentivized to counterbalance diminishing yields and thus, leading to the 2004 decline.
By 2005, a presidential regulation enacted the National Medium-term Development 2004–2009 plan. The program included an improvement in provision and data accuracy, the development of fishing facilities and handling systems, and the empowerment of the tuna, seaweed, and shrimp fisheries. None of these measures, however, created significant changes in the district of Ende. While informants mentioned the introduction of seaweed programs and training, only a few fishermen were selected to participate and efforts where hindered by favoritism and corruption. When this research was carried out (2009–2012), support from the regional fishery was scant and irregular and mostly directed at intensification through the introduction of lampara boats (middle purse seiners). Going against the long-standing independent and individualistic character of the fishery, fishermen that wanted to access gear or engines needed to form smaller groups of three to four to receive any support. Nowadays, the fishery remains at large of subsistence scale. Lampara boats are growing and encroaching into coastal fishing grounds. With a tonnage that averages 4 of sardines, anchovies, and small pelagic fish, the proliferation of these boats are favoring the concentration of the fishery into a few hands. Ende may be at the brink of a new transition that could mean once again the contraction of the working force and the loss of operational independence by the smallest fishermen.
The future remains unknown for small-scale fishermen in Ende. With the establishment of marine protected areas in the Savu through a presidential decree in 2009, local district offices have taken new steps into addressing environmental concerns (Munasik et al., 2011; Achmad et al., 2013). Whether these new guidelines will be at odds with the pressures toward intensifying the fishery and achieving sufficiency in food production or whether they may be successfully reconciled, remains to be seen.
Conclusion
Through historical ecology and ethnography, this article explored the impact of development and modernization policies among small-scale fisheries in Ende, Eastern Indonesia. Within fishery management, the transformation of local fisheries has often been seen as a result of intensive technological and capital development promoted by government and non-government agencies (MacFadyen and Corcoran, 2002). While true in other contexts, modernization is a relatively recent undertaking in Ende and has followed a rather fragmented and discontinuous process leaving a particular set of tracks. Endenese fisheries have experienced different gradients of transformation that speak of diverse and complex trajectories in the adoption of technological innovation (Ahmed, 1992). Understanding these trajectories is central to advancing fair regimes of resource use.
For example, when mechanization had not been properly regulated, the increasing competition by more efficient boats has resulted in the concentration of resources, the use of damaging fishing practices, and environmental degradation. The opportunistic nature in which policies were implemented has also meant that benefits from advancements were not equally shared among the parts, creating instability in the labor market and further eroding households' economic sufficiency. At present times, the situation has become more critical due continuous pressure toward modernization and stocks experiencing important changes in composition and stability.
As new regimes of governance are being proposed at the provincial level to address resource depletion and damaging fishing practices, it is important to see how small-scale fisheries are not isolated relicts of tradition. Even when considered peripheral in their geographical location, fishing communities like Ende are not disconnected from trade or technological centers (Wolf and Eriksen, 2010). And while they have been relegated in government priorities, they have become very attractive to illegal fishing operations that include shark finning (Christensen and Tull, 2014). In these cases, is through Chinese middlemen that fishermen acquire much desired technological innovations and new fishing gear. Not accounting for these interconnections within policy and governance mechanisms has serious consequences for biodiversity conservation. Ultimately, environmental degradation reverts to the long-term sustainability of local livelihoods within the community and contributes to exacerbate poverty.
Almost 10 years ago, Heazle and Butcher proposed that to prevent further depletion of marine resources, we should pursued management solutions as “integral parts of a broader regional strategy that takes into account the political and economic circumstances of the region” (2007, 282). Historical reconstructions can help us elucidate how different patterns of development take shape. Understanding the outcomes of mechanization at the fringes of more centralized systems is essential to navigate the tradeoffs among poverty reduction, economic growth, and environmental degradation.
Limitations of the Current Study
There are several limitations with the current study. Like other historical reconstructions of small-scale fisheries, this article relies on effort data that may provide an incomplete characterization of the intensity of resource harvesting activities. Given the nature of small-scale fisheries, the large diversity of gears and equipment used makes the systematic consideration of effort an arduous task. Direct monitoring of fishing behavior and landed captures is also difficult due to the flexibility of practices and schedules among individual fishermen. This creates some issues in the estimation procedures that should be acknowledged. Second, while observations and extensive archival and participant observation research were used to contextualized estimates, there are also risks of underestimation given the lack of information in terms of illegal operations in this particular region of the Savu. In addition, it is important to observe that the MSY model suffers from limitations for no biological estimations of growth or survival are available to correct inferences. Calculations might be reflecting thus the intensity of effort instead of real biomass numbers. Finally, environmental fluctuations affecting stocks have not been considered in the projections. The absence of meteorological datasets makes the assessment of the role of environmental fluctuations challenging. Future studies will address these shortcomings.
Ethics Statement
Institutional Review Board from The University of Georgia. Verbal informed consent was used to collect data for this study.
(a) Interviews/Short Interviews/Surveys:
(1) Participants were provided with a prior informed consent document informing them of the purpose of the investigation, the data collection process, benefits, and potential risks.
(2) The content of the prior informed consent document was discussed verbally with each participant for their approval.
(3) Participants were asked to give consent to their participation in the study.
(b) Time Allocation (Scans, focal follows, fishing logs):
Observations of actions conducted by individuals were registered by the researcher. Previous authorization to conduct such observations was solicited with the consent document.
Availability of Data and Materials
The datasets supporting the conclusions of this article are included within the article (and its additional files). All datasets and sources used if not included in the document are available upon additional request to the author.
Author Contributions
The author confirms being the sole contributor of this work and approved it for publication.
Funding
Funding for data collection was provided through an NSF DDIG (1022914) dissertation improvement grant and a NOAA/OHH GOHI training grant.
Conflict of Interest Statement
The author declares that the research was conducted in the absence of any commercial or financial relationships that could be construed as a potential conflict of interest.
Supplementary Material
The Supplementary Material for this article can be found online at: https://www.frontiersin.org/article/10.3389/fmars.2017.00065/full#supplementary-material
Abbreviations
BPSE, Badan Pusat Statistik Ende; The office for Statistical Information for Ende District. BPSN, Badan Pusat Statistik Nusa Tenggara Timur; The office for Statistical information at the Provincial Level of Nusa Tenggara Timur. DKP, Dinas Kelautan dan Perikanan; Endenese Fishing Commission. CPUE, Catch per Unit of Effort; MSY, Maximum Sustainable Yield; MSE, Maximum Sustainable Effort; REPELITA, Rencana Pembangunan Lima Tahun; Five year development plans introduced by the Indonesian Government.
References
Achmad, A., Munasik, M., and Wijayanti, D. P. (2013). Kondisi ekosistem terumbu karang dI rote timur, kabupaten rote ndao, taman nasional perairan laut sawu menggunakan metode manta tow. J. Mar. Res. 2, 211–219. Available online at: http://www.ejournal-s1.undip.ac.id/index.php/jmr/issue/view/231
Ahmed, S. (1992). Impact of New Technology on Traditional Fishing Communities in Bangladesh Washington, DC: Mimeo. Available online at: https://dlc.dlib.indiana.edu/dlc/handle/10535/885
Allen, G. R. (1999). Three new species of damselfishes (Pomacentridae) from Indonesia and eastern Papua New Guinea. Rev. Aquariol. 25, 99–105.
Allen, G., Steene, S., Humann, P., and Deloach, N. (2005). Reef Fish Identification: Tropical Pacific. New World Publications.
Allison, E. H., and Ellis, F. (2001). The livelihoods approach and management of small-scale fisheries. Mar. Policy 25, 377–388. doi: 10.1016/S0308-597X(01)00023-9
Allison, E. H., and Kelling, I. (2009). “Fishy crimes: the societal costs of poorly governed marine fisheries,” in Conference Proceedings of the Third Annual Convention of the Consortium of Non-traditional Security Studies in Asia (Singapore).
Andersson, J., and Ngazi, Z. (1998). Coastal communities' production choices, risk diversification, and subsistence behavior: responses in periods of transition: a case study from Tanzania. Ambio 27, 686–693.
Ardhana, I. K. (2005). Penataan Nusa Tenggara Pada Masa Kolonial 1915–1950. Jakarta: RajaGrafindo Persada.
Bailey, C. (1987). Social Consequences of Excess Fishing Effort. RAPA Report. FAO the United Nations. Bangkok. Available online at: http://www.fao.org/3/a-bm726e.pdf
Bailey, C., Dwiponggo, A., and Marahudin, F. (1987). Indonesian Marine Capture Fisheries. ICLARM Contribution, no. 388, International Center for Living Aquatic Resources Management, Makati, PH.
Barlow, C., and Gondowarsito, R. (2009). “Socio-economic conditions and poverty alleviation in East Nusa Tenggara,” in Working with Nature against Poverty: Development, Resources and the Environment in Eastern Indonesia, eds B. P. Resosudarmo and F. Jotzo (Singapore: Institute of Southeast Asian Studies (ISEAS)), 94–123. Available online at: https://manowar.tamucc.edu/login?url=http://search.ebscohost.com/login.aspx?direct=true&db=eih&AN=50335021&site=eds-live&scope=site
Bavinck, M., Chuenpagdee, R., Jentoft, S., and Kooiman, J. (2013). (eds.). Governability of Fisheries and Aquaculture, Vol. 7, MARE Publication Series. Dordrecht: Springer Netherlands. doi: 10.1007/978-94-007-6107-0
Bavinck, M., Jentoft, S., Pascual-Fernández, J. J., and Marciniak, B. (2015). Interactive coastal governance: the role of pre-modern fisher organizations in improving governability. Ocean Coast. Manag. 117, 52–60. doi: 10.1016/j.ocecoaman.2015.05.012
Béné, C. (2003). When fishery rhymes with poverty: a first step beyond the old paradigm on poverty in small-scale fisheries. World Dev. 31, 949–975. doi: 10.1016/S0305-750X(03)00045-7
Béné, C., and Allison, E. H. (2010). Not by rent alone: analysing the pro-poor functions of small-scale fisheries in developing countries. Dev. Pol. Rev. 3, 325–358. doi: 10.1111/j.1467-7679.2010.00486.x
Blaber, S. J. M., Dichmont, C. M., Buckworth, R. C., Sumiono, B., Nurhakim, S., Iskandar, B., et al. (2005). Shared stocks of snappers (lutjanidae) in australia and indonesia: integrating biology, population dynamics and socio-economics to examine management scenarios. Rev. Fish Biol. Fish. 15, 111–127. doi: 10.1007/s11160-005-3887-y
Blaber, S. J. M., Dichmont, C. M., White, W., Buckworth, R., Sadiyah, L., Iskandar, B., et al. (2009). Elasmobranchs in southern indonesian fisheries: the fisheries, the status of the stocks and management options. Rev. Fish Biol. Fish. 19, 367–391. doi: 10.1007/s11160-009-9110-9
Blythe, J. L., Murray, G., and Flaherty, M. S. (2013). Historical perspectives and recent trends in the coastal mozambican fishery. Ecol. Soc. 18:65. doi: 10.5751/ES-05759-180465
BPSE (1984–2014). Badan Pusat Statistik Kabupaten Ende 1984 to 2014. Ende Dalam Angka. Badan Pusat Statistik Kabupaten Ende.
BPSN (1984–2014). Badan Pusat Statistik Nusa Tenggara Timur 1984 to 2014. NTT dalam Angka. Badan Pusat Statistik Nusa Tenggara Timur.
BPSN-SP (1984–2014). Statistik Pertanian Nusa Tenggara Timur from 1984 to 2014. Badan Pusan Statistik Nusa Tenggara Timur Nusa Tenggara Timur.
Brand, W. (1968). The manpower situation in indonesia. Bull. Indones. Econ. Stud. 4, 48–72. doi: 10.1080/00074916812331331272
Brand, W. (1969). Some statistical data on Indonesia. Bijdr. Taal. Land En Volkenkunde. 125, 305–327. doi: 10.1163/22134379-90002836
Broek, J. O. M. (1940). The economic development of the outer provinces of the netherlands indies. Geogr. Rev. 30, 187–200. doi: 10.2307/210140
Burhamzah (1970). An economic survey of maluku. Bull. Indones. Econ. Stud. 6, 31–45. doi: 10.1080/00074917012331331608
Butcher, J. G. (2004). The Closing of the Frontier: A History of the Marine Fisheries of Southeast Asia, C. 1850–2000. Singapore: Institute of Southeast Asian Studies/KITLV.
Carder, N., Reitz, E. J., and Crock, J. G. (2007). Fish communities and populations during the post-saladoid period (AD 600/800–1500), Anguilla, Lesser Antilles. J. Archaeol. Sci. 34, 588–599. doi: 10.1016/j.jas.2006.06.014
Cashdan, E. A. (1990). Risk and Uncertainty in Tribal and Peasant Economies. Boulder, CO: Westview Press.
Charles, A. (2011). “Good practices for governance of small-scale fisheries,” in World Small-Scale Fisheries Contemporary Visions, ed R. Chuenpagdee (Delft: Eburon), 285–299.
Christensen, J., and Tull, M. (2014). Historical Perspectives of Fisheries Exploitation in the Indo-Pacific. Dordrecht; New York, NY: Springer. doi: 10.1007/978-94-017-8727-7
Chuenpagdee, R. (2011). World Small-Scale Fisheries: Contemporary Visions. Delft: Eburon Uitgeverij B.V.
Creutzberg, P., van Laanen, J. T. M., Madjid, A., and Mochtar, K. (1987). Sejarah statistik Ekonomi Indonesia. Jakarta: Yayasan Obor Indonesia.
Cribb, R. B., and Ford, M. (eds.). (2009). “Indonesia as an archipelago: managing islands, managing the seas,” in Indonesia Beyond the Water's Edge: Managing an Archipelagic State (Singapore: Institute of Southeast Asian Studies), 1–27.
Dalzell, P., and Pauly, D. (1990). Assessment of the fish resources of southeast asia, with emphasis of the banda and arafura seas. Neth. J. Sea Res. 25, 641–650. doi: 10.1016/0077-7579(90)90086-V
De la Cruz Modino, R., and Pascual-Fernández, J. J. (2013). “Marine protected areas in the Canary Islands – improving their governability,” in Governability of Fisheries and Aquaculture, eds M. Bavinck, R. Chuenpagdee, S. Jentoft, and J. Kooiman (Dordrecht: Springer Netherlands), 219–240. doi: 10.1007/978-94-007-6107-0_12
Dick, H. W. (1987). Prahu shipping in eastern indonesia in the interwar period. Bull. Indones. Econ. Stud. 23, 104–121. doi: 10.1080/00074918712331335141
Dietrich, S. (1989). Kolonialismus Und Mission Auf Flores: (ca. 1900–1942). Munchner Beitrage Zur Sud-Sudostasienkunde. Karsbach: Klaus Kenner Verlag.
Donkersloot, R., and Menzies, C. (2015). Place-based fishing livelihoods and the global ocean: the irish pelagic fleet at home and abroad. Marit. Stud. 14:20. doi: 10.1186/s40152-015-0038-5
FAO (2015a). FAO Food Sheets. Food and Agriculture Organization of the United Nations. Available online at: http://faostat3.fao.org/browse/FB/CL/E
FAO (2015b). Indonesia Captures 1951-2013. Food and Agriculture Organization of the United Nations. Available online at: http://faostat3.fao.org/home/E
Fox, J. J. (2005). “In a single generation: a lament for the forests and seas of Indonesia,” in Muddied Waters: Historical and Contemporary Perspectives on Management of Forests and Fisheries in Island Southeast Asia, eds P. Boomgaard, D. Henley, and M. Osseweijer (Leiden: KITLV), 43–60.
Fox, J. J., Adhuri, D. S., Therik, T., and Carnegie, M. (2009). “Chapter 9: searching for a livelihood: the dilemma of small-boat fishermen in Eastern Indonesia,” in Working with Nature against Poverty: Development, Resources and the Environment in Eastern Indonesia (Institute of Southeast Asian Studies), 201–225. Available online at: https://manowar.tamucc.edu/login?url=http://search.ebscohost.com/login.aspx?direct=true&db=eih&AN=50335025&site=eds-live&scope=site
Heazle, M., and Butcher, J. G. (2007). Fisheries depletion and the state in indonesia: towards a regional regulatory regime. Mar. Pol. 31, 276–286. doi: 10.1016/j.marpol.2006.08.006
Ingles, J., Flores, J., Musthofa, I., and Mous, P. (2008). “Getting off the hook: reforming the tuna fisheries in Indonesia.” in WWF-Coral Triangle Initiative. Available online at: http://d2ouvy59p0dg6k.cloudfront.net/downloads/getting_off_the_hook_full_report.pdf
Jacquet, J., Fox, H., Motta, H., Ngusaru, A., and Zeller, D. (2010). Few data but many fish: marine small-scale fisheries catches for mozambique and tanzania. Afr. J. Mar. Sci. 32, 197–206. doi: 10.2989/1814232X.2010.501559
Jones, G. W. (1966). The growth and changing structure of the indonesian labour force, 1930-81. Bull. Indones. Econ. Stud. 2, 50–74. doi: 10.1080/00074916612331332937
Kartika, F. I. (2009). Pelabuhan Ende Dalam Jaringan Pelayaran Di Kawasan Laut Sawu Dan Sekitarnya 1839-190. Depok: Universitas Indonesia. Available online at: http://lib.ui.ac.id/file?file=digital/20160755-RB04F369p-Pelabuhan%20Ende.pdf
Koloniaal Verslag van 1908 (2015). Europeana. Available online at: http://www.europeana.eu/portal/record/9200401/BibliographicResource_1000056767874.html (Accessed September 26).
Koloniaal Verslag van 1921 (2017). Staten Generaal Digitaal. Available online at: http://www.statengeneraaldigitaal.nl (Accessed March 17).
Krisnandhi, S. (1969). The economic development of indonesia's sea fishing industry. Bull. Indones. Econ. Stud. 5, 49–72. doi: 10.1080/00074916912331331342
Lenselink, N. M. (2002). Participation in Artisanal Fisheries Management for Improved Livelihoods in West Africa: A Synthesis of Interviews and Cases from Mauritania, Senegal, Guinea and Ghana. FAO Fisheries Technical Paper 432. Food and Agriculture Organization, Rome.
MacFadyen, G., and Corcoran, E. (2002). Literature Review of Studies on Poverty in Fishing Communities and of Lessons Learned in Using the Sustainable Livelihoods Approach in Poverty Alleviation Strategies and Projects. FAO Fisheries Circular. Available online at: ftp://193.43.36.93/docrep/fao/005/y3914e/y3914e00.pdf.
Mangubhai, S., Erdmann, M. V., Wilson, J. R., Huffard, C. L., Ballamu, F., Hidayat, N. I., Hitipeuw, C., et al. (2012). Papuan bird's head seascape: emerging threats and challenges in the global center of marine biodiversity. Mar. Pollut. Bull. 64, 2279–2295. doi: 10.1016/j.marpolbul.2012.07.024
Metzner, J. K. (1982). Agriculture and Population Pressure in Sikka, Isle of Flores: A Contribution to the Study of the Stability of Agricultural Systems in the Wet and Dry Tropics. Canberra, ACT: Development Studies Centre, Australian National University.
Muhammad, S., and Susilo, E. (1995). “East Java fishermen's attitudes toward new fishing technology,” in Proceedings of Socioeconomics, Innovation and Management of the Java Sea Pelagic Fisheries (SOSEKIMA) (Jakarta: Java Sea Pelagic Fishery Assessment Project), 291–296.
Munasik, M., Adri, H., Wibowo, A. T. P., Kiswantoro, R., Fajariyanto, Y., and Sofyanto, H. (2011). “Kondisi Terumbu Karang Di Taman Nasional Perairan Laut Sawu Provinsi Nusa Tenggara Timur,” in Kupang: Workshop Sosialisasi Peraturan Gubernur tentang Pen gelolaan Terumbu Karang COREMAP II Provinsi NTT. Available online at: http://www.eafm-indonesia.net/public/files/penelitian/f3dea-Kondisi-Terumbu-Karang-di-Taman-Nasional-Perairan-Laut-Sawu-Provinsi-Nusa-Tenggara-Timur.pdf
Palomares, M. L. D., and Heymans, J. J. (2006). Historical Ecology of the Raja Ampat Archipelago, Papua Province, Indonesia. Fisheries Centre Research Reports 14(7), Fisheries Centre, University of British Columbia, Vancouver, BC, Canada, p. 64.
Partadireja, A., and Makaliwe, W. H. (1974). An economic survey of east nusatenggara. Bull. Indones. Econ. Stud. 10, 33–54. doi: 10.1080/00074917412331332399
Pascual-Fernández, J. J., and De la Cruz Modino, R. (2011). “Conflicting gears, contested territories: MPAs as a solution,” in World Small-Scale Fisheries Contemporary Visions, ed R. Chuenpagdee (Delft: Eburon), 205–220.
Pauly, D., and Zeller, D. (2014). Accurate catches and the sustainability of coral reef fisheries. Curr. Opin. Environ. Sustain. 7, 44–51. doi: 10.1016/j.cosust.2013.11.027
Piroddi, C., Gristina, M., Zylich, K., Greer, K., Ulman, A., Zeller, D., et al. (2015). Reconstruction of Italy's marine fisheries removals and fishing capacity, 1950–2010. Fish. Res. 172, 137–147. doi: 10.1016/j.fishres.2015.06.028
Ramenzoni, V. C. (2013). Endenese fisheries: exploratory findings on environmental perceptions, fish effort, and overfishing in eastern indonesia. Ethnobiol. Lett. 4, 39–51. doi: 10.14237/ebl.4.2013.8
Ramenzoni, V. C. (2015). “Is environmental uncertainty redefining fishing strategies? The use of the traditional lunar calendar to allocate fishing effort in Ende, Eastern Indonesia,” in Climate Change, Culture, and Economics: Anthropological Investigations, Vol. 35, Research in Economic Anthropology 35 (Emerald Group Publishing Limited), 177–211. doi: 10.1108/S0190-128120150000035008
Reinhard, I. (1997). “Food security, nutrition security, and poverty in central flores, Indonesia: situation after four years implementation of an Integrated Food Security Project (IFSP),” in Schriften Des Zentrums Fuer Regionale Entwicklungsforschung Der Justus-Liebig-Universitaet Giessen (Germany). 0170–1614, v. 69 (Muenster-Hamburg: LIT Verslag).
Reitz, E. J. (2004). Fishing down the Food Web': a case study from St. Augustine, Florida, USA. Am. Antiq. 69, 63–84. doi: 10.2307/4128348
Resosudarmo, B. P., and Jotzo, J. (2009). “Development, resources, and environment in Eastern Indonesia,” in Working with Nature against Poverty: Development, Resources and the Environment in Eastern Indonesia (Singapore: ISEAS).
Roch, J., Nurhakim, S., Widodo, J., and Poenormo, A. (eds.). (1995). Proceedings of Socioeconomics, Innovation and Management of the Java Sea Pelagic Fisheries (SOSEKIMA). Jakarta: Java Sea Pelagic Fishery Assessment Project. Available online at: http://horizon.documentation.ird.fr/exl-doc/pleins_textes/divers09-05/010017888.pdf
Roos, S. (1872). Bijdrage Tot de Kennis van Taal, Land En Volk Op Het Eiland Soemba, Vol. 36. 1 vols. Verhandelingen van het Bataviaasch Genootschap van Kunsten en Wetenschappen. Batavia: Bruining & Wijt.
Satria, A., and Matsuda, M. (2004). Decentralization of fisheries management in indonesia. Mar. Pol. 28, 437–450. doi: 10.1016/j.marpol.2003.11.001
Semedi, P. (2003). Close to the Stone, Far from the Throne: The Story of a Javanese Fishing Community, 1820–1990s. Indonesia: Benang Merah.
Silvestre, G., and Pauly, D. (1997). Management of tropical coastal fisheries in Asia: an overview of key challenges and opportunities. 8–25.
Stacey, N., Nurhakim, S., Nugroho, D., Soselisa, H., Resosudarmo, B., Kalis, O., et al. (2011). Socio-Economic Profile of the Arafura and Timor Seas. Report Prepared for the Arafura Timor Seas Ecosystem Action (ATSEA) Program, Jakarta.
Staples, D., Satia, B., and Gardiner, P. R. (2004). A Research Agenda for Small-Scale Fisheries. Bangkok: FAO, Regional Office for Asia and the Pacific.
Suchtelen, B. C. C. M. M., and Leroux, C. C. F. M. (1921). Endeh (Flores). Mededeelingen van Het Bureau Voor de Bestuurszaken Der Buitenbezittingen 26. Weltevreden: N.V. Uitgev.-Mij “Papyrus.”
Sunoko, R., and Huang, H.-W. (2014). Indonesia tuna fisheries development and future strategy. Mar. Pol. 43, 174–183. doi: 10.1016/j.marpol.2013.05.011
SUSENAS (1984). Survei Sosial Ekonomi Nasional. Biro Statistik Sosial dan Kependudukan, Badan Pusat Statistik, Jakarta, Indonesia.
Susilowati, I. (1996). “A review of natural resource laws and policies in Indonesia and its prospects for fisheries co-management,” in Research Project Working Paper 18 (Manila, PH: ICLARM). Available online at: http://pubs.iclarm.net/resource_centre/WF_168.pdf
Teh, L. S. L., Teh, L. C. L., and Sumaila, U. R. (2011). Quantifying the overlooked socio-economic contribution of small-scale fisheries in sabah, malaysia. Fish. Res. 110, 450–458. doi: 10.1016/j.fishres.2011.06.001
Teh, L. S. L., Zeller, D., Cabanban, A., Teh, L. C. L., and Sumaila, U. R. (2007). Seasonality and historic trends in the reef fisheries of pulau banggi, sabah, malaysia. Coral Reefs 26, 251–263. doi: 10.1007/s00338-006-0182-x
Tomascik, T., Mah, A., Nontji, A., and Moosa, M. K. (1997). The Ecology of the Indonesian Seas Part One. Tuttle Publishing.
Tucker, B. (2007). Perception of interannual covariation and strategies for risk reduction among mikea of madagascar. Hum. Nat. 18, 162–180. doi: 10.1007/s12110-007-9007-z
Tucker, B., Huff, A., Tombo, J., Hajasoa, P., and Nagnisaha, C. (2011). When the wealthy are poor: poverty explanations and local perspectives in southwestern madagascar. Am. Anthropol. 113, 291–305. doi: 10.1111/j.1548-1433.2011.01331.x
Tull, M. (2009). The History of Shark Fishing in Indonesia: A HMAP Asia Project Paper. Working Paper Number 158. Murdoch Business School and Asia Research Centre, Murdoch University, Perth, Australia.
U.S. Department of Commerce (1977). Indonesia: A Survey of U.S. Business Opportunities. Country Market Sectoral Survey. Washington, DC: Department of Commerce, Domestic and International Business Administration, Bureau of International Commerce. Available online at: http://hdl.handle.net/2027/uc1.32106006617952
Varkey, D. A., Ainsworth, C. H., Pitcher, T. J., Goram, Y., and Sumaila, R. (2010). Illegal, unreported and unregulated fisheries catch in raja ampat regency, eastern indonesia. Mar. Pol. 34, 228–236. doi: 10.1016/j.marpol.2009.06.009
Veth, P. J. (1855). “Het eiland timor,” in Timor en de Timoreezen, Tijdschrift Van Het Aardrijkskundig Genootschap, ed H. Zondervan (Leiden: Brill).
Weber, M. (1890). Ethnographische Notizen Uber Flores Und Celebes. Vol. Bd. III Supplement I. Internationales Archiv Fur Ethnographie. Leiden: Trap.
Widodo, J., Merta, I. G. S., and Wiadnyana, N. N. (eds.). (2004). Ekologi Dan Potensi Sumber Daya Perikanan Lembata, Nusa Tenggara Timur. Jakarta: Pusat Riset Perikanan Tangkap Badan Riset Kelautan dan Perikanan Departemen Kelautan dan Perikanan.
Wolf, E. R., and Eriksen, T. H. (2010). Europe and the People Without History. California, CA: University of California Press.
Wright, C., and Lewis, B. (2012). On the edge of crisis: contending perspectives on development, tourism, and community participation on rote island, indonesia. Aust. J. South East Asian Stud. 5:102. doi: 10.4232/10.ASEAS-5.1-6
Yamamoto, T. (1980). 1973 Fishery Census of Indonesia, Survey Methods, Mode of Analysis and Major Findings. A Report Prepared for the Fisheries Development and Management Project. Field Document 5 FI:DP/INS/72/064. FAO. Available online at: http://www.fao.org/3/a-n7662e/N7662E06.htm#ch6.1
Zeller, D., Booth, S., Davis, G., and Pauly, D. (2007). Re-Estimation of small-scale fishery catches for U.S. flag-associated island areas in the western Pacific: the last 50 years. Fish. Bull. 105, 266–277. Available online at: http://fishbull.noaa.gov/
Zeller, D., Booth, S., and Pauly, D. (2006). Fisheries contributions to the gross domestic product: underestimating small-scale fisheries in the Pacific. Mar. Resour. Econ. 21, 355–374. doi: 10.1086/mre.21.4.42629521
Keywords: small-scale fisheries, development, mechanization, environment, historical ecology, nutrition
Citation: Ramenzoni VC (2017) Reconstructing the History and the Effects of Mechanization in a Small-Scale Fishery of Flores, Eastern Indonesia (1917–2014). Front. Mar. Sci. 4:65. doi: 10.3389/fmars.2017.00065
Received: 10 May 2016; Accepted: 24 February 2017;
Published: 24 March 2017.
Edited by:
Maria Lourdes D. Palomares, FishBase Information and Research Group, PhilippinesReviewed by:
Sanja Matic-Skoko, Institute of Oceanography and Fisheries, CroatiaLouise Teh, University of British Columbia, Canada
Copyright © 2017 Ramenzoni. This is an open-access article distributed under the terms of the Creative Commons Attribution License (CC BY). The use, distribution or reproduction in other forums is permitted, provided the original author(s) or licensor are credited and that the original publication in this journal is cited, in accordance with accepted academic practice. No use, distribution or reproduction is permitted which does not comply with these terms.
*Correspondence: Victoria C. Ramenzoni, victoria.ramenzoni@tamucc.edu