Reef Habitat Type and Spatial Extent as Interacting Controls on Platform-Scale Carbonate Budgets
 Chris T. Perry
 Kyle M. Morgan
 Robert T. Yarlett
- Geography, College of Life and Environmental Sciences, University of Exeter, Exeter, United Kingdom
A coral reefs carbonate budget strongly influences reef structural complexity and net reef growth potential, and thus is increasingly recognized as a key “health” metric. Despite this, understanding of habitat specific budget states, how these scale across reef platforms, and our ability to quantify both framework and sediment production values remains limited. Here, we use in-situ census data from an atoll rim reef platform in the central Maldives to quantify rates of both reef framework and sediment production and loss within different platform habitats, and then combine these data with high-resolution habitat maps to quantify contributions to platform wide carbonate budgets. The net reef framework budget for the entire platform is extremely low (0.12 G, where G = Kg CaCO3 m−2 year−1), with a very high proportion (143,745 kg or 65.1%) of total framework production generated within the platform margin reef zones, despite these comprising only ~8% of platform area. Net platform-scale sediment budgets are higher (1.04 G), but most is produced in the reef and platform margin hardground habitats, of which ~80% derives from parrotfish bioerosion. Significant quantities of new sediment (up to ~1 G derived from the calcareous green algae Halimeda) are produced only in one habitat. All lagoonal habitats have negative or neutral net carbonate budgets. These data demonstrate the marked inter-habitat differences in reef carbonate budgets that occur across reef platforms, and the major dampening effect on overall platform scale budgets when rates are factored for habitat type and size. Furthermore, the data highlights the disproportionately important role that relatively small areas of reef habitat can have on the maintenance of net positive platform scale budgets. Because of the intrinsic link between carbonate production rates and reef-associated landform development and maintenance, these findings also have implications for understanding reef-associated landform stability. In this context the reef island at this site has been highly mobile over the last ~40 years, and we hypothesize that such instability may be being exacerbated by the measured low overall rates of framework and sediment generation.
Introduction
Coral cover loss, reef structural complexity declines, transitions in coral community composition, and declines in reef-associated species abundance, have been fundamental aspects of the on-going degradation of coral reefs globally (Hoey et al., 2016). These changes have had, and are continuing to have, profound impacts on many of the ecosystem goods and services that reefs provide to society (Pendleton et al., 2016). Of equally pressing concern however are the impacts that these ecological declines are now having on the processes of carbonate production and bioerosion on reefs (Perry et al., 2014a,b). These changes are especially important because they control the ability of reefs to both maintain, and add to, their framework structures, and which in turn influences their capacity to track rising sea levels (Perry et al., 2013b, 2015b; Saunders et al., 2016). Understanding the magnitude of reef carbonate budget changes, and how they have changed within and between reef-building regions has thus been a focus of considerable recent research interest. This has encompassed assessments of both reef framework carbonate production (Perry et al., 2014a; Pratchett et al., 2015) and bioerosion rates (Perry et al., 2014a; Weinstein et al., 2014), and considerations of how rates of both may respond to future climate change drivers (e.g., Fang et al., 2013; Barkley et al., 2015; DeCarlo et al., 2015; Januchowski-Hartley et al., 2017; Schönberg et al., 2017). In addition, there has been considerable effort aimed at improving the understanding of how net reef carbonate budget states vary between reefs and how they may respond to ecological change, these being based on either census (e.g., Stearn et al., 1977; Scoffin et al., 1980; Hubbard et al., 1990; Eakin, 1996; Mallela and Perry, 2007; Perry et al., 2012, 2013b) or hydrochemical (e.g., Smith and Kinsey, 1976; Gattuso et al., 1996; Andersson and Gledhill, 2013; Shaw et al., 2016) in-situ measurements. In some cases a combination of both methods have been applied (e.g., Courtney et al., 2016) and up-scaling, based on remotely sensed imagery, applied to derive reef-wide production rates (e.g., Andréfouët and Payri, 2001; Moses et al., 2009; Hamylton et al., 2013b). In a few cases this budget work has also been extended to considerations of future reef growth potential as a function of contemporary budget states (Perry et al., 2015b; Perry and Morgan, 2017), and to the modeling of carbonate budgets under future change scenarios (Alvarez-Filip et al., 2013; Kennedy et al., 2013). Finally, there has been some recent work aimed at using census-based approaches to quantify rates of reef-scale carbonate sediment generation, using habitat specific census-data to explore the linkages between reefs and adjacent reef islands (Perry et al., 2015a; Morgan and Kench, 2016a), and remotely sensed imagery to up-scale production rates for specific sediment producing taxa (e.g., Doo et al., 2017).
Whilst this body of research provides an improved understanding of both site specific and intra-regional scale carbonate budget states, and of the key biological agents of inorganic carbonate production and erosion on reefs, there has been a tendency in much of this work to focus only on assessments of the most highly productive reef and coral-dominated zones (see Yamano et al., 2000; Harney and Fletcher, 2003; Hart and Kench, 2007 for useful exceptions). There are, of course, many valid reasons for doing this, most especially in settings where reefs form semi-continuous linear, or circum-reef platform, structures, and thus play an especially critical role as wave protecting structures (Ferrario et al., 2014), and as key sites of sediment supply (Perry et al., 2015a). However, in many settings reef development can be far more discontinuous. Indeed, in the case of individual reef platforms or coastal shelf environments, the coral-dominated reefal habitats may actually comprise a relatively small proportion of the overall contemporary platform surface. Instead, complex mosaics of hardgrounds, sand- or rubble-dominated, and seagrass habitats can occupy a greater proportional area of the platform or shelf surface and, as earlier studies on reef carbonate production rates suggested, these lower productivity zones can result in significantly reduced reef-scale carbonate budgets (Smith and Kinsey, 1976; Buddemeier and Smith, 1988; Kinsey and Hopley, 1991). In order to improve our understanding of net inorganic carbonate cycling rates on reefs, to derive more accurate measures of platform scale carbonate budgets, and to better understand how carbonate budgets may influence the development and stability of proximal reef islands or beaches, requires as many of the following as possible to be factored for: (1) rates of both reef framework production and loss based on habitat specific ground-truthed data; (2) measures of sediment production and dissolution rates (see for example recent work by Cyronak et al., 2013; Eyre et al., 2014; Andersson, 2015 which demonstrates the budgetary relevance of the latter); and (3) to account for how both may vary between habitats and, where relevant, how rates may vary with energy (Hamylton et al., 2013a) or depth (Hustan, 1985). Quantifying both the framework and sediment carbonate components of reef budgets is especially desirable in a changing global environmental context, since it is realistic to assume that the processes driving the framework and sediment generation parts of budgets will respond in non-uniform ways to climate change and direct anthropogenic factors.
Here we explore these ideas in the context of an atoll rim reef platform in the central Maldives (Vavvaru, Lhaviyani Atoll), and demonstrate how habitat-specific census-based approaches, combined with remotely-sensed and ground-truthed habitat mapping, can be used to refine estimates of reef scale carbonate productivity. Specifically, we combine recently adapted census-based methodologies to provide quantitative estimates of: (1) net reef framework budgets, based on habitat specific measures of framework carbonate production and bioerosion; and (2) net reef sediment budgets, based on quantification of the sediment derived from both direct sources and from the bioerosional reworking of reef framework, and factored to account for off-reef sediment flushing and dissolution. We calculate both parts of this whole reef carbonate budget approach within each of eight delineated reef-lagoon habitats around Vavvaru, and factor for habitat extent in subsequent assessments of the total net reef carbonate budget (G, where G = kg CaCO3 m−2 year−1). We then use the resultant data to explore spatial (between-habitat) variations in both framework and sediment production and loss rates, and consider the implications for platform-scale budgets and for the reef-associated landforms that these platforms support.
Materials and Methods
Field Setting and Delineation of Geo-Ecological Zones
Vavvaru (N 5°25′5.0″; E 073°21′14.0″) is located along the western side of Lhaviyani Atoll, in the northern-central region of the Maldives (Figure 1A). Vavvaru comprises a shallow sub-tidal platform with a small (~300 × 150 m) island located within the south-eastern area of the platform (Figure 1B). The climate of the Maldives is defined by two monsoon periods marked by strong wind reversals, with southwest to northwest winds dominant from April to November (mean wind speed 5.0 ms−1), and northeast-east winds dominant from November to March (mean wind speed 4.8 ms−1) (Kench and Brander, 2006). The region is rarely affected by cyclones and so these seasonal process regime shifts are the main influences on cross- and off-reef platform sediment movement (Morgan and Kench, 2014). Our fieldwork was undertaken prior to the annual seasonal wind regime shift in February 2015. Prior to field census studies, and to provide the data necessary to inform our sampling strategy, we initially mapped the bathymetry and habitat zonation of the platform. Reef bathymetry (see Figure 1C) was estimated from multispectral Quickbird satellite imagery of Western Lhaviyani Atoll taken on 09/07/2008 (image provided by DigitalGlobe Foundation; http://www.digitalglobefoundation.org/) using the SPEAR Relative Water Depth tool in ENVI v 5.4 with bathymetry calibration data collected in the field (n = 146 point depths that were reduced to mean sea level). At the same time the major sub-, and inter-tidal geo-ecological zones around Vavvaru were assessed by swimming cross platform transects and with reference to available Google Earth imagery (using the 2006, 2008, and 2011 images). Based on this imagery and the spot site verifications we identified eight main sub-tidal habitats/zones (Figure 2A) defined by different benthic substrate characteristics (percentage cover of consolidated reef, coral rubble, sediment and hard pavement), and the continuity of reef development (Figures 2B–G; Table 1). To determine the area occupied by each of these distinctive habitats/zones (m2 and as a % of total platform area) we generated a habitat map (Figure 2A) in ERDAS IMAGINE 2015 using the same 2008 Quickbird imagery provided by DigitalGlobe Foundation. A subset of the image around Vavvaru Island was orthorectified and pan-sharpened prior to conducting a supervised maximum likelihood classification. Classes corresponding to each of the previously delineated habitat types were defined by creating a signature file using areas of known habitat type, with the same 146 ground truth points used to conduct an accuracy assessment of the classification (overall accuracy was 77.2% compared to these ground truth points). The classified image was imported into ArcMap, and the number of pixels assigned to each class (habitat) extracted. The number of pixels was multiplied by the sensor resolution (0.6 m in both x and y axes) to derive total habitat areas. To calculate island movement over time (see Figure 6), the position of the island shoreline (defined as the edge of island vegetation) was digitized from the 2008 satellite image and from an earlier 1969 aerial photograph. The 1969 aerial image was geo-referenced in ArcMap v.10.1 using hard/stable structures (e.g., beachrock, coral heads) visible on the reef as ground control points. The extent of shoreline movement (m) was calculated as the total horizontal change between the consecutive time-series and a rate of shoreline movement (m year−1) was estimated based on the total distance of change relative to the time interval between the images.
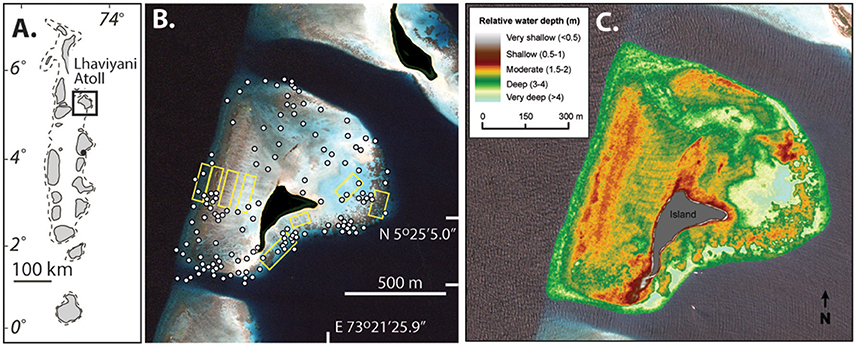
Figure 1. Location and bathymetry of Vavvaru, Lhaviyani Atoll. (A) Regional setting of Lhaviyani Atoll in the Maldives; (B) Atoll margin setting of Vavvaru (center of view) based on 2008 image supplied courtesy of DigitalGlobe Foundation (http://www.digitalglobefoundation.org/) and with water reflectance removed using ENVI image analysis software. White dots show position of ground control points used to quantify water depths and confirm geo-ecological zonation patterns. Yellow boxes show the location of the survey areas within central areas of each identified geo-ecological zone. (C) Platform surface bathymetry of Vavvaru based on ground truthing of remotely sensed imagery.
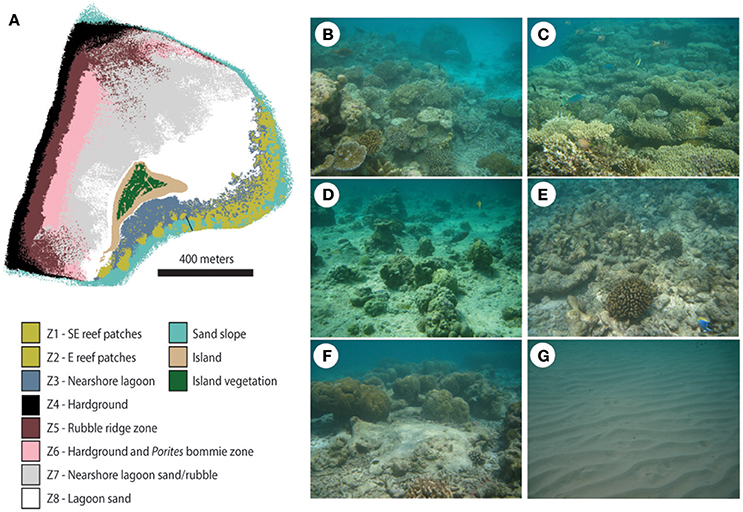
Figure 2. Platform habitats at Vavvaru, Lhaviyani Atoll. (A) Distribution of sub-tidal platform habitats based on ground-truthing of remotely sensed imagery. Note the delineation of two separate areas of reef (Zones 1 and 2) based on continuity of the reef structure, the boundary between which is marked by a black line toward the central-southern edge of map; (B) Zone 1, South-East reef patches; (C) Zone 2, Eastern reef patches; (D) Zone 4, Hardground on western platform margin; (E) Zone 5, Rubble ridge zone; (F) Zone 6, Hardground and Porites bommie zone; (G) Zone 8, Barren lagoon sands.
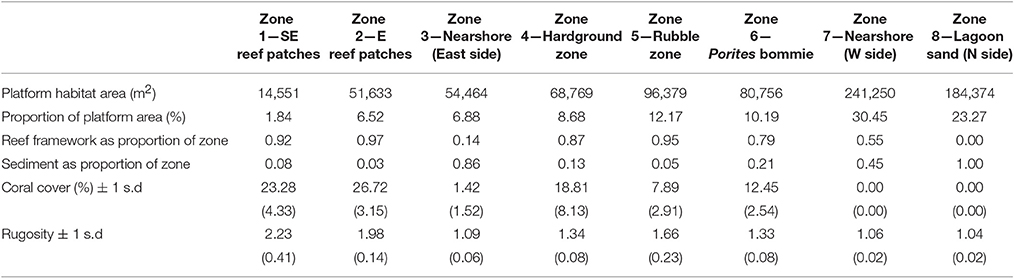
Table 1. Benthic characteristics of the eight delineated sub-tidal habitats at Vavvaru, Lhaviyani Atoll.
Quantifying Reef Framework Carbonate Production and Bioerosion
Benthic survey methodologies were used within each delineated reef platform habitat to determine: (1) general substrate characteristics (e.g., proportion of coral, sand and rubble cover, and substrate rugosity); (2) rates of reef framework carbonate production and bioerosion; and (3) carbonate sediment production. To quantify gross reef framework production and erosion and thus to determine net carbonate framework production rates (G, where G = kg CaCO3 m2 year−1) we used an adapted version of the ReefBudget methodology of Perry et al. (2012) that we have previously applied at other central Indian Ocean, including Maldivian reef sites (Perry et al., 2015a; Perry and Morgan, 2017). Within each habitat we established five 10 m transects. Using the line as a guide, we then measured the distance within each linear 1 m covered by each category of benthic cover. All overhangs, vertical surfaces and horizontal surfaces below the line were surveyed (i.e., if the guide line crossed over a table coral, the upper and lower surfaces of the coral, plus the benthos under the canopy, were recorded). The following groups were recorded: scleractinian corals to the genera and morphological level (e.g., Acropora branching, Porites massive etc.); crustose coralline algae (CCA) including CCA below macroalgal or soft coral cover; turf algae; fleshy macroalgae; non-encrusting calcareous algae (e.g., Halimeda spp., articulated coralline algae); sediment; bare substrate (e.g., limestone pavement); sediment; rubble; and other benthic organisms. Substrate rugosity was calculated as the total reef surface measured divided by linear distance. We then used the morphology and size of individual coral colonies in combination with genera specific skeletal density (g cm−3) and linear growth rates (cm year−1) across each transect to estimate carbonate production rates in kg CaCO3 m−2 year−1 (where m2 refers to the planar surface of the reef). These were based on mean regional growth rates and densities for each coral genera (see Perry and Morgan, 2017) for a summary of the rates used). These data were then combined with geometric transformations based on colony morphology to give a growth rate for each colony for the area under the transect line (taking a transect line width of 1 cm).
To determine rates of framework bioerosion by grazing invertebrates (parrotfish and urchins) we undertook two sets of measurements. To measure urchin bioerosion we surveyed urchin species abundance, the main agents of echinoid bioerosion on Indian Ocean reefs belong the family Diadematidae (Diadema spp., and Echinothrix spp.), and the genera Echinometra, Echinostrephus, and Eucidaris, and their test size within 1 m wide belt transects along the main benthic transect lines at each site. We then used published test size—erosion rate relationships for different Indo-Pacific urchin species to calculate the erosion rate (kg urchin−1 year−1) for each individual urchin as follows: Diadematidae = 0.000001x3.4192, Echinometra = 0.0004x1.9786, and for all others bioeroding urchins = 0.0001x2.323 (see Januchowski-Hartley et al., 2017). To calculate bioerosion by urchins in kg m−2 year−1, the erosion rates of all individual urchins within each transect can then be summed, and divided by the surface areas within each transect. To measure parrotfish erosion, we surveyed parrotfish numbers along eight replicate 30 m transects within each reef zone, with the numbers of parrotfish observed in the area 2 m either side of each transect recorded. Biomass of individual fish was then calculated using estimated length data and length-weight relationships and multiplied by abundance of the species or family of fish (see Perry et al., 2015b for details). To calculate parrotfish bioerosion rates by each individual fish we then used a model based on total length and life phase to predict the bite rates (bites h−1) based on published data for that species, or for similar sized species with the same feeding functional group.
To estimate rates of endolithic bioerosion we utilized published rates of total macro- and microbioerosion measured at Indo-Pacific sites, alongside a census of substrate available for bioerosion from the benthic transects. This comprises of all dead carbonate substrate available to bioeroding sponges, including that covered by macroalgae or algal turf (see Perry et al., 2015b for further details of calculations). We also factored for background off-reef export of sediment and framework from relevant platform margin habitats, using per unit area rates measured from similar platform margin habitats (Morgan and Kench, 2014). On this basis we used a framework rubble export rate of 0.02 kg m−2 year−1 within the two reef zones and for the platform margin hardground zone, and a sand export rate of 0.15 kg m−2 year−1 within the two reef zones, the nearshore (east side lagoon zone) and the lagoonal zone on the northern side as these are all areas where some off-reef sediment export is likely to occur.
Sediment Production and Loss
To quantify rates of carbonate sediment generation within each platform zone/habitat we took account of both the sediment generated as a by-product of framework bioerosion, as well as new sediment generated directly by reef associated and benthic taxa. In terms of sediment generated as a bioerosional by-product we assumed that all of the substrate grazed by parrotfish and urchins is then excreted as sediment—this assumption being based on the fact that there is no quantitative data showing dissolution of this material prior to excretion in either group. For macroendolithic (sponge) bioerosion we assumed that all of the material is converted to sediment, less a proportion that is dissolved during the chamber excavation process. Here we used a loss factor of 20% of the bioerosion rate as an average from all species where this has been reported (data in Nava and Carballo, 2008 and references therein). Microendolithic bioerosion is excluded in terms of sediment generation as the process is entirely chemical in nature and does not produce a sedimentary by-product.
Details of the methods used to measure direct sediment generation are provided in Perry et al. (2015a), but in brief we undertook a census of the following within an area 0.5 m × 0.5 m either side of each of 3 × 10 m survey transect lines: 1. The volume of each Halimeda spp. plant based on in situ measures of the height, and maximum and minimum widths of the plant, with a carbonate sediment production rate than being determined based on established plant volume: segment count relationships and turnover rates for the main species present (Halimeda micronesica and Halimeda macrophysa) as determined at other sites in the Maldives (Perry et al., 2016); 2. The number of individual plants of other calcifying green algae (e.g., Penicillus sp.)—none were observed at Vavvaru; 3. The number of individual plants of articulated red coralline algae (e.g., Amphiroa sp.)—none were observed at Vavvaru; and 4. The number of epifaunal gastropods—with a carbonate production rate per specimen estimated from the rate data in Bosence (1989). In addition, we undertook separate analyses to estimate production rates by benthic foraminifera, infaunal bivalves, and seagrass epiphytes. Benthic foraminifera production rates were estimated based on counts of test abundance in the sediments (n = 3 samples per reef zone) and then converted to a production rate based on the relationships in Langer et al. (1997). Based on that methodology we used a conversion ratio of 6 g m−2 year−1 for every percent of foraminiferal skeletal component determined from reef sediments within reef and rubble dominated areas, and 1.2 g m−2 year−1 for lagoonal and sediment dominated habitats. Rates per zone were then factored for proportional sediment cover. The abundance of infaunal molluscs was measured by collecting three bulk sediment samples (area ~10 × 10 cm, and to a depth of 10 cm where possible) at equidistant points along each transect and sieving these to isolate living specimens. No living bivalves were recovered. Our surveys were also designed to account for the density of seagrass, which can produce large amounts of epiphytic carbonate (Nelsen and Ginsburg, 1986; Perry and Beavington-Penney, 2005), although no seagrass was present at Vavvaru. In our calculations we also factored for the effects of post-depositional sediment dissolution, which has recently been shown to be a quantitatively significant process in terms of reef carbonate sediment budgets (Cyronak et al., 2013; Eyre et al., 2014; Andersson, 2015). To this end we applied a rate of 0.15 kg CaCO3 m−2 year−1 of sediment dissolution occurring within each zone (based on data in Cyronak et al., 2013) and factored this to account for the proportional cover of sediment per m−2 in each zone.
Results
Framework Carbonate Budgets
Habitat scale net reef framework budgets (the balance between carbonate production and biological erosion) vary markedly between habitats around Vavvaru (range: 2.71 to −0.99 G; Figure 3A). Highest net rates (2.05 and 2.71 G, respectively; Figure 3A, Table 2) were measured in the two platform margin reef zones, zones defined by high rates of substrate bioerosion (4.06 and 4.85 G; Figure 3A; Table 2), but even higher rates of carbonate production (6.77 and 6.90 G, respectively; Figure 3A; Table 2). Corals are the dominant drivers of the high gross carbonate production rates measured, contributing 94.9 and 94.6%, respectively to calculated carbonate production in each reef zone. The most abundant coral genera in these reef habitats are branching and corymbose morphology Acropora spp., branching Pocillopora spp., and massive Porites sp., and these genera collectively accounted for 62 and 80% of the coral cover in each reef zone. They also contribute to between 80 and 88% of calculated coral carbonate production in the two reef habitats, with massive Porites sp. dominating production (46%) in reef habitat Z1 (SE reef patches), and branching and corymbose morphology Acropora spp. dominating production (86%) in reef habitat Z2 (Eastern reef patches).
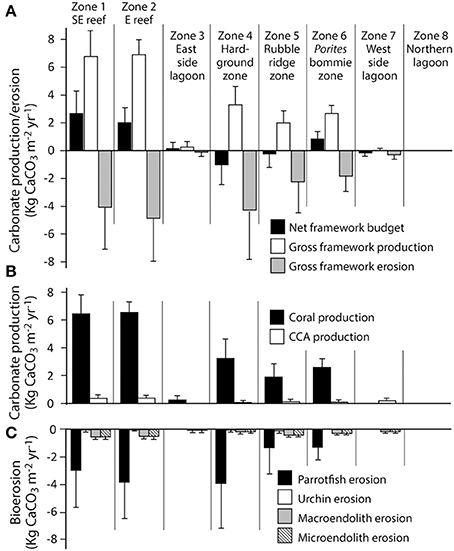
Figure 3. Habitat-specific rates of framework carbonate production and erosion at Vavvaru, Lhaviyani Atoll. (A) Framework carbonate production and erosion and the net framework carbonate budget (kg CaCO3 m−2 year−2 ± 1 s.d); (B) Contributions from corals and coralline algae to gross framework carbonate production (kg CaCO3 m−2 year−2 ± 1 s.d); (C) Contributions from parrotfish, urchins and macro- and microendolithic borers to framework bioerosion (kg CaCO3 m−2 year−2 ± 1 s.d).
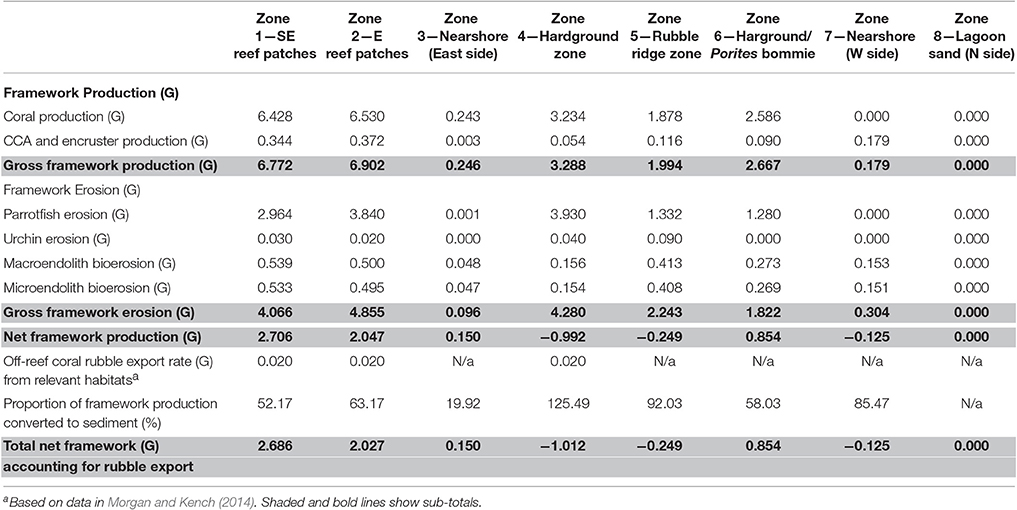
Table 2. Summary of key budget metrics associated with reef framework production and bioerosion, in each of the eight delineated sub-tidal habitats at Vavvaru, Lhaviyani Atoll.
In contrast, very low or net negative framework budgets (range: 0.85 to −0.99 G) define the lagoon and the western margin hardground and rubble-dominated habitats (Figure 3A, Table 2). In some cases, such as the sand-dominated lagoon habitats, this reflects the fact that there is little or no coral cover, but in other cases (e.g., the hardground and rubble zones on the western side of the platform) these net negative framework budgets are a function of higher (relative to gross production) rates of bioerosion (Figures 3B,C; Table 2). Calculated framework bioerosion rates range from 4.85 to 0.30 G across all habitats (Table 2). The highest rates (4.85 to 4.06 G) were measured in the reef and hardground habitats (Figure 3C; Table 2), and across all habitats around Vavvaru parrotfish were responsible for between 60 and 90% of this calculated framework bioerosion, the exceptions being within the sediment-dominated nearshore and lagoonal habitat zones where overall rates of bioerosion were in any case very low (<0.5 G; Table 2). Urchins, and macro- and micro-endolithic borers make relatively small contributions to total bioerosion rates within any of the habitats (Figure 3C).
Carbonate Sediment Budgets
Rates of calculated gross sediment production also differ markedly between habitats around Vavvaru, ranging from 5.18 to 0.00 G (Figure 4; Table 3). Highest rates were calculated with the reef habitats Z1 and Z2 (zones supporting extensive reef framework), and within the hardground habitat (3.46, 5.18, and 4.09 G, respectively; Figure 4; Table 3). Very substantial proportions of these values derive from the sediment generated from the bioerosional activities of parrotfish which excrete large amounts of carbonate sand as a by-product of substrate grazing (Bellwood, 1996). Rates of 3.42, 4.26, and 4.09 G, respectively, were calculated within each of these habitats (Table 3), and accounted for >70% of total estimated sediment generation (Table 3). Lower sediment generation rates (1.75 and 1.51 G) were calculated for the rubble ridge habitat (Z5) and the hardground/Porites sp. bommie habitat (Z6), although again most of this (between 75 and 85%) derives from parrotfish framework erosion (Table 3). Substantially lower rates of sediment production (<0.2 G) were calculated within each of the sediment-dominated lagoonal habitats (Zones 3, 7, and 8). Very little new sediment is produced by bivalves and gastropods (which were rare in our surveys), or by benthic foraminifera, which do not constitute more than 3% of the sedimentary constituents in any habitat. Halimeda is identified as the only other important sediment producer, although was only observed in four habitats (the two reef habitats, the rubble zone and the Porites bommie zone) and calculated production rates are only of budgetary relevance with reef habitat 2 (0.92 G; Table 3). Thus, it is reasonable to state that most of the sediment being generated on the Vavvaru platform as a whole is derived from the reworking (mainly by parrotfish bioerosion) of reef framework and other hard carbonate substrate.
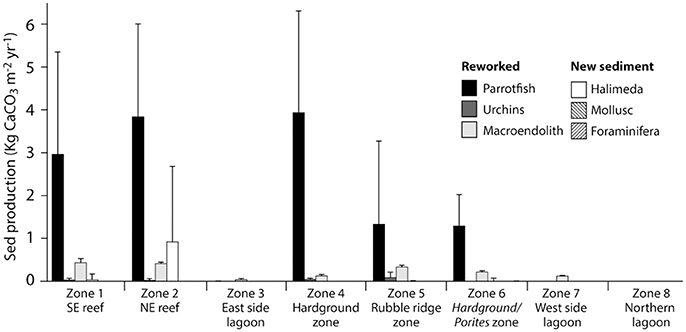
Figure 4. Habitat-specific rates of carbonate sediment production at Vavvaru, Lhaviyani Atoll. Contributions to sediment production (Kg CaCO3 m−2 year−2 ± 1 s.d) within each of the eight delineated habitats around Vavvaru.
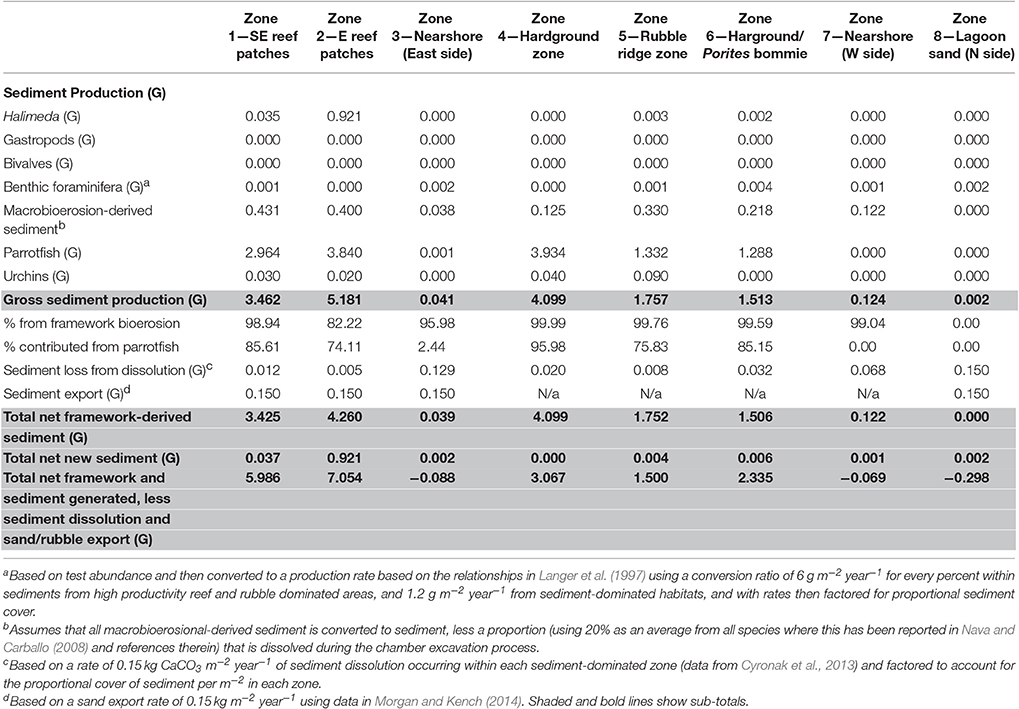
Table 3. Summary of key budget metrics associated with sediment production and loss, in each of the eight delineated sub-tidal habitats at Vavvaru, Lhaviyani Atoll.
Discussion
The carbonate budget of a coral reef strongly influences the development and maintenance of its structural complexity, which is a key control on ecosystem service provisioning, and its long term net growth potential (Kinsey and Hopley, 1991; Perry et al., 2008). In this context, the early pioneering work undertaken on reef carbonate budgets reported that very high rates (in the range 10–12 G) of gross carbonate production may define those shallow water reefs having high branching coral cover (Smith and Kinsey, 1976; Kinsey, 1981; Kinsey and Hopley, 1991), and that this may equate to potential vertical growth rates of around 7 mm year−1 (Kinsey and Hopley, 1991). Lower, but still significant rates (around 4 G) were reported to define reef flat habitats, whilst rates of around 0.5 G were reported for sand and rubble dominated reef habitats (Smith and Kinsey, 1976; Kinsey and Hopley, 1991).
Most of these early calculations were underpinned by novel hydrochemical based methodologies and these significantly advanced our capacities to start quantifying the carbonate budgets of different reef types. Indeed, the above, and other reported rates (e.g., Chave et al., 1972), were used as the basis for making some of the first spatial scale assessments of reef-wide carbonate production, both for a range of idealized reef system types (e.g., for the different reef types that define the Great Barrier Reef; Kinsey and Hopley, 1991), and for a range of reef geomorphic types (i.e., atoll, barrier, fringing; Chave et al., 1972). Subsequent reviews of reef carbonate production rates helped further define the optimal rates associated with different coral biogeographic provinces, and the different production rates that define different depth zones within each of these provinces (Vecsei, 2001). This collective body of data has thus provided a framework to support local scale reef production rate estimates (Smith and Kinsey, 1976), to contribute to global scale assessments (Milliman and Droxler, 1995), and more recently to support revised reef- and regional-scale estimates of reef carbonate production based on improved spatial mapping techniques (e.g., Hamylton et al., 2013b; Leon and Woodroffe, 2013).
Such metrics have growing relevance, however, because of the profound changes that are now impacting coral reefs globally, caused both by direct anthropogenic disturbances and by climate change drivers (especially temperature-induced coral bleaching events), and both of which may radically alter reef carbonate budget states (Eakin, 1996; Edinger et al., 2000; Perry and Morgan, 2017). As a result, there has been a growing interest in using reef budgets as a reef health indicator (e.g., Perry et al., 2008; Mace et al., 2014). This has merit because of the underpinning role that carbonate budgets play in controlling many physical functional aspects of reefs, including their growth potential, their role as generators of coastal sediment, and their role in supporting many economically important reef-associated species. However, to more usefully utilize budget datasets in support of these issues, and to be able to more successfully monitor how contemporary budget states vary both between reefs and between different reef habitats, requires a number of advances to be made. We need to be able to more fully quantify whole reef-scale carbonate budgets that account for the different drivers of both framework and sediment production. We need to be able to better predict how these rates may change as different drivers of carbonate production and erosion change over time (e.g., Kennedy et al., 2013), and we need to better understand how reef-scale rates may vary as a function of the types and extent of different reef habitats.
Here, we have outlined an approach to mapping reef-scale carbonate budgets that allows us to factor for estimates of both framework and sediment production and erosion, to identify the different drivers of both, and to assess these processes within different habitat types whose spatial extent has been constrained by a combination of satellite image analysis and ground truthing. Based on the application of this approach at Vavvaru in the Maldives we calculate that the overall platform budget averages 1.15 G. At this site, this results from very small areas of high productivity reef, but much larger areas that are defined either by net negative budgets, or by very low net positive budgets. Highest rates of framework carbonate production occur, not surprisingly, in the two reef habitats, and in the two other habitats where corals are relatively abundant (the shelf-edge hardground habitat and the Porites bommie zone; Tables 2–4), whilst bioerosion-derived sediment production in these same zones is also responsible for a very high proportion of the sediment generation we calculate. Low rates of framework carbonate production and bioerosion, but also of new sediment generation, define the sand-dominated lagoon habitats around Vavvaru (Tables 2–4). Although, not quantified it must thus be assumed that these sand-dominated lagoon zones represent “sinks” for a high proportion of the sediment (new or reworked) that is produced in the more productive reef habitats (e.g., Purdy and Gischler, 2005; Schlager and Purkis, 2013). However, in terms of constructing habitat specific platform scale budgets, rates of framework and sediment export and loss also need to be taken into account. Such rates are not simplistic to measure in situ and so, as outlined in the methods, we have utilized published data on rates of framework rubble export and sediment export from other sites in the Maldives, and also factored a generic literature-derived sediment dissolution rate in our calculations, and then applied these to appropriate habitats around Vavvaru (see Tables 2–3).
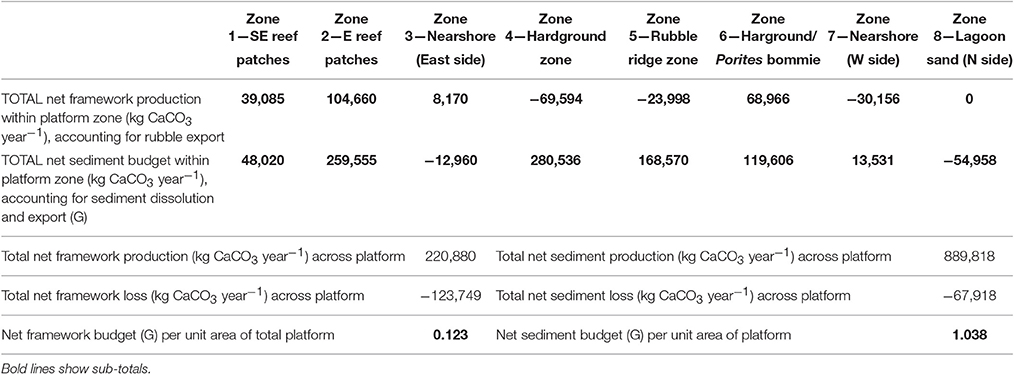
Table 4. Summary of key budget metrics associated with reef framework and sediment budgets (based on data from Tables 2, 3) scaled to account for habitat spatial extent (see Table 1), in each of the eight delineated sub-tidal habitats at Vavvaru, Lhaviyani Atoll.
The net effect of these calculations i.e., accounting for net framework and sediment generation, less sediment dissolution and sand/rubble export as appropriate, is to exacerbate patterns of inter-habitat heterogeneity. Resultant net total carbonate budgets range from 5.99 and 7.05 G within the two reef habitats, to −0.07 to −0.29 G within the sand-dominated nearshore and lagoonal habitats (Figure 5C). Rates thus differ by more than one order of magnitude between habitats. The implications for the wider platform system are, however, much more profound when account is made of the spatial extent of the different habitats. Most noticeable is that the two habitats with the highest framework, sediment and overall net budgets (reef habitats 1 and 2; Figures 5A–C) and which thus drive most of the carbonate production on the platform actually occupy the smallest proportion of the reef platform (1.84 and 6.52%, respectively; Tables 2–4). Conversely, the habitats that occupy the largest spatial areas, the western nearshore habitat (Zone 7; 30.4% of platform area) and the large lagoonal area on the northern side of the platform (Zone 8; 23.3% of platform area) have amongst the lowest net budget rates (both being net negative; −0.07 and −0.29 G, respectively; Figure 5C, Tables 2–4). If these individual habitat rates for framework and sediment production are then multiplied by the total habitat area and summed they generate estimates of the respective total rates of framework and sediment production and loss for the entire platform. On this basis we calculate that 220,880 kg of framework CaCO3 year−1 is produced across the entire platform, against a framework breakdown and export figure of 123,749 kg CaCO3 year−1. This equates to a net platform scale reef framework budget of only 0.12 G (Table 4). Sediment production is calculated to total 889,818 kg CaCO3 year−1, and sediment dissolution and export 67,918 kg CaCO3 year−1. This equates to a net platform scale budget of 1.04 G, and thus a combined whole platform net carbonate budget of only 1.15 G (Table 4).
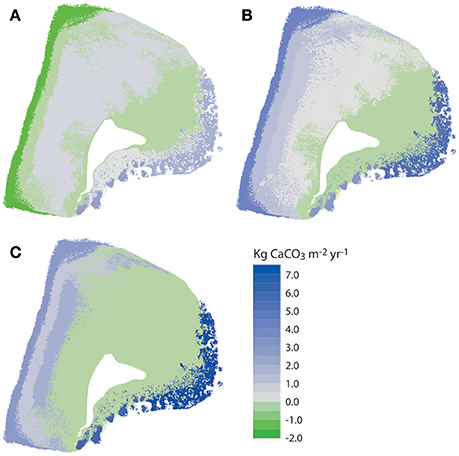
Figure 5. Spatial variations in carbonate framework and sediment budgets at Vavvaru, Lhaviyani Atoll. (A) Net framework carbonate budget accounting for rubble export; (B) Net carbonate sediment budget accounting for sediment export and dissolution; (C) Net overall framework and sediment budgets. Data derived from calculations in Tables 2–4.
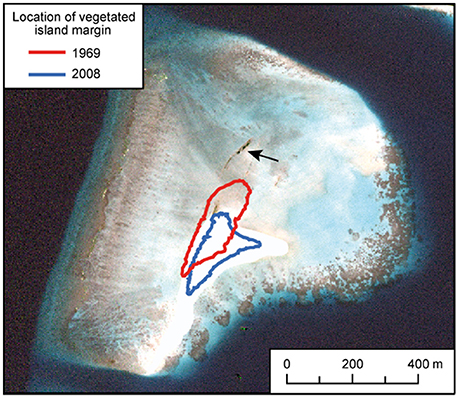
Figure 6. Changes in island shoreline position at Vavvaru 1969–2008. Positions of vegetated island margins of Vavvaru island in 1969 and 2008 based on aerial and satellite image analysis, and overlain on a 2008 image supplied courtesy of the DigitalGlobe Foundation (http://www.digitalglobefoundation.org/). The arrow shows the location of outcropping beachrock which suggests an earlier (but undated) position of the island to the north of its present location.
As evident from these figures, and an implication of the classic early carbonate budget studies outlined above, is that a focus on only the high productivity, high coral cover reef zones on reefs will thus generate much higher budget estimates than are representative of most reef systems as a whole. Indeed, our data suggests that there can be close to an order of magnitude difference between the budgets of the platform margin reef habitats and the much lower budgets that define the overall reef system, a distinction that is again in line with the ideas presented in many of the early studies which compared reef, reef flat and lagoon habitat rates (see Kinsey, 1981; Kinsey and Hopley, 1991). However, upscaling habitat specific rates in the past often proved problematic due to field mapping constraints, but advances in satellite image resolution (such as utilized here) are making such assessments increasingly accurate (e.g., Andréfouët and Payri, 2001; Moses et al., 2009; Hamylton et al., 2013b). Such data can thus be combined with appropriate field-derived budget estimates to develop not only much improved estimates of reef-scale carbonate production, but also key insights into the most quantitatively significant species that drive the resultant patterns. This, in turn, has the potential to feed into modeling efforts aimed at understanding the implications of different species transitions, caused by environmental change, on reef carbonate production and erosion rates (see Perry et al., 2011 for conceptual models of such changes). Such approaches have recently been applied to project reef framework budget transitions for a hypothetical Caribbean reef under different climate change and management intervention scenarios (Kennedy et al., 2013), but increasingly there is the potential to undertake similar work for the wider carbonate producing system.
At Vavvaru the high coral carbonate production rates measured within the reefal zones along the platform margin were driven by high branching Acropora spp. cover, whilst parrotfish were identified as the major framework bioeroders and thus as major generators of carbonate sand. Parrotfish are well known to produce very large quantities of sediment as a by-product of their substrate grazing (Morgan and Kench, 2016b), and indeed have been identified as the major sand generators in atoll interior faro settings elsewhere in the Maldives (Perry et al., 2015a). Maintenance of both thriving shallow water coral communities, even when occupying a relatively small area of the wider reef system, and of the associated parrotfish populations, are thus critical to maintaining the framework and sediment budgets of this system in net positive states.
A key issue that arises from the above observations are the impacts of the overall platform-scale carbonate budget on the stability, or lack thereof, of platform top reef islands. The formation and maintenance of these islands depends on there being a net positive supply of sediment from the generation sites to the nodal points of island formation (Gourlay, 1988; Mandlier and Kench, 2012). Given that the overall sediment budget at Vavvaru was calculated to be low (only 1.03 G), and thus that our best estimates suggest that only a little more sediment is produced overall within the platform than is lost, it would seem likely that the platform island sediment system at this site probably already exists close to a budget related stability threshold. In this context it is especially significant to note that Vavvaru Island has been highly mobile on its platform surface over the last ~45 years, the island shoreline migrating 129 m between 1969 and 2008 (a mean rate of 3.3 m year−1). Whilst other factors, such as island size (e.g., Perry et al., 2013a) may contribute to this high mobility state, it is reasonable to hypothesize that the low rates of sediment supply as suggested by the current sediment budget study of the platform may be limiting island expansion and reducing the potential for the island position to stabilize.
Such issues become increasingly significant in the context of on-going reef degradation which can drive both progressive (Edinger et al., 2000) and rapid declines (Eakin, 1996) in reef carbonate budgets. Of immediate and pressing concern in a Maldivian context are the impacts of the major bleaching of mid-2016 caused by the very strong El Niño conditions. At sites in the southern Maldives recent work has reported on the very major declines in coral carbonate production rates and the widespread transition to net negative budget states that occurred at those sites (Perry and Morgan, 2017). Assuming similar transitions have occurred at Vavvaru, and reports from mid-2016 do indicate that bleaching of a similar magnitude was widespread across the Maldives (IUCN, 2016), it is entirely reasonable to hypothesize that carbonate production rates at Vavvaru will also have declined markedly since our work was undertaken in 2015. This would be especially significant because, as outlined above, these narrow coral-dominated zones make a disproportionally important contribution to maintaining the budget of the wider platform in an albeit low, but still net positive, budget state. Indeed, if similar bleaching-driven transitions have occurred at Vavvaru it is realistic to assume that the budget of the overall reef platform may now have become net negative.
Assuming the reef carbonate budget at Vavvaru has followed similar trajectories to sites in the southern Maldives (Perry and Morgan, 2017), there may thus be a number of implications for the island both positive and negative, and that will influence future island stability over different timescales. An initial major impact, would be for a likely overall transition in the framework budget to a net negative state. This may have only a minor impact on the stability of the island itself in the short-term, but if low coral cover states persist then the growth potential of the reef areas will be diminished, limiting any wave protecting functions that these discrete areas of reef provide. At bleaching impacted sites in the southern Maldives, however, an additional consequence of coral die-off was an initial marked increase in parrotfish bioerosion (Perry and Morgan, 2017). If this has been repeated at Vavvaru the short-term budget impacts may actually be a spike in the generation of parrotfish derived sediment, which as the major sand producer on these reefs may result in a short-term additional pulse of sediment to the island. However, long-term persistence of low coral cover states combined with progressive bioerosion pressure would act to progressively reduce the structural complexity of the reefs, and which provides essential shelter and food availability (e.g., van Rooij et al., 1996). Thus, any short-term enhancement of the sediment budget may be offset by a progressive reduction in parrotfish biomass. Thus, one can hypothesize that future benthic community transitions that impact upon different aspects of carbonate production and erosion, may have rather profound implications for the stability of reef-associated landforms at this, and other similar, sites. Quantifying and mapping the rates and sources of carbonate production and erosion at reef-wide scales thus provides us with tools to consider these landform stability issues in the context of overall budget states and of habitat diversity and extent.
Conclusions
Early studies of reef carbonate budgets provided not only novel estimates of reef production rates, but also made the critical point that large areas of most reef complexes i.e., encompassing reef flats and lagoon areas, are likely to have much lower carbonate production rates. It was thus suggested that overall reef-wide carbonate budgets are likely to be much lower, perhaps averaging only round 1.5 G. In other words the average reef system might have an approximately one order of magnitude lower production rate overall compared to that measured in the most productive (shallow, coral-dominated) zones. Our findings support this idea but extend this knowledge by developing an approach that allows us to better quantify which carbonate producing and eroding taxa drive these patterns across reef complexes, and how rates of both reef framework and carbonate sediment production and loss vary between habitats. This is an approach that has value for supporting efforts to up-scale estimates of inorganic carbonate production and cycling to reef-wide and, indeed, regional scales, and as outlined above is an issue with relevance beyond simply calculating reef-wide carbonate budget metrics. These processes of carbonate production, cycling, and loss are likely to have implications for the development and stability of proximal reef-associated landforms, including beaches and, in this example, reef islands. The approach we outline thus has potential to allow us to better explore the complex nature of geo-ecological linkages in reef systems and along reef-fronted coastlines, and to consider the budgetary implications on the form and development of reef-associated landforms. Such approaches are of course only as good as the empirical data that drive the production and erosion estimates, and whilst these are improving for many key aspects of framework and sediment production, there is a pressing need for additional data on coral calcification rates from many regions and for improved approaches to calculating sediment generation rates (see Perry et al., 2016 for such approaches in the content of the carbonate producing algae Halimeda). However, especially poorly constrained at present are data on rates of framework breakdown and export from reefs, and of sediment losses, both physical and geochemical. As recent studies have shown (Cyronak et al., 2013; Eyre et al., 2014; Morgan and Kench, 2014; Andersson, 2015) both areas are likely to be of significant budgetary relevance and urgently deserve additional attention. These data constraints aside, the current study highlights the marked differences that can exist in terms of total framework and sediment production between habitats, and the major dampening effect on the net carbonate budget at the platform scale when rates are scaled to account for habitat type and size. The net impact is that whilst individual reef systems may exhibit discrete areas of high coral cover and high associated carbonate production, platform scale budgets can be significantly lower, to the extent that any loss of coral cover and associated reductions in grazer-driven bioerosion in the main reef zones would be sufficient to tip the overall platform budget into a net negative state, with consequent implications for platform top island stability.
Author Contributions
CP conceived the research. CP, KM, and RY contributed to field data collection and analysis, and to the writing of the paper.
Conflict of Interest Statement
The authors declare that the research was conducted in the absence of any commercial or financial relationships that could be construed as a potential conflict of interest.
Acknowledgments
Research was supported by a Leverhulme Trust Research Fellowship (RF-2015-152) to CP, by Natural Environment Research Council grant NE/K003143/1 to CP, and by a Natural Environment Research Council Studentship (NE/L002434/1) to RY. We thank the DigitalGlobe Foundation for providing and giving permission to use satellite imagery for Figures 1B,C, 6.
References
Alvarez-Filip, L., Carricart-Ganivet, J. P., Horta-Puga, G., and Iglesias-Prieto, R. (2013). Shifts in coral-assemblage composition do not ensure persistence of reef functionality. Sci. Reports 3:3486. doi: 10.1038/srep03486
Andersson, A. (2015). A fundamental paradigm for coral reef carbonate sediment dissolution. Front. Mar. Sci. 2:52. doi: 10.3389/fmars.2015.00052
Andersson, A. J., and Gledhill, D. (2013). Ocean acidification and coral reefs: effects on breakdown, dissolution, and net ecosystem calcification. Ann. Rev. Mar. Sci. 5, 321–348. doi: 10.1146/annurev-marine-121211-172241
Andréfouët, S., and Payri, C. (2001). Scaling-up carbon and carbonate metabolism in coral reefs using in situ and remote sensing data. Coral Reefs 19, 259–269. doi: 10.1007/s003380000117
Barkley, H. C., Cohen, A. L., Golbuu, Y., Starczak, V. R., DeCarlo, T. M., and Shamberger, K. E. F. (2015). Changes in coral reef communities across a natural gradient in seawater pH. Sci. Adv. 1:e1500328. doi: 10.1126/sciadv.1500328
Bellwood, D. R. (1996). Production and reworking of sediment by parrotfishes (family Scaridae) on the Great Barrier Reef, Australia. Mar. Biol. 125, 795–800.
Buddemeier, R. W., and Smith, S. V. (1988). Coral reef growth in an era of rapidly rising sea level: predictions and suggestions for long-term research. Coral Reefs 7, 51–56. doi: 10.1007/BF00301982
Chave, K. E., Smith, S. V., and Roy, K. J. (1972). Carbonate production by coral reefs. Mar. Geol. 12, 123–140. doi: 10.1016/0025-3227(72)90024-2
Courtney, T. A., Andersson, A. J., Bates, N. R., Collins, A., Cyronak, T., de Putron, S. J., et al. (2016). Comparing Chemistry and Census-Based Estimates of Net Ecosystem Calcification on a Rim Reef in Bermuda. Front. Mar. Sci. 3:181. doi: 10.3389/fmars.2016.00181
Cyronak, T., Santos, I. R., and Eyre, B. D. (2013). Permeable coral reef sediment dissolution driven by elevated pCO2 and pore water advection. Geophys. Res. Lett. 40, 4876–4881. doi: 10.1002/grl.50948
DeCarlo, T. M., Cohen, A. L., Barkley, H. C., Cobban, Q., Young, C., Shamberger, K. E., et al. (2015). Coral macrobioerosion is accelerated by ocean acidification and nutrients. Geology 43, 7–10 doi: 10.1130/G36147.1
Doo, S., Hamylton, S. M., Byrne, M., and Finfer, J. (2017). Spatial and temporal variation in reef-scale carbonate storage of large benthic foraminifera: a case study on One Tree Reef. Coral Reefs 36, 293–303. doi: 10.1007/s00338-016-1506-0
Eakin, C. (1996). Where have all the carbonates gone? A model comparison of calcium carbonate budgets before and after the 1982-1983 El Nino at Uva Island in the eastern Pacific. Coral Reefs 15, 109–119.
Edinger, E. N., Limmon, G. V., Jompa, J., Widjatmoko, W., Heikoop, J. M., and Risk, M. J. (2000). Normal coral growth rates on dying reefs: are coral growth rates good indicators of reef health? Mar. Poll. Bull. 40, 606–617. doi: 10.1016/S0025-326X(99)00237-4
Eyre, B. D., Andersson, A. J., and Cyronak, T. (2014). Benthic coral reef calcium carbonate dissolution in an acidifying ocean. Nat. Clim. Change 4, 969–976. doi: 10.1038/nclimate2380
Fang, J. H. K., Mello-Athayde, M. A., Schoenberg, C. H. L., Kline, D. I., Hoegh-Guldberg, O., and Dove, S. (2013). Sponge biomass and bioerosion rates increase under ocean warming and acidification. Glob. Change Biol. 19, 3581–3591. doi: 10.1111/gcb.12334
Ferrario, F., Beck, M. W., Storlazzi, C. D., Micheli, F., Shepard, C. C., and Airoldi, L. (2014). The effectiveness of coral reefs for coastal hazard risk reduction and adaptation. Nat. Comms. 5:3794. doi: 10.1038/ncomms4794
Gattuso, J. P., Pichon, M., Delesalle, B., Canon, C., and Frankignoulle, M. (1996). Carbon fluxes in coral reefs.I. Lagrangian measurement of community metabolism and resulting air-sea CO2 disequilibrium. Mar. Ecol. Prog. Ser. 145, 109–121. doi: 10.3354/meps145109
Gourlay, M. R. (1988). “Coral cays: products of wave action and geological processes in a biogenic environment,” in Proceedings of the 6th International Coral Reef Symposium, Vol. 2 (Townsville, QLD), 491–496.
Hamylton, S., Pescud, A., Leon, J. X., and Callaghan, D. P. (2013a). A Geospatial assessment of the relationship between reef flat community calcium carbonate production and wave energy. Coral Reefs 32, 1025–1039. doi: 10.1007/s00338-013-1074-5
Hamylton, S., Silverman, J., and Shaw, E. (2013b). The use of remote sensing to scale up measures of carbonate production on reef systems: a comparison of hydrochemical and census-based estimation methods. Int J. Remote Sensing 34, 6451–6465. doi: 10.1080/01431161.2013.800654
Harney, J. N., and Fletcher, C. H. III (2003). A budget of carbonate framework and sediment production, Kailua Bay, Oahu, Hawaii. J. Sediment. Res. 73, 856–868. doi: 10.1306/051503730856
Hart, D. E., and Kench, P. S. (2007). Carbonate production of an emergent reef platform, Warraber Island, Torres Strait, Australia. Coral Reefs 26, 53–68. doi: 10.1007/s00338-006-0168-8
Hoey, A. S., Howells, E., Johansen, J. L., Hobbs, J.-P. A., Messmer, V., McCowan, D. M., et al. (2016). Recent advances in understanding the effects of climate change on coral reefs. Diversity 8:12. doi: 10.3390/d8020012
Hubbard, D. K., Miller, A. I., and Scaturo, D. (1990). Production and cycling of calcium carbonate in a shelf-edge reef system (St.Croix, U.S. Virgin Islands): applications to the nature of reef systems in the fossil record. J. Sediment. Res. 60, 335–360. doi: 10.1306/212F9197-2B24-11D7-8648000102C1865D
Hustan, M. (1985). Variation in coral growth rates with depth at Discovery Bay, Jamaica. Coral Reefs 4, 19–25.
IUCN (2016). Maldives Coral Reefs under Stress from Climate Change: Research Survey Reveals Over 60% of Corals Bleached. Available online at: https://www.iucn.org/news/maldives-coral-reefs-under-stress-climate-change-research-survey-reveals-over-60-corals. International Union for Conservation of Nature (Accessed on: 01-09-16)
Januchowski-Hartley, F. A., Graham, N. A. J., Wilson, S. K., Jennings, S., and Perry, C. T. (2017). Predicting divergent reef carbonate budget trajectories following a major climatic disturbance event. Proc. R. Soc. B 284:20162533. doi: 10.1098/rspb.2016.2533
Kench, P. S., and Brander, R. W. (2006). Response of reef island shorelines to seasonal climate oscillations: South Maalhosmadulu atoll, Maldives. J. Geophys. Res. 111:F01001. doi: 10.1029/2005JF000323
Kennedy, E. V., Perry, C. T., Halloran, P. R., Fine, M., Carricart-Ganivet, J. P., Iglesias-Prieto, R., et al. (2013). Avoiding coral reef functional collapse requires combined local and global action. Curr. Biol. 23, 912–918. doi: 10.1016/j.cub.2013.04.020
Kinsey, D. W. (1981). “The Pacific/Atlantic reef growth controversy,” in Proceedings of the 4th International Coral Reef Symposium, Vol. 1 (Manila), 493–498.
Kinsey, D. W., and Hopley, D. (1991). The significance of coral reefs as global carbon sink-response to greenhouse. Palaeogeog. Palaeoclim. Palaeoecol. 89, 363–377.
Langer, M. R., Silk, M. T., and Lipps, J. H. (1997). Global ocean carbonate and carbon dioxide produxtion: the role of foraminifera. J. Foram. Res. 27, 271–277.
Leon, J. X., and Woodroffe, C. D. (2013). Morphological characterisation of reef types in Torres Strait and an assessment of their carbonate production. Mar. Geol. 338, 64–75. doi: 10.1016/j.margeo.2012.12.009
Mace, G. M., Reyers, B., Alkemade, R., Biggs, R., Chapin, S. F. III., Cornell, S. E., et al. (2014). Approaches to defining a planetary boundary for biodiversity. Glob. Env. Change 28, 289–297. doi: 10.1016/j.gloenvcha.2014.07.009
Mallela, J., and Perry, C. T. (2007). Calcium carbonate budgets for two coral reefs affected by different terrestrial runoff regimes, Rio Bueno, Jamaica. Coral Reefs 26, 129–145. doi: 10.1007/s00338-006-0169-7
Mandlier, P. G., and Kench, P. S. (2012). Analytical modelling of wave refraction and convergence on coral reef platforms: Implications for island formation and stability. Geomorph 159, 84–92. doi: 10.1016/j.geomorph.2012.03.007
Milliman, J. D., and Droxler, A. W. (1995). Calcium carbonate sedimentation in the global ocean: linkages between the neritic and pelagic environments. Oceanography 8, 92–94.
Morgan, K. M., and Kench, P. S. (2014). A detrital sediment budget of a Maldivian reef platform. Geomorph 222, 122–131. doi: 10.1016/j.geomorph.2014.02.013
Morgan, K. M., and Kench, P. S. (2016a). Reef to island sediment connections on a Maldivian carbonate platform: using benthic ecology and biosedimentary depositional facies to examine island−building potential. Earth Surface Proc. Land. 41, 1815–1825. doi: 10.1002/esp.3946
Morgan, K. M., and Kench, P. S. (2016b). Parrotfish erosion underpins reef growth, sand talus development and island building in the Maldives. Sed. Geol. 341, 50–57. doi: 10.1016/j.sedgeo.2016.05.011
Moses, C. S., Andréfouët, S., Kraneburg, C. J., and Muller-Karger, F. E. (2009). Regional Estimates of reef carbonate dynamics and productivity using Landsat 7 ETM+ and potential impacts from ocean acidification. Mar. Ecol. Prog. Ser. 380, 103–115. doi: 10.3354/meps07920
Nava, H., and Carballo, J. L. (2008). Chemical and mechanical bioerosion of boring sponges from Mexican Pacific coral reefs. J. Exp. Mar. Biol. Ecol. 211, 2827–2831. doi: 10.1242/jeb.019216
Nelsen, J. E., and Ginsburg, R. N. (1986). Calcium carbonate production by epibionts on Thalassia in Florida Bay. J. Sed. Pet. 56, 622–628.
Pendleton, L., Comte, A., Langdon, C., Ekstrom, J. A., Cooley, S. R., and Suatoni, L. (2016). Coral reefs and people in a High-CO2 world: where can science make a difference to people? PLoS ONE 11:e0164699. doi: 10.1371/journal.pone.0164699
Perry, C. T., and Beavington-Penney, S. J. (2005). Epiphytic calcium carbonate production and facies development within sub-tropical seagrass beds, Inhaca Island, Mozambique. Sed. Geol. 174, 161–176. doi: 10.1016/j.sedgeo.2004.12.003
Perry, C. T., Edinger, E. N., Kench, P. S., Mumby, P. J., Murphy, G., Steneck, R. S., et al. (2012). Estimating rates of biologically driven coral reef framework production and erosion: a new census-based carbonate budget methodology and applications to the reefs of Bonaire. Coral Reefs. 31, 853–868. doi: 10.1007/s00338-012-0901-4
Perry, C. T., Kench, P. S., O'Leary, M. J., Morgan, K. M., and Januchowski-Hartley, F. (2015a). Linking reef ecology to island-building: Parrotfish identified as major producers of island-building sediment in the Maldives. Geology 43, 503–506. doi: 10.1130/G36623.1
Perry, C. T., Kench, P. S., O'Leary, M., Riegl, B. R., Smithers, S. G., and Yamano, H. (2011). Implications of reef ecosystem change for the stability and maintenance of coral reef islands? Glob. Change Biol. 17, 3679–3696. doi: 10.1111/j.1365-2486.2011.02523.x
Perry, C. T., Kench, P. S., Smithers, S. G., Yamano, H., O'Leary, M., and Guilliver, P. (2013a). Timescales and modes of reef lagoon infilling in the Maldives and controls on the onset of reef island formation. Geology 41, 1111–1114. doi: 10.1130/G34690.1
Perry, C. T., and Morgan, K. M. (2017). Bleaching drives collapse in reef carbonate budgets and reef growth potential on southern Maldives reefs. Sci. Rep. 7:40581 doi: 10.1038/srep40581
Perry, C. T., Morgan, K. M., and Salter, M. A. (2016). Sediment generation by Halimeda on atoll interior coral reefs of the southern Maldives: a census-based approach for estimating carbonate production by calcareous green algae. Sed. Geol. 346, 17–24. doi: 10.1016/j.sedgeo.2016.10.005
Perry, C. T., Murphy, G. N., Graham, N. A. J., Wilson, S. K., Januchowski-Hartley, F. A., and East, H. (2015b). Remote coral reefs can sustain high growth potential and may match future sea-level trends. Sci. Reps. 5:18289. doi: 10.1038/srep18289
Perry, C. T., Murphy, G. N., Kench, P. S., Edinger, E. N., Smithers, S. G., Steneck, R. S., et al. (2014a). Changing dynamics of Caribbean reef carbonate budgets: emergence of reef bioeroders as critical controls on present and future reef growth potential. Proc. R. Soc. B. 281, 2014–2018. doi: 10.1098/rspb.2014.2018
Perry, C. T., Murphy, G. N., Kench, P. S., Smithers, S. G., Edinger, E. N., Steneck, R. S., et al. (2013b). Caribbean-wide decline in carbonate production threatens coral reef growth. Nat. Comms. 4:1402. doi: 10.1038/ncomms2409
Perry, C. T., Spencer, T., and Kench, P. (2008). Carbonate budgets and reef production states: a geomorphic perspective on the ecological phase-shift concept. Coral Reefs 27, 853–866. doi: 10.1007/s00338-008-0418-z
Perry, C. T., Steneck, R. S., Murphy, G. N., Kench, P. S., Edinger, E. N., Smithers, S. G., et al. (2014b). Regional-scale dominance of non-framework building corals on Caribbean reefs affects carbonate production and future reef growth. Glob. Change Biol. 21, 1153–1164. doi: 10.1111/gcb.12792
Pratchett, M. S., Anderson, K. D., Hoogenboom, M. O., Widman, E., Baird, A. H., Pandolfi, J. M., et al. (2015). Spatial, temporal and taxonomic variation in coral growth – implications for the structure and function of coral reef ecosystems. Oceanogr. Mar Biol. 53, 215–295.
Purdy, E. G., and Gischler, E. (2005). The transient nature of the empty bucket model of reef sedimentation. Sed. Geol. 175, 35–47. doi: 10.1016/j.sedgeo.2005.01.007
Saunders, M. I., Albert, S., Roelfsema, C. M., Leon, J. X., Woodroffe, C. D., Phinn, S. R., et al. (2016). Tectonic subsidence provides insight into possible coral reef futures under rapid sea-level rise. Coral Reefs 35, 155–167. doi: 10.1007/s00338-015-1365-0
Schlager, W., and Purkis, S. J. (2013). Bucket structure in carbonate accumulations of the Maldives, Chagos and Laccadive archipelagos. Int. J. Earth Sci. 102, 2225–2238. doi: 10.1007/s00531-013-0913-5
Schönberg, C. H., Fang, J. K., Carreiro-Silva, M., Tribollet, A., and Wisshak, M. (2017). Bioerosion: the other ocean acidification problem. ICES J. Mar. Sci. 74, 895–925. doi: 10.1093/icesjms/fsw254
Scoffin, T., Stearn, C. W., Boucher, D., Frydl, P., Hawkins, C. M., Hunter, I. G., et al. (1980). Calcium carbonate budget of a fringing reef on the west coast of Barbados. I. erosion, sediments and internal structure. Bull. Mar. Sci. 30, 475–508.
Shaw, E., Hamylton, S. M., and Phinn, S. (2016). Incorporating benthic community changes into hydrochemical-based projections of coral reef calcium carbonate production under ocean acidification. Coral Reefs 35:739. doi: 10.1007/s00338-016-1407-2
Smith, S. V., and Kinsey, D. W. (1976). Calcium carbonate production, coral reef growth, and sea level change. Science 194, 937–939. doi: 10.1126/science.194.4268.937
Stearn, C. W., Scoffin, T. P., and Martindale, W. (1977). Calcium carbonate budget of a fringing reef on the West Coast of Barbados part I – zonation and productivity. Bull. Mar. Sci. 27, 479–510.
van Rooij, J. M., de Jong, E., Vaandrager, F., and Videler, J. J. (1996). Resource and habitat sharing by the stoplight parrotfish, Sparisoma viride, a Caribbean reef herbivore. Environ. Biol. Fish 47, 81–91. doi: 10.1007/BF00002381
Vecsei, A. (2001). Fore-reef carbonate production: development of a regional census-based method and first estimates. Palaeogeog. Palaeoclim. Palaeoecol. 145, 185–200. doi: 10.1016/S0031-0182(01)00371-6
Weinstein, D. K., Smith, T. B., and Klaus, J. S. (2014). Mesophotic bioerosion: variability and structural impact on U.S. Virgin Island deep reefs. Geomorph 222, 14–24. doi: 10.1016/j.geomorph.2014.03.005
Keywords: coral reef, carbonate production, bioerosion, carbonate budgets, reef islands
Citation: Perry CT, Morgan KM and Yarlett RT (2017) Reef Habitat Type and Spatial Extent as Interacting Controls on Platform-Scale Carbonate Budgets. Front. Mar. Sci. 4:185. doi: 10.3389/fmars.2017.00185
Received: 01 February 2017; Accepted: 26 May 2017;
Published: 13 June 2017.
Edited by:
Hajime Kayanne, University of Tokyo, JapanReviewed by:
Sarah Hamylton, University of Wollongong, AustraliaAldo Cróquer, Simón Bolívar University, Venezuela
Copyright © 2017 Perry, Morgan and Yarlett. This is an open-access article distributed under the terms of the Creative Commons Attribution License (CC BY). The use, distribution or reproduction in other forums is permitted, provided the original author(s) or licensor are credited and that the original publication in this journal is cited, in accordance with accepted academic practice. No use, distribution or reproduction is permitted which does not comply with these terms.
*Correspondence: Chris T. Perry, c.perry@exeter.ac.uk