 Cale A. Miller
 Sylvia Yang
 Brooke A. Love
- 1Department of Environmental Science, Huxley College of the Environment, Western Washington University, Bellingham, WA, United States
- 2Shannon Point Marine Center, Western Washington University, Anacortes, WA, United States
Photosynthesis and respiration are vital biological processes that shape the diurnal variability of carbonate chemistry in nearshore waters, presumably ameliorating (daytime) or exacerbating (nighttime) short-term acidification events, which are expected to increase in severity with ocean acidification (OA). Biogenic habitats such as seagrass beds have the capacity to reduce CO2 concentration and potentially provide refugia from OA. Further, some seagrasses have been shown to increase their photosynthetic rate in response to enriched total CO2 (TCO2). Therefore, the ability of seagrass to mitigate OA may increase as concentrations of TCO2 increase. In this study, we exposed native Zostera marina and non-native Zostera japonica seagrasses from Padilla Bay, WA (USA) to various levels of irradiance and TCO2. Our results indicate that the average maximum net photosynthetic rate (Pmax) for Z. japonica as a function of irradiance and TCO2 was 3x greater than Z. marina when standardized to chlorophyll (360 ± 33 μmol TCO2 mg chl−1 h−1 and 113 ± 10 μmol TCO2 mg chl−1 h−1, respectively). Additionally, Z. japonica increased its Pmax ~50% when TCO2 increased from ~1,770 to 2,051 μmol TCO2 kg−1. In contrast, Z. marina did not display an increase in Pmax with higher TCO2, possibly due to the variance of photosynthetic rates at saturating irradiance within TCO2 treatments (coefficient of variation: 30–60%) relative to the range of TCO2 tested. Our results suggest that Z. japonica can affect the OA mitigation potential of seagrass beds, and its contribution may increase relative to Z. marina as oceanic TCO2 rises. Further, we extended our empirical results to incorporate various biomass to water volume ratios in order to conceptualize how these additional attributes affect changes in carbonate chemistry. Estimates show that the change in TCO2 via photosynthetic carbon uptake as modeled in this study can produce positive diurnal changes in pH and aragonite saturation state that are on the same order of magnitude as those estimated for whole seagrass systems. Based on our results, we predict that seagrasses Z. marina and Z. japonica both have the potential to produce short-term changes in carbonate chemistry, thus offsetting anthropogenic acidification when irradiance is saturating.
Introduction
The uptake of CO2 from anthropogenic fossil fuel emissions by the global oceans is shifting the acid-base balance of the carbonate system in a process known as ocean acidification (OA). Increasing CO2 concentration outpaces the natural buffering capacity of seawater and increases the total CO2 (TCO2), which is the sum of all forms of carbonic acid and its conjugate bases (Doney et al., 2009; Hönisch et al., 2012). The dissolution of anthropogenic CO2 in nearshore waters interacts with a host of other processes that drive the dynamics of nearshore carbonate chemistry, such as biological metabolism, riverine discharge and associated organic matter composition, tidal pumping, upwelling, nutrient input, and eutrophication (Feely et al., 2008, 2010; Cai, 2011; Duarte et al., 2013; Waldbusser and Salisbury, 2014; Wallace et al., 2014). The synergy of these factors induces high variability to the carbonate system, and results in periodic and episodic decreases in pH and aragonite saturation state (Ωar) that are more extreme than the ~0.4 pH and ~1.5 Ωar decreases predicted for global ocean averages by the year 2100 (Ciais et al., 2013; Duarte et al., 2013; Waldbusser and Salisbury, 2014). Among these drivers, photosynthesis and respiration are the dominant processes controlling coastal ocean carbonate chemistry (Gattuso et al., 1998; Sunda and Cai, 2012; Waldbusser and Salisbury, 2014). The diurnal variability of biological photosynthesis and respiration can, therefore, either dampen or amplify the magnitude of extreme carbonate chemistry events, which may occur from episodic influxes of fresh water or upwelling. Gaining a better understanding of how these biological signals modify and potentially ameliorate acidification is imperative, particularly when the effects of acidification can impact the economic and social stability of coastal human communities that are dependent on ocean resources (Ekstrom et al., 2015).
Many marine calcifiers and a variety of other marine species will be negatively affected by OA as decreases in pH, calcium carbonate saturation state and the substrate-to-inhibitor ratio—[]/[H+]—have been shown to inhibit calcification, growth, and acid-base regulation (Pörtner, 2008; Kroeker et al., 2013; Thomsen et al., 2015; Waldbusser et al., 2015; Fassbender et al., 2016). Conversely, some autotrophic organisms may directly benefit from the increase in seawater CO2 associated with acidification, which can stimulate photosynthesis and increase growth (reviewed in Kroeker et al., 2010, 2013; Koch et al., 2013). For example, photosynthetic rates of many seagrass species have been shown to increase with TCO2 (Beer and Koch, 1996; Thom, 1996; Zimmerman et al., 1997; Invers et al., 2001; Cox et al., 2016; Ow et al., 2016). In addition, some studies have concluded that the carbon uptake by seagrass beds may mitigate acidification on specific spatial and temporal scales when irradiance is high (Manzello et al., 2012; Unsworth et al., 2012; Hendriks et al., 2014).
OA mitigation by seagrass arises from the removal of CO2 from seawater through photosynthesis, which raises pH and reduces TCO2 thus minimizing acidification on short timescales (Marbá et al., 2006; Unsworth et al., 2012). This direct action of OA mitigation by seagrass is, however, reversed during times of dark respiration, which transiently increases TCO2. For most seagrass systems, periods of high photosynthetic activity are robust enough to reduce TCO2 in spite of the enhanced remineralization of allochthonous organic matter, which accumulates within seagrass beds and fuels the production of TCO2 via respiration (Koch et al., 2006; Duarte et al., 2013; Hendriks et al., 2014; Baumann et al., 2015). Since most seagrass systems tend to be net autotrophic, or at least seasonally net autotrophic, they can sequester copious amounts of carbon on seasonal timescales that correspond to changes in above-ground biomass, while carbon can be sequestered on longer timescales by below-ground retention in the sediment (Duarte et al., 2005, 2010; Chung et al., 2011; McLeod et al., 2011; Fourqurean et al., 2012; Unsworth et al., 2012; Marbà et al., 2015; Poppe, 2016). Estimated values of organic carbon retained in seagrass sediments to a depth of 1 m range from 9.1 to 625 mg ha−1, with actual measurements extending to 829 mg ha−1 (Fourqurean et al., 2012). Despite the importance of carbon storage, it is the instantaneous photosynthetic carbon uptake that drives OA mitigation potential on short timescales.
Presumably, extreme acidification events in nearshore coastal waters will increase in frequency, duration, and magnitude as a result of anthropogenic OA (Harris et al., 2013; Hauri et al., 2013). For early life stage calcifiers undergoing rapid growth and development, sensitivity to OA is heightened and driven by the duration and intensity of exposure (Kurihara, 2008; Talmage and Gobler, 2009; Hettinger et al., 2012; Waldbusser et al., 2015). Therefore, an increase in acidification severity will likely result in chemical conditions that periodically surpass physiological thresholds of resident organisms already living near their tolerance limits (Grantham et al., 2004; Waldbusser and Salisbury, 2014). Instantaneous carbon uptake rates by seagrasses, however, may be able to expand periods of favorable carbonate chemistry for these sensitive species, or dampen the episodic extremes of acidification on hourly timescales, thus lessening the exposure to extreme acidification.
In the U.S. Pacific Northwest (PNW), two Zostera seagrass species are among the seagrasses commonly found in soft-sediment habitats in the Salish Sea: native Zostera marina L. and non-native Zostera japonica Ascher & Graebner (Harrison and Bigley, 1982). The native seagrass Z. marina has specifically been identified by Washington State as a biological means to ameliorate acidification (Washington State Blue Ribbon Panel on Ocean Acidification Ocean Acidification., 2012). In addition, both Z. marina and Z. japonica have strong habitat-associations with organisms vulnerable to OA, such as bivalves (Ferraro and Cole, 2012; Mach et al., 2014; Dumbauld and McCoy, 2015). The non-native Z. japonica has colonized previously unvegetated mudflats and is found in the mid to upper intertidal zone, whereas Z. marina has a distribution extending from the lower intertidal to shallow subtidal region; species overlap between Z. marina and Z. japonica can occur in the lower intertidal zone on flat shorelines (Harrison, 1982; Thom, 1990; Kaldy, 2006; Ruesink et al., 2010). The increasing presence and distribution of Z. japonica in the PNW warrants an inclusion of this non-native species when examining the potential of seagrass in the Salish Sea to mitigate OA.
Research has shown that seagrass carbon uptake rates are species-specific and vary in response to altered carbonate chemistry (Campbell and Fourqurean, 2013; Koch et al., 2013). Thus far, Z. marina has been the focus of many studies examining its photosynthetic response to increases in TCO2 (Beer and Koch, 1996; Thom, 1996; Zimmerman et al., 1997; Koch et al., 2013); however, this is not the case for Z. japonica. There have not been any published studies to our knowledge examining Z. japonica response to TCO2. Only a handful of studies have examined Z. japonica photosynthesis and physiology for populations established in the PNW (see Shafer et al., 2011; Shafer and Kaldy, 2014; Kaldy et al., 2015). Shafer and Kaldy (2014) found that Z. japonica local to the central Oregon coast has a substantially greater photosynthetic rate than Z. marina under the same chemical conditions. While this study provides insight into the relative photosynthetic differences between the two species, a comprehensive understanding of variable TCO2 and irradiance response is needed in order to determine how this difference drives OA mitigation potential. In addition, it is important to examine if the local adaptations that exist throughout a species' distribution (Backman, 1991 and references therein; Shafer et al., 2011) result in photosynthetic differences that are dissimilar between central Oregon and Salish Sea populations.
In this study, we conducted a series of laboratory experiments to better understand how Z. marina and Z. japonica may alter carbonate chemistry under conditions of elevated TCO2 and variation in light intensity, as would occur over a diurnal period. We aimed to determine how the photosynthetic carbon uptake of Z. marina and Z. japonica shift the carbonate system on short timescales potentially counteracting acidification. Specifically, we conducted one experiment per species to (1) examine the differences in species' photosynthetic rates (i.e., carbon uptake rates), (2) quantify the response of photosynthetic rates to differing levels of TCO2, and (3) use those results to estimate how the photosynthetic carbon uptake could induce hourly changes on the carbonate system over a diurnal cycle at various biomass to water volume ratios.
Materials and Methods
Sample Site and Collection
Padilla Bay, Washington, is a tidally dominated estuary in the Salish Sea, and is a part of the National Estuarine Research Reserve System (48°31′14.1″N, 122°35′24.4″W). The Z. marina and Z. japonica meadows in Padilla Bay constitute a submerged and emergent total area of ~4,000 ha, where Z. marina accounts for ~3,000 of the total area (Bulthuis, 2013). The higher intertidal region is dominated by Z. japonica, which is morphologically different than Z. marina and has a leaf surface area and mass that is ~5x less than that of Z. marina. Z. japonica constitutes ~22% of the seagrass biomass in Padilla Bay, and the spread of the non-native species has increased the total areal extent of seagrass acreage. In the intertidal where Z. japonica overlaps with Z. marina, a 250 m transect was marked for shoot collection, which occurred every 25 m (48°29′36.6″N, 122°29′8.5″W). Two weeks prior to shoot collection, two HOBO Pendant Temperature/Light 64k data loggers were attached to the transect marking poles ~1 m above the sediment (above the height of the canopy) to capture in situ irradiance at the sample site which was used to generate a realistic but idealized light field to drive model visualizations. HOBO data (in units of lux) were converted to daylight photon flux density (PFD) as described by Thimijan and Heins (1983). The measurements from the two sensors were averaged and smoothed, and this curve was scaled to the maximum value recorded by land-based PAR measurements at the Padilla Bay farm station. It is important to note that the HOBO light sensors only measure in the planar flux and not the spherical or scalar flux, which is a more comprehensive irradiance flux; therefore, the sensor data are used to define the shape of the curve, while the scaling should bring the overall range of irradiance values within realistic bounds.
Approximately 200 shoots of each species were collected from Padilla Bay along the entire 250 m transect. Healthy-looking adult Z. marina shoots with intact rhizomes were collected by hand during low tide (0.8 m MLLW) on August 16, 2015 from Padilla Bay, placed in a cooler, and transported to Shannon Point Marine Center in Anacortes, Washington, within 1 h of collection. Ten days later on August 26, 2015, adult Z. japonica shoots with intact rhizomes were collected in the same manner at low tide (~0.0 MLLW) for a second experiment. One hundred of the most healthy-looking shoots (i.e., shoots without visible damage and well-preserved rhizomes) were then haphazardly selected, rinsed with seawater, and dispersed among four separate 40-l acrylic flow through tanks under low PFD (~50 μmol photons m−2 s−1) on a 12:12 L:D cycle for ~48 h before experimentation.
Experimental Design
We used a 5 × 5 factorial design that targeted 25 treatment CO2 and light combinations: estimated PFD levels 0, 40, 200, 500, and 750 μmol photons m−2 s−1, and pCO2 of 140, 250, 400, 650, and 900 μatm, where the 400 pCO2 treatment is the approximate ambient condition for the open ocean. Treatment pCO2 values were selected because they correspond to an observed range of diurnal in situ variability of the carbonate system in Padilla Bay (Love et al., 2016). Even though pCO2 was the variable used to prepare treatments by gas equilibration, TCO2 is a more appropriate metric for our experiment given that CO2 and are presumably both utilized for photosynthesis; therefore, we identify treatment levels by initial TCO2 rather than pCO2 henceforth. In order to achieve the full factorial design, we used closed experimental incubation vials housing leaf segments rather than whole shoots in large open aquaria. Each treatment combination had quadruplicate replication and duplicate blanks for a total of 100 leaf-segment and 50 blank vials. Blanks had the same PFD exposure and initial TCO2 but lacked leaf segments, and were used to account for any changes in seawater chemistry induced by microbial activity.
During each experiment, 150 incubation vials (20 ml borosilicate scintillation vials with a polyethylene cone-shaped liner) were placed in five clear acrylic water bath trays (56.5 × 7.62 × 3.81 cm) fitted with flow-through seawater for temperature control. Each water bath tray was mounted to a single 1.5 cm clear acrylic sheet, and placed directly above an individual bulb in a light fixture housing five T5 high output 54W 6,500 K Spectralux bulbs. Incubation vials were nearly fully submerged (water line stopped at cap) when placed in water bath trays. Vinyl mesh wraps were constructed and fitted to incubation vials to attenuate light. Mesh covers either had one, three, or six layers, which provided a PFD range from ~40 to 500 μmol photons m−2 s−1.
Treatment Water and Leaf Segment Preparation
To obtain a spectrum of TCO2 concentrations, seawater pumped from Guemes Channel was collected, 0.2 μm filtered, sterilized via autoclave, and distributed into four 20 L polycarbonate carboys. Four mixtures of pure CO2 (research grade-5) and compressed ambient air stripped of CO2 using a regenerative molecular sieve adsorber (Twin Tower Engineering, CAS2-11) were generated using four sets of Sierra SmartTrak mass flow controllers. Treatment water was bubbled for at least 72 h with gas mixtures that were first passed through humidifiers (one liter Nalgene bottles filled halfway with tap water). Carboys were held in an incubator, which maintained water temperature at approximately 12.5°C. Further details are described in the equilibration system portions of Love et al. (2017). A fifth CO2 treatment was produced by mixing, equilibrated, identical volumes of the two lowest CO2 mixtures.
Preparation of seagrass tissue used for incubations began approximately 20 h before each experiment. This began by selecting the middle section of the second youngest leaf in a shoot, and wiping the entire leaf clean of epiphytes. To test similar leaf surface area for both species, a 2 cm leaf segment for Z. marina and 4 cm leaf segment for Z. japonica was excised. While the middle section of the leaf was selected for, variation among shoot length of the second youngest leaf existed. Each leaf segment was then cut in two, and one half randomly frozen for chlorophyll extraction and the other placed into the incubation vial filled with 5 ml of filtered and sterilized seawater. Leaf segment stocked vials were then held in a low light incubator at ~12°C for 16–20 h until experimentation.
Immediately before each experiment, stocked vials were emptied of filtered seawater, rinsed and filled with treatment seawater. Vials were overflowed to eliminate headspace, and a 0.5-mm glass bead was inserted as a stirring mechanism. Mesh coverings (no mesh, 1 layer, 3 layer, 6 layer, and black electrical tape for opaque) were placed around vials to achieve varied levels of PFD. Vials were haphazardly placed into water bath trays, and incubated for 90 min until termination of the experiment. Vials were physically inverted by hand, three times, every 5 min to stir water inside and minimize the development of a TCO2 poor boundary layer around leaf segments. Temperature in water bath trays was continuously monitored and recorded every 20 min with a Fluke 1523 reference thermometer from the beginning of the experiment until all vials were terminated. PFD was measured at each vial location with a QSL-101 PAR irradiance sensor (Biospherical Instruments Inc.) by setting vials with mesh coverings in their respective locations after the conclusion of the experiment. Due to the discontinuity of PFD along a bulb (i.e., vials positioned at the center of a bulb received more light than those at either end), light measurements were treated as continuous data for all statistical analyses.
Leaf Segment and Carbonate Chemistry Analysis
Photosynthetic rates were determined from leaf segment incubations of Z. marina and Z. japonica by measuring treatment TCO2 concentration before and after incubation. While photosynthetic rates are normalized to TCO2, the O2 convention is followed. That is, positive photosynthetic rates are a negative flux of TCO2 from the medium, while respiration is a positive flux of TCO2 to the medium: this is opposite when O2 normalized. Initial TCO2 samples were collected in triplicate 20 ml scintillation vials, poisoned with 10 μl of saturated HgCl2, capped, wrapped with parafilm to minimize any potential gas leakage, and refrigerated at 2°C until analysis. Initial total alkalinity (TA) samples were collected in triplicate 350 ml amber glass bottles with polyurethane-lined crimp-sealed metal caps and poisoned with 30 μl of saturated HgCl2. Salinity was measured from each TA sample with a refractometer before poisoning occurred, and again for each treatment vial when samples were processed.
Incubations were terminated by removing vials, one at a time haphazardly across treatments, but ordinally by replicate assignment—this allowed for an equal experimental termination time across treatments. Leaf segments were removed from the vial, marked for incubation time, and stored in an empty vial for dry-weight measurement. The experimental vial was immediately poisoned and stored in the same manner as initial condition samples. TCO2 samples were analyzed within 5 days of each experiment using an Apollo SciTech AS-C3 dissolved inorganic carbon analyzer. TA samples were titrated within 30 days of the experiment using the open-cell method as in Dickson et al. (2007) with a Metrohm 888 Titrando. Certified reference material was used to construct a five-point standardization curve for TCO2 and to verify accuracy of TA open-cell titration (Batch 144, A.G., Dickson, Scripps Institute of Oceanography). All other carbonate chemistry parameters were calculated using CO2SYS (Pierrot et al., 2006) with K1 and K2 equilibrium constants from Mehrbach et al. (1973) and refit by Dickson and Millero (1987). Dry weight was recorded after rinsing leaf segments 3x with deionized water and drying at 55°C for at least 24 h. Frozen leaf segments were prepped for chlorophyll extraction by sonicating for 30 s in a 10 ml 90% acetone solution. Segments were then refrozen at −20°C for 24 h and centrifuged for 5 min directly before chlorophyll measurement. Extract was measured with a Trilogy fluorometer (Turner designs), acidified with 0.1 N HCl, and measured again. Chlorophyll and phaeopigment concentrations were calculated following the methods described by Lorenzen (1966).
Statistical Methods and Photosynthetic Response
Predicted photosynthetic rates for both species were determined by modeling the empirical data separately for each experiment as a function of continuous PFD, and a combined effect of continuous PFD and TCO2 in one integrated, iterative (600 iterations) model, using the non-linear and linear curving fitting functions and curve fitting tools in the MathWorks software Matlab (V. 2015b). Species comparison was determined from the robustness of the model fit and whether or not 95% confidence intervals overlapped for each predicted photosynthetic parameter. Photosynthetic rates were normalized to chlorophyll (a/b) rather than dry-weight in order to account for variability of pigment concentration that occurs between and along leaves (Enríquez et al., 2002). Following the methods described in Jassby and Platt (1976), the net photosynthetic rate (Pnet) was calculated as:
where Pmax is the maximum photosynthetic rate (μmol TCO2 mg chl−1 h−1), E is the PFD (μmol photons m−2 s−1), Rd is the dark respiration rate (μmol TCO2 mg chl−1 h−1), and α (photosynthetic efficiency) is the initial slope of the photosynthetic-irradiance curve (μmol TCO2 mg chl−1 h−1 (μmol photons m−2 s−1)−1). In order to integrate the empirical instantaneous photosynthetic rates (i.e., carbon uptake) to hourly changes in the carbonate system, TCO2 was integrated into the standard photosynthesis-irradiance curve (Equation 1) as a linear effect on Pmax. A vector of initial TCO2 concentration was applied to the Pmax term, thus allowing Pmax to vary with TCO2:
where is the TCO2 dependent Pmax, β is the slope of the Pmax response to TCO2, Pbase is the intercept, and TCO2i is the initial TCO2 concentration. The integrated TCO2-irradiance model was, thus, a combination of the above equations:
where Pnet is now a function of irradiance and TCO2. The estimated mean Pmax and photosynthetic efficiency (α) from the TCO2-irradiance model (Equation 3) output were used to calculate the saturation irradiance:
where Ek is the saturation irradiance and and α the outputs from the TCO2-irradiance model (Equation 3). Since all TCO2-irradiance model predictions of Pmax are TCO2 dependent (), for simplicity, we will simply refer to them as Pmax rather than . Pmax-values for both species at every initial TCO2 treatment were statistically compared based on the predicted standard error and confidence bounds from the model output. In addition, Pmax-values as a function of initial CO2 and were observed as both carbonate species are generally utilized for photosynthesis.
Model Evaluation: Photosynthesis and Carbon Uptake
The TCO2-irradiance model was conceived by applying realistic PFD values representing a diurnal cycle and the experimental TCO2 treatment values as model input parameters (Equation 3), producing hourly photosynthesis estimates and the concomitant uptake of TCO2. A Gaussian function was fit to field collected PFD measurements resulting in a generalized light cycle. The TCO2 values for the ambient treatment from both experiments were averaged (1,964 μmol kg−1) and utilized as a baseline concentration from which hourly photosynthetic carbon uptake could be used to calculate changes in TCO2 at each hourly step over a diurnal period. Assuming TA constant (also averaged from both experiments—2,134 μmol kg−1), the relative changes in pH and Ωar could then be calculated based on the change in TCO2 as driven by the estimated photosynthetic carbon uptake of each species. The calculated differences were always determined from the baseline TCO2 for each time step. This is in accordance with the initial condition of each of our experimental TCO2 and light conditions, and is analogous to the situation when residence time in a seagrass bed is small. In the scenario where reduction in TCO2 is compounded, concentrations in the conceived model would be reduced to minimal values rapidly upon initiation of photosynthesis and the effects of both species-specific rates and initial TCO2 would disappear under the general carbon limitation.
Estimated Changes in Carbonate Chemistry
The experimental results were determined at a fixed ratio of biomass to water volume, constraining the ability to compare the laboratory results to other studies. Therefore, the model predicted results were examined at different biomass to water volume ratios, which would be similar to variation in seagrass density and water depth in the field. Predicted Pmax results were applied to a simple box model consisting of a 1 m area, with seagrass at a moderate density, and carbonate chemistry predictions driven by saturating irradiance, TCO2 and water depth. The specific changes induced on the carbonate system by both species' maximum photosynthetic potential were extrapolated from vial volume (20 ml) to different volumes of static water corresponding to various depths over a 1 m2 patch of seagrass with a biomass of 100 gDW m−2. It should be noted that we don't take into account light attenuation at these depths, but at mid-day, irradiance should still be saturating. Estimates for both species from various locations in Padilla Bay reported in Bulthuis (2013), show a range from ~60–200 gDW m−2 with a mean of ~100 for both species. The change in TCO2 was calculated assuming a well-mixed water column, the average mg chl gDW−1 (1.88 ± 0.89 and 0.67 ± 0.33 for Z. marina and Z. japonica, respectively) for each species, and using projected Pmax values, as:
where TCO2i is the initial TCO2, Cb is mg chl gDW−1, bi is the gDW over a m2 (a), d is depth (m), r is Pmax (μmol TCO2 mg chl−1 h−1), and f is the unit conversion m3 1,000 L−1. Changes in TCO2 from photosynthetic carbon uptake by each species were then used to determine the changes in carbonate chemistry parameters while assuming TA constant (averaged from both experiments—2,134 μmol kg−1).
Results
Incubation Conditions
Experimental conditions for the leaf segment incubations were similar between experiments (Table 1), which were run at nearly the exact same time of day in the mid-morning (<2 min apart). Temperature averaged 13.2 ± 0.4°C, for the Z. marina experiment, and 13.4 ± 0.1°C for the Z. japonica experiment. Photon flux density (PFD) had a greater variance for the high light treatments than for the lower, more heavily shaded treatments. Salinity ranged from 30.5 to 32 ppt for the Z. japonica experiment (Table 1). This variation was likely a result of unequal effectiveness by the humidifiers during bubbling, or from differential evaporation in the autoclaved bottles used to fill carboys. The pCO2 of the seawater treatments did not indicate complete equilibration with the gas mixtures, which ranged from 100 to 1,200 μatm whereas seawater treatment conditions only ranged from 138 to 918 μatm (Table 1). However, the treatment values did produce a large range in TCO2 and were similar across both experiments. The high TCO2 treatment had the greatest difference between experiments, which was 55 μmol kg−1 higher for the Z. marina experiment than for the Z. japonica experiment (Table 1). It should be noted that sample size by treatment TCO2 varied from 20 to 17 due to either the malfunction of the dissolved inorganic carbon analyzer or loss of treatment seawater stored in the incubation vial.
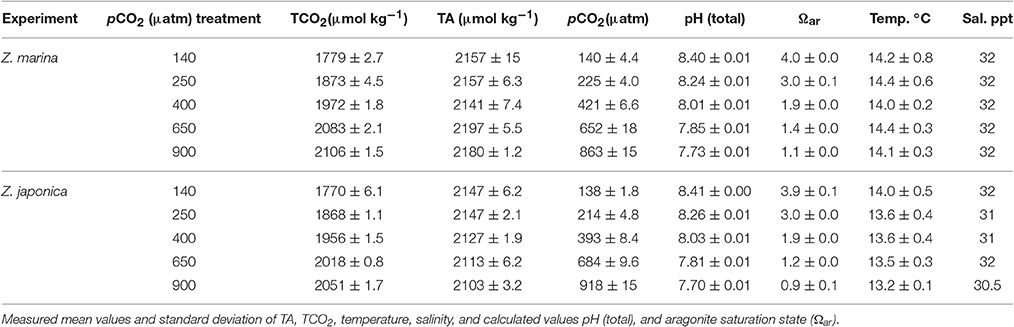
Table 1. Initial conditions for both Z. marina and Z. japonica experiments.
Species-Specific Photosynthetic Response to Irradiance and TCO2
All photosynthetic parameters for Z. japonica were best predicted by the TCO2-irradiance model (Equation 3), which had a more robust fit (RMSE = 150 μmol TCO2 mg chl−1 h−1) than the standard photosynthesis-irradiance model (Equation 1), RMSE = 161 μmol TCO2 mg chl−1 h−1 (Table 2). There was no difference in the predictive power between the TCO2-irradiance and the standard photosynthesis-irradiance models for Z. marina, both had an RMSE of 43 μmol TCO2 mg chl−1 h−1. Based on the TCO2-irradiance model relating the photosynthesis-irradiance curve to TCO2, the mean maximum photosynthetic rate (Pmax) for Z. japonica was 3x greater than Z. marina, and photosynthetic efficiency (α) was 4.5x greater on a per chlorophyll basis (Table 2, Figure 1). The non-linear fit for both seagrasses in Figure 1 is the mean fit over all initial TCO2, which displays higher variability for Z. japonica compared to Z. marina indicating a greater response by Z. japonica to TCO2. The model produced a good fit for Z. japonica and for Z. marina for two out of the three photosynthetic parameters, however, the mix of positive and negative TCO2 fluxes in the respiration vials resulted in a positive value rather than a negative value predicted by the model for Z. marina and Z. japonica respiration (intercept) (Figure 1, Table 2). Across all treatments, the mean leaf segment mg chl:gDW−1 ratio—used to normalize the model results—was ~3x greater for Z. marina (1.88 ± 0.89) than for Z. japonica (0.67 ± 0.33). Model predicted mean Pmax for Z. japonica was 360 ± 33 μmol TCO2 mg chl−1 h−1 with an α of 3.70 ± 1.1 μmol TCO2 mg chl−1 h−1 (μmol photons m−2 s−1)−1, and where considered significant with standard error (SE) (Table 2). Model prediction for Z. marina Pmax was 113 ± 10 μmol TCO2 mg chl−1 h−1 with an α of 0.819 ± 0.21 μmol TCO2 mg chl−1 h−1 (μmol photons m−2 s−1)−1, and were also predicted as significant (Table 2). In addition, the point at which each species experiences a saturating irradiance (Ek) was also different. Z. japonica displayed a lower Ek at 97 (propagated SE = 31) μmol photons m−2 s−1, which was ~70% of Z. marina's Ek of 138 (propagated SE = 37) μmol photons m−2 s−1. The maximum photosynthetic rates—which were used to fit the Pmax values—for Z. japonica appeared to respond positively with increasing TCO2 (Figure 2). Z. marina, however, did not display any positive increase in photosynthetic rate with increasing TCO2. It is important to note that Figure 2A strictly shows one half of the TCO2-irradiance model (photosynthetic rate to TCO2) and does not directly reflect the interaction between TCO2 and light, as is really described by the model.
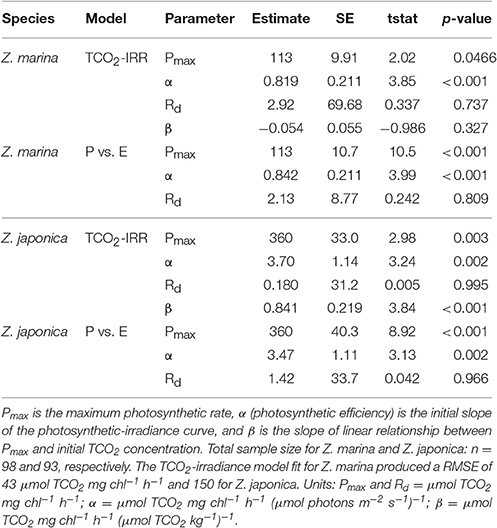
Table 2. Predicted photosynthetic parameters from the TCO2-irradiance (TCO2-IRR) model (Equation 3) and the standard photosynthesis-irradiance (P vs. E) model (Equation 1).
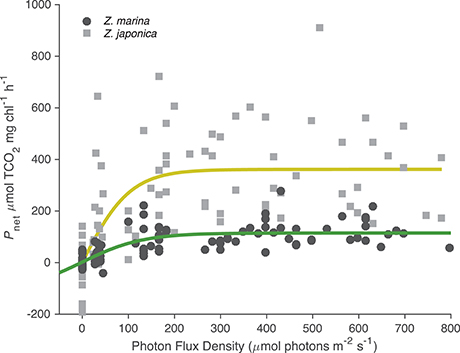
Figure 1. Photosynthetic-irradiance curves for Z. marina (closed circles) and Z. japonica (closed squares). Net photosynthetic rates (μmol TCO2 mg chl−1 h−1) collated for all initial TCO2 treatments from experimental 90 min incubations. Fitted lines are the estimated curve from the TCO2-irradiance model (Equation 3). All negative data points indicate respiration (μmol TCO2 mg chl−1 h−1).
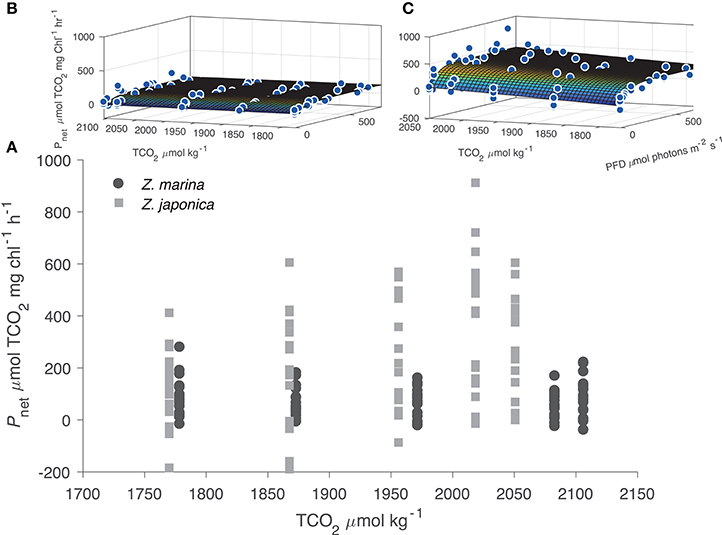
Figure 2. (A) Experimental results of net photosynthetic rates (Pnet μmol TCO2 mg chl−1 h−1) for Z. marina (closed circles) and Z. japonica (closed squares) plotted against initial TCO2 concentration. All negative data points indicate respiration (μmol TCO2 mg chl−1 h−1). The surface plots of the TCO2-irradiance model for Z. marina (B) and Z. japonica (C) highlight full model response.
The TCO2-irradiance model predicted a positive increase in Pmax to increasing carbon availability by Z. japonica over the entire range of TCO2 tested (Figure 3). The TCO2-irradiance model predicted a significant and positive β term for Z. japonica, whereas β for Z. marina was non-significant (where β is the slope of the Pmax to TCO2 relationship). Due to the variance of maximum photosynthetic rates and the resulting non-significant effect of TCO2 on Z. marina, we are unable to properly analyze any trends in Z. marina Pmax with TCO2, , and CO2. According to the model, Z. japonica Pmax increased by ~50% from the lowest to highest initial TCO2 treatment (Figure 3). Across all initial TCO2 treatments, Z. japonica had a significantly higher Pmax than Z. marina (i.e., non-overlapping 95% CI) (Table 3).
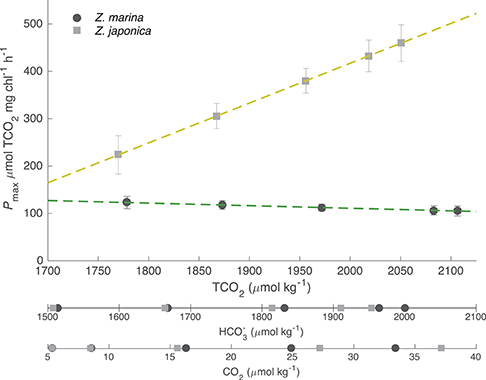
Figure 3. Model predicted maximum photosynthetic rates (Pmax) for Z. japonica (closed squares) and Z. marina (closed circles) as a function of TCO2, , and CO2 with SE. Discrete and CO2 concentrations are the initial values for each treatment corresponding to pCO2- and TCO2-values (Table 1). Dashed lines are the linear fits of the predicted Pmax for Z. marina (green) and Z. japonica (yellow), which is the β term from the TCO2-irradiance model (Table 2).
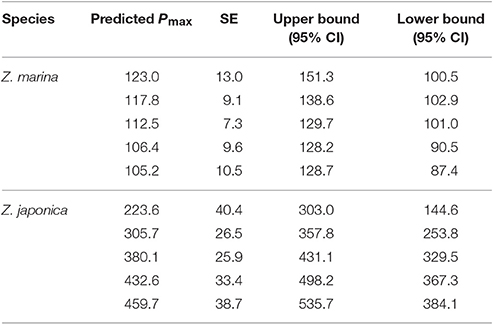
Table 3. TCO2-irradiance model (Equation 3) predicted Pmax (μmol TCO2 mg chl−1 h−1) values for both Z. japonica and Z. marina at each initial TCO2 concentration.
Model Predictions for Diurnal Variation of the Carbonate System
Under realistic natural light conditions, both species are at saturating irradiances for about 6 h during a typical summer day. The resulting maximum predicted photosynthetic rates for Z. japonica, are 535 μmol TCO2 mg chl−1 h−1 when initial TCO2 is set to 2051 μmol kg−1 (highest TCO2 treatment), 387 μmol TCO2 mg chl−1 h−1 when TCO2 is set at 1964 μmol kg−1 (ambient treatment) and only 145 μmol TCO2 mg chl−1 h−1 when TCO2 is set at 1770 μmol kg−1 (lowest TCO2 treatment) (Figure 4). The predicted maximum photosynthetic rate for Z. marina is 116 μmol TCO2 mg chl−1 h−1 under these saturating light conditions, and no sensitivity to TCO2 was detected. Due to the poor respiration data, estimates of respiration were excluded during times of zero irradiance. When light was saturating, model estimates predict that the carbon drawdown based on a Pmax of 387 TCO2 mg chl−1 h−1 for Z. japonica would result in a maximum increased change in pH and omega of 0.65 and 3.8 units mg chl−1 h−1 compared to the 0.25 and 1.1 unit increase by Z. marina. The estimated changes are, however, based on the total carbon draw down by the leaf segment in a 20 ml vial and in isolation from in situ bed conditions, which would be driven by additional considerations.
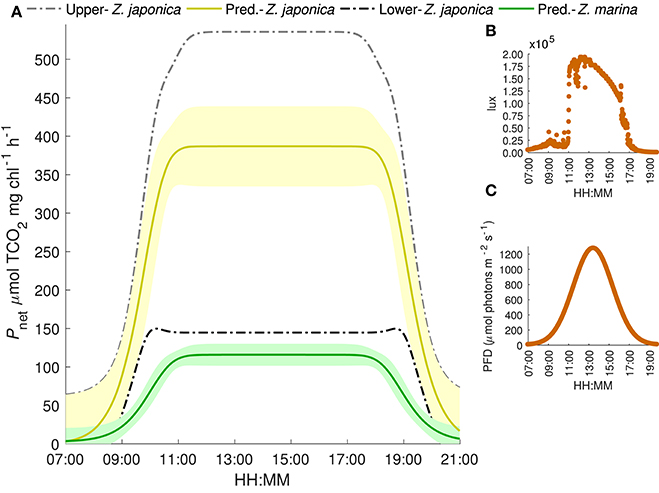
Figure 4. (A) Predicted TCO2-irradiance model results of net photosynthetic rates for Z. japonica (yellow line) and Z. marina (green line) under a generalized light cycle from Padilla Bay and mean initial TCO2 concentration of 1964 μmol kg−1 corresponding to the median 400 pCO2 treatment. Shaded region is the 95% CI. Upper (gray) and lower (black) bounds are the predicted net photosynthetic rate of Z. japonica at initial TCO2 concentrations of 2051 and 1770 μmol kg−1, respectively. (B) Average lux readings from two HOBO light data loggers deployed at field sample site. (C) Gaussian model fit of the Padilla bay irradiance converted to photon flux density: i.e., a generalized light cycle.
Model (Equation 5) estimated hourly changes in pH, Ωar, and the substrate-to-inhibitor ratio ([]/[H+]) for biomass to water volume ratios similar to a typical seagrass bed under 1 m of water were greater when mediated by Z. japonica than for Z. marina, with identical initial TCO2 (Figure 5). Under these conditions, Z. japonica induced an hourly rate of change for pH and Ωar that was approximately 20% greater than Z. marina (Figure 5). Both seagrass species induced positive changes in carbonate chemistry parameters. The greatest change in pH (0.49 h−1) and Ωar (1.61 h−1) occurred at a shallow depth of 0.2 m with high TCO2 (2051 μmol kg−1) and was mediated by Z. japonica (Figure 5). The greatest change in the substrate-to-inhibitor ratio was not determined by high carbon uptake rates via photosynthesis, but rather by the low concentration of H+ at low TCO2.
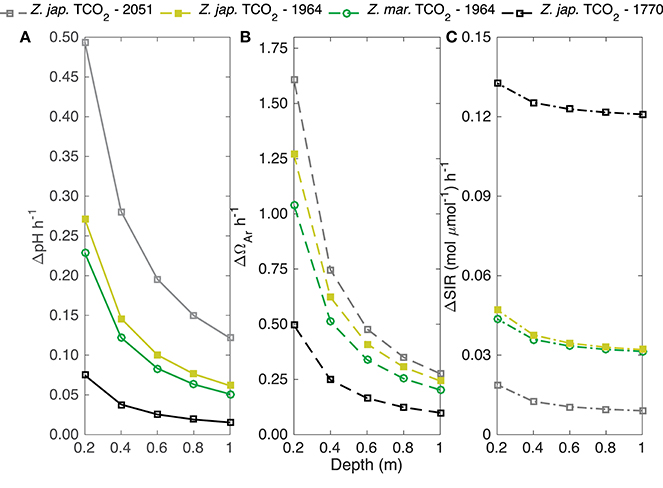
Figure 5. Yellow and green lines are the predicted change in (A) pH, (B) aragonite saturation state (Ωar), and (C) substrate-to-inhibitor (mol μmol−1) ratio based on the predicted Pmax (μmol TCO2 mg chl−1 h−1) of Z. japonica (closed squares) and Z. marina (open circles) at an initial [TCO2] of 1964 μmol kg−1. Gray and black lines are the upper and lower bound of the predicted change in pH, aragonite saturation state, and substrate-to-inhibitor ratio of Z. japonica at an initial TCO2 of 2,051 and 1,770 μmol kg−1, respectively. Predicted change is over a 1 m2 area and given depth assuming a biomass of 100 gDW m−2 (Equation 5). TCO2 concentrations correspond to the 140, 400, and 900 pCO2 treatments for Z. japonica and 400 pCO2 treatment for Z. marina (TCO2 corresponding to 400 pCO2 treatments was averaged from both experiments). TA (i.e., average TA of both 400 pCO2 treatments), temperature, and salinity were utilized from each respective treatment (Table 1) to constrain the carbonate system to calculate predictions.
Discussion
Species-specific difference in TCO2-dependent photosynthetic carbon uptake is a critical component that determines the capacity of seagrass to remove dissolved CO2 from seawater and potentially create OA refugia on short timescales. Our results indicate that, on a per chlorophyll basis, Z. japonica is able to take up more TCO2 and more efficiently utilize available irradiance compared to Z. marina occurring in the same intertidal zone under similar TCO2 and irradiance conditions (Figures 1, 2, Table 2). Because of this, Z. japonica may be more effective at mitigating OA (increasing pH and Ωar) for more hours of the day than Z. marina on a per chlorophyll basis (Figure 4). The maximum potential drawdown of TCO2 over the 6 h of saturating irradiance induces a positive change in pH (from 8.03 to 8.33 and 8.40) and Ωar (from 1.94 to 3.1 and 3.4) by Z. marina and Z. japonica, respectively, in our model. Even though these estimates of carbonate chemistry modification by Z. marina and Z. japonica are specific to our experimental conditions, we are able to detect the differential response of TCO2-dependent carbon uptake between the two species, and provide insight for potential OA mitigation by two PNW seagrasses.
Extrapolated Changes in Carbonate Chemistry
One focus of this study was to better understand the OA mitigation potential of seagrass clippings in isolation, and extend those results to various biomass to water volume ratios in an attempt to conceptualize how these attributes of seagrass beds drive carbonate chemistry. While these results are not representative of in situ conditions, by incorporating realistic biomass values, the box model results provide a point of comparison to field based studies and information about photosynthetic effects measured under controlled conditions to those quantifying potential seagrass contribution to a dynamic and complex system. The estimates presented here are considered the maximum potential possible by each species, as photosynthetic rates calculated from leaf segments are likely an overestimate of whole plant photosynthetic rates (Herzka and Dunton, 1997); however, previous studies have shown that empirically derived photosynthetic rates can be similar between leaf segments and whole plants (see Table 2 in Lee et al., 2007; Table 6 in Shafer and Kaldy, 2014). It is important to note that the predicted changes in carbonate chemistry are derived from our measured mg chl:gDW−1 ratio (Equation 5), however, we do not use gDW normalized photosynthetic rates as the variance was extremely high within treatments and resulted in non-significant differences (see Miller, 2016).
When extending our laboratory results of seagrass photosynthetic carbon uptake to changes in carbonate chemistry given specific biomass to water volume ratios, the expected potential change in pH, Ωar, and the substrate-to-inhibitor ratio—[]/[H+]—would be positively affected by seagrass carbon uptake (Figure 5). Estimated increases in pH per hour from this model at a volume corresponding to 1 m depth over 6 h result in maximum pH changes from 0.09 to 0.73 under low and high TCO2 conditions for Z. japonica (Figure 5). Since Z. japonica photosynthesis is carbon sensitive, the more realistic pH change is likely somewhere in the middle and more accurately predicted by the mean TCO2 treatment, which would result in a pH change of 0.37 over 6 h. This would not be a concern for Z. marina, however, as we did not find sensitivity to TCO2 over the range tested in this study. These rates are based on maximum photosynthetic rates, but also on conservative assumptions about short residence time in seagrass beds. Where residence time is longer, chemical changes can be compounded and result in large swings, or the modified water can be exported to other locales. Observed diurnal change of pH in whole seagrass systems ranged from 0.2 to 0.7 units over several hours measured within, or directly above, shallow seagrass beds at a depth no greater than 12 m (Frankignoulle and Bouquegneau, 1990; Invers et al., 1997; Unsworth et al., 2012; Hendriks et al., 2014). We estimated diurnal increases in Ωar from 0.59 to 1.6 at a 1 m depth over 6 h under low and high TCO2 conditions for Z. japonica (Figure 5). Model predictions from an extensive data set of Indo-Pacific seagrass community metabolism estimated maximum diurnal changes in Ωar to be 2.9 (Unsworth et al., 2012), whereas field based calculations of diurnal changes ranged from 1.38 to 1.67 (Hendriks et al., 2014). At shallower water depths, the higher Indo-Pacific change in Ωar of 2.9 is easily reached under our box model conditions (Figure 5). The congruence of these estimates illustrates how the laboratory studies presented here corroborate the idea that seagrass meadows can be drivers of locally important changes in carbonate chemistry. We note that the results of our box model should be viewed as context for field results and not as estimates of in situ processes. In order to make accurate predictions of carbonate chemistry variability in seagrass beds, higher resolution in situ studies and whole plant laboratory studies need to be performed.
Photosynthetic Response to TCO2
Based on our results from the TCO2-irradiance model (Equation 3), Z. japonica increased its Pmax proportionally across TCO2 treatments—where the slope (β) of the linear TCO2 response was highly significant (p = < 0.001). Conversely, we were unable to detect any positive response of Z. marina Pmax with increasing TCO2. That is according to the TCO2-irradiance model, the slope of the linear TCO2 response was non-significant and slightly negative (p = 0.327, β = −0.054). Due to the lack of any significant trend and high variance within treatments, we suggest that Z. marina Pmax was not positively affected by increasing TCO2 under our study conditions. Our findings here are somewhat contradictory as most studies have reported Z. marina to have enhanced photosynthetic rates with increasing TCO2 (Beer and Koch, 1996; Thom, 1996; Zimmerman et al., 1997), however, a recent study also found there to be no positive effect of TCO2 on Z. marina photosynthesis up to pCO2 levels of 2000 μatm (Pajusalu et al., 2016).
One reason for the different result in this study regarding Z. marina response to increasing TCO2 may be due to the range of concentrations tested. The lowest enriched TCO2 treatment in previous studies was ~25% higher than our highest TCO2 treatment (Thom, 1996 does not give exact numbers, but minimum CO2 increase was 25% higher than ambient), ranging up to 230% times greater than our highest treatment (Beer and Koch, 1996). The first reason for the relatively low TCO2 tested in this study is that ambient seawater from the Salish Sea has lower salinity and, therefore, a lower TCO2 than open ocean values. In addition, the range of TCO2 tested in this study was representative of conditions currently observed in Padilla Bay, not the much greater range in other studies, which were designed to highlight potential physiological responses, not necessarily in situ conditions. The result showing that Z. marina Pmax does not respond to TCO2 in this study may indicate that northern Salish Sea populations are not sensitive to TCO2 at these lower concentrations.
Additionally, the high degree of variability within our treatments may have obscured a positive response. Zimmerman et al. (1997) showed that Z. marina increased its Pmax 225% with an exposure to TCO2 77% higher than their ambient treatment (from 2,074 to 3,673 μmol kg−1). Over this range of TCO2, a linear relationship has been observed between Pmax and TCO2 (Beer and Koch, 1996). The linear equation derived from Zimmerman et al. (1997) can be extrapolated down to the range in this study (1,770–2,051 μmol kg−1), which would therefore predict that the 18% increase in TCO2 between our lowest and highest TCO2 treatments would induce a 55% increase in Z. marina Pmax. Given that the coefficient of variation for Z. marina Pnet at, or above, Ek ranged from 30 to 60% over all initial TCO2 treatments, any small positive responses to TCO2 by Z. marina may likely be concealed by the variance—assuming an extrapolation of the Zimmerman et al. (1997) data is accurate given this is outside of the bounds tested. Physiological and methodological factors contributing to the large variance within treatments may be a result of, insufficient incubation period, variance in illumination, shoot to shoot variability of the photosynthetic apparatus, inefficiencies in chlorophyll extraction from leaf segments, or propagation of a diffusive boundary layer due to periodic rather than continuous stirring over the 90+ min incubation time, which would increase the variability of the relative TCO2 conditions experienced by the leaf segment compared to the entire vial.
Interestingly, the increase in Z. japonica Pmax was ~50% over an 18% increase in TCO2, which coincidently is very close to the predicted increase from the linear equation derived from Zimmerman et al. (1997). This robust response by Z. japonica was observed despite a coefficient of variation in Pnet at, or above, Ek identical to that of Z. marina (30–60%). This is the first time that a response in the photosynthetic rate of Z. japonica to TCO2 has been documented, to our knowledge. Previous research has shown that Z. japonica photosynthesis is more sensitive to light and salinity (Shafer et al., 2011; Shafer and Kaldy, 2014) than is Z. marina photosynthesis (Hellblom and Björk, 1999; Shafer and Kaldy, 2014). Given that the two species appear to express different physiological response to environmental factors, it is likely that the utilization of TCO2 would also be inherently different. The differential response of Pmax to TCO2 between species may be due to the mechanism by which TCO2 is utilized for photosynthesis. Previous research suggests that Z. marina utilization is saturated at pH ranging from 7.5 to 8.5 (Invers et al., 2001), which was the range of pH in our study (Table 1). Although we did not specifically measure independent HCO3- and CO2-uptake, an increase in in addition to CO2 may be one mechanism that explains such a robust response by Z. japonica to TCO2; however, further studies are needed to examine Z. japonica's photosynthetic response to HCO3- and CO2 independently.
Species-Specific Photosynthetic Rates
The relative difference between Z. marina and Z. japonica photosynthetic rates reported in our study are similar to previous findings, but differ in magnitude (Figure 1). The large degree of variability around the mean estimated model fit for Z. japonica photosynthesis can be partially explained by the increasing response of photosynthesis to TCO2 (Figure 2). We reiterate, however, that the variability in our respiration measurements may somewhat lessen the predictive power of model estimates, particularly the photosynthetic efficiency, as the initial slope of the photosynthetic-irradiance curve is dependent on robust respiration values. For this reason, we have focused specifically on only our Pmax results when interpreting photosynthetic carbon uptake induced changes on carbonate chemistry. A likely reason for the mix of positive and negative TCO2 fluxes by our leaf segments in dark vials may be due to a short incubation time, volume of media to leaf segment ratio, or internal seagrass biorhythms of photosynthetic and respiration cycles. Similar to our findings, Shafer and Kaldy (2014) found that central Oregon populations of Z. japonica have a Pmax that is ~3x greater than Z. marina when exposed to the same light conditions; however, the chlorophyll standardized rates reported in that study were considerably lower than the rates found in this study. The differing magnitude of rates suggest that other factors such as organization of the photosynthetic package within seagrass tissue may have a significant impact on photosynthetic rates rather than chlorophyll pigment concentration alone. A multitude of environmental factors such as intertidal location, canopy density, age of shoot and leaf, time of year, and acclimatization to epiphytic growth can affect chlorophyll pigment concentration and the photoacclimation amongst shoots and along leaves, thus leading to drastically different mg chl:gDW−1 ratios (Dennison and Alberte, 1986; Durako and Kunzelman, 2002; Enríquez et al., 2002; Major and Dunton, 2002; Cummings and Zimmerman, 2003; Drake et al., 2003; Larkum et al., 2006 and references therein). Any of these factors may be responsible for the lower mg chl:gDW−1 ratio and dissimilar photosynthetic rates in our study. In addition, the Z. marina samples were collected at the upper limit of their distribution, potentially affecting the physiology and phenotypic expression of Z. marina at this location. Local acclimatization to in situ temperature and salinity can also impact photosynthetic rates via osmotic stress and changes in the photosynthesis-respiration ratio (Kenneth and Short, 2006 and references therein). In addition, our study examined photosynthetic rates by measuring the change in TCO2, which to our knowledge, has not been done before in the lab and rarely done in the field despite the robustness of the method (Silva et al., 2009). The photosynthetic quotient (O2/CO2), while assumed to be unity or close to in many studies, is based on community metabolism in seagrass beds or meadows (Oviatt et al., 1986; Leuschner and Rees, 1993; Mateo et al., 2001; Martin et al., 2005). Measuring TCO2 rather than O2 may result in photosynthetic rates that are dissimilar if the photosynthetic quotient is not close to unity under these conditions. That is, given the higher photosynthetic rates found in this study, the change in CO2 per O2 would have to be much lower in seagrass communities than what was measured in our vials. Alternatively, differences in chlorophyll extraction methods, or inefficient extraction may have resulted in the higher photosynthetic rates found in our study. Additionally, recycling and movement of gases within the lacunal system are not well-understood (Mateo et al., 2001), further convoluting the comparison of instantaneous O2 production and CO2 uptake. It may be that deriving photosynthesis by measuring TCO2 is not as robust as the O2 normative, but due to the lack of studies measuring seagrass photosynthesis with TCO2, this remains uncertain. Studies which capture O2 production and CO2 uptake would be best suited to determine the relative advantage of each in determining the interactions between carbonate chemistry and seagrass photosynthesis.
Variations of Carbonate Chemistry in Seagrass Beds
While this study provides a point of reference for how seagrass beds can modify carbonate chemistry, determining the effects of macrophytes on acidification is challenging due to the extreme spatial and temporal variability of carbonate chemistry in these zones (Hendriks et al., 2014, 2015; Krause-Jensen et al., 2015; Challener et al., 2016). A multitude of factors such as seagrass epiphyte communities, heterotrophic respiration, tidal exchange, groundwater flux, and riverine input all contribute in modifying carbonate chemistry on various spatial and temporal scales. For example, differences in seagrass shoot density over a given area result in different mixing rates and flow regimes, which will further shift the carbonate chemistry of water parcels that have been modified by photosynthetic carbon uptake (Peterson et al., 2004; Koch et al., 2006; Marbá et al., 2006; Hendriks et al., 2014). In addition, variations in chlorophyll content along the leaf and amongst shoots results in differential photosynthetic rates and carbon uptake within the seagrass canopy, thereby creating disparate water parcels with respect to TCO2 concentration on various spatial scales. These various interactions between water flow within a seagrass bed, irradiance, and TCO2 are some of the determining factors of carbon assimilation and uptake (McPherson et al., 2015) and, therefore, directly affect the scale of OA mitigation by seagrasses via the formation of microzones with differential carbonate chemistry. Because organisms vulnerable to OA are more sensitive at particular life-stages and over hourly durations, the scale of carbonate chemistry variability (i.e., magnitude and duration of low saturation state and pH) is critical to understand when determining organismal resilience to OA (Kurihara, 2008; Barton et al., 2012; Hettinger et al., 2012; Onitsuka et al., 2014; Waldbusser et al., 2015; Miller and Waldbusser, 2016). Therefore, in order to elucidate a more nuanced amelioration of acidification by seagrasses, it will be necessary to conduct in situ studies that can effectively capture all the drivers of the carbonate system in spatiotemporal context.
Conclusion
A comparison of the photosynthetic potential between Z. marina and Z. japonica has implications for elucidating the contribution each species has on the carbonate system. Z. japonica exhibits a strong increase in photosynthetic rate in response to increasing TCO2, while a similar response from Z. marina could not be identified. In the intertidal zone where species overlap occurs, our results indicate that Z. japonica also has a 3-fold greater photosynthetic potential than Z. marina when normalized to chlorophyll. By measuring photosynthetic potential as a change in TCO2 and utilizing measured mg chl:gDW−1 in addition to estimated m2 biomass of each species, our results were extended to conceptualize how these additional attributes of biomass to depth ratios in seagrass beds affect hourly changes in carbonate chemistry. Based on our findings, Z. japonica appears to be better suited to mitigate OA on a per chlorophyll basis given its higher photosynthetic rate and efficiency and enhanced response to increases in TCO2. Our study illuminates the potential of PNW populations of Z. marina and Z. japonica to modify the carbonate system, and provides a direct comparison of photosynthetic potential when exposed to varying levels of TCO2. This is an initial step in attempting to determine the OA mitigation potential of seagrass systems in the PNW, where quantitative estimates can aid management practices and provide a better understanding for the local initiatives that aim to protect Washington state's aquaculture resources (Blue ribbon panel on OA 2012).
Author Contributions
CM conceptualized and designed the experiment with modifications directed by BL and SY. CM led the writing of the paper with contributions by BL and SY. CM performed all data analysis, with statistical analysis supported by SY. BL provided substantial support for utilization of model projections. All authors reviewed and contributed to the writing of the final manuscript.
Funding
This work was supported by the Padilla Bay National Estuarine Research Reserve assistantship. Funding granted by the Padilla Bay foundation, Jude Apple and Sharon Riggs: Contract/Grant # Borman-01-2015.
Conflict of Interest Statement
The authors declare that the research was conducted in the absence of any commercial or financial relationships that could be construed as a potential conflict of interest.
Acknowledgments
The authors would like to thank David Shull for thoughtful interpretation of our results. CM would like to thank Katherina L. Schoo for assistance with the ocean acidification experimental system. CM would also like to thank Rachel Blyth, Melissa Ciesielski, Taylor Clement, Rosie Gradoville, and Anne Harmann who were integral for carrying out the experiments.
References
Backman, T. (1991). Genotypic and phenotypic variability of Zostera marina on the west coast. Can. J. Bot. Rev. Can. Bot. 69, 1361–1371. doi: 10.1139/b91-176
Barton, A., Hales, B., Waldbusser, G. G., Langdon, C., and Feely, R. A. (2012). The Pacific oyster, Crassostrea gigas, shows negative correlation to naturally elevated carbon dioxide levels: implications for near-term ocean acidification effects. Limnol. Oceanogr. 57, 698–710. doi: 10.4319/lo.2012.57.3.0698
Baumann, H., Wallace, R. B., Tagliaferri, T., and Gobler, C. J. (2015). Large natural pH, CO2 and O2 fluctuations in a temperate tidal salt marsh on diel, seasonal, and interannual time scales. Estuar. Coasts 38, 220–231. doi: 10.1007/s12237-014-9800-y
Beer, S., and Koch, E. (1996). Photosynthesis of marine macroalgae and seagrasses in globally changing CO2 environments. Mar. Ecol. Prog. Ser. 141, 199–204. doi: 10.3354/meps141199
Bulthuis, D. A. (2013). The Ecology of Padilla Bay, Washington: an Estuarine Profile of a National Estuarine Research Reserve. Mount Vernon, WA: Washington State Department of Ecology, Padilla Bay National Estuarine Research Reserve. Available online at: www.padillabay.gov/researchrep/profile.asp
Cai, W. J. (2011). “Estuarine and coastal ocean carbon paradox: CO2 sinks or sites of terrestrial carbon incineration?,” in Annual Review of Marine Science, Vol. 3, eds C. A. Carlson and S. J. Giovannoni (Palo Alto, CA: Annual Reviews), 123–145.
Campbell, J. E., and Fourqurean, J. W. (2013). Mechanisms of bicarbonate use influence the photosynthetic carbon dioxide sensitivity of tropical seagrasses. Limnol. Oceanogr. 58, 839–848. doi: 10.4319/lo.2013.58.3.0839
Challener, R. C., Robbins, L. L., and McClintock, J. B. (2016). Variability of the carbonate chemistry in a shallow, seagrass-dominated ecosystem: implications for ocean acidification experiments. Mar. Freshw. Res. 67, 163–172. doi: 10.1071/MF14219
Chung, I. K., Beardall, J., Mehta, S., Sahoo, D., and Stojkovic, S. (2011). Using marine macroalgae for carbon sequestration: a critical appraisal. J. Appl. Phycol. 23, 877–886. doi: 10.1007/s10811-010-9604-9
Ciais, P. C., Sabine, G., Bala, L., Bopp, V., Brovkin, J., Canadell, A., et al. (2013). “Carbon and other biogeochemical cycles,” in Climate Change 2013: The Physical Science Basis. Contribution of Working Group I to the Fifth Assessment Report of the Intergovernmental Panel on Climate Change, eds Stocker, T. F. D. Qin, G. K. Plattner, M. Tignor, S. K. Allen, J. Boschung, A. Nauels, Y. Xia, V. Bex, and P. M. Midgley (Cambridge; New York, NY: Cambridge University Press), 465–570.
Cox, T. E., Gazeau, F., Alliouane, S., Hendriks, I. E., Mahacek, P., Le Fur, A., et al. (2016). Effects of in situ CO2 enrichment on structural characteristics, photosynthesis, and growth of the Mediterranean seagrass Posidonia oceanica. Biogeosciences 13, 2179–2194. doi: 10.5194/bg-13-2179-2016
Cummings, M. E., and Zimmerman, R. C. (2003). Light harvesting and the package effect in the seagrasses Thalassia testudinum Banks ex König and Zostera marina L.: optical constraints on photoacclimation. Aquat. Bot. 75, 261–274. doi: 10.1016/S0304-3770(02)00180-8
Dennison, W., and Alberte, R. (1986). Photoadaptation and growth of Zostera marina L. (eelgrass) transplants along a depth gradient. J. Exp. Mar. Biol. Ecol. 98, 265–282. doi: 10.1016/0022-0981(86)90217-0
Dickson, A., and Millero, F. (1987). A comparison of the equilibrium constants for the dissociation of carbonic acid in seawater Media. Deep Sea Res. Oceanogr. Res. Pap. 34, 1733–1743. doi: 10.1016/0198-0149(87)90021-5
Dickson, A. G., Sabine, C. L., and Christian, J. R. (2007). Guide to Best Practices for Ocean CO2 Measurements, Vol. 3. Sidney, BC: PICES Special Publication.
Doney, S. C., Fabry, V. J., Feely, R. A., and Kleypas, J. A. (2009). Ocean acidification: the other CO2 problem. Annu. Rev. Mar. Sci. 1, 169–192. doi: 10.1146/annurev.marine.010908.163834
Drake, L. A., Dobbs, F. C., and Zimmerman, R. C. (2003). Effects of epiphyte load on optical properties and photosynthetic potential of the seagrasses Thalassia testudinum Banks ex König and Zostera marina L. Limnol. Oceanogr. 48, 456–463. doi: 10.4319/lo.2003.48.1_part_2.0456
Duarte, C. M., Hendriks, I. E., Moore, T. S., Olsen, Y. S., Steckbauer, A., Ramajo, L., et al. (2013). Is ocean acidification an open-ocean syndrome? Understanding anthropogenic impacts on seawater pH. Estuar. Coasts 36, 221–236. doi: 10.1007/s12237-013-9594-3
Duarte, C. M., Marbà, N., Gacia, E., Fourqurean, J. W., Beggins, J., Barron, C., et al. (2010). Seagrass community metabolism: assessing the carbon sink capacity of seagrass meadows. Glob. Biogeochem. Cycles 24:GB4032. doi: 10.1029/2010gb003793
Duarte, C. M., Middelburg, J. J., and Caraco, N. (2005). Major role of marine vegetation on the oceanic carbon cycle. Biogeosciences 2, 1–8. doi: 10.5194/bg-2-1-2005
Dumbauld, B. R., and McCoy, L. M. (2015). Effect of oyster aquaculture on seagrass Zostera marina at the estuarine landscape scale in Willapa Bay, Washington (USA). Aquac. Environ. Interact. 7, 29–47. doi: 10.3354/aei00131
Durako, M. J., and Kunzelman, J. I. (2002). Photosynthetic characteristics of Thalassia testudinum measured in situ by pulse-amplitude modulated (PAM) fluorometry: methodological and scale-based considerations. Aquat. Bot. 73, 173–185. doi: 10.1016/S0304-3770(02)00020-7
Ekstrom, J. A., Suatoni, L., Cooley, S. R., Pendleton, L. H., Waldbusser, G. G., Cinner, J. E., et al. (2015). Vulnerability and adaptation of US shellfisheries to ocean acidification. Nat. Clim. Change 5, 207–214. doi: 10.1038/nclimate2508
Enríquez, S., Merino, M., and Iglesias-Prieto, R. (2002). Variations in the photosynthetic performance along the leaves of the tropical seagrass Thalassia testudinum. Mar. Biol. 140, 891–900. doi: 10.1007/s00227-001-0760-y
Fassbender, A. J., Sabine, C. L., and Feifel, K. M. (2016). Consideration of coastal carbonate chemistry in understanding biological calcification. Geophys. Res. Lett. 43:2016GL068860. doi: 10.1002/2016GL068860
Feely, R. A., Alin, S. R., Newton, J., Sabine, C. L., Warner, M., Devol, A., et al. (2010). The combined effects of ocean acidification, mixing, and respiration on pH and carbonate saturation in an urbanized estuary. Estuar. Coast. Shelf Sci. 88, 442–449. doi: 10.1016/j.ecss.2010.05.004
Feely, R. A., Sabine, C. L., Hernandez-Ayon, J. M., Ianson, D., and Hales, B. (2008). Evidence for upwelling of corrosive acidified water onto the continental shelf. Science 320, 1490–1492. doi: 10.1126/science.1155676
Ferraro, S. P., and Cole, F. A. (2012). Ecological periodic tables for benthic macrofaunal usage of estuarine habitats: Insights from a case study in Tillamook Bay, Oregon, U.S.A. Estuar. Coast. Shelf Sci. 102, 70–83. doi: 10.1016/j.ecss.2012.03.009
Fourqurean, J. W., Duarte, C. M., Kennedy, H., Marbà, N., Holmer, M., Angel Mateo, M., et al. (2012). Seagrass ecosystems as a globally significant carbon stock. Nat. Geosci. 5, 505–509. doi: 10.1038/ngeo1477
Frankignoulle, M., and Bouquegneau, J. (1990). Daily and yearly variations of total inorganic carbon in a productive coastal Area. Estuar. Coast. Shelf Sci. 30, 79–89. doi: 10.1016/0272-7714(90)90078-6
Gattuso, J. P., Frankignoulle, M., and Wollast, R. (1998). Carbon and carbonate metabolism in coastal aquatic ecosystems. Annu. Rev. Ecol. Syst. 29, 405–434. doi: 10.1146/annurev.ecolsys.29.1.405
Grantham, B. A., Chan, F., Nielsen, K. J., Fox, D. S., Barth, J. A., Huyer, A., et al. (2004). Upwelling-driven nearshore hypoxia signals ecosystem and oceanographic changes in the northeast Pacific. Nature 429, 749–754. doi: 10.1038/nature02605
Harris, K. E., DeGrandpre, M. D., and Hales, B. (2013). Aragonite saturation state dynamics in a coastal upwelling zone. Geophys. Res. Lett. 40, 2720–2725. doi: 10.1002/grl.50460
Harrison, P., and Bigley, R. (1982). The recent introduction of the seagrass Zostera japonica Aschers. and Graebn. to the Pacific coast of North America. Can. J. Fish. Aquat. Sci. 39, 1642–1648. doi: 10.1139/f82-221
Harrison, P. G. (1982). Spatial and temporal patterns in abundance of two intertidal seagrasses, Zostera americana den hartog and Zostera marina L. Aquat. Bot. 12, 305–320. doi: 10.1016/0304-3770(82)90024-9
Hauri, C., Gruber, N., McDonnell, A. M. P., and Vogt, M. (2013). The intensity, duration, and severity of low aragonite saturation state events on the California continental shelf. Geophys. Res. Lett. 40, 3424–3428. doi: 10.1002/grl.50618
Hellblom, F., and Björk, M. (1999). Photosynthetic responses in Z. ostera marina to decreasing salinity, inorganic carbon content and osmolality. Aquat. Bot. 65, 97–104. doi: 10.1016/S0304-3770(99)00034-0
Hendriks, I. E., Duarte, C. M., Olsen, Y. S., Steckbauer, A., Ramajo, L., Moore, T. S., et al. (2015). Biological mechanisms supporting adaptation to ocean acidification in coastal ecosystems. Estuar. Coast. Shelf Sci. 152, A1–A8. doi: 10.1016/j.ecss.2014.07.019
Hendriks, I. E., Olsen, Y. S., Ramajo, L., Basso, L., Steckbauer, A., Moore, T. S., et al. (2014). Photosynthetic activity buffers ocean acidification in seagrass meadows. Biogeosciences 11, 333–346. doi: 10.5194/bg-11-333-2014
Herzka, S. Z., and Dunton, K. H. (1997). Seasonal photosynthetic patterns of the seagrass Thalassia testudinum in the western Gulf of Mexico. Mar. Ecol. Prog. Ser. 152, 103–117. doi: 10.3354/meps152103
Hettinger, A., Sanford, E., Hill, T. M., Russell, A. D., Sato, K. N. S., Hoey, J., et al. (2012). Persistent carry-over effects of planktonic exposure to ocean acidification in the Olympia oyster. Ecology 93, 2758–2768. doi: 10.1890/12-0567.1
Hönisch, B., Ridgwell, A., Schmidt, D. N., Thomas, E., Gibbs, S. J., Sluijs, A., et al. (2012). The Geological record of ocean acidification. Science 335, 1058–1063. doi: 10.1126/science.1208277
Invers, O., Romero, J., and Pérez, M. (1997). Effects of pH on seagrass photosynthesis: a laboratory and field assessment. Aquat. Bot. 59, 185–194.
Invers, O., Zimmerman, R. C., Alberte, R. S., Perez, M., and Romero, J. (2001). Inorganic carbon sources for seagrass photosynthesis: an experimental evaluation of bicarbonate use in species inhabiting temperate waters. J. Exp. Mar. Biol. Ecol. 265, 203–217. doi: 10.1016/S0022-0981(01)00332-X
Jassby, A. D., and Platt, T. (1976). Mathematical formulation of the relationship between photosynthesis and light for phytoplankton. Limnol. Oceanogr. 21, 540–547. doi: 10.4319/lo.1976.21.4.0540
Kaldy, J. E. (2006). Production ecology of the non-indigenous seagrass, dwarf eelgrass (Zostera japonica Ascher. & Graeb.), in a Pacific Northwest estuary, USA. Hydrobiologia 553, 201–217. doi: 10.1007/s10750-005-5764-z
Kaldy, J. E., Shafer, D. J., and Magoun, A. D. (2015). Duration of temperature exposure controls growth of Zostera japonica: implications for zonation and colonization. J. Exp. Mar. Biol. Ecol. 464, 68–74. doi: 10.1016/j.jembe.2014.12.015
Kenneth, A., and Short, F. T. (2006). “Zostera: biology, ecology, and management,” in Seagrasses: Biology, Ecology and Conservation, eds A. W. DLarkum, R. J. Orth, and C. M. Duarte (Dordrecht: Springer), 361–386.
Koch, E. W., Ackerman, J., Verduin, J., and van Keulen, M. (2006). “Fluid dynamics in seagrass ecology—from molecules to ecosystems,” in Seagrasses: Biology, Ecology and Conservation, eds A. W. D. Larkum, R. J. Orth, and C. M. Duarte (Dordrecht: Springer), 193–225.
Koch, M., Bowes, G., Ross, C., and Zhang, X.-H. (2013). Climate change and ocean acidification effects on seagrasses and marine macroalgae. Glob. Change Biol. 19, 103–132. doi: 10.1111/j.1365-2486.2012.02791.x
Krause-Jensen, D., Duarte, C. M., Hendriks, I. E., Meire, L., Blicher, M. E., Marbà, N., et al. (2015). Macroalgae contribute to nested mosaics of pH variability in a sub-Arctic fjord. Biogeosciences Discuss 12, 4907–4945. doi: 10.5194/bgd-12-4907-2015
Kroeker, K. J., Kordas, R. L., Crim, R., Hendriks, I. E., Ramajo, L., Singh, G. S., et al. (2013). Impacts of ocean acidification on marine organisms: quantifying sensitivities and interaction with warming. Glob. Change Biol. 19, 1884–1896. doi: 10.1111/gcb.12179
Kroeker, K. J., Kordas, R. L., Crim, R. N., and Singh, G. G. (2010). Meta-analysis reveals negative yet variable effects of ocean acidification on marine organisms. Ecol. Lett. 13, 1419–1434. doi: 10.1111/j.1461-0248.2010.01518.x
Kurihara, H. (2008). Effects of CO2 driven ocean acidification on the early developmental stages of invertebrates. Mar. Ecol. Prog. Ser. 373, 275–284. doi: 10.3354/meps07802
Larkum, A. W. D., Drew, E. A., and Ralph, P. J. (2006). “Photosynthesis and metabolism,” in Seagrasses: Biology, Ecology and Conservation, eds A. W. D. Larkum, R. J. Orth, and C. M. Duarte (Dordrecht: Springer), 323–345.
Lee, K. S., Park, S. R., and Kim, Y. K. (2007). Effects of irradiance, temperature, and nutrients on growth dynamics of seagrasses: a review. J. Exp. Mar. Biol. Ecol. 350, 144–175. doi: 10.1016/j.jembe.2007.06.016
Leuschner, C., and Rees, U. (1993). CO2 gas exchange of two intertidal seagrass species, Zostera marina L. and Zostera noltii Hornem., during emersion. Aquat. Bot. 45, 53–62.
Lorenzen, C. J. (1966). A method for the continuous measurement of in vivo chlorophyll concentration. Deep Sea Res. Oceanogr. Abstr. 13, 223–227.
Love, B. A., O'Brien, C., and Bohlmann, H. (2016). “Photosynthetically driven cycles produce extreme pCO2 variability in a large eelgrass meadow and readily measured proxies can be used to estimate these changes,” in (EC54A–1311) 2016 Ocean Sciences Meeting, AGU/ASLO/TOS (New Orleans, LA).
Love, B. A., Olson, M. B., and Wuori, T. (2017). Technical Note: a minimally-invasive experimental system for pCO2 manipulation in plankton cultures using passive gas exchange (Atmospheric Carbon Control Simulator). Biogeosciences Discuss. 2016, 1–19. doi: 10.5194/bg-2016-502
Mach, M. E., Wyllie-Echeverria, S., and Chan, K. M. A. (2014). Ecological effect of a nonnative seagrass spreading in the Northeast Pacific: a review of Zostera japonica. Ocean Coast. Manag. 102, 375–382. doi: 10.1016/j.ocecoaman.2014.10.002
Major, K. M., and Dunton, K. H. (2002). Variations in light-harvesting characteristics of the seagrass, Thalassia testudinum: evidence for photoacclimation. J. Exp. Mar. Biol. Ecol. 275, 173–189. doi: 10.1016/S0022-0981(02)00212-5
Manzello, D. P., Enochs, I. C., Melo, N., Gledhill, D. K., and Johns, E. M. (2012). Ocean acidification refugia of the Florida reef tract. PLoS ONE 7:e41715. doi: 10.1371/journal.pone.0041715
Marbà, N., Arias-Ortiz, A., Masque, P., Kendrick, G. A., Mazarrasa, I., Bastyan, G. R., et al. (2015). Impact of seagrass loss and subsequent revegetation on carbon sequestration and stocks. J. Ecol. 103, 296–302. doi: 10.1371/journal.pone.0041715
Marbá, N., Holmer, M., Gacia, E., and Barrón, C. (2006). “Seagrass beds and coastal biogeochemistry,” in Seagrasses: Biology, Ecology and Conservation, eds A. W. D. Larkum, R. J. Orth, and C. M. Duarte (Dordrecht: Springer), 135–157.
Martin, S., Clavier, J., Guarini, J. M., Chauvaud, L., Hily, C., Grall, J., et al. (2005). Comparison of Zostera marina and maerl community metabolism. Aquat. Bot. 83, 161–174. doi: 10.1016/j.aquabot.2005.06.00
Mateo, M. A., Renom, P., Hemminga, M. A., and Peene, J. (2001). Measurement of seagrass production using the 13C stable isotope compared with classical O2 and 14C methods. Mar. Ecol. Prog. Ser. 223, 157–165. doi: 10.3354/meps223157
McLeod, E., Chmura, G. L., Bouillon, S., Salm, R., Bjork, M., Duarte, C. M., et al. (2011). A blueprint for blue carbon: toward an improved understanding of the role of vegetated coastal habitats in sequestering CO2. Front. Ecol. Environ. 9, 552–560. doi: 10.1890/110004
McPherson, M. L., Zimmerman, R. C., and Hill, V. J. (2015). Predicting carbon isotope discrimination in eelgrass (Zostera marina L.) from the environmental parameters—light, flow, and [DIC]. Limnol. Oceanogr. 60, 1875–1889. doi: 10.1002/lno.10142
Mehrbach, C., Culberso, C. H., Hawley, J., and Pytkowic, R. M. (1973). Measurement of apparent dissociation constants of carbonic acid in seawater at atmospheric pressure. Limnol. Oceanogr. 18, 897–907.
Miller, C. A. (2016). Seagrasses (Zostera marina) and (Zostera japonica) Display a Differential Photosynthetic Response to TCO2: Implications for Acidification Mitigation. Master's thesis, Western Washington University.
Miller, C. A., and Waldbusser, G. G. (2016). A post-larval stage-based model of hard clam Mercenaria mercenaria development in response to multiple stressors: temperature and acidification severity. Mar. Ecol. Prog. Ser. 558, 35–49. doi: 10.3354/meps11882
Onitsuka, T., Kimura, R., Ono, T., Takami, H., and Nojiri, Y. (2014). Effects of ocean acidification on the early developmental stages of the horned turban, Turbo cornutus. Mar. Biol. 161, 1127–1138. doi: 10.1007/s00227-014-2405-y
Oviatt, C., Rudnick, D., Keller, A., Sampou, P., and Almquist, G. (1986). A comparison of system (O2 and CO2) and 14C measurements of metabolism. Mar. Ecol. Prog. Ser. 28, 57–67.
Ow, Y. X., Uthicke, S., and Collier, C. J. (2016). Light levels affect carbon utilisation in tropical seagrass under ocean acidification. PLoS ONE 11:e0150352. doi: 10.1371/journal.pone.0150352
Pajusalu, L., Martin, G., Põllumäe, A., and Paalme, T. (2016). The influence of CO2 enrichment on net photosynthesis of seagrass Zostera marina in a brackish water environment. Front. Mar. Sci. 3:239. doi: 10.3389/fmars.2016.00239
Peterson, C. H., Luettich, R. A., Micheli, F., and Skilleter, G. A. (2004). Attenuation of water flow inside seagrass canopies of differing structure. Mar. Ecol. Prog. Ser. 268, 81–92. doi: 10.3354/meps268081
Pierrot, D. E., Lewis, E., and Wallace, D. W. R. (2006). MS Excel Program Developed for CO2 System Calculations. Oak Ridge, TN: Carbon Dioxide Information Analysis Center, Oak Ridge National Laboratory (ORNL).
Poppe, K. (2016). An Ecogeomorphic Model to Assess the Response of Padilla Bay's Eelgrass Habitat to Sea Level Rise. Master's thesis, Western Washington University.
Pörtner, H. O. (2008). Ecosystem effects of ocean acidification in times of ocean warming: a physiologist's view. Mar. Ecol. Prog. Ser. 373, 203–217. doi: 10.3354/meps07768
Ruesink, J. L., Hong, J. S., Wisehart, L., Hacker, S. D., Dumbauld, B. R., Hessing-Lewis, M., et al. (2010). Congener comparison of native (Zostera marina) and introduced (Z. japonica) eelgrass at multiple scales within a Pacific Northwest estuary. Biol. Invasions 12, 1773–1789. doi: 10.1007/s10530-009-9588-z
Shafer, D. J., and Kaldy, J. E. (2014). Comparison of photosynthetic characteristics of the seagrass congeners Zostera marina L. and Zostera japonica Ascher. & Graeb. Aquat. Bot. 112, 91–97. doi: 10.1016/j.aquabot.2013.09.002
Shafer, D. J., Kaldy, J. E., Sherman, T. D., and Marko, K. M. (2011). Effects of salinity on photosynthesis and respiration of the seagrass Zostera japonica: a comparison of two established populations in North America. Aquat. Bot. 95, 214–220. doi: 10.1016/j.aquabot.2011.06.003
Silva, J., Sharon, Y., Santos, R., and Beer, S. (2009). Measuring seagrass photosynthesis: methods and applications. Aquat. Biol. 7, 127–141. doi: 10.3354/ab00173
Sunda, W. G., and Cai, W. J. (2012). Eutrophication induced CO2-acidification of subsurface coastal waters: interactive effects of temperature, salinity, and atmospheric Pco2. Environ. Sci. Technol. 46, 10651–10659. doi: 10.1021/es300626f
Talmage, S. C., and Gobler, C. J. (2009). The effects of elevated carbon dioxide concentrations on the metamorphosis, size, and survival of larval hard clams (Mercenaria mercenaria), bay scallops (Argopecten irradians), and Eastern oysters (Crassostrea virginica). Limnol. Oceanogr. 54, 2072–2080. doi: 10.4319/lo.2009.54.6.2072
Thimijan, R., and Heins, R. (1983). Photometric, radiometric, and quantum light units of measure - a review. HortScience 18, 818–822.
Thom, R. (1990). Spatial and temporal patterns in plant standing stock and primary production in a temperate seagrass system. Bot. Mar. 33, 497–510.
Thom, R. M. (1996). CO2-enrichment effects on eelgrass (Zostera marina L.) and bull kelp (Nereocystis luetkeana (mert.) P & R.). Water Air Soil Pollut. 88, 383–391.
Thomsen, J., Haynert, K., Wegner, K. M., and Melzner, F. (2015). Impact of seawater carbonate chemistry on the calcification of marine bivalves. Biogeosciences 12, 4209–4220. doi: 10.5194/bg-12-4209-2015
Unsworth, R. K. F., Collier, C. J., Henderson, G. M., and McKenzie, L. J. (2012). Tropical seagrass meadows modify seawater carbon chemistry: implications for coral reefs impacted by ocean acidification. Environ. Res. Lett. 7:024026. doi: 10.1088/1748-9326/7/2/024026
Waldbusser, G. G., Hales, B., Langdon, C. J., Haley, B. A., Schrader, P., Brunner, E. L., et al. (2015). Saturation-state sensitivity of marine bivalve larvae to ocean acidification. Nat. Clim. Change 5, 273–280. doi: 10.1088/1748-9326/7/2/024026
Waldbusser, G. G., and Salisbury, J. E. (2014). “Ocean acidification in the coastal zone from an organism's perspective: multiple system parameters, frequency domains, and habitats,” in Annual Review of Marine Science, Vol. 6, eds C. A. Carlson and S. J. Giovannoni (Palo Alto, CA: Annual Reviews), 221–247.
Wallace, R. B., Baumann, H., Grear, J. S., Aller, R. C., and Gobler, C. J. (2014). Coastal ocean acidification: the other eutrophication problem. Estuar. Coast. Shelf Sci. 148, 1–13. doi: 10.1016/j.ecss.2014.05.027
Washington State Blue Ribbon Panel on Ocean Acidification and Ocean Acidification. (2012). From Knowledge to Action, Washington State's Strategic Response. Washington State Department of Ecology. Available online at: https://fortress.wa.gov/ecy/publications/publications/1201015.pdf
Keywords: Zostera marina, Zostera japonica, seagrass, ocean acidification, photosynthetic potential, mitigation, TCO2
Citation: Miller CA, Yang S and Love BA (2017) Moderate Increase in TCO2 Enhances Photosynthesis of Seagrass Zostera japonica, but Not Zostera marina: Implications for Acidification Mitigation. Front. Mar. Sci. 4:228. doi: 10.3389/fmars.2017.00228
Received: 06 December 2016; Accepted: 06 July 2017;
Published: 20 July 2017.
Edited by:
Bernardo Duarte, Mare - Marine and Environmental Sciences Centre, PortugalReviewed by:
Rodrigo Riera, Atlantic Environmental Marine Center (CIMA SL), SpainIris Eline Hendriks, University of the Balearic Islands, Spain
Copyright © 2017 Miller, Yang and Love. This is an open-access article distributed under the terms of the Creative Commons Attribution License (CC BY). The use, distribution or reproduction in other forums is permitted, provided the original author(s) or licensor are credited and that the original publication in this journal is cited, in accordance with accepted academic practice. No use, distribution or reproduction is permitted which does not comply with these terms.
*Correspondence: Cale A. Miller, Y2FtaWxsZXIxNkBhbGFza2EuZWR1
†Present Address: Cale A. Miller, Department of Marine Biology, College of Fisheries and Ocean Sciences Fairbanks, AK, United States