Endangered Green Turtles (Chelonia mydas) of the Northern Mariana Islands: Nesting Ecology, Poaching, and Climate Concerns
 Tammy M. Summers
 Summer L. Martin
 Jessy R. Hapdei
 Joseph K. Ruak3
  T. Todd Jones
- 1Rainbow Connection Research, Saipan, Northern Mariana Islands
- 2Marine Turtle Biology and Assessment Program, Pacific Islands Fisheries Science Center, NOAA Fisheries, Honolulu, HI, United States
- 3Department of Lands and Natural Resources, Division of Fish and Wildlife, Saipan, Northern Mariana Islands
Marine turtles in the western Pacific remain threatened by anthropogenic impacts, but the region lacks long-term biological data for assessing conservation status and trends. The Central West Pacific (CWP) population of green turtles (Chelonia mydas) was listed as Endangered by the U.S. in 2016, highlighting a need to fill existing data gaps. This study focuses on the subset of this population nesting in the Commonwealth of the Northern Mariana Islands (CNMI). Using 11 years of nesting data, we (i) estimate reproductive demographic parameters, (ii) quantify abundance and trends, and (iii) estimate the impacts of anthropogenic threats, such as poaching of nesting females and increasing sand temperatures. In 2006–2016, nesting beach surveys, identification tagging, and nest excavations were conducted on Saipan, and rapid assessments of nesting activity were conducted on Tinian and Rota. On Saipan, temperature data-loggers were deployed inside nests and evidence of poaching (adults and eggs) was recorded. This study documents year-round nesting with a peak in March–July. Nester abundance for the three islands combined was 11.9 ± 5.7 (mean ± standard deviation) females annually, with at least 62.8 ± 35.1 nests observed per year. For 39 tagged individuals, straight carapace length was 95.6 ± 4.5 cm, remigration interval was 4.6 ± 1.3 years, and somatic growth was 0.3 ± 0.2 cm/yr. Reproductive parameter estimates included clutch frequency of 7.0 ± 1.3 nests per female, inter-nesting interval of 11.4 ± 1.0 days, clutch size of 93.5 ± 21.4 eggs, incubation period of 56.7 ± 6.4 days, hatching success of 77.9 ± 27.0%, and emergence success of 69.6 ± 30.3%. Mean nest temperature of 30.9 ± 1.5°C was above the pivotal threshold of 29.0°C for temperature dependent sex determination, suggesting a female bias may already exist. Model results suggest (i) hatching success decreases and embryonic death increases when nests experience maximum temperatures beyond 34.4°C and 33.8°C, respectively, and (ii) embryonic death increases in nests with mean temperatures beyond 31.1°C. On Saipan, 32% of nesters were poached, reducing the annual population growth rate from 11.4 to 7.4%. This study provides the first comprehensive assessment of a nesting green turtle population in the Mariana Archipelago, as well as Micronesia, providing baseline data for the endangered CWP population. Our reproductive demographic data, abundance trends, and anthropogenic threat impact analyses are critical for endangered species management, including assessments of population status and fisheries impacts.
Introduction
Green sea turtles (Chelonia mydas) are ubiquitous throughout tropical and sub-tropical waters and have been of conservation concern for decades (Witherington and Ehrhart, 1989; Jackson et al., 2001; Broderick et al., 2006; Chaloupka et al., 2008; Wallace et al., 2011). Their life-history traits (e.g., long-lived, late maturation, highly migratory) make them vulnerable to anthropogenic impacts on land and at sea (Lutcavage et al., 1997; Jackson et al., 2001; Lewison et al., 2004; McClenachan et al., 2006). While many populations of green turtles have seen remarkable post-exploitation recoveries in recent decades (e.g., 285% increase at Ascension Island and 417% in Costa Rica; Troëng and Rankin, 2005; Broderick et al., 2006) some regions have sub-populations that are still in decline or are too data-limited to assess (McClenachan et al., 2006; Seminoff et al., 2015). A global review of green turtle populations (IUCN 2017, ongoing), recommendations to implement regional management units (Wallace et al., 2010), and a U.S. status review of green turtles (Seminoff et al., 2015) all suggest that distinct populations (e.g., geographically separated, genetically distinct) exist and have differing conservation status and trends based on nesting numbers. Specifically, the recent status review under the U.S. Endangered Species Act suggested that eleven distinct population segments (DPS) exist for green turtles worldwide (Seminoff et al., 2015). Several regions, such as the North Atlantic (i.e., Florida, Gulf of Mexico, and Caribbean) and Central North Pacific (i.e., Hawaii) have populations with recovering trajectories that are listed as Threatened; however, populations in a few regions, including the Central West Pacific (CWP; i.e., Micronesia to the Ogasawara Islands, Japan) are listed as Endangered and have declining or data-limited populations (Seminoff et al., 2015).
Like all marine turtles, green turtles are tied to land for ovipositioning, making them more readily accessible to observation on land than at sea. Counts of nesting turtles and the associated demographic parameters (e.g., remigration interval, clutch frequency, hatching success) are therefore particularly important in assessments of population status and trends. Nesting demographic parameters vary by region and population, but adult females typically return to their natal beach to nest every 2–6 years (Witherington and Ehrhart, 1989; Trono, 1991; Limpus, 2009; Balazs et al., 2015), replenishing energy stores at distant foraging grounds in non-nesting years. In one nesting season, they typically deposit three to six nests (Mortimer and Carr, 1987; Witherington and Ehrhart, 1989; Suganuma et al., 1996) over 2–3 months, returning to the water for 10–20 day inter-nesting intervals (Balazs et al., 2015) to rest and mate between nesting events. Nests contain roughly 80–120 eggs (Pilcher and Basintal, 2000; Limpus, 2009) and take 50–90 days to incubate (Balazs et al., 2015). Ovipositioning on land makes marine turtles highly susceptible to poaching and introduced predators (e.g., pigs, dogs; Lutcavage et al., 1997). The nest environment and sex-determination (i.e., temperature-dependence) makes them vulnerable to climate impacts through population feminization and embryonic death with increasing temperatures (Packard et al., 1977; Miller, 1985; Standora and Spotila, 1985; Mrosovsky, 1994; Ackerman, 1997; Fuentes et al., 2010). Understanding the nesting demographics and threats for each population facilitates assessment of its reproductive output, conservation status, and resilience to anthropogenic impacts.
Green turtles in the insular western Pacific remain impacted by anthropogenic threats (Seminoff et al., 2015), yet a lack of long-term ecological data in the region makes it difficult to assess conservation status and trends (Martin et al., 2016). The CWP population of green turtles was listed as Endangered under the U.S. Endangered Species Act (ESA) because it was data deficient in large portions of its range and exploitation of green turtles in the region was well-known (Seminoff et al., 2015). Prior to this study, the extent to which sea turtles used CNMI terrestrial habitats was based on short-term surveys conducted over 1 year or less (Pultz et al., 1999; Kolinski et al., 2001). Here, we summarize an 11-year research effort to characterize the nesting ecology of green turtles in the Commonwealth of the Northern Mariana Islands (CNMI).
The primary goals of this study were to (i) estimate reproductive demographic parameters of this nesting population (e.g., clutch frequency, remigration interval, and hatching success), (ii) quantify abundance and trends of nesting females, (iii) estimate the impacts of anthropogenic threats, such as poaching and increasing sand temperatures. This study provides the first comprehensive characterization of a nesting green turtle population in the Mariana Archipelago, as well as Micronesia more broadly, and provides a baseline for a portion of the Endangered CWP population. These demographic data serve a critical role in endangered species conservation and management, including assessments of population status, trends, and fisheries impacts.
Methods
Study Area
The CNMI comprises 14 islands of the Mariana Archipelago, located in the western Pacific Ocean along the eastern boundary of the Philippine Sea (Figure 1). This study focuses on the southernmost islands of the CNMI (Saipan, Tinian, and Rota), comprising 6% of the nesting sites for the CWP DPS. These tropical islands are located approximately 2,200 km east of the Philippines and 2,300 km southeast of Japan. Saipan (15.25°N, 145.75°E) is 122 km2 and hosts 89% of CNMI residents (48,220 people; CNMI Dept. Of Commerce 2010). Tinian (15.00°N, 145.62°E) hosts the next largest population of 3,136 residents (CNMI Dept. Of Commerce 2010) on 102 km2. Rota (14.15°N, 145.21°E) is 85 km2 and supports 2,527 residents (CNMI Dept. Of Commerce 2010).
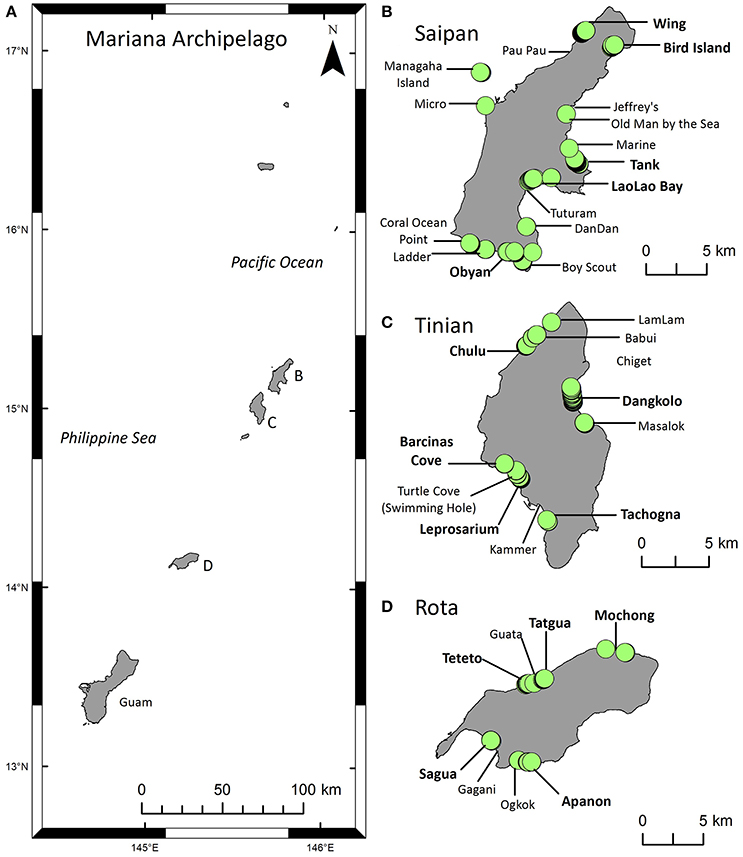
Figure 1. Maps of the study area and green turtle (Chelonia mydas) nesting activity. (A) The Mariana Archipelago includes Guam at the southern end and the Commonwealth of the Northern Mariana Islands (CNMI) to the north. This study focuses on the southern CNMI islands of Saipan, Tinian, and Rota (B–D) where the majority of the CNMI human population lives. (B–D) Locations of index beaches (bold) and non-index beaches surveyed for nesting activity from 2006 to 2016. Green circles indicate locations of nests or other evidence of nesting activity recorded during beach surveys. The Supplementary Material contains a list of these sites.
These islands have a distinct rainy (typhoon) season in July-November and a dry season in January-May (Carruth, 2003). Mean rainfall is 200 cm/yr and mean temperature is 20–32°C (Stafford et al., 2002). The beaches are primarily made of medium to coarse-grained calcareous sand, gravel, and coral rubble (Eldredge and Randall, 1980). In a few places, streams flow from high, interior lands to the coastline, where they deposit volcanic material (Eldredge, 1983) and create finer, darker beach sediments (e.g., Apanon beach on Rota). Beach length ranges from 0.01 to 3.35 km, and beaches are often narrow and segmented into small pockets by raised limestone (Eldredge, 1983). Saipan has 26 beaches of various sizes including the largest beaches of the three islands, Tinian has 13 beaches all < 0.5 km in length (Pultz et al., 1999), and Rota has 16 small pocket beaches. This study included five index beaches on each island, plus various non-index beaches per island (Figure 1, Supplementary Table 1).
Nesting Surveys
Surveys to monitor nesting activity and nester abundance were conducted by local biologists at index and non-index beaches (Figure 1). A “survey” includes monitoring effort conducted on a single beach in a single day (or overnight); five beaches surveyed in 1 day represents five surveys. Non-index beaches were surveyed intermittently, primarily when there were public reports of nesting activity. On Saipan, where the field team was located, index beaches were surveyed as regularly as possible from 2006 to 2016, both diurnally to record all nesting activity and nocturnally to tag nesting females. Survey effort fluctuated annually, with diurnal surveys typically conducted 2–5 days per week over 6–12 months per year. Surveys on Rota and Tinian (2009–2016) were limited to diurnal rapid assessments (1–5 days each) conducted 1–2 times per year toward the end of the nesting season, and rare nocturnal tagging surveys. See Supplementary Table 1 for a summary of the years and locations of data collection incorporated into each metric described below.
Diurnal surveys were performed on foot during morning hours (06:00–11:30) along the edge of vegetation and high tide lines. All turtle crawls from the previous night(s) were recorded. Species and crawl identification followed Pritchard and Mortimer (1999) and the “Sea Turtle Identification Key” (www.seaturtle.org 2005). Nesting and non-nesting emergences were differentiated by examining crawl signs (e.g., presence/absence of escarpment, primary/secondary body pits, and thrown sand) and verifying the presence of eggs in suspected nests (Schroeder and Murphy, 1999). On Saipan index beaches, body pits and abandoned egg chambers were recorded as non-nesting emergences only if there were fresh tracks accompanying them. On Rota and Tinian, signs of non-nesting emergence were recorded even when fresh tracks were not present, as tracks become weathered over time and surveys were infrequent. Locations of nests and non-nesting emergences were recorded using a handheld GPS device.
Nocturnal tagging surveys were conducted during anticipated emergence periods. Nesters were tagged and measured after they completed oviposition and began backfilling the nest with sand. Turtles were double-marked with either titanium (Stockbrands Co. Pty Ltd, large size) or Inconel tags (National Band & Tag Co, 681C), with one tag attached proximally and adjacent to the first large scale on the posterior edge of each front flipper (Balazs, 1999). Passive integrated transponder (PIT) tags were applied from March 2009 onward. Turtles' flippers were scanned for the presence of PIT tags with a Biomark Pocket Reader PIT tag scanner. If no PIT tags were found, then a single PIT tag was injected subcutaneously into one of the hind flippers using a 12-gauge disposable hypodermic needle and applicator.
Standard measurements were recorded. Straight carapace length (SCL) and curved carapace length (CCL) were measured from the anterior point at the midline (nuchal scute) to the longest posterior tip of the supracaudal scutes. Likewise, straight and curved carapace widths (SCW and CCW) were measured at the widest point (Bolten, 1999). Measurements were taken to the nearest millimeter using forester calipers (S-882 00 Haglof, Sweden) for straight measurements and a flexible tape measure for curved measurements. Prior to March 2009, only the curved measurements were taken. We converted CCLs to SCLs using a conversion equation specified for CNMI green turtles in Summers et al. (2017).
Nesting season length and peak were estimated on Saipan. Season length was determined through consistent survey effort on index beaches 2–3 days per week for 1 year (January 2012–January 2013). Dates of the first and last nests were recorded, along with the date of the last nest inventoried (see methods below). Season peak was evaluated using the mean number of nests laid per month across all years (except 2008 due to reduced effort during peak months).
Nesting periodicity was estimated at inter- and intra-annual scales on Saipan. Remigration interval, the number of years between nesting seasons, was calculated for recaptured turtles. Inter-nesting interval was estimated as the number of days between one successful nesting event and the start of the next nesting attempt within a season, even if the next landing was a non-nesting emergence (Alvarado and Murphy, 1999). This calculation only included data from 2011 to 2013, as monitoring effort during that period was intensified to ensure that nesters were directly observed each time they emerged.
Clutch frequency (number of nests per female within a season) was estimated using Saipan data from 2011 to 2016, when emergence schedules were tracked closely enough to attribute specific nests to individual nesters, even if the nester was not directly observed each time. Females included in this calculation were physically encountered at least twice in the season to confirm their emergence schedule and ensure particular nests were attributed correctly to specific individuals (Alvarado and Murphy, 1999). Turtles that were poached prior to their final nesting attempt were not included in this calculation.
Threats were assessed during surveys and nest excavations by quantifying: (1) nesters and nests poached (or nearly poached) by humans (details below), (2) nests depredated by predators (details below), (3) nests inundated by water caused by tropical storms, typhoons, and storm-water drainage from beach erosion, (4) nests with hatchling emergence success negatively impacted by roots of invasive vegetation and large pieces of coral rubble, and (5) human disturbance activities. We counted turtles as poached if at least one of the following lines of evidence were present: (1) crawl tracks emerging from the water but not returning, (2) human activity at the nest, such as digging, foot prints, and/or vehicle tracks, (3) a drag mark (indentation in the sand/vegetation) from flipping the turtle over at the nest and dragging it to the nearest parking lot or foot path, (4) discarded tools at the nesting site, including ropes and pallets, or (5) emergence tracks wiped away by humans, presumably to disguise a poaching event, typically in conjunction with missing return tracks and cessation of future nesting by a female that was expected to have additional nesting events in the season. Nests were considered poached if they were confirmed to be present and had evidence of human removal of eggs (e.g., digging and broken shells), sometimes accompanied by signs that the nester was also poached. For depredated nests, we determined predator type as follows: (1) monitor lizards on Rota left evidence of digging (or were observed digging), drag marks from their tails, large holes into nest chambers, egg shells strewn about on top of the nest, and/or eggs eaten within the chamber, (2) crabs left crab sized holes into the chamber and shells outside/on top of the nest, and (3) ants left tiny holes in the eggs, but the eggs remained in the chamber, and ants were sometimes observed in the nest.
Nest Excavations
Nests were marked for post-incubation triangulation and excavation by attaching labeled aluminum tags (Forestry Suppliers, 79260) and survey flagging to vegetation in two locations a measured distance away. Aluminum tags and triangulation methods began in 2012; prior to that, nests were marked using natural landmarks. Cryptic nest marking techniques are necessary in the CNMI due to the threat of egg poaching.
Nests were excavated 3 days after the first evidence of hatching was observed on diurnal surveys (except in rare cases when there was a 2–3 week logistics delay). When no hatching was evident, nests were inventoried on the 70th day after the original observation date. Only nests which showed obvious signs of hatching were inventoried during rapid assessments of Tinian and Rota. Incubation periods were estimated as the number of days between oviposition and hatching (the date primary hatching evidence was observed), using data from 2012 to 2013 on Saipan.
We examined and categorized the contents of each nest following Miller (1999). Categories included: (i) E = emerged hatchlings (departed/departing from nest); (ii) S = shells (empty shells counted if >50% intact); (iii) L = live hatchlings (remaining among shells; assumed to have missed the window for successful emergence); (iv) D = dead hatchlings (outside shell but dead); (v) UD = undeveloped eggs (unhatched with no obvious embryo); (vi) UH = unhatched eggs (with obvious embryo); (vii) UHT = unhatched term eggs (fully developed in egg shell or pipped); (viii) P = depredated eggs (open, nearly complete shell with egg residue). Reproductive output metrics were calculated as:
Nester Abundance and Trends
We estimated annual nester abundance for Saipan using the nocturnal tagging survey data, as every nester was either tagged or identified through nesting activity. For Tinian and Rota, where only diurnal rapid assessments were feasible, we divided total observed nests by mean clutch frequency to estimate the number of nesters (Alvarado and Murphy, 1999). We summed these island-specific estimates for each year (except 2008 due to a lack of survey effort during peak nesting months) to estimate annual nester abundance for all three islands combined.
For Saipan, we estimated the population growth rate (PGR) using a log linear regression of annual nester counts (ln[nesters] as a function of untransformed year). We used the total number of nesters observed each year, regardless of whether they were eventually poached that year. Data from 2008 were excluded here as well (see above comment). We estimated the 95% confidence interval, p-value (alpha = 0.05), and R-squared goodness-of-fit.
Recognizing that poaching of nesters occurred throughout the study period, we let the analysis above represent the population trend with poaching and conducted a second analysis to estimate PGR without poaching. For nesters that were poached in a given year, we added them back into the annual counts for subsequent years as if they had not been poached, and ran the regression on the increased annual counts. Our analysis (i) assumes the poached nesters had the mean remigration interval determined by this study, (ii) ignores natural mortality, as annual survivorship for adult green turtles in the Pacific can be as high as 0.95–0.98 (Chaloupka, 2002; Seminoff et al., 2003) and the analysis only pertains to a short 10-year period, and (iii) assumes 100% of poaching was detected, which is likely true for this study period based on the overall low numbers, limited nesting habitat, small island community, and consistent monitoring efforts. We interpret the difference between the PGR estimates for the two scenarios—“with poaching” and “without poaching”—to represent the estimated impact of poaching on the nester abundance trend.
Climate Impacts
Nest temperatures were measured using HOBO temperature data loggers (Onset Computer Corporation, Pocassette, MA) on Saipan beaches (primarily index beaches) between mid-November 2012 and mid-September 2016. Loggers were set to record temperature every hour and deployed inside the egg chamber, with an identification tag attached by monofilament line or parachute cord (Layton, 2011). They were retrieved during nest excavations and transported back to the office, where the data were downloaded using HOBOware Pro software version 3.2.2 (Onset Computer Corp. 2002–2011). We removed the first and last 7 days of temperature data from each logger due to uncertainty associated with logistical field challenges (e.g., possible time lags between the logger being switched on and deployment, or retrieval and the logger being switched off after transport). This conservative decision minimizes the influence of temperature fluctuations associated with deployment and retrieval, and retains the most relevant incubation data.
We developed generalized additive models (GAMs; Hastie and Tibshirani, 1990) to explore the influence of nest temperature on reproductive success. We constructed several models, each with Hatching Success or Embryonic Death (proportion of eggs that were unhatched, UH, or unhatched term, UHT) as the response variable and combinations of Nest Temperature (mean and maximum), Beach, Year, and Month as predictor variables. All predictor variables were ordinal, except Beach was categorical. Although we were interested exclusively in Nest Temperature as a known mechanistic driver of reproductive success, the other predictors served to control other sources of variation in the response variables to isolate the influence of temperature as much as possible. We estimated the models using data from Saipan nests for which we had both temperature logger data (nest temperatures throughout incubation) and excavation data (hatching success and embryonic death).
We constructed and compared models in a forward step-wise manner in three stages, adding one predictor variable to the best model at each stage and selecting a new model to carry forward, similar to Ortiz et al. (2016). We included Beach in all models to capture inherent but unmeasured differences across sites (e.g., beach slope, length and width, sand grain size, rainfall, moisture, vegetation, shade, etc.) that may influence Hatching Success and Embryonic Death. We used standard selection criteria—Akaike Information Criterion (AIC) and Bayesian Information Criterion (BIC)—to evaluate competing models within each stage (Ortiz et al., 2016). In general, models with low AIC and BIC values and high Deviance Explained are considered the best. We selected the model with the lowest AIC and BIC values within each stage, without comparing it to previous stages. In the final stage, we confirmed that the selected model both included a Nest Temperature predictor and had higher Deviance Explained than models from previous stages with the same Nest Temperature predictor if the AIC/BIC values were similar (within 3 points for AIC and 7 points for BIC). We used this selection process because our intention was to examine the functional form of the relationship between Nest Temperature predictors and Hatching Success or Embryonic Death, not to develop the absolute best model for either response variable. We used the “mgcv” (mixed GAM computation vechicle) package in R for this analysis; “mgcv” is a routine that optimizes the degrees of freedom of the fitted GAM (Wood, 2017). We defined the models with the beta regression family of data distributions (“betar”), a “logit” link function appropriate for data in which the response is a proportion (0–1), and a cubic smoothing spline limited to 4 knots. We performed these analyses and produced figures in the R statistical computing environment (R Core Team, 2014; Version 3.1.2).
Results
Nesting Ecology
Over 11 years (2006–2016), there were 5,427 diurnal surveys on index beaches on Saipan, 102 on Tinian, and 64 on Rota (Table 1). On Saipan, where effort was most intense, there was a mean of 493 diurnal surveys per year (sd = 217; range = 59–782), or 99 surveys per beach per year (sd = 43; range = 3–161). Nocturnal tagging surveys on index beaches totaled 467 on Saipan, 9 on Tinian, and 10 on Rota (Table 1). See Supplementary Table 2 for additional details on survey effort, including a summary by island, index beach, and year.
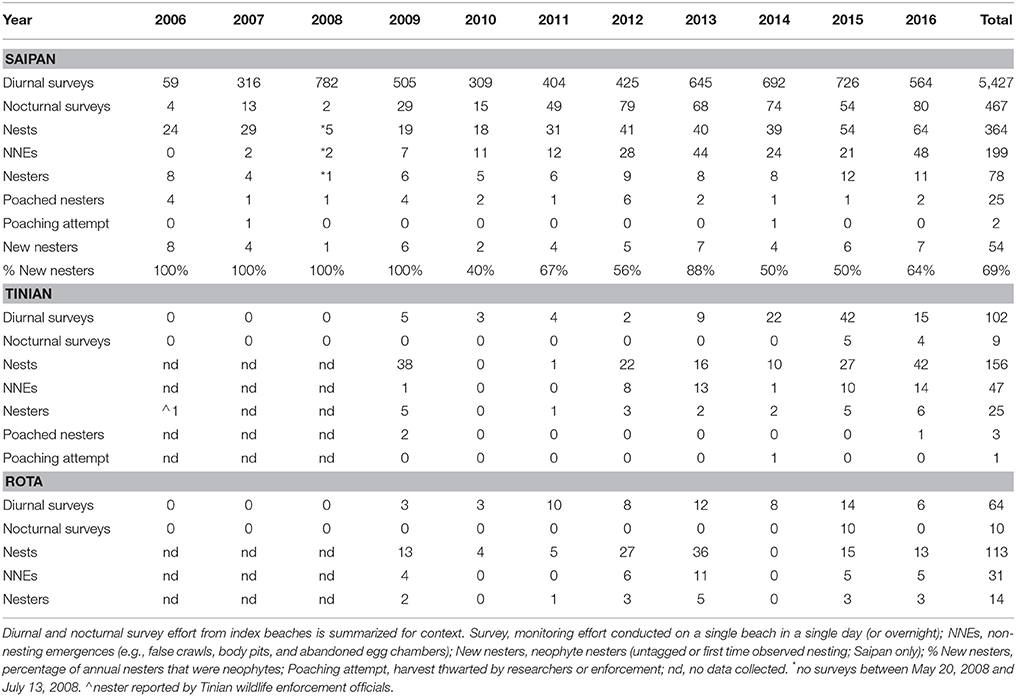
Table 1. Summary of annual green turtle (Chelonia mydas) nesting activity on the islands of Saipan, Tinian, and Rota in the Commonwealth of the Northern Mariana Islands (CNMI), 2006–2016.
Green turtles nest year-round in the CNMI, as documented by observations of nests, hatchlings, and nesting females. Peak nesting occurred between March and July (91% of Saipan nests) with a mean of 6.5 nests laid per month (sd = 4.5; range = 1–18) during peak months. Nest deposition starts in mid-November of one calendar year and ends late August of the next, with hatchlings emerging into early November.
There were 364 total nests observed on Saipan (mean of 36 nests per year; sd = 15; range = 18–64; excludes 2008 due to missing survey effort in peak months), 156 nests on Tinian (22 nests per year; sd = 15; range = 1–42), and 113 on Rota (16 nests per year; sd = 12; range = 4–36) (Table 1). A total of 199 non-nesting emergences (NNEs) were observed on Saipan (22 NNEs per year; sd = 16; range = 2–48), 47 on Tinian (8 NNEs per year; sd = 6; range = 1–14), and 31 on Rota (6 NNEs per year; sd = 3; range = 4–11) (Table 1). Numbers for Tinian and Rota are likely biased low compared to Saipan due to lower levels of survey effort. For example, in years with frequent or intense tropical storms/typhoons we found little to no evidence of nesting on Tinian or Rota, as most signs of nesting had been inundated by high water by the time beaches were surveyed.
We tagged and measured a total of 39 nesters combined on Saipan (n = 34), Tinian (n = 3), and Rota (n = 2). Mean SCL was 95.6 cm (sd = 4.5; range = 81.0–103.6 cm; n = 39), mean SCW was 75.0 cm (sd = 4.6; range = 59.2–85.0; n = 29), mean CCL was 102.2 cm (sd = 4.7; range = 87.1–111.3; n = 38), and mean CCW was 92.5 cm (sd = 4.9; range = 76.7–103.2; n = 38) (Table 2). Ten nesters recaptured on Saipan in 2010–2016 (initial SCL: mean = 95.6 cm; sd = 2.6; range = 91.2–99.8) exhibited a mean absolute growth rate of 0.3 cm/yr (sd = 0.2; range = 0–0.7) (Table 2).
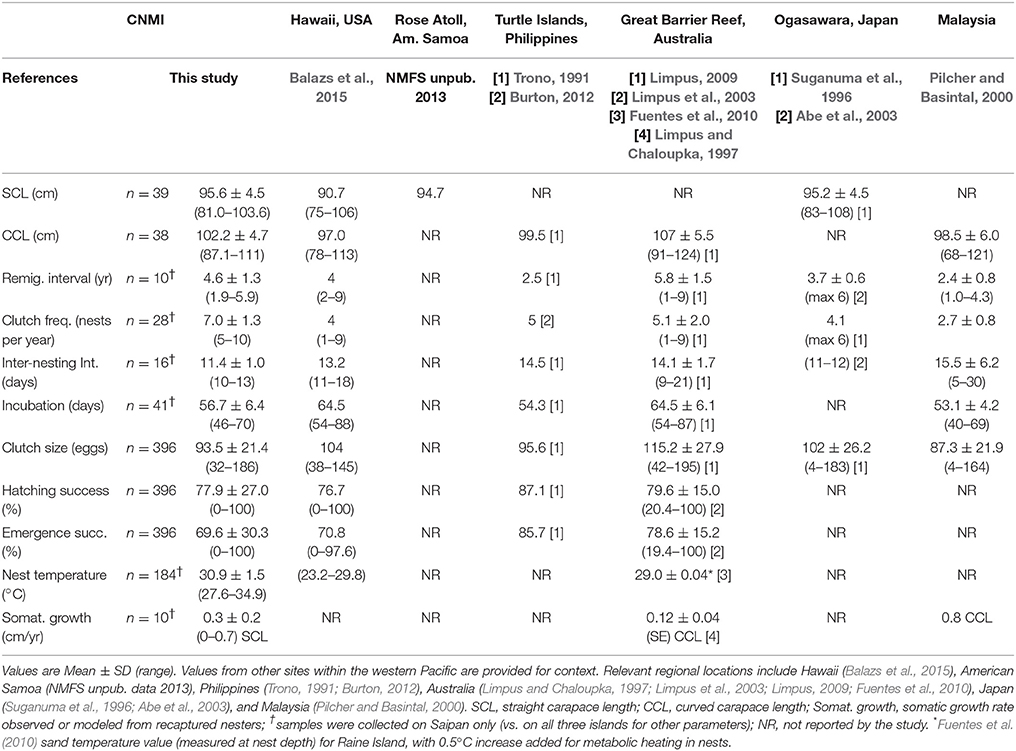
Table 2. Reproductive parameters for green turtles (Chelonia mydas) nesting in the Commonwealth of the Northern Mariana Islands (CNMI) on Saipan, Tinian, and Rota islands.
Remigration interval for the 10 recaptured nesters was 1.9–5.9 years (mean = 4.6; sd = 1.3) (Table 2). One turtle tagged on Obyan Beach in May 2012 was recaptured only 8.5 months later during in-water reef surveys at Balisa (west coast of Saipan) in January 2013, and then again during nocturnal nesting surveys in March 2014 (1.9 years from initial capture). These encounters suggest this turtle may be a resident forager. The short remigration interval may be explained by the lack of a long-range migration between nesting years and the associated conservation of energy.
Inter-nesting interval was 11.4 days (median = 11 days; sd = 1.0; range = 10–13; n = 16 nesters) (Table 2). Turtles whose normal nesting periodicity was disturbed by human activities (examples below) re-emerged post-disturbance 14–18 days after their last nesting event.
Mean clutch frequency was 7.0 nests per female per season (sd = 1.3; range = 5–10) observed across a mean 5 nesters per year on Saipan (sd = 2; range = 3–7; n = 28 nesters) for 2011–2016 (Table 2). Mean incubation duration was 56.7 days (sd = 6.4; range = 46–70; n = 41 nests); this estimate may be biased high since diurnal surveys were not performed 7 days a week.
We excavated 396 nests combined on Saipan (n = 291), Tinian (n = 49), and Rota (n = 56) and estimated a mean clutch size of 93.5 eggs (sd = 21.4; range = 32–186; Table 2). Hatching success was 77.9% (sd = 27.0; range 0–100) across the three islands but lower on Saipan (74.8%) where the sample size was highest (Table 2 and Supplementary Table 3). Saipan also had a lower emergence success (64.0%) than the three-island mean of 69.6% (sd = 30.3; range = 0–100; Table 2 and Supplementary Table 3). High variation in hatching success is possibly attributed to inundation and accompanying erosion from storms, depredation by crabs, ants, and monitor lizards, and temperature variations, as described below.
Nest excavations revealed low levels of egg predation. Crabs depredated 5% of nests, destroying a mean of 3 eggs per nest (sd = 3; range = 0–13). Ants impacted 3% of nests, consuming a mean of 16 eggs per nest (sd = 32; range = 0–94). Monitor lizards depredated 2% of nests, devouring a mean of 17 eggs per nest (sd = 22; range = 0–57). One percent of nests showed evidence of egg predation by an unknown source, with 4 eggs lost per nest (sd = 6; range = 1–13).
Egg poaching accounted for the loss or partial loss of at least 8% of nests on Saipan, 4% on Tinian, and 2% on Rota. Direct take of a hatchling was also documented when a juvenile green turtle (CCL = 17.5 cm) was surrendered to wildlife enforcement by a Saipan resident in 2008. The turtle had been taken from a Saipan beach and raised as a family pet from hatchling size. These poaching observations should be interpreted as minimum values.
Inundation and accompanying erosion from tropical storms, typhoons, and storm-water drainage impacted 9% of nests excavated on Saipan, resulting in a low mean emergence success of 37% (sd = 34; range = 0–96). Inundation of excavated nests was not characterized on Tinian and Rota. Nests completely washed out by storms comprised 2% of observed nests on Saipan, 3% on Rota, and 8% on Tinian.
On Saipan, we observed hatchlings trapped inside the nest under introduced vegetation (i.e., Leucaena leucocephala, Cassytha filiformis, Casuarina equisetifolia, and Cynodon nlemfuensis) or coral rubble in 10% of excavated nests. This problem affected a mean 26 hatchlings per nest (sd = 24; range = 1–101) or 28% of the clutch (sd = 23; range = 1–92). Emergence success for these nests was low at 53% (sd = 26; range = 3–90). Entrapment observations were not typically possible on Tinian or Rota due to the lower survey frequency, but there was one documented case on Tinian.
Coral rubble, rocky substrate, and roots also impacted nesters by impeding their excavation of egg chambers. Abandoned egg chambers accounted for 29% of NNEs on Saipan, 40% on Tinian, and 32% on Rota. Two extreme cases were observed on Babui Beach, Tinian and Obyan Beach, Saipan where seven and eleven abandoned egg chambers (respectively) were documented within a single crawl each.
Human disturbance of nesters was observed in association with several activities, including camping, building bonfires, driving on the beach, using flashlights, and fishing nearshore with submersible lights. At least one type of disturbance was recorded during 8% of nocturnal surveys on Saipan. Typically, these disturbances prevented nesters from emerging on their expected return dates and caused them to nest after the activity was no longer a threat or to nest on adjacent (smaller) pocket beaches with sub-optimal habitat. On a few occasions, a nester was disturbed on the beach or could not find suitable habitat during nesting attempts (i.e., impedance by rocks or roots) and switched to a different nesting beach within a season. Most nesters, however, were only observed to nest on a single nesting beach.
Nester Abundance and Trends
Over 11 years, we recorded 78 nesters on Saipan (7.7 ± 2.5 annual nesters; range = 4–12), 25 on Tinian (3.1 ± 1.9 annual nesters; range = 1–6), and 14 on Rota (2.8 ± 1.3 annual nesters; range = 1–5) for a combined total of 117 nesters (11.9 ± 5.7 annual nesters; range = 4–20) (Table 1). Similar to the numbers of nests and non-nesting emergences, nester abundance estimates for Tinian and Rota are likely biased low due to the relative infrequency of survey effort. Poachers removed 25 females from Saipan (32%) and at least 3 from Tinian (12%); no poaching of nesters was documented on Rota (Table 1). Attempts to poach at least 2 additional nesters from Saipan and 1 from Tinian were thwarted (Table 1). Neophyte nesters (previously untagged) comprised 40 to 100% of annual nesters, with an overall mean of 69.2% across all years and 59.1% for 2010–2016 only, the period after one remigration interval had passed and thus remigrants could be expected. The estimated PGR for Saipan's nesting population was 11.4% when adding the poached nesters back into the population at the mean remigration interval of 4.6 years (p = 0.001; R2 = 0.74) (Figure 2A). However, PGR decreased to 7.4% per year when accounting for observed levels of poaching for 2006–2016 (p = 0.019; R2 = 0.52) (Figure 2B).
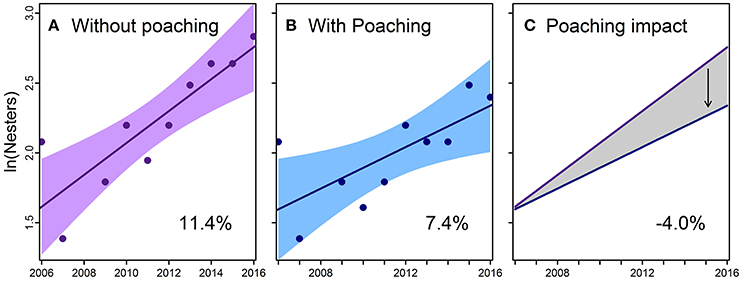
Figure 2. Trends in abundance for green turtles (Chelonia mydas) nesting on Saipan, 2006–2016. (A) “Without Poaching” model scenario—theoretical nester abundance with poached nesters added back to observed annual counts using the estimated mean remigration interval of 4.6 years. Linear regression (solid line with shaded 95% confidence interval) through estimated annual nester abundance (points) suggests the population growth rate would be 11.4% without poaching (p = 0.001; R2 = 0.74). (B) “With Poaching” model scenario—nester abundance (points) reflects actual levels of poaching, with a linear regression (line and 95% confidence interval shading) suggesting a 7.4% population growth rate (p = 0.019; R2 = 0.52). (C) Difference between the two scenarios in (A,B) suggests poaching of nesters decreased the population growth rate by 4.0%, thereby slowing the recovery trend.
Climate Impacts
We deployed a total of 246 temperature loggers in Saipan nests in 2012–2016 and successfully retrieved 184 loggers that had at least 7 days of data each. This included 174 loggers from index beaches (Table 3) plus 10 loggers from non-index beaches (Supplementary Table 4). Mean nest temperature was 30.9 ± 1.5°C (index beach range = 27.6–34.2; non-index beach range = 29.1–34.9; Table 3 and Supplementary Material). Maximum nest temperature was 33.5 ± 2.0°C (range = 29.2–42.6).
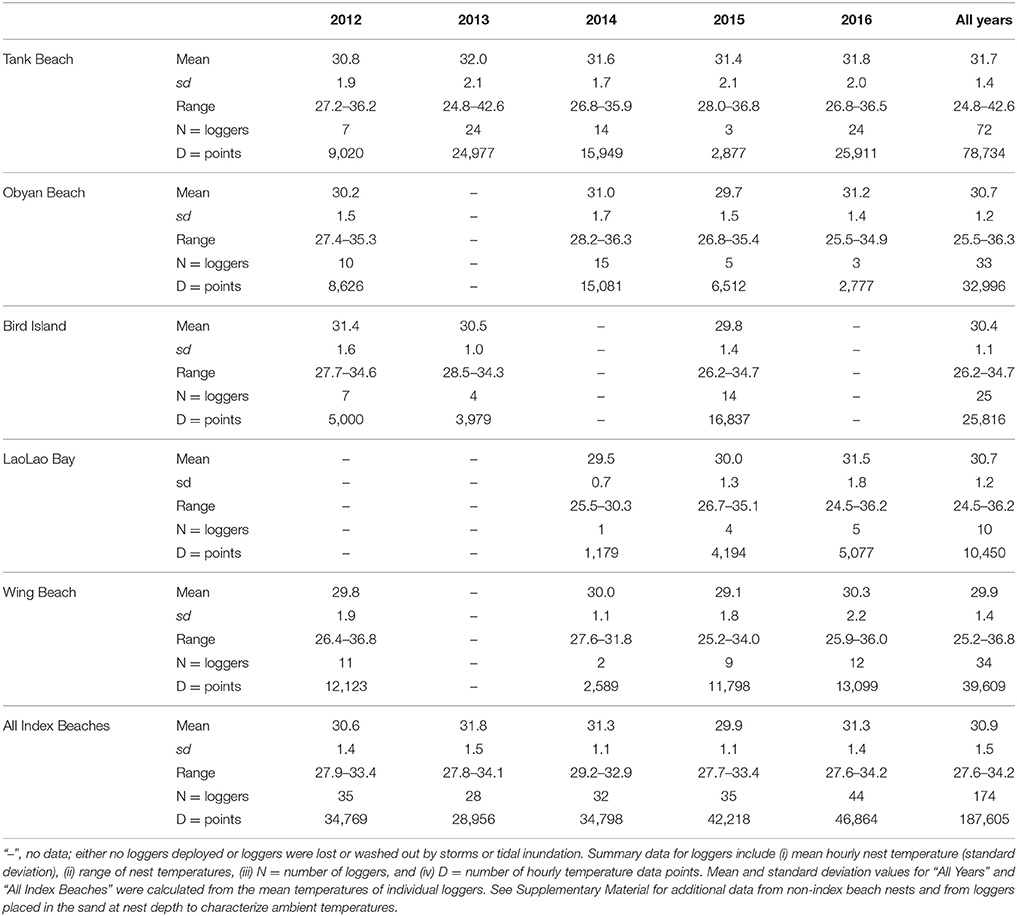
Table 3. Temperature logger data (°C) from green turtle (Chelonia mydas) nests on Saipan index beaches, 2012–2016 (n = 174 loggers).
For our modeling exercise, there were 89 nest temperature loggers with corresponding data on hatching success and embryonic death that were suitable for use. Results from our model selection process are summarized in Table 4 and the smoothed responses to the predictors in the best models are illustrated in Figure 3.
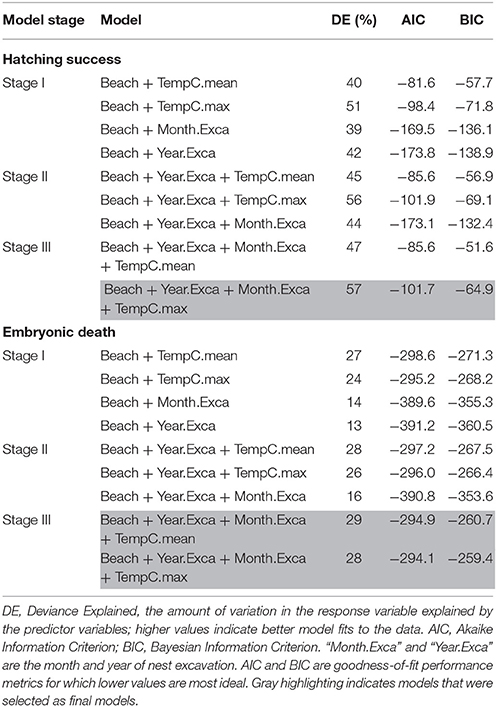
Table 4. Generalized additive models (GAMs) exploring the influence of nest temperatures (mean and maximum during incubation) on hatching success and embryonic death for green turtle (Chelonia mydas) nests in Saipan, CNMI.
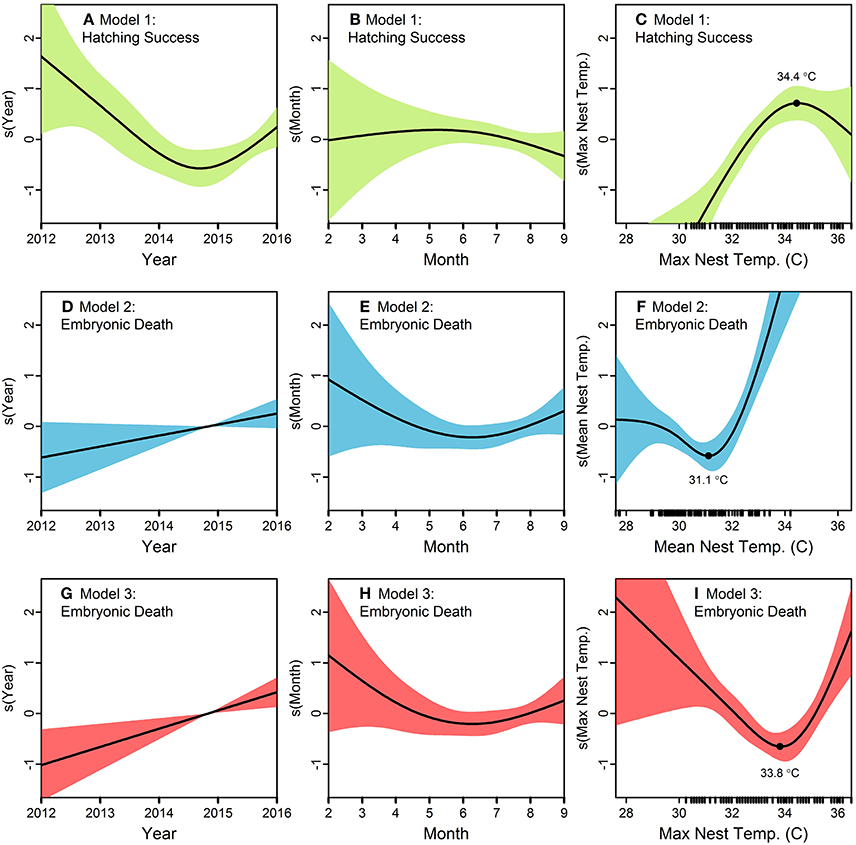
Figure 3. Generalized additive models (GAMs) exploring the influence of year, month, and nest temperature (mean or maximum) on green turtle (Chelonia mydas) hatching success (Model 1) and embryonic death (Models 2 and 3) on Saipan beaches in 2012–2016. Nest temperature (n = 89 data loggers) is the predictor variable of primary interest, while beach (categorical variable; not shown here), year, and month are included to control other sources of variation in the response variables. Smoothed responses to individual predictors are shown on the y-axis of (A–I). Rug plots along the x-axis of (C,F,I) show the distribution of raw data for the temperature variables. Model 1 suggests (A) an annual decrease in hatching success until 2015, (B) a slight maximum in hatching success in May-July, and (C) hatching success increases with maximum nest temperature up to 34.4°C, after which it decreases. Model 2, which uses mean nest temperature rather than the maximum, suggests (D) a steady increase in embryonic death over the years, (E) lowest embryonic death between May and July, and (F) a pronounced increase in embryonic death with mean nest temperatures beyond 31.1°C. Model 3 suggests (G) embryonic death has increased annually (H) highest embryonic death in February through April, and (I) embryonic death decreases with maximum nest temperatures up to 33.8°C, and increases sharply beyond that.
For Hatching Success, the model with the lowest AIC and BIC was in Stage I with Beach and Year as predictors; however, adding Month to that model in Stage II increased Deviance Explained by 2% for a negligible increase in AIC and BIC (Table 4). In Stage III, adding Maximum Nest Temperature was better than adding Mean Nest Temperature, as evidenced by a 10% higher increase in Deviance Explained along with clearly lower AIC/BIC scores (Table 4). Although some models in Stages I and II had lower AIC/BIC values, we selected the model with Maximum Nest Temperature in Stage III as the best model because it had the overall highest Deviance Explained (57%) and included temperature, our variable of interest (Table 4; Figures 3A–C). This model (“Model 1”) suggests (i) an annual decrease in hatching success until 2015 and a subtle increase thereafter, (ii) a slight maximum in hatching success in May-July, and (iii) hatching success increases with maximum nest temperature up to 34.4°C, after which it decreases (Figures 3A–C).
For Embryonic Death, in Stage I the model with the lowest AIC and BIC included Beach and Year as predictors; however, this model had the lowest Deviance Explained (Table 4). Adding Month in Stage II increased the Deviance Explained by 3% while maintaining similar values for AIC/BIC (Table 4). In Stage III, adding Mean Nest Temperature or Maximum Nest Temperature yielded similar results, with Mean Nest Temperature offering 1% higher Deviance Explained (29%) but almost identical values for AIC/BIC. For this reason, we considered both models as the best. The model with Mean Nest Temperature (“Model 2”) suggests (i) a steady increase in embryonic death over the years, (ii) lowest embryonic death between May and July, and (iii) a pronounced increase in embryonic death with mean nest temperatures beyond 31.1°C (Figures 3D–F). The model with Maximum Nest Temperature (“Model 3”) suggests (i) embryonic death has increased annually since 2012, (ii) highest embryonic death in February through April, and (iii) embryonic death decreases with maximum nest temperatures up to 33.8°C, and increases sharply beyond that (Figures 3G–I).
Discussion
Nesting green turtles in the CNMI are part of the Endangered CWP DPS for which a major knowledge gap exists (Seminoff et al., 2015). Data on nesting ecology, population abundance and trends, direct human impacts, and climate impacts are critical for conducting population status assessments. Understanding these aspects of the population will facilitate science-based management and help direct conservation efforts both locally and regionally. Our 11-year study provides the first comprehensive characterization of this nesting population, filling in those major data gaps in demographic parameters and providing quantitative evidence of the current impact of poaching and the looming threat of rising temperatures.
Nesting Ecology
The reproductive demographic parameters estimated in this study fall within the ranges established for other green turtle populations in the western and central Pacific. Parameter estimates (mean ± sd and range) for several other nesting locations in the region (Hawaii, American Samoa, Australia, Philippines, and Malaysia) are provided in Table 2 for context. Relative to those populations, CNMI nesters appear to be medium-sized with an intermediate remigration interval. Their SCL of 95.6 ± 4.5 cm and CCL of 102.2 ± 4.7 cm fall between low values observed in Hawaii (Balazs et al., 2015) and high ones from the Great Barrier Reef in Australia (Limpus, 2009). Their remigration interval of 4.6 ± 1.3 yr falls between shorter intervals from the Philippines and Japan (Trono, 1991; Abe et al., 2003) and longer ones from Australia (Limpus, 2009).
Within one season, CNMI nesters lay a relatively high number of nests, deposit a low number of eggs in each nest, and spend a short period of time in the water between nesting events. Clutch frequency of 7.0 ± 1.3 nests per year for CNMI is the highest observed mean for the region (Suganuma et al., 1996; Limpus et al., 2003; Limpus, 2009; Burton, 2012; Balazs et al., 2015), but it falls within the ranges observed in Hawaii and Australia (Limpus, 2009; Balazs et al., 2015). Inter-nesting interval of 11.4 ± 1.0 days is on the short end of observed intervals from the other locations, and is most similar to Japan (Abe et al., 2003). Clutch size of 93.5 ± 21.4 eggs falls between smaller clutches observed in Malaysia (Pilcher and Basintal, 2000) and larger ones in Australia (Limpus, 2009).
Nests in the CNMI incubate relatively quickly and have hatching and emergence success comparable to other locations. The incubation period of 56.7 ± 6.4 days is low, similar to values observed in the warm climates of the Philippines and Malaysia (Trono 1991; Pilcher and Basintal, 2000), and shorter than those in the cooler climates in Hawaii and Australia (Limpus, 2009; Balazs et al., 2015). Hatching success of 77.9 ± 27.0% and emergence success of 69.6 ± 30.3% are within the ranges for the region (Trono, 1991; Limpus et al., 2003; Balazs et al., 2015), but potentially on the low end. Future studies could test whether these parameters are negatively impacted by (i) higher frequency and intensity of tropical storms and typhoons inundating nests in the CNMI (Shaw, 2013), (ii) warm temperatures experienced at low latitudes (Matsuzawa et al., 2002), and (iii) habitat factors, such as high instances of coral rubble and roots from non-native vegetation trapping hatchlings in nests (Zárate et al., 2013).
This population of nesting turtles exhibits a relatively low somatic growth rate. Although our recapture sample size was low (10 turtles), we documented a growth rate of 0.26 cm/yr for nesting green turtles in the CNMI. This is relatively low compared to a growth rate of 0.8 cm/yr from Malaysia (Pilcher and Basintal, 2000), the closest comparison in the region, and 0.5 cm/yr for nesters in Florida (Witherington and Ehrhart, 1989). High reproductive output during nesting seasons, combined with long-distance post-nesting migrations to foraging grounds, could potentially explain the low observed growth rate; growth rates of juveniles in this population range from 0.3 to 7.8 cm/yr (Summers et al., 2017).
Nester Abundance and Trends
Our results suggest that poaching is currently the greatest threat to this nesting population. The 32% harvest rate of Saipan's 7.7 ± 2.5 annual nesters potentially would be higher without the research efforts described in this study. Consistent monitoring often prevented or interrupted poaching and triggered enforcement efforts. Although we document other anthropogenic threats, adult females have a high reproductive value when compared to eggs and hatchlings, and thus their loss has the greatest impact to the population. For example, beach driving is one threat that impacts nests, hatchlings, and adults. The threat has largely been eliminated through beach barricades and a “walk it, don't drive it” campaign led by the CNMI Bureau of Environmental and Coastal Quality; however, on a few non-barricaded nesting beaches on Tinian and Rota and on Saipan beaches where barricades have been removed or recently washed away by super typhoons, there remains a “drive in” poaching opportunity to exploit nesting turtles.
The 4.0% difference between PGR estimates for the scenarios “with poaching” and “without poaching” represents the impact poaching has had on this population. In other words, the removal of nesting females from this small population has slowed its positive population growth trend. However, despite continued removal of reproductive females, this population is experiencing a positive trend in nester abundance with an annual PGR of 7.4%. This rate of increase is relatively high in comparison with the 6.8% estimate for green turtles in the Ogasawara Islands in Japan (Chaloupka et al., 2008; Seminoff et al., 2015), which belong to the same DPS. This rate is also steeper than the 5.4% observed in Hawaii (Balazs et al., 2015; Seminoff et al., 2015) and the 3.8% at Heron Island on the Great Barrier Reef (Chaloupka et al., 2008). While the CNMI nesting population is a small fraction of the larger DPS, the observed increase is a positive sign and suggests potential for recovery of this Endangered DPS.
We estimated a mean abundance of 11.9 nesters per year on Saipan, Tinian, and Rota combined. With a remigration interval of 4.6 years, this yields a total of 55 adult females. Total nester abundance for the CWP DPS is currently 6,518 individuals (Seminoff et al., 2015). While the CNMI portion represents < 1% of the total at present, a population growth rate of 7.4% suggests this population has not reached its carrying capacity. Observing a high percentage of neophyte nesters is expected at the start of any study as new individuals are tagged; however, our annual mean of 59% neophytes for 2010–2016 after one remigration interval had passed supports a hypothesis that newly mature adults continue to recruit into the breeding population. Alternative explanations may include much longer remigration intervals than estimated here, nesting at other sites (e.g., most likely within the Mariana Islands), or less than 100% detection of nesters during the study period. However, given the remigration intervals known for other green turtle populations, extreme nesting site fidelity, local knowledge and monitoring of nesting activity on Saipan, and a 20–40 year age at first reproduction, we find the neophyte hypothesis most plausible. New recruits are generally a good sign for the population, as long as they remain in the population and successfully reproduce. On beaches with saturation monitoring/tagging, the percentage of neophytes would be expected to stabilize at lower levels, assuming the previously tagged nesters are not being removed from the population through anthropogenic activities, such as poaching or bycatch.
Climate Impacts
Our finding that the mean nest temperature of green turtles in the CNMI is 30.9 ± 1.5°C is concerning when compared to known pivotal temperatures for sex determination and embryonic death. This mean is above 29.0°C, the threshold beyond which a clutch becomes female biased (Standora and Spotila, 1985; Mrosovsky, 1994; Ackerman, 1997; Godfrey and Mrosovsky, 2006). Furthermore, it is above 30.3°C, a temperature which produces a minimum of 90% females in green turtle nests (Standora and Spotila, 1985; Spotila et al., 1987). Our results provide strong evidence that the current generation of green turtles produced in the CNMI is already female biased. This idea could be tested by determining sex for a sample of juvenile turtles on their foraging grounds (Allen et al., 2015). And while the expected female bias could boost the nesting population initially, this could become a problem if there are eventually too few males to sustain the breeding population (Layton, 2011).
The mean nest temperature of 30.9°C for CNMI green turtle nests currently falls below the pivotal threshold of 33.0°C for embryonic death (Packard et al., 1977; Miller, 1985). However, the maximum temperature of 33.5 ± 2.0°C across all nests in this study creates cause for concern and further investigation. Generally, it is the prolonged exposure to temperatures above 33.0°C that leads to increased hatchling mortality, but the exact critical temperature and exposure time needed to induce mortality in the CNMI is unknown. Projected increases in temperatures could lead to higher rates of embryonic death in the near future.
Our modeling results suggest a decrease in hatching success and corresponding increase in embryonic death beyond maximum nest temperatures of 34.4 and 33.8°C, respectively. Additionally, embryonic death appears to be triggered beyond a mean nest temperature of 31.1°C, which is only slightly higher than the mean nest temperature we measured. Warm temperatures resulting in embryonic death likely played a role in lowering hatching success from 100 to 77.9%. With rising global temperatures leading to rising sand temperatures, we can expect the hatching success of CNMI green turtle nests to continue declining.
Conclusion
This study provides the first comprehensive assessment of nesting demographic parameters and abundance trends for nesting green turtles in the Mariana Archipelago specifically, and Micronesia more broadly. Furthermore, it quantifies major threats to the survival of the population. The CNMI nesting data suggest an annual increase in nesting females of 7.4% per year, which is corroborated by a 10% increase in foraging green turtles (mostly juveniles) estimated from aerial surveys in the southern portion of the archipelago (Martin et al., 2016). These positive trends are promising in light of the previous exploitation of nesting and foraging turtles throughout the region (Groombridge and Luxmoore, 1989; Seminoff et al., 2015); however, the trends may be slowed by continued poaching or offset by warming temperatures.
Ethics Statement
This research was performed under the Commonwealth of the Northern Mariana Islands Department of Lands and Natural Resources. This is a governmental institution which does not require an Institutional Animal Care and Use Committee (IACUC) protocol but does require that endangered species research is permitted through US Federal agencies: US Fish and Wildlife Service (USFWS) and National Marine Fisheries Service (NMFS). The work presented in this paper was performed under this US territorial government agency under the auspices of a US Endangered Species Act (ESA) valid permit issued by USFWS (permit no. TE-017352-17). All work was done under the USFWS ESA guidelines, permits, and certifications with experienced permitted personnel.
Author Contributions
TS, JH, and JR designed the study and collected and maintained nesting data. TS, SM, and TJ quality-checked and analyzed data. TS, SM, and TJ prepared figures and tables and wrote the manuscript. All authors reviewed the manuscript.
Funding
Funding for this research was provided by the National Oceanic & Atmospheric Administration Pacific Islands Regional Office and Pacific Islands Fisheries Science Center. Grants: NA05NMF4541150, NA06NMF4540216, NA07NMF4540193, NA08NMF0613, NA09NMF4540353, NA11NMF4540236, NA13NMF4540124. Contracts: AB133F08SE4001, AB133F09SE2166, RA133F12SE1733, RA133F11SE2103, RA133F13SE1292, RA133F14SE3043, AB133F10SE2166, AB133F15SE1797.
Conflict of Interest Statement
The authors declare that the research was conducted in the absence of any commercial or financial relationships that could be construed as a potential conflict of interest.
Acknowledgments
We thank all CNMI DLNR/DFW staff and community volunteers who contributed to the nesting surveys over the years. We are grateful for the support of DLNR Secretaries Dr. Ignacio Dela Cruz, DVM, Arnold Palacios, and Richard Seman, and DFW Director Sylvan Igisomar. We thank K. Frutchey, M. Snover, G. Balazs, and I. Kelly who provided study design expertise and/or constructive comments on earlier versions of this manuscript. Thanks to Jason Baker, Chris Boggs, Mike Seki, and our two reviewers for constructive comments and discussion which improved our analyses and manuscript. The Secretariat of the Pacific Regional Environment Programme provided flipper tags. This research was conducted in accordance with USFWS permit no. TE-017352-17. Data are publicly available: Pacific Islands Fisheries Science Center, 2017: PIR Marine Turtle Nesting from 2006-01-01 to 2016-12-31. NOAA National Centers for Environmental Information, https://inport.nmfs.noaa.gov/inport/item/5452.
Supplementary Material
The Supplementary Material for this article can be found online at: https://www.frontiersin.org/articles/10.3389/fmars.2017.00428/full#supplementary-material
References
Abe, O., Shibuno, T., Takada, Y., Hashimoto, K., Tanizaki, S., Ishii, H., et al. (2003). Nesting Populations of Sea Turtle in Ishigaki Island. Kyoto: Okinawa Kyoto University.
Ackerman, R. A. (1997). The nest environment and the embryonic development of sea turtles. Biol. Sea Turtles 1, 83–106.
Allen, C. D., Robbins, M. N., Eguchi, T., Owens, D. W., Meylan, A. B., Meylan, P. A., et al. (2015). First assessment of the sex ratio for an east pacific green sea turtle foraging aggregation: validation and application of a testosterone ELISA. PLoS ONE 10:e0138861. doi: 10.1371/journal.pone.0138861
Alvarado, J., and Murphy, T. M. (1999). “Nesting periodicity and internesting behavior,” in Research and Management Techniques for the Conservation of Sea Turtles, eds K. L. Eckert, K. A. Bjorndal, F. A. Abreu-Grobois, and M. Donnelly (Blanchard, PA: IUCN/SSC Marine Turtle Specialist Group Publication), 115–118.
Balazs, G. H. (1999). “Factors to consider in the tagging of sea turtles,” in Research and Management Techniques for the Conservation of Sea Turtles, eds K. L. Eckert, K. A. Bjorndal, F. A. Abreu-Grobois, and M. Donnelly (IUCN/SSC Marine Turtle Specialist Group Publication), 101–114.
Balazs, G. H., Van Houtan, K. S., Hargrove, S. A., Brunson, S. M., and Murakawa, S. K. (2015). A review of the demographic features of hawaiian green turtles (Chelonia mydas). Chelonian Conserv. Biol. 14, 119–129. doi: 10.2744/CCB-1172.1
Bolten, A. B. (1999). “Techniques for measuring sea turtles,” in Research and Management Techniques for the Conservation of Sea Turtles, eds K. L. Eckert, K. A. Bjorndal, F. A. Abreu-Grobois, and M. Donnelly (IUCN/SSC Marine Turtle Specialist Group Publication), 110–114.
Broderick, A. C., Frauenstein, R., Glen, F., Hays, G. C., Jackson, A. L., Pelembe, T., et al. (2006). Are green turtles globally endangered? Glob. Ecol. Biogeogr. 15, 21–26. doi: 10.1111/j.1466-822X.2006.00195.x
Burton, A. (2012). Glad tidings for green sea turtles. Front. Ecol. Environ. 10:998. doi: 10.2307/41479998
Carruth, R. L. (2003). Ground-Water Resources of Saipan, Commonwealth of the Northern Mariana Islands. Honolulu: US Department of the Interior, US Geological Survey.
Chaloupka, M. (2002). Stochastic simulation modelling of southern great barrier reef green turtle population dynamics. Ecol. Modell. 148, 79–109. doi: 10.1016/S0304-3800(01)00433-1
Chaloupka, M., Bjorndal, K. A., Balazs, G. H., Bolten, A. B., Ehrhart, L. M., Limpus, C. J., et al. (2008). Encouraging outlook for recovery of a once severely exploited marine megaherbivore. Glob. Ecol. Biogeogr. 17, 297–304. doi: 10.1111/j.1466-8238.2007.00367.x
Eldredge, L. G. (1983). Summary of Environmental and Fishing Information on Guam and the Commonwealth of the Northern Mariana Islands: Historical Background, Description of the Islands, and Review of the Climate, Oceanography, and Submarine Topography. Mangilao: National Oceanic and Atmospheric Administration, University of Guam Marine Laboratory UOG Station, National Marine Fisheries Service, Southwest Fisheries Center.
Eldredge, L. G., and Randall, R. H. (1980). Atlas of the Reefs and Beaches of Saipan, Tinian and Rota. Mangilao: Marine Laboratory, University of Guam.
Fuentes, M., Hamann, M., and Limpus, C. (2010). Past, current and future thermal profiles of green turtle nesting grounds: Implications from climate change. J. Exp. Mar. Biol. Ecol. 383, 56–64. doi: 10.1016/j.jembe.2009.11.003
Godfrey, M. H., and Mrosovsky, N. (2006). Pivotal temperature for green sea turtles, Chelonia mydas, nesting in suriname. Herpetol. J. 16, 55–61. Available online at: https://www.thebhs.org/publications/the-herpetological-journal/volume-16-number-1-january-2006/422-08-pivotal-temperature-for-green-sea-turtles-i-chelonia-mydas-i-nesting-in-suriname/file
Groombridge, B., and Luxmoore, R. A. (1989). The Green Turtle and Hawksbill (Reptilia: Cheloniidae): World Status, Exploitation and Trade. Cambridge: Secretariat of the Convention on International Trade in Engangererd Species of Wild Fauna and Flora.
Hastie, T., and Tibshirani, R. (1990). Generalized Additive Models. Boca Raton, FL: Wiley Online Library.
Jackson, J. B., Kirby, M. X., Berger, W. H., Bjorndal, K. A., Botsford, L. W., Bourque, B. J., et al. (2001). Historical overfishing and the recent collapse of coastal ecosystems. Science 293, 629–637. doi: 10.1126/science.1059199
Kolinski, S. P., Parker, D. M., Ilo, L. I., and Ruak, J. K. (2001). An assessment of the sea turtles and their marine and terrestrial habitats at Saipan, Commonwealth of the Northern Mariana Islands. Micronesica 34, 55–72.
Layton, J. E. (2011). Biological, Ecological and Conservational Implications of Temperature-Dependent Sex Determination in Sea Turtle Populations. Birmingham: The University of Alabama at Birmingham.
Lewison, R. L., Freeman, S. A., and Crowder, L. B. (2004). Quantifying the effects of fisheries on threatened species: the impact of pelagic longlines on loggerhead and leatherback sea turtles. Ecol. Lett. 7, 221–231. doi: 10.1111/j.1461-0248.2004.00573.x
Limpus, C. J. (2009). A Biological Review of Australian Marine Turtles. 2. Green turtle, Chelonia mydas (Linnaeus). Brisbane, QLD: Queensland Environmental Protection Agency.
Limpus, C. J., Miller, J. D., Parmenter, C. J., and Limpus, D. J. (2003). The green turtle, Chelonia mydas, population of Raine Island and the northern great barrier reef: 1843-2001. Memoirs-Queensland Museum 49, 349–440. Available online at: http://www.gbrmpa.gov.au/__data/assets/pdf_file/0019/4384/Limpus-et-al-2003.pdf
Limpus, C., and Chaloupka, M. (1997). Nonparametric regression modelling of green sea turtle growth rates (southern Great Barrier Reef). Mar. Ecol. Prog. Ser. 149, 23–34. doi: 10.3354/meps149023
Lutcavage, M. E., Plotkin, P., Witherington, B., and Lutz, P. L. (1997). Human impacts on sea turtle survival. Biology Sea Turtles 1, 387–409.
Martin, S. L., Van Houtan, K. S., Jones, T. T., Aguon, C. F., Gutierrez, J. T., Tibbatts, R. B., et al. (2016). Five decades of marine megafauna surveys from micronesia. Front. Mar. Sci. 2:116. doi: 10.3389/fmars.2015.00116
Matsuzawa, Y., Sato, K., Sakamoto, W., and Bjorndal, K. (2002). Seasonal fluctuations in sand temperature: effects on the incubation period and mortality of loggerhead sea turtle (Caretta caretta) pre-emergent hatchlings in Minabe, Japan. Mar. Biol. 140, 639–646. doi: 10.1007/s00227-001-0724-2
McClenachan, L., Jackson, J. B., and Newman, M. J. (2006). Conservation implications of historic sea turtle nesting beach loss. Front. Ecol. Environ. 4, 290–296. doi: 10.1890/1540-9295(2006)4[290:CIOHST]2.0.CO;2
Miller, J. (1985). “Embryology of marine turtles,” in Biology of the Reptilia. Vol. 14, eds C. Gans, F. Billet, and P. Maderson (New York, NY: John Wiley and Sons), 269–328.
Miller, J. (1999). “Determining clutch size and hatching success,” in Research and Management Techniques for the Conservation of Sea Turtles, eds K. L. Eckert, K. A. Bjorndal, F. A. Abreu-Grobois, and M. Donnelly, IUCN/SSC Marine Turtle Specialist Group Publication, 124–129.
Mortimer, J. A., and Carr, A. (1987). Reproduction and migrations of the ascension island green turtle (Chelonia mydas). Copeia 1987, 103–113. doi: 10.2307/1446043
Mrosovsky, N. (1994). Sex ratios of sea turtles. J. Exp. Zool. A Ecol. Genet. Physiol. 270, 16–27. doi: 10.1002/jez.1402700104
Ortiz, N., Mangel, J. C., Wang, J., Alfaro-Shigueto, J., Pingo, S., Jimenez, A., et al. (2016). Reducing green turtle bycatch in small-scale fisheries using illuminated gillnets: the cost of saving a sea turtle. Mar. Ecol. Prog. Ser. 545, 251–259. doi: 10.3354/meps11610
Packard, G. C., Tracy, C. R., and Roth, J. J. (1977). The physiological ecology of reptilian eggs and embryos. and the evolution of viviparity within the class reptilia. Biol. Rev. 52, 71–105. doi: 10.1111/j.1469-185X.1977.tb01346.x
Pilcher, N., and Basintal, P. (2000). Reproductive biology of the green turtle Chelonia mydas in Sabah, Malaysia. Asian J. Trop. Biol. 4, 59–66.
Pritchard, P. C. H., and Mortimer, J. A. (1999). “Taxonomy, external morphology, and species identification,” in Research and Management Techniques for the Conservation of Sea Turtles, eds K. Eckert, K. Bjorndal, F. Abreu-Grobois, and M. Donnelly (Blanchard, PA: IUCN/SSC Marine Turtle Specialist Group), 21.
Pultz, S., O'Daniel, D., Krueger, S., McSharry, H., and Balazs, G. (1999). Marine turtle survey on Tinian, Mariana Islands. Micronesica 32, 85–94.
R Core Team (2014). R: A Language and Environment for Statistical Computing. R Foundation for Statistical Computing, Vienna.
Schroeder, B., and Murphy, S. (1999). “Population surveys (ground and aerial) on nesting beaches,” in Research and Management Techniques for the Conservation of Sea Turtles, eds K. L. Eckert, K. A. Bjorndal, F. A. Abreu-Grobois, and M. Donnelly (Blanchard, PA: IUCN/SSC Marine Turtle Specialist Group Publication), 45–55.
Seminoff, J. A., Allen, C. D., Balazs, G. H., Dutton, P. H., Eguchi, T., Haas, H., et al. (2015). Status Review of the Green Turtle (Chelonia Mydas) Under the Engangered Species Act. La Jolla, CL: US Department of Commerce, National Oceanic and Atmospheric Administration, National Marine Fisheries Service [Southwest Fisheries Science Center].
Seminoff, J. A., Jones, T. T., Resendiz, A., Nichols, W. J., and Chaloupka, M. Y. (2003). Monitoring green turtles (Chelonia mydas) at a coastal foraging area in Baja California, Mexico: multiple indices to describe population status. J. Mar. Biol. Assoc. U.K. 83, 1355–1362. doi: 10.1017/S0025315403008816
Shaw, K. R. (2013). Effects of Inundation on Hatch Success of Loggerhead Sea Turtle (Caretta caretta) Nests. Coral Gables, FL: University of Miami.
Spotila, J. R., Standora, E. A., Morreale, S. J., and Ruiz, G. J. (1987). Temperature dependent sex determination in the green turtle (Chelonia mydas): effects on the sex ratio on a natural nesting beach. Herpetologica 43, 74–81.
Stafford, K. W., Mylroie, J. E., and Jenson, J. W. (2002). Karst Geology and Hydrology of Tinian and Rota (Luta), CNMI: A preliminary report. Mangilao: Water and Environmental Research Institute of the Western Pacific, University of Guam.
Standora, E. A., and Spotila, J. R. (1985). Temperature dependent sex determination in sea turtles. Copeia 1985, 711–722. doi: 10.2307/1444765
Suganuma, H., Horikoshi, K., Tachikawa, H., Sato, F., and Yamaguchi, M. (1996). Reproductive Characteristics of the Ogasawara Green Turtles in Fifteenth Annual Symposium on Sea Turtle Biology and Conservation. Miami, FL: NOAA Technical Memorandum NMFS-SEFSC-387.
Summers, T. M., Jones, T. T., Martin, S. L., Hapdei, J. R., Ruak, J. K., and Lepczyk, C. A. (2017). Demography of marine turtles in the nearshore environments of the Northern mariana islands. Pac. Sci. 71, 269–286. doi: 10.2984/71.3.3
Troëng, S., and Rankin, E. (2005). Long-term conservation efforts contribute to positive green turtle Chelonia mydas nesting trend at tortuguero, costa rica. Biol. Conserv. 121, 111–116. doi: 10.1016/j.biocon.2004.04.014
Wallace, B. P., DiMatteo, A. D., Bolten, A. B., Chaloupka, M. Y., Hutchinson, B. J., Abreu-Grobois, F. A., et al. (2011). Global conservation priorities for marine turtles. PLoS ONE 6:e24510. doi: 10.1371/journal.pone.0024510
Wallace, B. P., DiMatteo, A. D., Hurley, B. J., Finkbeiner, E. M., Bolten, A. B., Chaloupka, M. Y., et al. (2010). Regional management units for marine turtles: a novel framework for prioritizing conservation and research across multiple scales. PLoS ONE 5:e15465. doi: 10.1371/journal.pone.0015465
Witherington, B. E., and Ehrhart, L. M. (1989). “Status and reproductive characteristics of green turtles (Chelonia mydas),” in Proceedings of the Tenth Annual Workshop on Sea Turtle Biology and Conservation, eds T. H. Richardson, J. I. Richardson, and M. Donnelly (Miami, FL: NOAA Technical Memorandum NMFS-SEFC-278), 351–352.
Keywords: Central West Pacific, sea turtles, population assessment, nesting demographic data, nest temperature, climate change, embryonic death
Citation: Summers TM, Martin SL, Hapdei JR, Ruak JK and Jones TT (2018) Endangered Green Turtles (Chelonia mydas) of the Northern Mariana Islands: Nesting Ecology, Poaching, and Climate Concerns. Front. Mar. Sci. 4:428. doi: 10.3389/fmars.2017.00428
Received: 21 September 2017; Accepted: 14 December 2017;
Published: 30 January 2018.
Edited by:
Richard Reina, Monash University, AustraliaReviewed by:
Leslie Cornick, Eastern Washington University, United StatesTammy Robinson-Smythe, Stellenbosch University, South Africa
Copyright © 2018 Summers, Martin, Hapdei, Ruak and Jones. This is an open-access article distributed under the terms of the Creative Commons Attribution License (CC BY). The use, distribution or reproduction in other forums is permitted, provided the original author(s) and the copyright owner are credited and that the original publication in this journal is cited, in accordance with accepted academic practice. No use, distribution or reproduction is permitted which does not comply with these terms.
*Correspondence: Summer L. Martin, summer.martin@noaa.gov