Impacts of Ocean Warming on China's Fisheries Catches: An Application of “Mean Temperature of the Catch” Concept
 Cui Liang
 Weiwei Xian
 Daniel Pauly
- 1CAS Key Laboratory of Marine Ecology and Environmental Sciences, Institute of Oceanology, Chinese Academy of Sciences, Qingdao, China
- 2Laboratory for Marine Ecology and Environmental Science, Qingdao National Laboratory for Marine Science and Technology, Qingdao, China
- 3Sea Around Us, Institute for the Oceans and Fisheries, University of British Columbia, Vancouver, BC, Canada
Ocean warming can strongly impact marine fisheries; notably, it can cause the “mean temperature of the catch” (MTC) to increase, an indicator of the tropicalization of fisheries catches. In this contribution, we explore MTC changes in three large marine ecosystems (LMEs) along China's coasts, i.e., the Yellow Sea, East China Sea, and South China Sea LMEs, and their relationships to shifts of sea surface temperature (SST). The results show that, while the MTCs began to increase in 1962 in the East China Sea and in 1968 in the Yellow Sea, there was no detectable increase in the South China Sea. There also was a strong relationship between MTC and SST in the Yellow and East China Seas from 1950 to 2010, especially when taking a 3-year time-lag into account. The lack of change of the MTC in the South China Sea is attributed to the relatively small increase in SST over the time period considered, and the fact that the MTC of tropical ecosystems such as the South China Sea is not predicted to increase in the first place, given that their fauna cannot be replaced by another, adapted to higher temperature. Overall, these results suggest that ocean warming is already having an impact on China's marine fisheries, and that policies to curtail greenhouse gas emissions are urgently needed to minimize the increase of these impacts on fisheries.
Introduction
Climate change and ocean warming resulting from greenhouse-gas emissions are directly affecting the ecophysiology of marine fishes and invertebrates (Cheung et al., 2009, 2010, 2013; Genner et al., 2010). Previous studies suggest that, to cope with changing temperatures, marine fishes and invertebrates change their distribution range (Perry et al., 2005; Dulvy et al., 2008) and phenology (Genner et al., 2010). With ocean temperatures increasing, areas previously inhabited by a set of species to levels cease to be thermally optimal, and the growth and reproduction of marine fishes and invertebrates decrease, ultimately reducing their abundance (Pörtner and Knust, 2007; Pauly, 2010). On the other hand, some fishes and invertebrates may colonize and flourish in areas previously unsuitable for their survival. Consequently, fishes and invertebrates will tend to shift their distribution toward higher-latitudes (Perry et al., 2005), which is expected to affect the availability of exploited populations and thus leads to “tropicalization” of fisheries catches (Cheung et al., 2012, 2013; Wernberg et al., 2013).
To detect the effects of climate change on fisheries catch, a new indicator, the mean temperature of the catch (MTC), was introduced by Cheung et al. (2013). The MTC is computed from the average inferred temperature preference of exploited species weighted by their annual catch, which makes it easy to parameterize using easily accessible data. The MTC was shown to correlate strongly with regional sea surface temperatures (SSTs), except in the tropics, where the MTC does not increase beyond 26–27°C (because marine fishes and invertebrates do not exist that have much higher preferred temperature), while SSTs easily do.
However, if MTC is to become accepted as an index of the impact of climate change on marine fisheries, it also has to be applicable at smaller scales, such as in the Aegean Sea (Keskin and Pauly, 2014; Tsikliras and Stergiou, 2014). In this contribution, we explore MTC shifts and their relationships to SST changes in three of China's Large Marine Ecosystems (LMEs), the Yellow Sea (YS), East China Sea (ECS), and South China Sea (SCS). Our time series start in 1950, i.e., earlier than Cheung et al. (2013), and thus allowing the time to be detected from which the MTC shows an increasing trend, if any.
Materials and Methods
Large Marine Ecosystems
The Yellow, East China and South China Seas LMEs are located in the Western Pacific and bordered to the west by the coast of China (Figure 1).
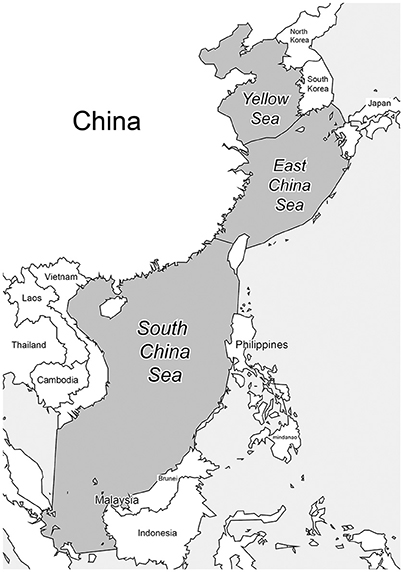
Figure 1. The three Large Marine Ecosystems adjacent to the Chinese coast, i.e., the Yellow Sea, the East China Sea, and the South China Sea.
These three LMEs have abundant fishery resources important to the bordering countries. The biological community of the Yellow Sea LME is typical in the North Pacific warm temperate zone, with both warm water and cold water species, and the species composition in the ecosystem shows obvious seasonal variations. Fishery resources are heavily exploited in the ECS, with about 200 species of fishes and invertebrates being exploited commercially. According to the East China Sea fishery resources survey conducted in 2000–2002, the density index of resources (i.e., biomass per surface area) of the top 20 species accounted for 91.6% of the total, while other species accounted for only 8.4% (Zhang et al., 2007). The South China Sea LME is in the tropics and has a wide range of biological resources. Notably, 1,000 fish species are exploited commercially, of which about 200 have relatively high economic value (Sherman and Hempel, 2008).
These three LMEs contribute over 90% of the domestic marine catches in China (Zhao, 2015); please refer to Sherman and Hempel (2008) for more information these three LMEs.
Catch Data Source
The fisheries catches data were sourced from the Sea Around Us (www.seaaroundus.org), which originated from a range of sources including the Food and Agriculture Organization's (FAO) fisheries database, supplemented by national data sets from the countries adjacent to these three LMEs, from North Korea in the north to Indonesia in the south (Zeller et al., 2016; see also contributions in Pauly and Zeller, 2016b). These catches data were “reconstructed” in the sense that where they were missing, discards, and the catches of artisanal, subsistence and recreational fisheries were added to the landing data reported to the FAO by the countries in question (Pauly and Zeller, 2016a).
Thermal Preference and Computation of the MTC
Our analysis covered 75 fish and invertebrate species in the Yellow Sea, 123 in the East China Sea and 221 in the South China Sea, contributing about half of total catches in the Yellow Sea and East China Sea, but <30% of total catches in the South China Sea (see www.seaaroundus.org). The remainder of the catches in these three LMEs were reported as higher taxa, i.e., genera, families, or higher. Because the species composition (and hence the temperature preference) of these aggregated groups could not be inferred, they were not included in our analyses.
The thermal preference of species originated from one of three sources (see also Table S1):
a) For the species in Cheung et al. (2013), the temperature preferences were as inferred from the overlap of their distribution range maps (Palomares et al., 2016) with SST data from the Hadley Centre (www.metoffice.gov.uk/hadobs/hadisst), as reported in the Supplementary Online Material of Cheung et al. (2013);
b) For species not in (a), the median temperature preference were taken from Aquamaps (www.aquamaps.org);
c) For species not in (a) or (b), the median temperatures were obtained from the Biogeographic Information System (OBIS; www.iobis.org).
The MTC was computed as the average of the temperature preference of all exploited fishes and invertebrates species weighted by their annual catch:
where Ci,yr is the catch of species i in a specific LME in year yr, Ti is the median temperature preference of species i and n is the total number of species reported from the catch of the LME is question.
The average annual SSTs in each of the three LMEs considered here were extracted from Belkin (2009); these times series cover the years 1957 to 2006.
Results
Figure 2 presents times series of the total reconstructed catch from the Yellow Sea, East China Sea, and South China Sea LMEs, as extracted by the fleets and fishers of all countries operating in or along the shores of these ecosystems, along with the sums of the catches reported at species level, and which could be used in this analysis. Catches in 1950 were relatively low in all 3 LMEs, and gradually increased since; then they all experienced rapid increase from 1970s to 1990s. By the end of 1990s, the total catches in all 3 LMEs reached a peak, from which they declined in the 2000s. The catches reported as the level of species, and used in this analysis, exhibited similar trends.
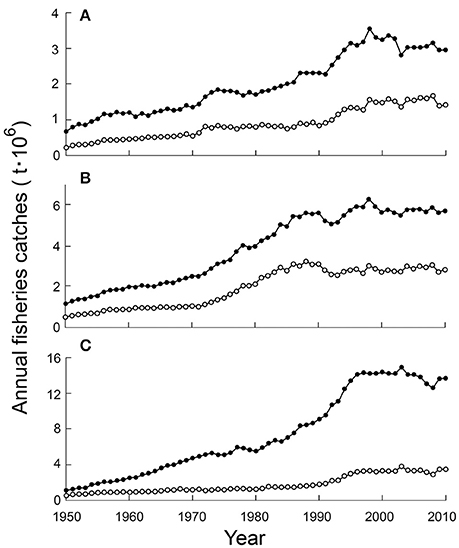
Figure 2. Fisheries catches from the Yellow (A), East China (B), and South China Seas (C); black dots: total reconstructed catch (from www.seaaroundus.org); white dots: catch reported by species (about half for the Yellow and East China Seas, and less than one third for the South China Sea).
The computed MTC values in the three LMEs covered here exhibited very different trends (Figure 3A). Thus, while MTC in the Yellow Sea increased at an average rate of 0.41°C per decade between 1950 and 2010, and the MTC in the East China Sea increased at a rate of 0.22°C per decade during the same period, the MTC in the SCS remained around 26°C (i.e., 26.3 ± 0.4).
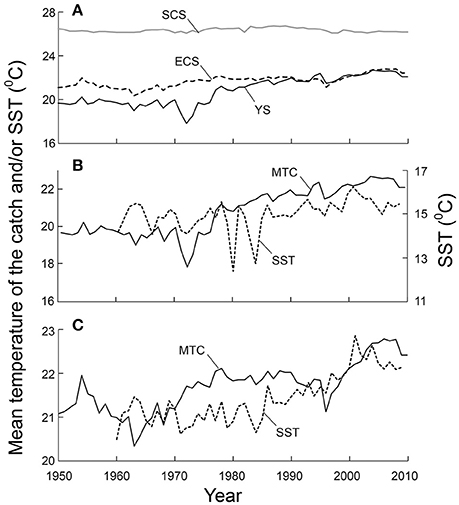
Figure 3. Time series of MTC in three LMEs (A) and relationships (in B,C) between the trends of MTC in the Yellow and East China Seas and the SSTs, with a lag of 3 years (see text and Table 1).
These results match prior expectations, as observed SSTs in the Yellow Sea increased from 1957 to 2006 by 1.27°C (Figure 3B), and by 1.64°C in the East China Sea (Figure 3C). There was a strong relationship between MTC and SST in the Yellow and East China Seas from 1950 to 2010, especially when taking a 3-year time-lag into account (Table 1). SSTs in the South China Sea exhibited a smaller increase, of 0.63°C since 1957 (Belkin, 2009). However, even the smaller SST change in the South China Sea does not explain why its MTC remained stable through the entire period considered here (but see section Discussion).
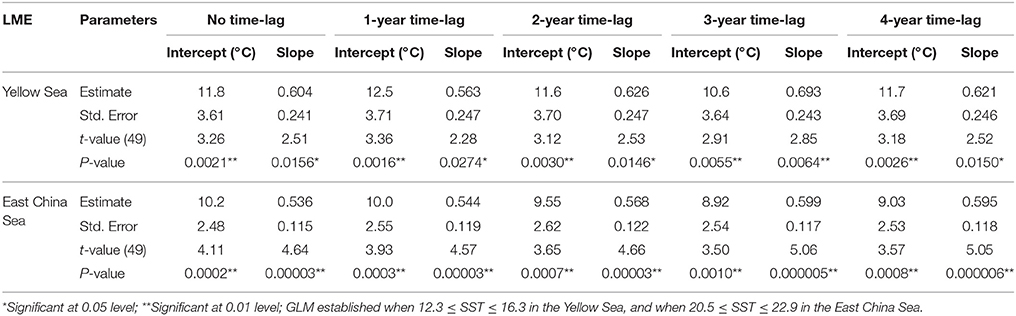
Table 1. Test statistics of GLM between MTC and SST without and with time-lag (up to 4 years).
Segmented regression analysis was used to detect the year when the MTC increase began. In the Yellow Sea, a relatively stable trend was observed at the beginning of the time series, and the MTC began to increase in 1968 (Figure 4A); in the ECS, the MTC began to increase in 1962 (Figure 4B).
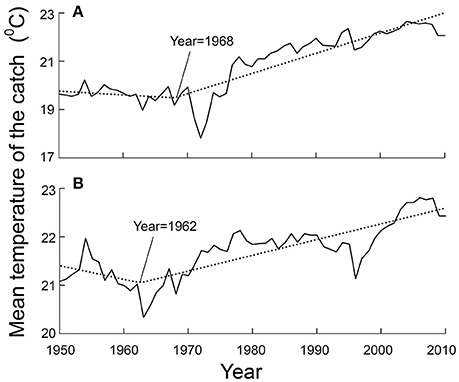
Figure 4. Segmented regressions, as used to demonstrate that the increase of SST in the Yellow Sea began in 1968 (A), and in 1962 in the East China Sea (B).
Finally, Figure 5 compares the composition of the catches in the Yellow and East China Seas in the 1950s with that of the 2000s in terms of the preferred temperature of the species in these catches. As might be seen, the more recent catches consist of more species with affinities to warmer waters. The mean MTC in the Yellow and East China Seas in the 1950s was 20.5°C, increasing to 22.5°C in the 2000s. The percentage of species whose median temperature preference was 12°C in 2000s experienced the most significant decrease, from 16.1% in the 1950s to 5.7% in 2000s; while the percentages of species whose median temperature preference were 24 and 28°C increased from 57.1 and 7.0% in the 1950s to 62.8 and 15.5% in the 2000s, respectively.
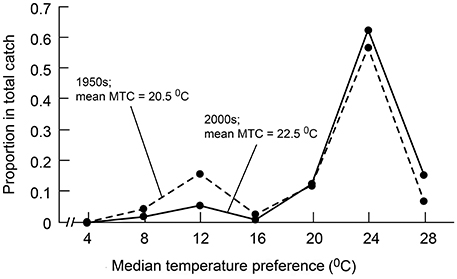
Figure 5. Fisheries catch composition comparison between 1950s and 2000s in the Yellow and East China Seas, illustrating the tropicalization of the fish communities.
Discussion
Reporting overaggregated taxa is a persistent issue with many countries' statistical reporting system. As the species composition (and hence the temperature preference) of aggregated groups could not be inferred, the catches used for MTC calculation contributed about half of total catches in the Yellow Sea and East China Sea, but <30% of total catches in the South China Sea.
Greenhouse gas emissions resulting from intensive human activities have been altering ocean properties since the beginning of twentieth century (Stocker et al., 2013), which include ocean warming, acidification and reduced ice cover in polar regions (Gattuso et al., 2015). Given the current rate of greenhouse gas emission, these alterations in ocean are expected to continue (Pörtner et al., 2014), and the mean global ocean temperature is projected to increase 1–4°C by the end of twenty-first century (Cheung and Pauly, 2016). China's seas have become warmer generally in the last few decades, but the trend is not homogenous, with the East China Sea experiencing the most pronounced increase and the South China Sea having the least increase (Belkin, 2009), which will have different effects on fisheries.
The basic body functions of fish, i.e., growth and reproduction must occur within certain temperature preference ranges and tolerance limits (Pörtner and Farrell, 2008; Pauly, 2010; Sunday et al., 2011). When the temperature of their environment is beyond the preferred range of the species, they respond by altering their distribution to maintain themselves within their preferred temperature range, as they do when they migrate seasonally (Pauly, 2010).
There is a large amount of observational evidence for distribution shifts of marine fishes in response to ocean warming, and meta-analyses have established that fishes are moving toward higher latitudes at average rates of 10 s of km per decade (Poloczanska et al., 2013). For example, a study conducted in the North-east Atlantic Ocean showed that 35 of the 50 abundant marine fishes in the NE Atlantic waters had shifted their ranges in the last few decades in directions that were consistent with gradients of SST change (Simpson et al., 2011). Similarly, Cheung et al. (2008) projected the impact of climate change on the distribution ranges of small yellow croaker (Larimichthys polyactis), one of the most important fishery resources in the Yellow and East China Seas, and predicted that its distribution range would reach well beyond the Yellow Sea, i.e., that this fish would invade the Bohai and Japan Seas. Similarly, a study focused on the Taiwan Strait showed that 13 new, warmer water species now occurred in the Taiwan Strait, which previously occurred more southward in the South China Sea (Dai, 2004). In addition, 25 fish species, including, e.g., Daya jordani, Lepidotrigla japonica, and Pseudorhombus dupliocellatus, which were previously caught only in the southern part of the Taiwan Strait were now also caught in its northern part (Dai, 2004).
As different species, under ocean warming, shift their distribution ranges at different rates, cascading effects can occur within the marine ecosystems whose communities gain or lose species. Community composition shifts with an increase of warmer-water marine species have been observed in many temperate and colder regions of the world (Arvedlund and Kavanagh, 2009; Fodrie et al., 2010; Stergiou and Tsikliras, 2011; Keskin and Pauly, 2014). Given a strong exploitation rate, as occurs in most of the world's LMEs, fish community change will be reflected in the composition of survey and/or commercial fisheries catches (Cheung et al., 2013), which makes the MTC a valid proxy to examine the effects of ocean warming imposed on the marine communities structure.
In addition to ocean warming, fishing activities and large-scale climate oscillations can also affect species abundances and shift community composition, but in different ways. Intensive fishing pressure leads to catch compositions shifting from a dominance of large, high-trophic level species to relatively small, low-trophic level species (Pauly et al., 1998); however, there is no selection for fishes with different temperature preferences. Large-scale climate oscillation, such as ENSO, which can also impact the distribution of fishery resources, has limited impacts on China's coastal LMEs. Moreover, instead of causing MTC to steadily increase, ENSO usually causes fish to concentrate in various areas, and hence fishing fleets to move back and forth. Therefore, neither fishing activities nor large-scale climate oscillation would lead to long-term trends in MTC.
Although using SST for comparison with MTC has been done in previous studies (Cheung et al., 2013; Keskin and Pauly, 2014), it has some possible inherent limitations. For instance, species are living in the whole column (or in different part of it), and the water column might be impacted differently by global warming. Although a long-term study conducted in the Yellow Sea found similar trends between the SST and the sea bottom layer temperature (Lin et al., 2005) which supports our analysis, future implementations might also explore MTC trends in connection with habitat preferences and uncorrelated temperature trends along the depth gradient.
MTC values computed for the Yellow and East China Seas have increased since 1950 (Figures 3B,C), as also can be seen by comparing the distribution of the temperature preferences of the species caught (Figure 5). That the MTC for the SCS did not increase (see Figure 3A) while SSTs for the same LME increased (Belkin, 2009) may at first seem to invalidate the MTC as a reliable proxy. However, a moment of reflection should suffice to realize that when a tropical ecosystem (such as the South China Sea) becomes warmer, the tropical fish therein that move away, in spite of their high temperature preferences, are not going to be replaced by other fishes with even higher temperature preferences. Thus, the MTC of tropical ecosystems will tend to stay more or less constant, as observed here for the South China Sea, and as anticipated by Cheung et al. (2013). The impacts of ocean warming imposed in the tropics can be quantified by the catch potential of fisheries, which may decline up to 40% in the tropics in 2055 compared with 2005 (Cheung et al., 2010).
Figure 3B required two scales for its Y-axis, i.e., one for its MTC, the other for its much lower (mean annual) SSTs. We interpret this as suggesting that fisheries catches in the Yellow Sea consist to a larger extent than in the other LMEs of warm-water fishes that visit the Yellow Sea in summer. We suggest that it is a hypothesis worth testing, as it would, if corroborated, add to information that could be extracted from MTC time series.
Climate change, and more specifically ocean warming, is projected to affect fish catches and communities in many different ways. Distribution range shifts of fishes and invertebrates will lead to redistribution of global catch potential, and China is among the countries with the largest predicted loss in catch potential (Cheung et al., 2010) and thus benefits from fisheries (Sumaila et al., 2011). Also, the fish distribution shifts can lead to fish communities that have not co-evolved as those previously observed (Molinos et al., 2015), and thus reduce the resilience of ecosystems (Cheung and Pauly, 2016).
The total catches for each of the 3 LMEs studied here (including the SCS) do decline (see Figure 2). For the YS and the ECS, this is the case since about 2000. That this is the case also for the SCS confirm Cheung et al. (2013), who suggested that the catch of tropical fish and invertebrates should decline, given that the population migrating out of the tropics would not be replaced by population for even warmer areas. However, Cheung et al. (2013) did not provide an estimate of the rate at which catches should decline, and the one estimated here, of 0.32% per year (See Figure 2C) is as reasonable as any.
Also, if Cheung et al. (2013) had estimated a rate of decline, it would have been under the assumption of “ceteris paribus,” i.e., that all other factors (e.g., fishing effort) are kept constant. This is far from reality. Thus, while the Chinese catches in the SCS have remained more of less steady since the 1990s, fishing effort has been increasing continuously [Fisheries and Fishery Administration of the Ministry of Agriculture (1979-2015)]. This suggests a decrease in the catch potential of that ecosystem.
Overall, jointly with overfishing, habitat degradation and pollution, ocean warming is having a large impact on China's marine fisheries, and the MTC can be used as a valid proxy to examine and quantify these impacts. Given that ocean warming is not unique to China, this study highlights the immediate need to implement adaptation policies to minimize the effect of such warming on fisheries in all marine ecosystems.
Conclusions
With a strong exploitation rate occurring in most of the world's LMEs, MTC can be taken as a valid proxy to examine the effects of ocean warming imposed on marine communities.
The MTCs began to increase in 1968 in the Yellow Sea and 1962 in the East China Sea, and a strong relationship was also found between MTC and SST in the Yellow and East China Seas, especially when taking a 3-year time-lag into account. There was no detectable increase in the South China Seas. In addition to the relatively small increase in SST over the time period considered here, the divergent trends of SST and MTC are attribute to the fact that the MTC of a tropical ecosystem such as the South China Sea was not predicted to increase in the first place, given that its fish fauna cannot be replaced by another with even higher temperature preferences.
Author Contributions
DP: conceptualization; CL: data curation; CL, WX: formal analysis; DP, CL, WX: funding acquisition; CL, WX: investigation; DP: methodology; DP: project administration; CL, DP, WX: resources; DP: supervision. CL, DP, WX: validation; CL, DP: visualization; CL, WX: writing and original draft; DP, CL, WX: writing and review and editing.
Funding
CL and WX acknowledge financial support from NSFC-Shandong Joint Fund for Marine Ecology and Environmental Sciences (U1606404) and National Natural Science Foundation of China (No. 31272663 and No. 41176138) and DP acknowledges support from Marisla Foundation.
Conflict of Interest Statement
The authors declare that the research was conducted in the absence of any commercial or financial relationships that could be construed as a potential conflict of interest.
Acknowledgments
We are grateful to Evelyn Liu for redrawing our figures. We thank PICES-2017 annual meeting for giving us the copyright permission to re-use this material.
Supplementary Material
The Supplementary Material for this article can be found online at: https://www.frontiersin.org/articles/10.3389/fmars.2018.00026/full#supplementary-material
References
Arvedlund, M., and Kavanagh, K. (2009). “The senses and environmental cues used by marine larvae of fish and decapod crustaceans to find tropical coastal ecosystems,” in Ecological Connectivity among Tropical Coastal Ecosystems, ed I. Nagelkerken (Dordrecht: Springer), 135–184.
Belkin, I. M. (2009). Rapid warming of large marine ecosystems. Prog. Oceanogr. 81, 207–213. doi: 10.1016/j.pocean.2009.04.011
Cheung, W. W., Lam, V. W., and Pauly, D. (2008). “Dynamic bioclimate envelope model to predict climate-induced changes in distribution of marine fishes and invertebrates,” in Modelling Present and Climate-Shifted Distributions of Marine Fishes and Invertebrates, W. Cheung, V. W. Lam, and D. Pauly. Fisheries Centre Research Reports.
Cheung, W. W., Lam, V. W., Sarmiento, J. L., Kearney, K., Watson, R., and Pauly, D. (2009). Projecting global marine biodiversity impacts under climate change scenarios. Fish Fish. 10, 235–251. doi: 10.1111/j.1467-2979.2008.00315.x
Cheung, W. W., Lam, V. W., Sarmiento, J. L., Kearney, K., Watson, R., Zeller, D., et al. (2010). Large-scale redistribution of maximum fisheries catch potential in the global ocean under climate change. Glob. Chang. Biol. 16, 24–35. doi: 10.1111/j.1365-2486.2009.01995.x
Cheung, W. W., Meeuwig, J. J., Feng, M., Harvey, E., Lam, V. W., Langlois, T., et al. (2012). Climate-change induced tropicalisation of marine communities in Western Australia. Mar. Freshw. Res. 63, 415–427. doi: 10.1071/MF11205
Cheung, W. W., and Pauly, D. (2016). “Impacts and effects of ocean warming on marine fishes,” in Explaining Ocean Warming: Causes, Scale, Effects and Consequences, eds D. Laffoley and J. M. Baxter (Gland: IUCN), 240–253.
Cheung, W. W., Watson, R., and Pauly, D. (2013). Signature of ocean warming in global fisheries catch. Nature 497, 365–368. doi: 10.1038/nature12156
Dai, T. (2004). Study on Ecological Capacity of Fishery Resources and Marine Fishing Industry Management in Fujian Sea Waters. Beijing: Science Press.
Dulvy, N. K., Rogers, S. I., Jennings, S., Stelzenmüller, V., Dye, S. R., and Skjoldal, H. R. (2008). Climate change and deepening of the North Sea fish assemblage: a biotic indicator of warming seas. J. Appl. Ecol. 45, 1029–1039. doi: 10.1111/j.1365-2664.2008.01488.x
Fodrie, F., Heck, K. L., Powers, S. P., Graham, W. M., and Robinson, K. L. (2010). Climate-related, decadal-scale assemblage changes of seagrass-associated fishes in the northern Gulf of Mexico. Glob. Chang. Biol. 16, 48–59. doi: 10.1111/j.1365-2486.2009.01889.x
Gattuso, J.-P., Magnan, A., Billé, R., Cheung, W., Howes, E., Joos, F., et al. (2015). Contrasting futures for ocean and society from different anthropogenic CO2 emissions scenarios. Science 349:aac4722. doi: 10.1126/science.aac4722
Genner, M. J., Halliday, N. C., Simpson, S. D., Southward, A. J., Hawkins, S. J., and Sims, D. W. (2010). Temperature-driven phenological changes within a marine larval fish assemblage. J. Plankton Res. 32 699–708. doi: 10.1093/plankt/fbp082
Keskin, C., and Pauly, D. (2014). Changes in the ‘Mean Temperature of the Catch’: application of a new concept to the North-eastern Aegean Sea. Acta Adriat 55, 213–218.
Lin, C., Ning, X., Su, J., Lin, Y., and Xu, B. (2005). Environmental changes and the responses of the ecosystems of the Yellow Sea during 1976–2000. J. Mar. Syst. 55, 223–234. doi: 10.1016/j.jmarsys.2004.08.001
Fisheries and Fishery Administration of the Ministry of Agriculture (1979-2015). China Fishery Statistical Yearbook (1979-2015). Beijing: Agricultural Press of China.
Molinos, J. G., Halpern, B. S., Schoeman, D. S., Brown, C. J., Kiessling, W., Moore, P. J., et al. (2015). Climate velocity and the future global redistribution of marine biodiversity. Nat. Clim. Change 6, 83–88. doi: 10.1038/nclimate2769
Palomares, M., Cheung, W., Lam, V., and Pauly, D. (2016). “The distribution of exploited marine biodiversity,” in Global Atlas of Marine Fisheries: A Critical Appraisal of Catches and Ecosystem Impacts, eds D. Pauly and D. Zeller (Washington, DC.: Island Press), 46–58.
Pauly, D. (2010). Gasping Fish and Panting Squids: Oxygen, Temperature and the Growth of Water-Breathing Animals. International Ecology Institute Oldendorf.
Pauly, D., Christensen, V., Dalsgaard, J., Froese, R., and Torres, F. (1998). Fishing down marine food webs. Science. 279 860–863. doi: 10.1126/science.279.5352.860
Pauly, D., and Zeller, D. (2016a). Catch reconstructions reveal that global marine fisheries catches are higher than reported and declining. Nat. Commun. 7:10244. doi: 10.1038/ncomms10244
Pauly, D., and Zeller, D. (2016b). Global Atlas of Marine Fisheries: A Critical Appraisal of Catches and Ecosystem Impacts. Washington, DC: Island Press.
Perry, A. L., Low, P. J., Ellis, J. R., and Reynolds, J. D. (2005). Climate change and distribution shifts in marine fishes. Science 308, 1912–1915. doi: 10.1126/science.1111322
Poloczanska, E. S., Brown, C. J., Sydeman, W. J., Kiessling, W., Schoeman, D. S., Moore, P. J., et al. (2013). Global imprint of climate change on marine life. Nat. Clim. Chang. 3, 919–925. doi: 10.1038/nclimate1958
Pörtner, H., Karl, D., Boyd, P., Cheung, W., Lluch-Cota, S., Nojiri, Y., et al. (2014). “Ocean Systems,” in Climate Change 2014: Impacts, Adaptation and Vulnerability. Part A Global and Sectoral Aspects. Contribution of Working Group II to the Fifth Assessment Report of the Intergovernmental Panel on Climate Change (Cambridge, UK, New York, NY: Cambridge University Press).
Pörtner, H. O., and Farrell, A. P. (2008). Physiology and climate change. Science 322, 690–692. doi: 10.1126/science.1163156
Pörtner, H. O., and Knust, R. (2007). Climate change affects marine fishes through the oxygen limitation of thermal tolerance. Science 315, 95–97. doi: 10.1126/science.1135471
Sherman, K., and Hempel, G. (2008). The UNEP Large Marine Ecosystem Report: A Perspective on Changing Conditions in LMEs of the World's Regional Seas. UNEP Regional Seas Report and Studies (Nairobi).
Simpson, S. D., Jennings, S., Johnson, M. P., Blanchard, J. L., Schön, P. J., Sims, D. W., et al. (2011). Continental shelf-wide response of a fish assemblage to rapid warming of the sea. Curr. Biol. 21, 1565–1570. doi: 10.1016/j.cub.2011.08.016
Stergiou, K. I., and Tsikliras, A. C. (2011). Fishing down, fishing through and fishing up: fundamental process versus technical details. Mar. Ecol. Prog. Ser. 441, 295–301. doi: 10.3354/meps09377
Stocker, T., Qin, D., Plattner, G., Tignor, M., Allen, S., Boschung, J., et al. (2013). IPCC, 2013: Climate Change 2013: the Physical Science Basis. Contribution of working group I to the fifth assessment report of the intergovernmental panel on climate change. Cambridge, UK, New York, NY: Cambridge University Press.
Sumaila, U. R., Cheung, W. W., Lam, V. W., Pauly, D., and Herrick, S. (2011). Climate change impacts on the biophysics and economics of world fisheries. Nat. Clim. Chang. 1, 449–456. doi: 10.1038/nclimate1301
Sunday, J. M., Bates, A. E., and Dulvy, N. K. (2011). Global analysis of thermal tolerance and latitude in ectotherms. Proc. R. Soc. Lond. B. Biol. Sci. 278, 1823–1830. doi: 10.1098/rspb.2010.1295
Tsikliras, A. C., and Stergiou, K. I. (2014). Mean temperature of the catch increases quickly in the Mediterranean Sea. Mar. Ecol. Prog. Ser. 515, 281–284. doi: 10.3354/meps11005
Wernberg, T., Smale, D. A., Tuya, F., Thomsen, M. S., Langlois, T. J., De Bettignies, T., et al. (2013). An extreme climatic event alters marine ecosystem structure in a global biodiversity hotspot. Nat. Clim. Chang. 3, 78–82. doi: 10.1038/nclimate1627
Zeller, D., Palomares, M. L. D., Tavakolie, A., Ang, M., Belhabib, D., Cheung, W. W. L., et al. (2016). Still catching attention: sea around us reconstructed global catch data, their spatial expression and public accessibility. Mar. Policy 70, 145–152. doi: 10.1016/j.marpol.2016.04.046
Keywords: ocean warming, China's seas, fisheries catches, mean temperature of the catch, tropicalization
Citation: Liang C, Xian W and Pauly D (2018) Impacts of Ocean Warming on China's Fisheries Catches: An Application of “Mean Temperature of the Catch” Concept. Front. Mar. Sci. 5:26. doi: 10.3389/fmars.2018.00026
Received: 26 October 2017; Accepted: 18 January 2018;
Published: 06 February 2018.
Edited by:
Simone Libralato, National Institute of Oceanography and Experimental Geophysics, ItalyReviewed by:
Irene Martins, Centro Interdisciplinar de Pesquisa Marine e Ambiental (CIIMAR), PortugalFabio Pranovi, Università Ca' Foscari, Italy
Copyright © 2018 Liang, Xian and Pauly. This is an open-access article distributed under the terms of the Creative Commons Attribution License (CC BY). The use, distribution or reproduction in other forums is permitted, provided the original author(s) and the copyright owner are credited and that the original publication in this journal is cited, in accordance with accepted academic practice. No use, distribution or reproduction is permitted which does not comply with these terms.
*Correspondence: Cui Liang, cui-liang@hotmail.com
Weiwei Xian, wwxian@qdio.ac.cn
Daniel Pauly, d.pauly@oceans.ubc.ca