Impacts of Bottom Trawling and Litter on the Seabed in Norwegian Waters
 Pål Buhl-Mortensen
 Lene Buhl-Mortensen
- Section Benthic Communities, Institute of Marine Research, Bergen, Norway
Bottom trawling and seabed littering are two serious threats to seabed integrity. We present an overview of the distribution of seabed litter and bottom trawling in Norwegian waters (the Norwegian Sea and the southern Barents Sea). Vessel Monitoring System (VMS) records and trawl marks (TM) on the seabed were used as indicators of pressure and impact of bottom trawling, respectively. Estimates of TM density and litter abundance were based on analyses of seabed videos from 1,778 locations, surveyed during 23 cruises, part of the Norwegian seabed mapping programme MAREANO. The abundance and composition of litter and the density of TM varied with depth, and type of sediments and marine landscapes. Lost or discarded fishing gear (especially lines and nets), and plastics (soft and hard plastic and rubber) were the dominant types of litter. The distribution of litter reflected the distribution of fishing intensity (density of VMS records) and density of TM at a regional scale, with highest abundance close to the coast and in areas with high fishing intensity, indicated from the VMS data. However, at a local scale patterns were less clear. An explanation to this could be that litter is transported with currents and accumulates in troughs, canyons, and local depressions, rather than reflecting the fisheries footprints directly. Also, deliberate dumping of discarded fishing gear is likely to occur away from good fishing grounds. Extreme abundance of litter, observed close to the coast is probably caused by such discarded fishing gear, but the contribution from aggregated populations on land is also indicated from the types of litter observed. The density of trawl marks is a good indicator of physical impact in soft sediments where the trawl gear leaves clear traces, whereas on harder substrates the impacts on organisms is probably greater than indicated by the hardly visible marks. The effects of litter on benthic communities is poorly known, but large litter items, such as lost fishing gear may add to the direct negative effects of bottom trawling.
Introduction
The Norwegian exclusive economic zone (EEZ) is large (2.1 Mkm2), and most of it is deep sea (>200 m). It includes a long coastline with numerous fjords, a wide shelf with banks, inserted canyons, and troughs, and an abyssal plain with depths down to 3,970 m. The size of the Norwegian population and industry sectors that may impact the marine ecosystems is small, with the fisheries, petroleum industry, and shipping as major activities. Bottom trawling and seabed littering are probably the two most serious threats to seabed integrity [Descriptor 6 in the European Union's Marine Strategy Framework Directive (MSFD); Galgani et al., 2015; Eigaard et al., 2016]. Knowledge about the distribution and intensity of these pressures are crucial for designing relevant regional management plans with the aims to achieve good environmental status (GES) (EC, 2008).
Fishing with bottom trawl has long traditions on the continental shelf in Norwegian waters. The target species in this area are mainly cod and haddock, but also deep sea prawns. These commercial stocks have for periods been fished extensively. Bottom trawling is mainly confined to areas where the target species aggregate. While the prawn fishery has been conducted both far north, including areas around Svalbard, and far south in the Skagerrak branch of the North Sea, the cod fishing areas has been gradually expanding northwards in recent years. It is known that bottom trawling has negative effects on benthic communities and habitats (Løkkeborg and Fosså, 2011; Lyubin et al., 2011; Puig et al., 2012; Buhl-Mortensen et al., 2013, 2016; Jørgensen et al., 2015). Especially sessile megafauna is negatively affected by breakage and dislodgement. Long-lived sessile megafauna, such as corals and sponges may need decades to fully recover from serious impact (Kaiser et al, 2006), whereas the recovery is quicker after moderate impact (Buhl-Mortensen, 2017).
Litter is present in all marine ecosystems, and may accumulate in the deep sea, especially at high latitudes (Bergmann and Klages, 2012; Galgani et al., 2015; Tekman et al., 2017). It has been documented by numerous studies that litter, especially plastics are harmful to marine birds and mammals. Less is known about how marine litter affects the benthic invertebrates and habitats (Mordecai et al., 2011). The effects of marine litter are various with clear, direct physical impacts like strangulation, tissue damage, and intestinal blockage in vertebrates. Generation of microplastic, leakage of environmental poisonous chemicals and introduction of alien substrate habitats are less visible, but not less serious. Lost fishing gear is a common type of litter in areas with fishing activities, and can result in so-called ghost fishing (Baeta et al., 2009).
The physical impact of petroleum related activities is much more restricted than the impact of bottom trawling. The petroleum industry also represents local sources of litter. The chemical pollution and risks of accidental spills of oil or chemicals is not assessed in this paper.
The main aim of this study is to present an overview of the distribution of fishing intensities (indicated from VMS records), seabed litter, and signs of bottom trawling. Knowledge about the spatial overlap of these pressure indicators is useful when assessing the risk for combined negative effects.
Materials and Methods
Study Area
The Norwegian Sea is the northeastern flank of the North Atlantic Ocean. It covers about 1.5 million square kilometers and has an average depth of 1,600 m. The marine landscapes are variable with shallow banks, canyons, and deep-sea basins where the depth reaches 3,000–4,000 m. It borders the Barents Sea off the northern coast of Norway (Figure 1), and with the waters of the North Sea to the southeast of the Faroe Islands. The Barents Sea is a high latitude shelf ecosystem located between about 70 and 80° N on the north-western corner of the European continental margin. It is a shelf area (about 1.6 million km2, mean depth 230 m) bounded in west and north by the deep basins of the Norwegian Sea and the Nansen Basin of the Arctic Ocean. The Norwegian Current, a branch of the Gulf Stream, transports warm water to the north past the United Kingdom (UK), through the Norwegian Sea and on into the Barents Sea.
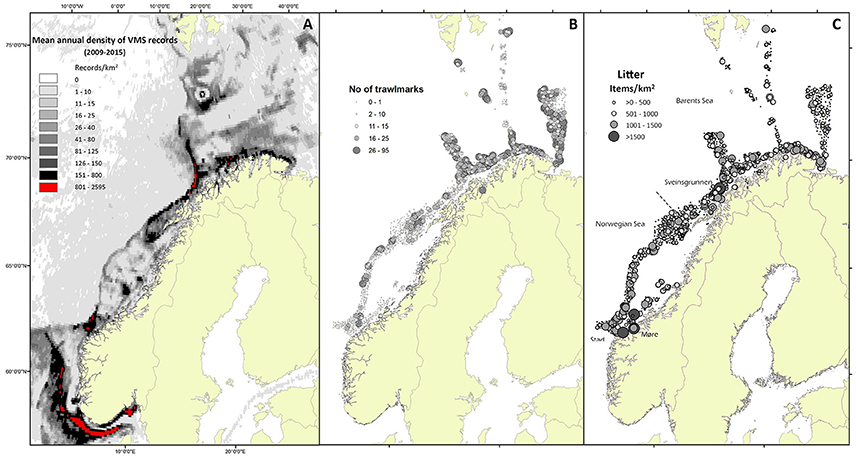
Figure 1. Overview of indicators of human pressure (A) and impact (B,C) on the seabed. (A) Annual mean density of VMS records (pings) based on aggregated data for the period 2009–2015. (B) Number of trawlmarks observed during visual inspections part of the Mareano mapping programme. (C) Density of seabed litter observed during visual inspections (Mareano).
The bottom topography guides the currents and controls the distribution of water masses in the Barents Sea (Loeng, 1991). The Norwegian Current splits into two main branches, one flowing into and through the Barents Sea from southwest to northeast, the other flowing around the western and northern flanks of the Barents Sea as the West Spitsbergen Current (Skagseth, 2008; Ingvaldsen and Loeng, 2009; Ozhigin et al., 2011).
MAREANOs mapping has so far covered 10 types of landscapes in Norwegian waters (Thorsnes et al., 2009; www.MAREANO.no/en). Landscape is defined as “large geographical areas with a visually homogeneous character.” Nine types of marine landscapes have been identified within the MAREANO mapping area: (1) Strandflat, (2) Fjord, (3) Continental shelf plain, (4) Marine valley, (5) Shallow marine valley, (6) Smooth continental slope, (7) Continental slope plain, (8) Marine canyon, (9) Deep sea plain.
Observations of Sediments, Trawl Marks, and Litter
The results of this study are based on analyses of seabed videos from 1,778 locations surveyed during 23 cruises between 2006 and 2017, part of the Norwegian seabed mapping programme MAREANO (Buhl-Mortensen et al., 2015). The study area (the extent of the MAREANO mapping area to date) covers around 170,000 km2 of the Norwegian Sea and the southern Barents Sea, and 3.735.900 m2 of the seabed has been directly observed with seabed video. Most of the observed locations (1,358) are shallower than 700 m depth, whereas 420 locations were deeper.
During the cruises, video transects were annotated in the field with respect to occurrence of sediment types, fauna, trawl marks and litter, using the annotation software CampodLogger vs. 0.39 (developed at Institute of Marine Research). Sediment observations were recorded following a modified Folk scale (Folk, 1954), and litter types were described as detailed as possible in the field, and later assigned to 10 classes (ceramics, glass, metal, wood, paper, hard plastic, soft plastic, rubber, fishing gear, and unspecified). This dataset has previously been used to describe the distribution and content of litter in Norwegian waters (Buhl-Mortensen and Buhl-Mortensen, 2017), but the results on observed sediment types and trawl marks have not been published in full extent. Dominating sediment type for each location was estimated as the most frequent recorded sediment type. Additional data on seabed litter from other studies were used for comparison. For studies only providing weight of litter, numbers were converted to number of items using the same assumed weight per item as in Buhl-Mortensen and Buhl-Mortensen (2017).
Vessel Monitoring System (VMS) Data from Norwegian Waters
In Norway, VMS was introduced on all Norwegian fishing vessels >24 m long in July 2000. Since then, the Norwegian Directorate of Fisheries has received information about time (minute resolution), vessel position, permit number, heading, and speed approximately every 60 min. In this study, we did not include data from before 2003, because earlier data had a higher frequency of missed records due to a less stable tracking system (Salthaug, 2006). VMS data was filtered based on speed, assuming that trawling is normally performed at a speed between 2 and 5 knots. We used the number of VMS point records as an indicator of fishing intensity (FI). For a general representation of the mean FI we estimated the average number of pings in a course gridnet (4 × 12 km; Figure 1A). For correlations between density of VMS records, trawl marks and seabed litter VMS records were counted within a circle (2 km radius) around the center of the Mareano video transects.
We used the VMS records from a 3 years period before the video surveys to estimate relevant FI for each location (e.g., results from surveys conducted in 2006 were related to FI estimates based on 2003–2005 records). Pearson product-moment correlation was used to assess the correlation between abundance of litter, density of TM, and FI.
Results
Distribution of Fishing Intensity (VMS Data)
Figure 1A shows the distribution of mean annual FI indicated by the aggregated VMS data. The areas indicated in red had a mean annual FI >800 VMS records/km2. The largest continuous areas with high FI were found in the North Sea, outside the range of the MAREANO mapping area. Relative large areas along the shelf break, along the coast of northern Norway, and at six areas on the continental shelf had an FI between 150 and 800 records/km2 (Figure 1A). Four landscapes were more intensely fished than others (Table 1): Highest FI was found for locations near the coast, within the strandflat landscape (mean of 27.8 records/km2). Locations on the continental shelf plain, in fjords, and in marine valleys had between 6.2 and 9.1 records/km2. The remaining five landscapes had less than six records/km2. The deep sea plain had the lowest FI.
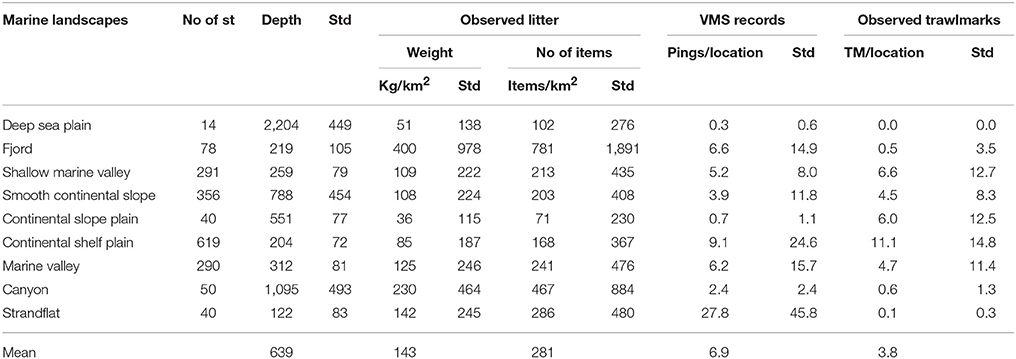
Table 1. Overview of density of litter and trawlmarks (TM) observed during MAREANO cruises and VMS data from the Norwegian Fisheries directorate (from 2003 to 2015).
Distribution of Trawl Marks and Sediment Types
TM may appear as trenches or furrows on the seabed (Figure 2). Their shape reflects the part of the trawl gear that has made the impact. The doors leave the deepest tracks with up to ca 50 cm deep and wide v-shaped trenches. Other parts of the trawl gear may leave more rounded marks or finer striations. Within the MAREANO mapping area, the highest densities of TM were found on the continental shelf plain, with an average density of 11.1 TM per video transect (Table 1). Locations in the northeastern part of the mapping area had the highest densities (Figure 1B). The density of TM, south of 69°N, was generally lower than further north, and were confined to areas around the shelf break (Figure 1B).
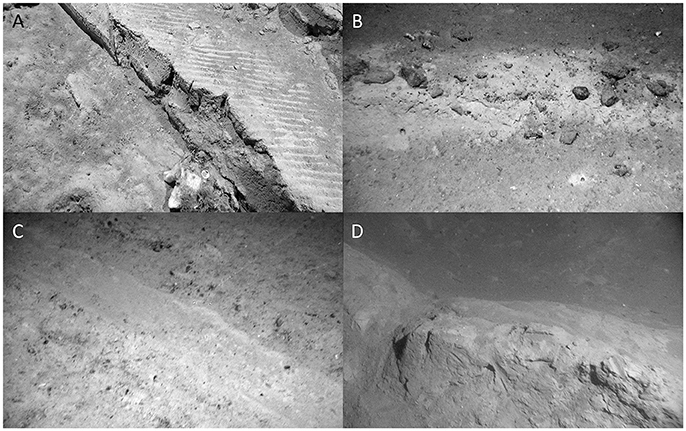
Figure 2. Examples of trawl marks observed on soft (A,D) and mixed bottoms (B,C) during MAREANO seabed video surveys.
It was highest between 200 and 400 m depth (Figure 3). However, there was also a less pronounced peak at depths between 600 and 700 m. These two peaks correspond to the relatively shallow fisheries for white fish on the continental shelf and close to the shelf break, and the deeper fisheries for Greenland halibut on the continental slope (Buhl-Mortensen et al., 2013).
Figure 3. Bathymetric distribution of VMS records (mean values of records per year for 3 years prior to video surveys). Observed trawl marks, and density of observed litter items.
Most of the 1,778 locations were dominated by mixed mud and sand (572 st), and mixed gravelly muds (477 st) (Table 2). The density of TM was generally weakly correlated with FI for most sediment types, except for locations dominated by mixed gravelly muds (R = 0.48, p < 0.005). A strong correlation between TM and FI for bedrock was not significant (p > 0.05). Cold-water coral reefs (Lophelia pertusa) were observed at 151 locations, and were the dominating bottom type at 41 (Table 2). TM were observed at 27% of the locations with coral reefs.
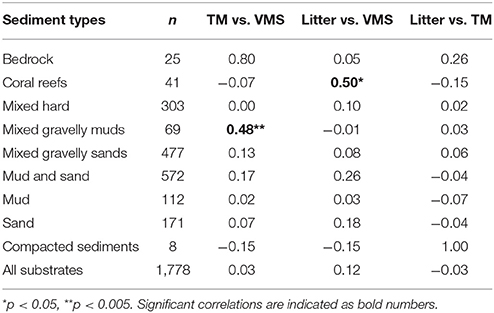
Table 2. Number of locations with dominance of different sediment types (n), and correlation (Pearson product-moment correlation) values (r) between trawl marks (TM), density of vessel monitoring system records (VMS), and density (no of items per km2) of observed litter for different substrates.
Distribution of Seabed Litter
Litter were observed at 27.4% of the locations. Most observations of litter with densities >1,500 items/km2 were from depths between 100 and 500 m (Figure 3). There was a general, and relatively similar pattern with depth for all parameters (litter abundance, TM density, and FI), with peak values between 100 and 400 m. However, none of these parameters were significantly (p < 0.05) correlated with each other.
Highest abundance of litter were found close to the coast and in areas with high fishing intensity, indicated from the VMS data. Different types of fishing gear were the most common (17% of locations) type of litter. Unspecified litter was observed at 8% of the locations, and plastics (soft plastic, hard plastic, and rubber) were observed at 4%. Other types of litter (metal, glass, ceramics, fabric, wood, and paper) occurred at <2% of the locations. Plastics were observed at 71 locations, most often (63) only as one item. The highest number of plastic items (three) were observed at one location outside Møre (in the Norwegian Sea; Figure 1). This was the same location as contained the highest number of lost/discarded fishing gear.
Extreme densities of litter, observed close to the coast were of dumped or lost fishing gear. Here, wires occurred in curles or bundles, indicating that they were not lost during normal fishing activities.
The abundance of litter reflected FI and densities of TM at a regional scale. However, at a local scale patterns were not so clear. No strong correlation was found for the relation between abundance of litter and TM (Table 2). Abundance of litter was strongest correlated with VMS records for locations with coral reefs (R = 0.50, p < 0.005).
Figure 4 show the average values for number of litter items/km2 for 100 m depth intervals above 1,000 m and for 400 m intervals below 1,000 m. Litter seems to aggregate in deep water, and the high values around 1,200 m was related to concentrations in canyons, whereas the peak at around 2,400 m represents the foot of the continental slope, where the steep slope meets the level abyssal plain. Lost or discarded fishing gear was the most abundant observed litter, and comprised 70–80% of all observations at shallow (<100 m) locations and at around 600 and 700 m depth. The contribution of plastics to the total amount of litter was greatest at around 600 m depth (21%), and 900 m depth (43%). Plastics were not observed deeper than 1,200 m (Figure 4).
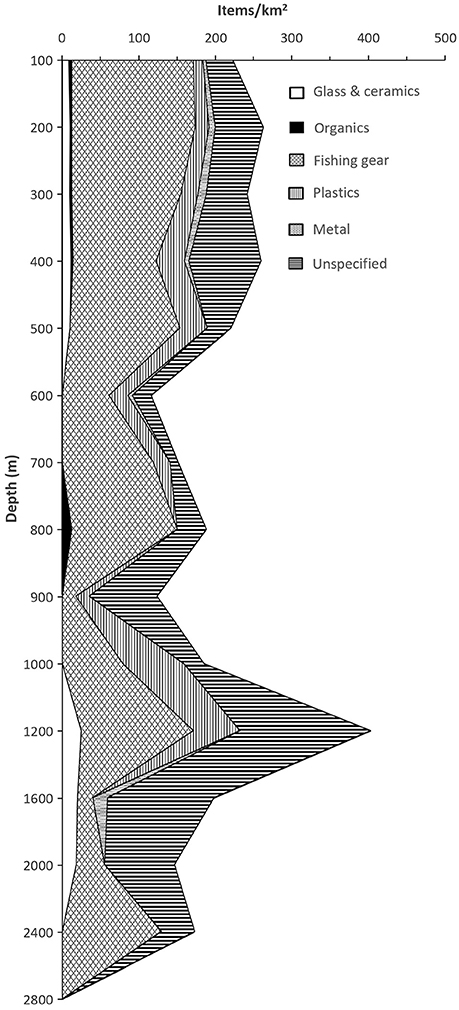
Figure 4. Average abundance of litter vs. depth.
Discussion
Methods
The use of VMS records as an indicator of FI has several weaknesses. Using vessel speed as a criterion to identify fishing activities may include vessels in slow transit or other activities than fishing (Skaar et al., 2011). This is probably the reason large areas in deep (>1,000 m) waters were indicated as being fished (although at a low intensity with 1–10 records/year). This is not realistic as these areas are not known to be used for bottom fishing. Detailed spatial patterns of FI cannot be reveled from VMS records since detailed track lines of the trawled paths are not provided because of too low rate of position recording (pings), and lack of direct information about time of fishing. This could explain the generally weak correlations between density of observed trawl marks (TM) and VMS records. Even so, the general patterns (aggregated at a broader scale) provide a good indication of areas that could be at risk for compromising the seafloor integrity. The high concentration of trawl marks in the northeastern part of the mapping MAREANO area is not reflected in the VMS records (Figures 1A,B). This is probably due to lack of data from Russian vessels, and the high density of observed trawl marks indicate a much higher FI than indicated from the VMS records.
Impacts of Bottom Trawling
Figure 1A shows areas with FI > 800 VMS records/km2, indicated in red color. According to Buhl-Mortensen et al. (2016) this FI could lead to ca 20% reduction of species richness.
The density of observed TM is a good indicator of trawling impact in soft sediments where the trawl gear leaves clear traces, whereas on harder substrates trawls leave less traces. Thus, the impacts on organisms on hard substrates is probably greater than indicated by TM.
Similar to the findings in this study, Buhl-Mortensen et al. (2016) in general found no strong correlation between density of TM and FI. They found that number of TMs was highest on mud, although FI was larger in sandy mixed bottoms. Also, the longevity of TMs (how long they are visible on the seabed) depends on the type of sediment; its softness and stability (Buhl-Mortensen et al., 2016). Buhl-Mortensen et al. (2016) reported a significant, negative relationship between FI and density and diversity of megabenthos for all substrates, except for mud. They found that most megabenthos taxa decreased in density with increased FI, with some few exceptions for scavengers. Vulnerability may be defined as a response to stressors based on increased mortality, and reduced growth and reproduction. For benthic, deep water species there are few results demonstrating the direct effect of stressors such as physical disturbance, dislodgement, and resuspension of sediments. The results are more indirect, by comparing abundances between areas of different degree of pressure (Buhl-Mortensen et al., 2013, 2016; Jørgensen et al., 2015). Commonly, fragility of taxa is assessed based on organism's size and flexibility (Parker et al., 2009; Parker and Bowden, 2010). Sessile marine megafauna with a size larger than 10 cm, often serve as habitats for other species, and are regarded as local providers of biodiversity hot-spots (Buhl-Mortensen et al., 2010). Many different taxa provide such habitats, but most common in some areas, and particularly on the shelf and shelf break off western and northern Norway, are the sponges and corals (octocorals and scleractinians). Four of the sixteen habitats listed by OSPAR (OSPAR Convention for the protection of the marine environment of the North-East Atlantic) as threatened and/or declining (OSPAR Commission, 2008a,b) occur in deep-water (>200 m) and are characterized by megafaunal invertebrates. The characterizing species for these habitats are regarded as sensitive to anthropogenic stressors such as destructive fishing activities (Buhl-Mortensen et al., 2010), sediment exposure or pollution. Table 3 summarizes the effects of fishing and litter on benthic organisms and habitats. Negative effects from bottom trawling have been clearest demonstrated for large megabenthos (corals and sponges; Fosså et al., 2002; Mortensen et al., 2005; Buhl-Mortensen et al., 2016; Buhl-Mortensen, 2017). Buhl-Mortensen (2017) studied the health status of Lophelia reefs off northern Norway in relation to bottom trawling, and found minimal damage on coastal reefs where little bottom trawling occurs, whereas extensive damage was documented on offshore reefs, exposed to greater FI. The damage observed on the reefs probably occurred more than 10 years before the investigation, when a ban against trawling on known coral reefs had been implemented.
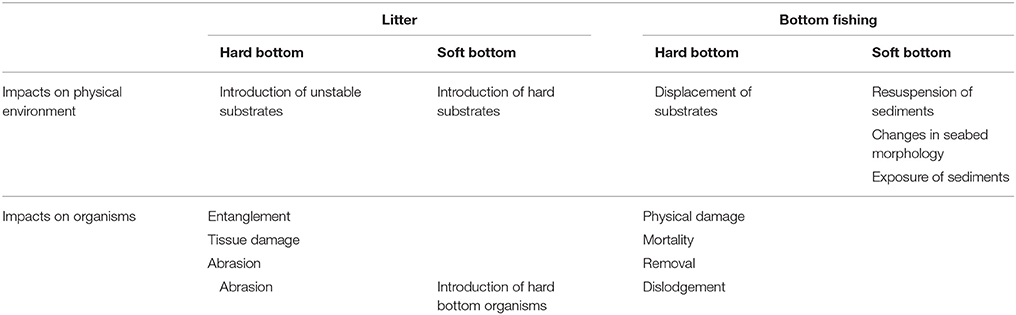
Table 3. Overview of impact of litter and bottom fishing on physical environment and organisms on hard and soft bottom.
The petroleum industry represents activities that cause physical impact at more restricted scale than bottom trawling, but also represents local sources of litter. The chemical pollution and risks of accidental spills of oil or chemicals is not assessed in this paper. In a study of effects of oil drilling on L. pertusa, Mortensen and Lepland (2007) found increased coral mortality locally (<500 m from the drilling), caused by discharge of drilling mud. Resuspended particles from bottom trawling could lead to similar effects on a greater scale, and studies have indicated great impact on sediment distribution and even changes bottom topography (Palanques et al., 2006; Puig et al., 2012).
Distribution and Sources of Litter
On average, the litter density in Norwegian waters is in the lower range compared to what has been reported in other studies (Pham et al., 2014; Galgani et al., 2015; Figure 5).
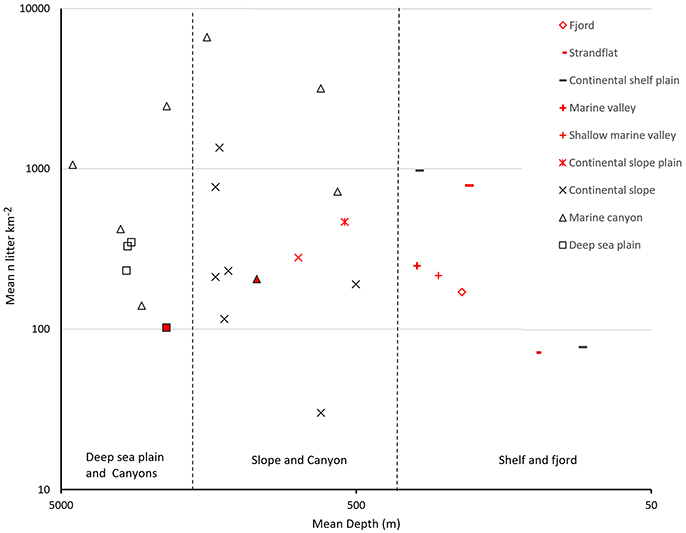
Figure 5. Mean abundance of litter in different marine landscapes at different depth. Data from Pham et al. (2014) and (Buhl-Mortensen and Buhl-Mortensen, 2017).
In our study we found that fishing gear dominates the litter, indicating that local activities are a more common source than long transport of drifting litter. However, the distribution of litter does not reflect the fishing intensity at a local scale (<1 km). This is partly explained by transport with currents of litter with light buoyancy during sinking, accumulation in troughs, canyons, and local depressions, but also deliberate dumping of waste or old fishing gear outside fishing grounds. Dumping of discarded fishing gear would probably more common outside the best fishing grounds rather than within, to avoid encounters that could damage the gear. “Piles” of wire observed in this study indicate this, and loss of gear due to attachment in the bottom would result in gear being suspended on the seabed.
Much of the fishing gear may also be classified as plastic, but in many cases, it was not possible to identify the material of the lines, nets and ropes. Other studies have found that plastic is the greatest contributor to seabed litter (Watters et al., 2010; Ramirez-Llodra et al., 2013; Tekman et al., 2017). The general pattern with highest densities in canyons reported in several studies (Watters et al., 2010; Mordecai et al., 2011; Ramirez-Llodra et al., 2013) is also clearly reflected in the data presented here. Bergmann and Klages (2012) and Tekman et al. (2017) have recorded increasing densities of litter at the slope west of Svalbard. Their results reports an increase from < 4,000 items/km2 in 2002 to more than 6,000 items/km2 in 2014. This leads to the question whether the deep sea is a sink hole for marine debris that can be transported with the currents. Tekman et al. (2017) indicate that increased tourism and fishing activity is an important factor to this increase. At a local scale, the FI was not correlated with abundance of litter at any bottom type, except for coral reef (R = 0.50, p < 0.005). The coral reefs are rugged structures where any type of litter, including fishing gear may get stuck. At a landscape scale, fjords and canyons are units that due to topographical properties act as retention sites for litter. The effects of litter on benthic communities is poorly known. In addition to direct effects on organisms' biological processes (e.g., respiration and food uptake) certain types of large litter items, such as lost fishing gear may add to the direct negative effects of bottom trawling when caught and dragged along the seabed. Clean-up of lost fishing gear and other litter with dredges could also cause negative physical impact, especially in fragile habitats such as coral reefs and biogenic habitats. It is therefore important to provide relevant maps based on direct information before starting sublittoral and deeper litter removal campaigns.
Author Contributions
PB-M and LB-M have contributed to this manuscript by providing data, analyzing, and writing.
Funding
This work is funded directly under the Norwegian annual budget as part of the funding of the MAREANO programme.
Conflict of Interest Statement
The authors declare that the research was conducted in the absence of any commercial or financial relationships that could be construed as a potential conflict of interest.
Acknowledgments
The partners in the MAREANO project are acknowledged for contribution to the gathering of large amounts of data over several years. Thanks to Frode Vikebø, Bjørn Einar Grøsvik, and Helene Eriksen at the Institute of Marine Research for support and fruitful discussions, and to the two referees for helpful comments.
References
Baeta, F., Jose' Costa, M., and Cabral, H. (2009). Trammel nets' ghost fishing off the Portuguese central coast. Fish. Res. 98, 33–39. doi: 10.1016/j.fishres.2009.03.009
Bergmann, M., and Klages, M. (2012). Increase of litter at the Arctic deep-sea observatory HAUSGARTEN. Mar. Pollut. Bull. 64, 2734–2741. doi: 10.1016/j.marpolbul.2012.09.018
Buhl-Mortensen, L., Aglen, A., Breen, M., Buhl-Mortensen, P., Ervik, A., Husa, V., et al. (2013). Impacts of Fisheries and Aquaculture on Sediments and Benthic Fauna: Suggestions for New Management Approaches. Fisken og Havet.
Buhl-Mortensen, L., and Buhl-Mortensen, P. (2017). Marine litter in the Nordic Seas: distribution composition and abundance. Mar. Pollut. Bull. 125, 260–270. doi: 10.1016/j.marpolbul.2017.08.048
Buhl-Mortensen, L., Buhl-Mortensen, P., Dolan, M. F. J., and Holte, B. (2015). The MAREANO programme – A full coverage mapping of the Norwegian off-shore benthic environment and fauna. Mar. Biol. Res. 11, 4–17. doi: 10.1080/17451000.2014.952312
Buhl-Mortensen, L., Ellingsen, K. E., Buhl-Mortensen, P., Skaar, K. L., and Gonzalez-Mirelis, G. (2016). Trawling disturbance on megabenthos and sediment in the Barents Sea: chronic effects on density, diversity, and composition. ICES J. Mar. Sci. 73, 98–114. doi: 10.1093/icesjms/fsv200
Buhl-Mortensen, L., Vanreusel, A., Gooday, A. J., Levin, L. A., Priede, I. G., Buhl-Mortensen, P., et al. (2010). Biological structures as a source of habitat heterogeneity and biodiversity on the deep ocean margins. Mar. Ecol. 31, 21–50. doi: 10.1111/j.1439-0485.2010.00359.x
Buhl-Mortensen, P. (2017). Coral reefs in the Southern Barents Sea: habitat description and the effects of bottom fishing. Mar. Biol. Res. 13, 1027–1040. doi: 10.1080/17451000.2017.1331040
EC (2008). Directive 2008/56/EC of the European Parliament and of the Council of 17 June 2008 establishing a framework for community action in the field of marine environment policy (Marine Strategy Framework Directive). J. Eur. Union 164, 19–40. Available online at: http://data.europa.eu/eli/dir/2008/56/oj
Eigaard, O. R., Bastardie, F., Hintzen, N. T., Buhl-Mortensen, L., Buhl-Mortensen, P., Catarino, R., et al. (2016). The footprint of bottom trawling in European waters: distribution, intensity, and seabed integrity. ICES J. Mar. Sci. 74, 847–865. doi: 10.1093/icesjms/fsw194
Folk, R. L. (1954). The distinction between grain size and mineral composition in sedimentary rock nomenclature. J. Geol. 62, 344–359. doi: 10.1086/626171
Fosså, J. H., Mortensen, P. B., and Furevik, D. M. (2002). The deep-water coral Lophelia pertusa in Norwegian waters: distribution and fishery impacts. Hydrobiologia 471, 1–12. doi: 10.1023/A:1016504430684
Galgani, F., Hanke, G., and Maes, T. (2015). “Global distribution, composition and abundance of marine litter,” in Marine Anthropogenic Litter, eds M. Bergmann, L. Gutow, and M. Klages (Berlin: Springer), 29–56.
Ingvaldsen, R., and Loeng, H. (2009). “Physical oceanography,” in Ecosystem Barents Sea. Vol. 2009, eds E. Sakshaug, G. Johnsen, and K. Kovacs (Trondheim: Tapir Academic Press), 33–64.
Jørgensen, L. L., Planque, B., Thangstad, T. H., and Certain, G. (2015). Vulnerability of megabenthic species to trawling in the Barents Sea. ICES J. Mar. Sci. 73, i84–i97. doi: 10.1093/icesjms/fsv107
Kaiser, M. J., Clarke, K. R., Hinz, H., Austen, M. C. V., Somerfield, P. J., and Karakassis, I. (2006). Global analysis of response and recovery of benthic biota to fishing. Mar. Ecol. Prog. Ser. 311, 1–14. doi: 10.3354/meps311001
Loeng, H. (1991). Features of the physical oceanographic conditions of the Barents Sea. Polar Res. 10, 5–18. doi: 10.3402/polar.v10i1.6723
Løkkeborg, S., and Fosså, J. H. (2011). “Impacts of bottom trawling on benthic habitats,” in The Barents Sea: Ecosystem, Resources and Management: Half a Century of Russian-Norwegian Cooperation, eds T. Jakobsen and V. K. Ozhigin (Bergen: Fagbokforlaget), 760–767.
Lyubin, P. A., Anisimova, A. A., and Manushin, I. E. (2011). “Long-term effects on benthos of the use of bottom fishing gears,” in The Barents Sea: Ecosystem, Resources and Management: Half a Century of Russian-Norwegian Cooperation, eds T. Jakobsen, and V. K. Ozhigin (Bergen: Fagbokforlaget), 768–775.
Mordecai, G., Tyler, P. A., Masson, D. G., and Huvenne, V. A. I. (2011). Litter in submarine canyons off the west coast of Portugal. Deep-Sea Res. II 58, 2489–2496. doi: 10.1016/j.dsr2.2011.08.009
Mortensen, P. B., Buhl- Mortensen, L., Gordon, D. C. Jr., Fader, G. B. J., McKeown, D. L., and Fenton, D. G. (2005). Effects of fisheries on deep-water gorgonian corals in the Northeast channel, Nova Scotia (Canada). Am. Fish. Soc. Symp. 41, 369–382.
Mortensen, P. B., and Lepland, A. (2007). Ecological Consequences of Exploration Drilling on Coral Reefs in the Træna Deep. Fisken og havet No 7-2007.
OSPAR Commission (2008a). OSPAR List of Threatened and/or Declining Species and Habitats. Reference number 2008-6.
OSPAR Commission (2008b). Descriptions of Habitats on the OSPAR List of Threatened and/or Declining Species and Habitats. Reference number 2008-7.
Ozhigin, V. K., Ingvaldsen, R. B., Loeng, H., Boitsov, V., and Karsakov, A. (2011). “Introduction to the Barents Sea,” in The Barents Sea. Ecosystem, Resources, Management. Half a Century of Russian-Norwegian Cooperation, eds T. Jakobsen and V. K. Ozhigin (Trondheim: Tapir Academic Press), 315–328.
Palanques, A., de Madron, X. D., Puig, P., Fabres, J., Guillén, j., Calafat, A., et al. (2006). Suspended sediment fluxes and transport processes in the Gulf of Lions submarine canyons. The role of storms and dense water cascading. Mar. Geol. 234, 43–61. doi: 10.1016/j.margeo.2006.09.002
Parker, S. J., and Bowden, D. (2010). Identifying taxonomic groups vulnerable to bottom longline fishing gear in the ROSS sea region. CCAMLR Sci. 17, 105–127. Available online at: https://www.ccamlr.org/en/system/files/science_journal_papers/05parker-bowden.pdf
Parker, S. J., Penney, A. J., and Clark, M. R. (2009). Detection criteria for managing trawl impacts on vulnerable marine ecosystems in high seas fisheries of the South Pacific Ocean. Mar. Ecol. Prog. Ser. 397, 309–317. doi: 10.3354/meps08115
Pham, C. K., Ramirez-Llodra, E., Alt, C. H. S., Amaro, T., Bergmann, M., et al. (2014). Marine litter distribution and density in European seas, from the shelves to deep basins. PLoS ONE 9:e95839. doi: 10.1371/journal.pone.0095839
Puig, P., Canals, M., Company, J. B., Martin, J., Amblas, D., Lastras, G., et al. (2012). Ploughing the deep sea floor. Nature 489, 286–290. doi: 10.1038/nature11410
Ramirez-Llodra, E., De Mol, B., Company, J. B., Con, M., and Sarda, F. (2013). Effects of natural and anthropogenic processes in the distribution of marine litter in the deep Mediterranean Sea. Prog. Oceanogr. 118, 273–287. doi: 10.1016/j.pocean.2013.07.027
Salthaug, A. (2006). Can Trawling Effort be Identified for Satellite-Based VMS Data? ICES Document CM 2006/N: 06.
Skaar, K. L., Jørgensen, T., Ulvestad, B. K. H., and Engås, A. (2011). Accuracy of VMS data from Norwegian demersal stern trawlers for estimating trawled areas in the Barents Sea. ICES J. Mar. Sci. 68, 1615–1620. doi: 10.1093/icesjms/fsr091
Skagseth, Ø. (2008). Recirculation of Atlantic Water in the western Barents Sea. Geophys. Res. Lett. 35:L11606. doi: 10.1029/2008GL033785
Tekman, M. B., Krumpen, T., and Bergmann, M. (2017). Marine litter on the Arctic seafloor continues to increase and spreads to the North at the HAUSGARTEN observatory. Deep-Sea Res. I 120, 88–89. doi: 10.1016/j.dsr.2016.12.011
Thorsnes, T., Erikstad, L., Dolan, M. F. J., and Bellec, V. K. (2009). Submarine landscapes along the Lofoten-Vesterålen-Senja margin, northern Norway. Norw. J. Geol. 89, 5–16. Available online at: http://njg.geologi.no/images/NJG_articles/Thorsnes_print.pdf
Keywords: marine litter, bottom trawling, deep-sea, anthropogenic impact, vessel monitoring system
Citation: Buhl-Mortensen P and Buhl-Mortensen L (2018) Impacts of Bottom Trawling and Litter on the Seabed in Norwegian Waters. Front. Mar. Sci. 5:42. doi: 10.3389/fmars.2018.00042
Received: 10 October 2017; Accepted: 29 January 2018;
Published: 27 February 2018.
Edited by:
Christopher Kim Pham, University of the Azores, PortugalReviewed by:
Eva Ramirez-Llodra, Norwegian Institute for Water Research, NorwayPierpaolo Consoli, ISPRA-Istituto Superiore per la Protezione e Ricerca Ambientale, Italy
Copyright © 2018 Buhl-Mortensen and Buhl-Mortensen. This is an open-access article distributed under the terms of the Creative Commons Attribution License (CC BY). The use, distribution or reproduction in other forums is permitted, provided the original author(s) and the copyright owner are credited and that the original publication in this journal is cited, in accordance with accepted academic practice. No use, distribution or reproduction is permitted which does not comply with these terms.
*Correspondence: Pål Buhl-Mortensen, paalbu@imr.no