Reading the Fine Print: Ultra-Microstructures of Foraminiferal Calcification Revealed Using Focused Ion Beam Microscopy
 Yukiko Nagai
 Katsuyuki Uematsu
 Ryoji Wani
 Takashi Toyofuku
- 1Graduate School of Environment and Information Sciences, Yokohama National University, Yokohama, Japan
- 2Department of Biodivesity, Japan Agency for Marine-Earth Science and Technology, Yokosuka, Japan
- 3Marine Works Japan LTD, Yokosuka, Japan
- 4Faculty of Environment and Information Sciences, Yokohama National University, Yokohama, Japan
- 5Tokyo University of Marine Science and Technology, Tokyo, Japan
The elemental composition of calcite is of critical value in paleoceanographic reconstructions, yet little is known about biological processes underlying elemental uptake by foraminifers during calcification. Especially crucial in the understanding of elemental composition and distribution is the involvement of organic templates separating different layers of calcite forming the wall of a foraminiferal chamber. In this study, we applied the focused ion beam (FIB) scanning electron microscopy (SEM) technique to the site of calcification (SOC) in a newly growing chamber of Ammonia “beccarii”, a benthic foraminifer, to reveal the ultra- and microstructure during calcification. This allowed cross-sections of both soft and hard tissues, allowing detailed observation of the SOC across a series of calcification stages. For the first time, we show that numerous voids of calcareous layers and internal organic structures are present within the SOC during the calcification process. The series of SEM observations suggest that organic layers are actively involved in calcite precipitation. We provide the first evidence that the SOC is isolated from surrounding seawater during calcification. Our findings improve the understanding of foraminiferal biomineralization and characterize key conditions under which element partitioning and isotope fractionation occur.
Introduction
Foraminifera is a group of ameboid protists which form calcareous exoskeletons (“tests”) that are commonly preserved in sediments and constitutes a widely used tool for paleoceanographic reconstructions. This is achieved by either using known ecological preferences of a particular group or by analyzing the test chemistry which reflects ambient environmental conditions during the foraminifer's lifespan. The incorporation of magnesium, for instance, is known to be primarily governed by temperature (Nürnberg et al., 1996; Elderfield and Ganssen, 2000; Anand et al., 2003) and therefore used to reconstruct oceanic thermal history (e.g., Lear et al., 2000).
Improved analytical techniques have enhanced our knowledge regarding spatial resolution and chemical characterization of foraminiferal tests. The use of spot analytical tools such as electron probe micro analysis (EPMA), laser ablation inductively coupled plasma mass spectrometry (LA-ICP-MS), and secondary ionized mass spectrometry (SIMS) reveals large intra- and inter-specific variability in the elemental and isotopic composition of foraminiferal tests. These can be attributed to a combination of species-specific biological conditions and environmental factors such as temperature, salinity, and seawater chemistry (e.g., Eggins et al., 2003; Erez, 2003; Sadekov et al., 2005; Toyofuku and Kitazato, 2005; Kunioka et al., 2006; De Nooijer et al., 2014a). In addition, condensed bands of magnesium, barium and sulfur are found in close association with the organic template within chamber walls (e.g., Kunioka et al., 2006; Paris et al., 2014; Spero et al., 2015; Van Dijk et al., 2017). The origin of these bands and the physiological processes responsible for their elemental uptake and incorporation are only partly understood (Elderfield et al., 1996; Zeebe and Sanyal, 2002; Erez, 2003; Toyofuku et al., 2008, 2017; De Nooijer et al., 2014b). To improve the reliability of foraminifer-based proxies it is crucial to identify and understand complex components of their biomineralization.
A pioneering study by Angell (1967) observed the relationship between newly precipitated calcite and cell materials in the benthic foraminifer Rosalina floridana by combining optical microscopy (OM), transmission electron microscopy (TEM) and scanning electron microscopy (SEM). There were numerous foamy structures described to be present at the site of calcification (SOC), which were shown to form the base of the initial organic matrix, termed “Anlage.” The Anlage is fibrous and composed of spherical structures. After its construction, microcrystals are deposited to form the layer of the chamber wall. Hemleben et al. (1986) also combined OM, TEM, and SEM to show the involvement of various foam-like structures during calcification in the planktonic foraminifer Globorotalia truncatulinoides. The Anlage was acting as an organic template for calcification in this species too. Later, the Anlage has also been referred to as Primary Organic Membrane (POM), and more recently the term Primary Organic Sheet (POS) has been proposed (Erez, 2003).
Spero (1988) showed TEM and SEM images of the calcification of the planktonic foraminifer Orbulina universa. Numerous vesiculate organic structures (submicron-1 μm in diameter) were present around the organic layers of both inner and outer surface of calcite wall, suggesting that this layer is actively involved in manipulating the chemistry of the fluid in the SOC. In addition, the primary organic sheet was found to be sandwiched by calcite layers, followed by outer and inner organic layers. It was also indicated that the primary organic sheet served as an organic calcification template on which the first layer of calcite was precipitated. The formation of pores, one important feature of foraminifera, was also shown. SEM micrographs of the constructing chamber showed that three organic layers (the outer organic layer, the inner organic layer, and the primary organic sheet) converged at the pore plates. In many subsequent studies (e.g., Spero, 1988; Bentov and Erez, 2006; De Nooijer et al., 2009a) it was assumed that the space between the primary organic sheet and the outer (as well as the inner) organic layer is completely filled by calcium carbonate during biomineralization.
A number of previous studies on biomineralization showed that the SOC (also termed the “deliminated space”) in a variety of organisms are partly occupied by small volumes of fluid within calcite layers (Wilbur, 1964; Mann, 2001; Tambutté et al., 2011; Keul et al., 2017). These pockets of fluid, if present, likely reflect the manipulated solution from which calcium carbonate is precipitated. In foraminifera, it has recently been shown by ratiometric fluorescent probe with pyranine (De Nooijer et al., 2009a) and micro glass electrode (Glas et al., 2012) that this fluid has a considerably higher pH than the surrounding medium, a result of proton pumping during calcification (Toyofuku et al., 2017). The external-internal pH difference may be as large as 2 pH units, meaning the SOC is well separated from the outside environment. This has important implications for the incorporation of elements, since they have been proposed to result from seawater entering the SOC (Erez, 2003; Bentov and Erez, 2006).
Among various calcification models proposed for foraminifera, Nehrke et al. (2013) proposed that ions other than calcium and carbonate (e.g., Mg2+, Sr2+, ) enter the SOC via a combination of Transmembrane Transport (TMT) and Passive Transport (PT) which is compatible with the SOC being separated from surrounding seawater. This model could be extended if the microstructure of the SOC and the flux of ion inwards could be accurately established. Observations on the SOC are currently limited to SEM observations, only showing the surface of the outer organic layer or the calcite layer.
To reveal the detailed configuration of the SOC, we fixed calcifying specimens of the benthic foraminifer Ammonia “beccarii” and subsequently prepared cross-sections using focused ion beam (FIB) to observe the detailed microstructure. The exposed sites of calcification were analyzed to determine their appearance and development throughout the process of chamber formation. Here, we focus on the structures that constitute the SOC, which we define here as the combination of the organic structures, the precipitated calcium carbonate, and the spaces between them, that together form the foraminiferal chamber wall.
Materials and Methods
Sample Collection and Laboratory Culture
Living foraminifera were collected from brackish salt marsh sediments of Hiragata bay, Natsushima-cho, Yokosuka, Japan (35°19′21″N, 139°38′5″E). Surface (the top 5 mm) sediments were collected and transported to the laboratory to serve as a stock from which foraminifera were isolated. Living specimens were recognized by their bright yellow coloration and pseudopodial activity. They were cleaned from excess sediment and debris under a stereomicroscope (SteREO Discovery V12, Zeiss Co. Ltd.) and then transferred to filtered (0.2 μm) natural seawater (salinity 35) in a Petri dish. The dishes were maintained as stock cultures at 20°C and a small amount of living microalgae (Dunaliella tertiolecta) were added to the Petri dishes twice a week. Within a few days after feeding, some individuals started chamber formation and were selected for observation.
Prior to chamber formation, foraminifera retract their psuedopodia and stay in a fixed location (Figure 1A). After that, the cytoplasm forms a shape corresponding to the new chamber to be formed (Figure 1B). Calcium carbonate precipitation can be identified by the bright rim of the formed cytoplasmic structure (Figure 1C) and then the chamber wall is thickened (Figure 1D). The formation of a new chamber takes 8–12 h in this species. By comparing with the sequence shown in Figure 1, our fixed specimens were estimated to have been fixed 2–4 h after the calcification process started. Five individuals with differing thickness of the new chamber wall were selected for FIB-SEM observation. These individuals were given sequential numbers #1-#5 from the thinnest to the thickest new chamber wall.
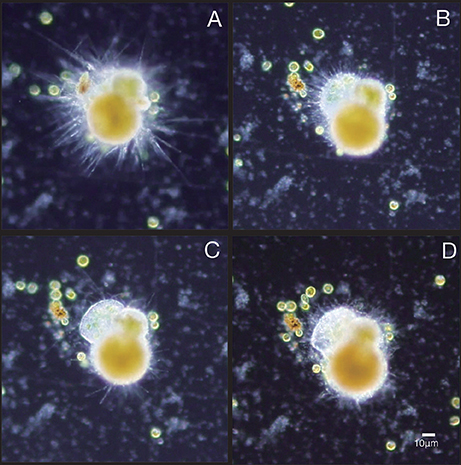
Figure 1. Chamber formation of the studied species Ammonia “beccarii”. (A) Just before forming a new chamber, with many fine filamentous pseudopodia protruding from the existing test. (B) About 20 min after shell formation started. (C) About 2 h after shell formation started. (D) About 5 h from the start of shell formation when chamber thickening takes place.
Microstructure Observation and EDS Analysis
All specimens were fixed simultaneously using a fixing solution (3% paraformaldehyde, 0.3% glutaraldehyde, 2% NaCl in PBS buffer, pH 7.8) and subsequently stored in 2.5% glutaraldehyde at 4°C to avoid any morphological changes in cell material by dehydration. They were then washed in filtered seawater, postfixed with 2% osmium tetra oxide filtered seawater for 2 h at 4°C. Then the specimens were rinsed with distilled water and conductive staining was performed by incubating in 0.2% aqueous tannic acid (pH 6.8) for 30 min. Following another wash using distilled water specimens were treated with 1% aqueous osmium tetra oxide for 1 h. Finally, they were dehydrated in a graded ethanol series and critical point dried (JCPD5; JEOL Ltd., Tokyo, Japan). All specimens were placed on glass plates for FIB cutting after drying to reduce handling damage. Specimens #1 and #3 were sputter coated with carbon, sectioned using a Hitachi MI4000L Focused Ion Beam SEM (FIB-SEM) system using gallium ion beam at the high voltage electron microscope (HVEM) laboratory, Nagoya university, Japan, with additional SEM observations carried out on a JSM6700F field emission scanning electron microscope (FE-SEM) in Japan Agency for Marine-Earth Science and Technology (JAMSTEC), Yokosuka, Japan. Specimens #2, #4, and #5 were osmium-coated and sectioned also using gallium ion beam with a FEI Helios G4 UX FIB-SEM (JAMSTEC). Elemental composition of all specimens was analyzed using a EDAX Octane Elite Super 70 energy dispersive spectrometer (EDS) equipped on the Helios G4 UX at JAMSTEC.
Results
Scanning electron micrographs of cross sections of the newly forming chamber wall in the five specimens, representing different stages of calcification, are shown in Figures 2–6. For the ease of direct comparison, Figure 7 shows the cross sections at the same scale. Specimen #1 had the thinnest SOC (Figure 7A). The width of the SOC increased with thickening of the crystal layers from Specimen #1 (Figure 7A; ~0.5 μm) to Specimen #5 (Figure 7E; ~1.5 μm). By having a series of five specimens in progressive calcification stages, the similarity of the structures in Specimen #1 and #5 can be confirmed, even if they appear quite different at the first glance. Figure 8 shows the calcium (Ca) distribution from SEM-EDS measurement at the SOC in all specimens (Figure 8, Figure S1). Ca signals overlapped on the calcareous layers. The spot analyses showed there were carbon (C), oxygen (O) and Ca signals detected with silicon (Si), gallium (Ga), osmium (Os) on the wall layer (Figure 8E-3). The elements Ca, O, and C are consistent with chemical contents of calcium carbonate, Ga was the source of FIB used for specimen cutting, Os is from osmium coating of the specimens, and Si is interpreted to be from glass plates used to handle the specimens post-critical point drying.
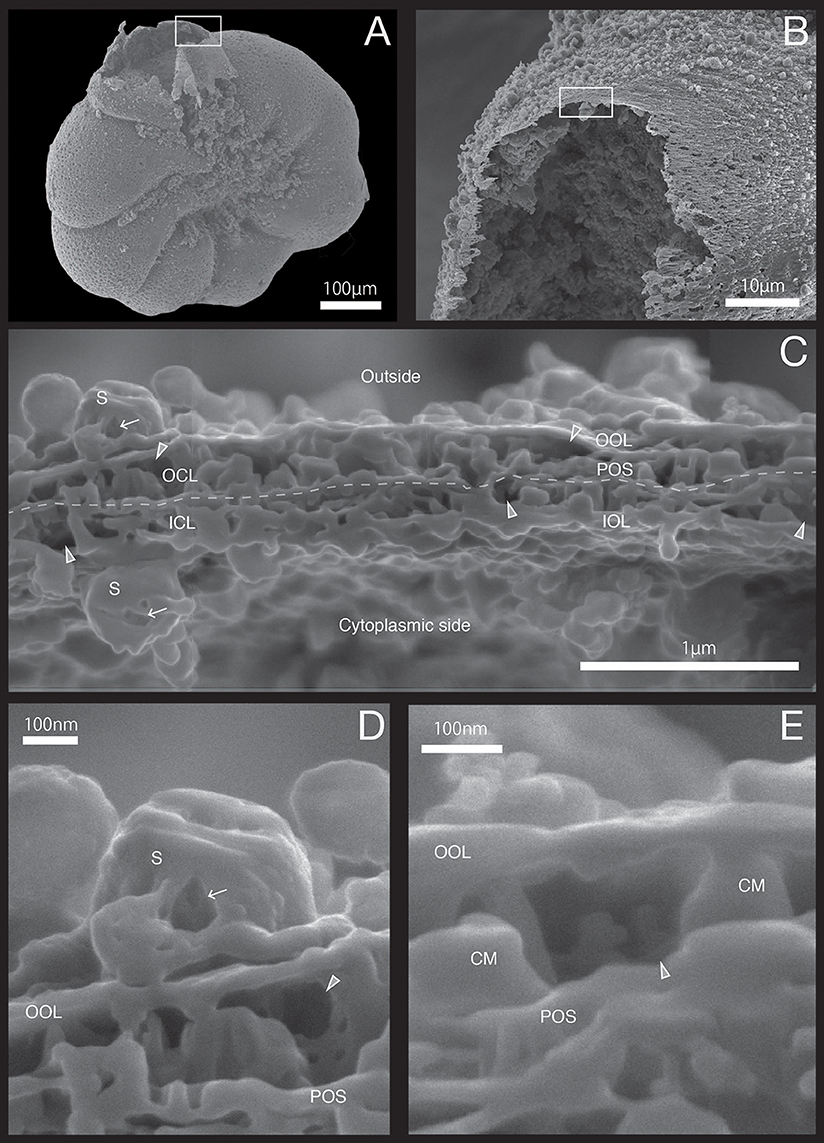
Figure 2. SEM images showing the microstructure of the SOC in specimen #1 processed by FIB on the newly calcified chamber wall. (A) Overview. (B) The newly calcified chamber (white rectangle in (A). The field of FIB processing is indicated by the white rectangle. (C) Composite SEM cross section of SOC of specimen #1. Upper side is the outside whereas the lower side is the cytoplasm side. The white dotted line in the calcareous layer indicates the boundary between outer side and cytoplasmic side of calcareous layer. (D) Magnified image of the empty inside of spherical structures on outer organic layer. (E) Higher magnification showing the void. OOL, outer organic layer; OCL, outer calcareous layer; POS, primary organic sheet; ICL, inner calcareous layer; IOL, inner organic layer; S, spherical structures; CM, calcareous materials; gray triangles, void; white arrows, cavities.
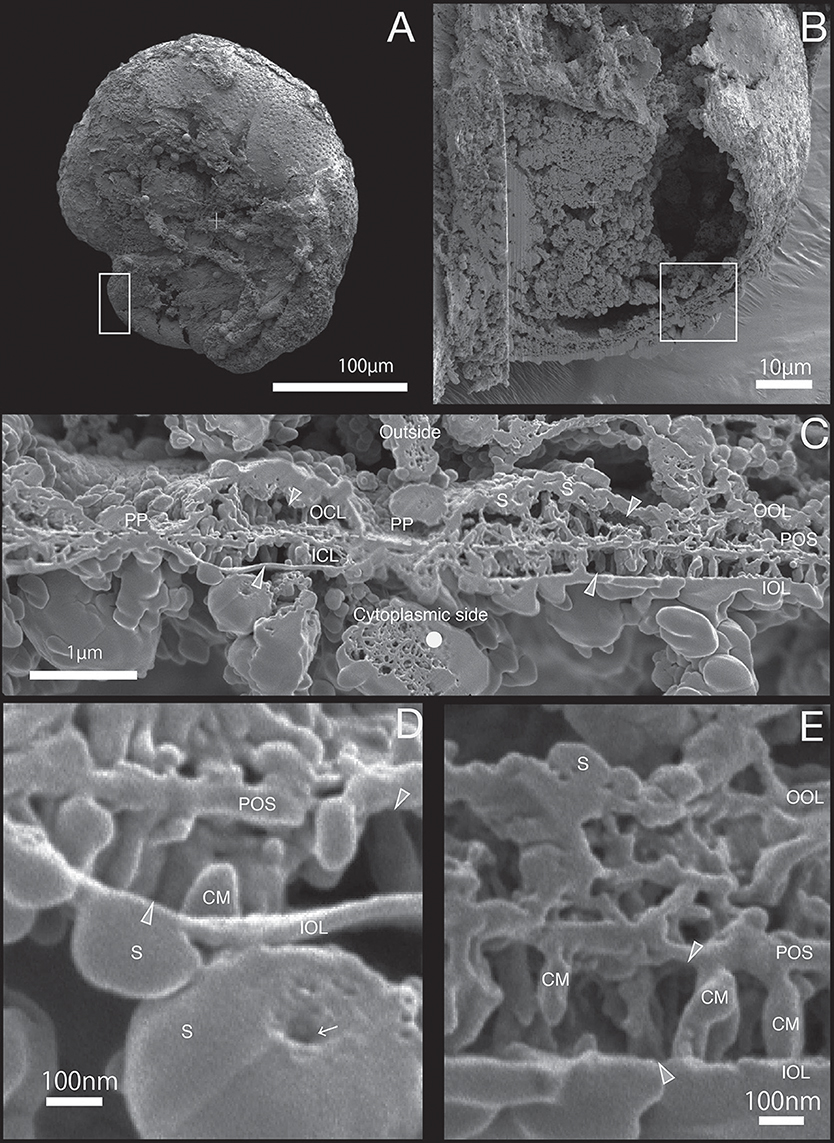
Figure 3. SEM images of specimen #2. (A) Overview. The white rectangle indicates the obseved newly calcifing chamber. (B) The newly calcified chamber (white rectangle in (A). The field of FIB processing is indicated by the white rectangle. (C) Composite SEM image of the FIB processed SOC. Upper side is the outside and whereas the lower side is the cytoplasmic side. The white dotted line in the calcareous layer indicates the boundary between outer side and cytoplasmic side of calcareous layer. (D) Magnified image of small calcareous materials. (E) Higher magnification showing the details of SOC. OOL, outer organic layer; OCL, outer calcareous layer; POS, primary organic sheet; ICL, inner calcareous layer; IOL, inner organic layer; S, spherical structures; CM, calcareous materials; PP, pore plate; gray triangles, void; white arrows, cavities; white dot, sponge like structure.
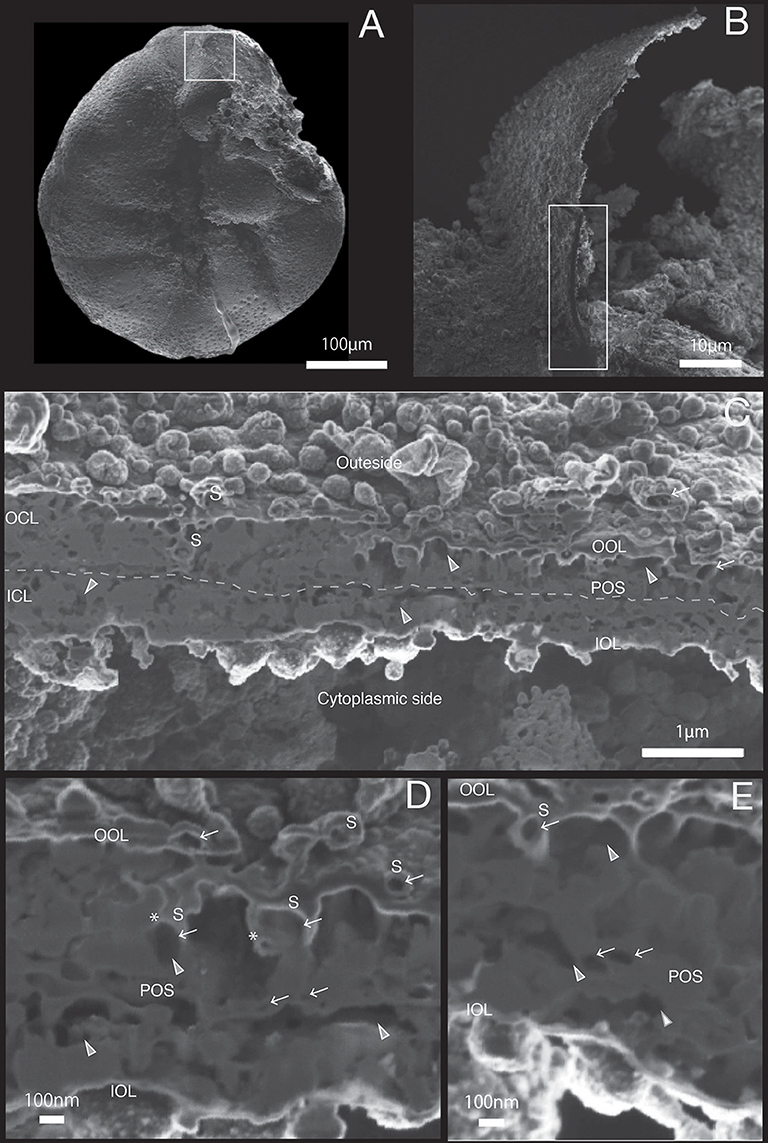
Figure 4. SEM images of specimen #3. (A) Overview. (B) The newly calcified chamber (white rectangle in (A). The field of FIB processing is indicated by the white rectangle. (C) Composite SEM image of the FIB processed SOC. Upper side is the outer side and whereas the lower side is the cytoplasmic side. White dotted line in the calcareous layer indicates the boundary between outer side and cytoplasmic side of calcareous layer. (D) Magnified image of porous structure of SOC. (E) Higher magnification showing the cavities within primary organic sheet and outer organic layer. OOL, outer organic layer; OCL, outer calcareous layer; POS, primary organic sheet; ICL, inner calcareous layer; IOL, inner organic layer; S, spherical structures; CM, calcareous materials; gray triangle, void; white arrow, cavity; asterisk, opening spherical structure from cavity into void.
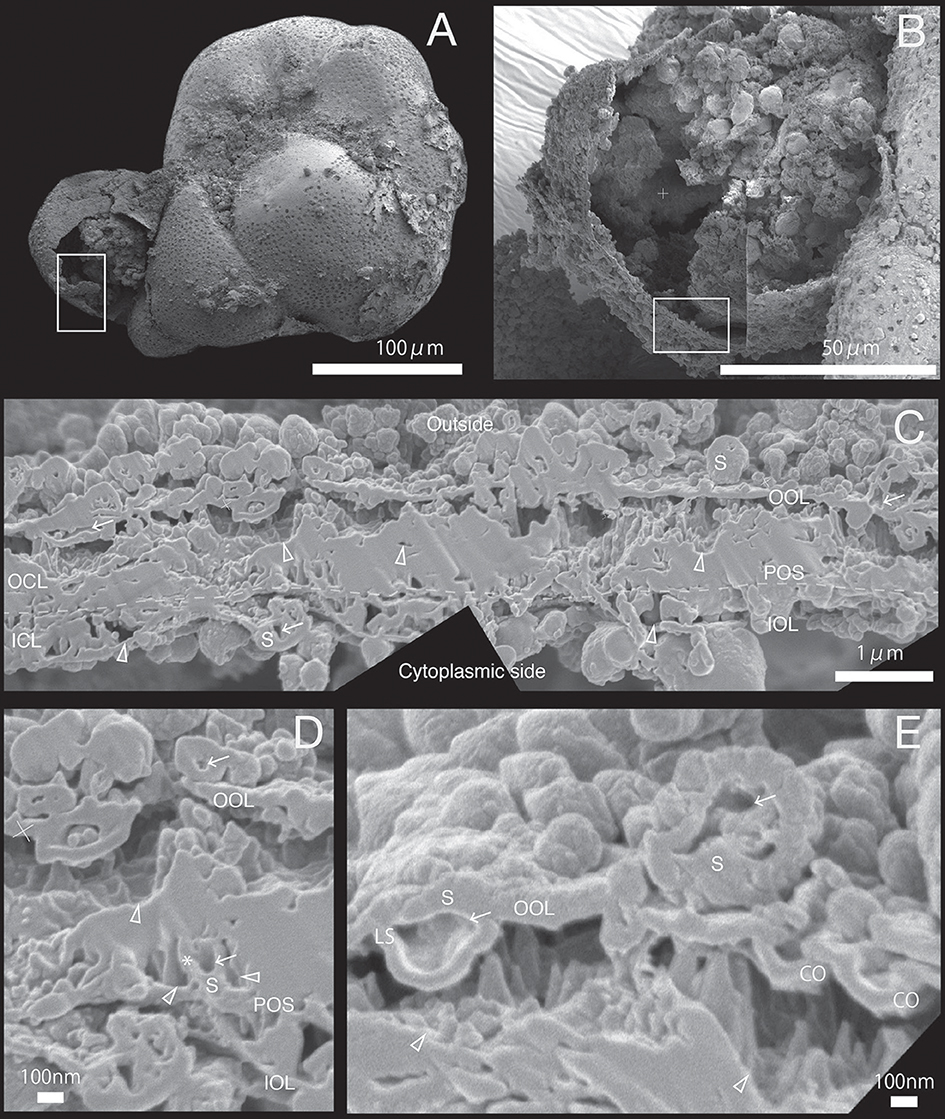
Figure 5. SEM images of specimen #4. (A) Overview. (B) The newly calcified chamber (white rectangle in (A). The field of FIB processing is indicated by the white rectangle.(C) Composite SEM image of the FIB processed SOC. The upper side is the outer side and whereas the lower side is the cytoplasmic side. White dotted line in the calcareous layer indicates the boundary between outer side and cytoplasmic side of calcareous layer. (D) Magnified image of spherical structure on primary organic sheet. (E) Higher magnification showing the outer organic layer is cave into void of outer calcareous layer (CO). A cavity (white arrow) can be identified on spherical structure of outer organic layer (LS). OOL, outer organic layer; OCL, outer calcareous layer; POS, primary organic sheet; ICL, inner calcareous layer; IOL, inner organic layer; S, spherical structures; CM, calcareous materials; PP, pore plate; gray triangles, void; white arrows, cavities in the organic structure; CO, concavity; asterisk, opening spherical structure from cavity into void; LS, spherical structure with larger cavity.
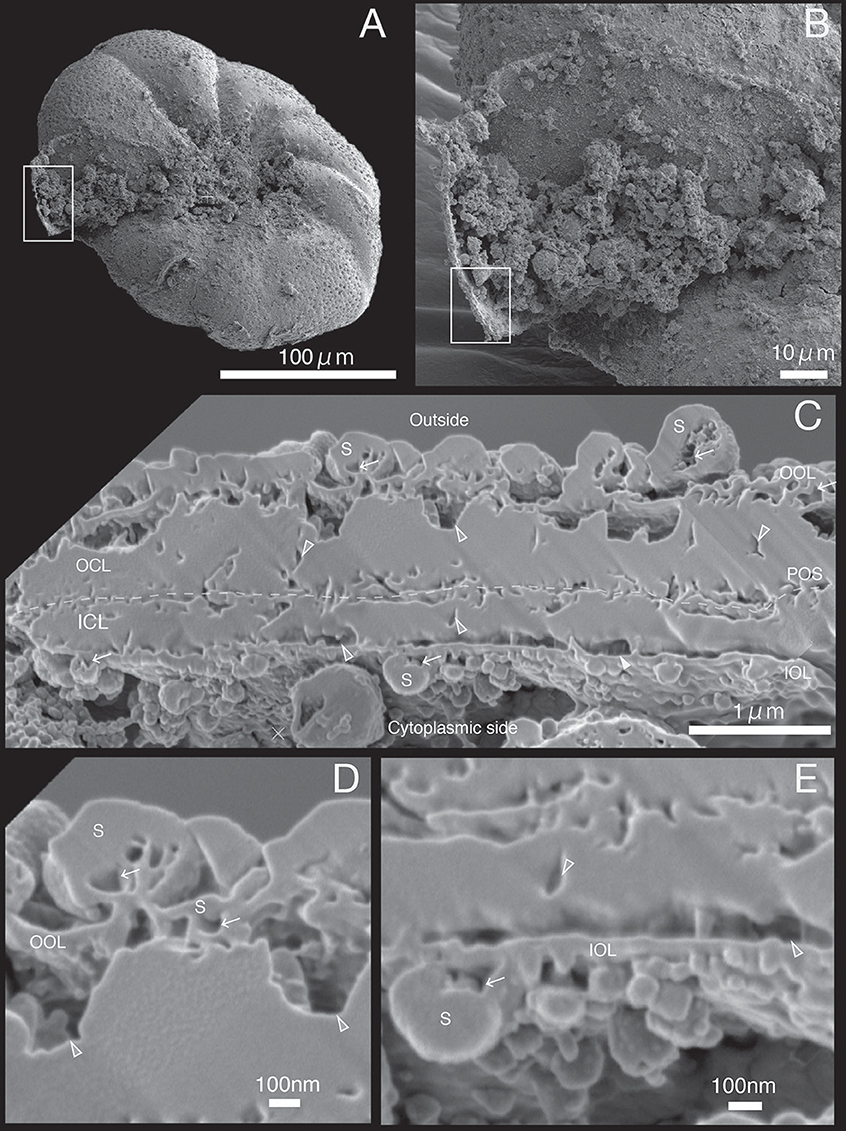
Figure 6. SEM images of specimen #5. (A) Overview. (B) The newly calcified chamber (white rectangle in (A). The field of FIB processing is indicated by the white rectangle. (C) Composite SEM image of the FIB processed SOC. The upper side is the outer side and whereas the lower side is the cytoplasmic side. White dotted line in the calcareous layer indicates the boundary between outer side and cytoplasmic side of calcareous layer. (D) Magnified image of the contact place between outer organic layer and outer calcareous layer. (E) Higher magnification showing the adjoining place between inner organic layers with inner calcareous layer. OOL, outer organic layer; OCL, outer calcareous layer; POS, primary organic sheet; ICL, inner calcareous layer; IOL, inner organic layer; S, spherical structures; CM, calcareous materials; gray triangles, void; white arrows, cavities in the organic structure.
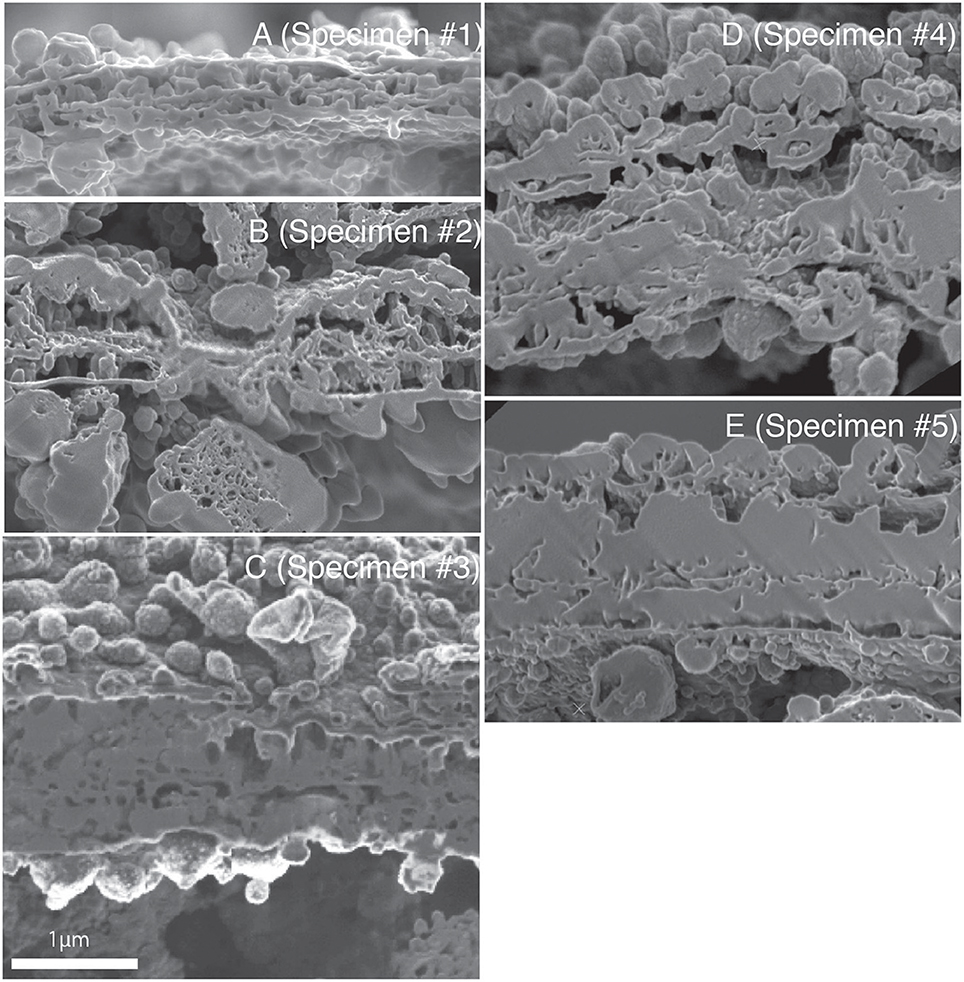
Figure 7. The SEM image of the SOC on the same magnification of all observed specimens. (A–E) corresponding to Specimen #1 to #5, respectively.
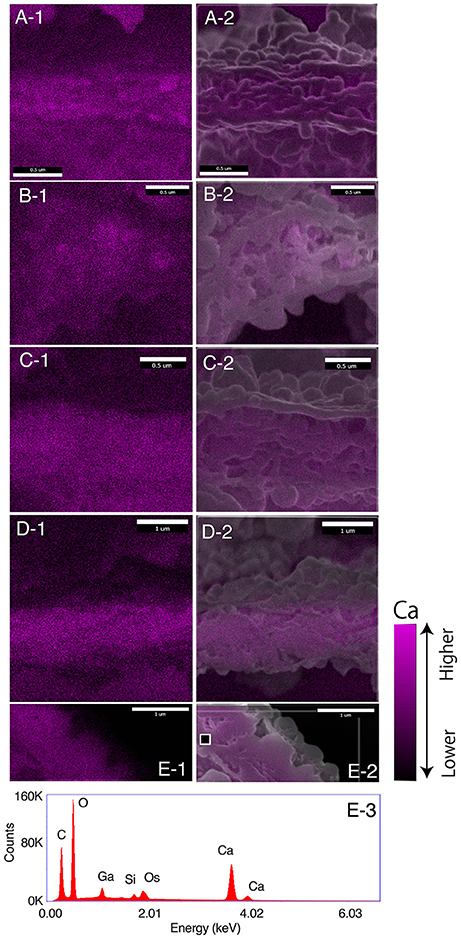
Figure 8. EDS results on the SOC for specimens #1 to #5. (A–E) corresponding to specimen #1 to #5.−1, calcium distributions;−2, calcium image superimposed on the SEM image. The brightness of calcium distribution shows the intensity of calcium signal as legend of the bottom right. E-3, EDS spectrum of spot measurement on the black square on E-1 of specimen #5.
The growth of SOC was documented sequentially from Specimen #1 to #5 (Figures 2–7). Calcareous layers were sparser in specimens #1 and #2 (Figures 7A,B) compared to specimens #3–#5 (Figures 7C–E). The calcareous layers were horizontally divided into the outer calcareous layer (OCL in Figures 2C, 6C) and the inner calcareous layer (ICL in Figures 2C, 6C) by the boundary (POS in Figures 2C, 6C) on all specimens. The primary organic sheet is clearly visible in specimens #1–#3 (POS in Figures 2C, 4C), but in specimens #4–#5 the primary organic sheet was not clearly visible and instead a series of small cavities were visible in the same position (POS in Figures 5C, 6C). The outer calcareous layers were slightly thicker than the inner layers in specimens #4 and #5 (Figures 5C, 6C). Focusing on the morphology of the materials in the calcareous layer, blocky, parabolic conical, and columnar shapes were observed in specimens #1 and #2 (C in Figures 2D,E, 3D,E). All of these shapes were in contact with either the primary organic sheet, the inner/outer organic layers, or both. The horizontal space between these materials decreased in specimen #3 (Figure 4C). Then, calcareous layers further increased in abundance in specimens #4 and #5 (Figures 5C, 6C). A sharp, serrated surface was seen on the calcareous layer of specimen #4 (Figure 5E).
Spatial voids existed between the calcareous layers, facing both outer and inner organic layers in all specimens (gray triangles in Figures 2C, 6C). Some voids were also found around the primary organic sheet (gray triangles in Figures 4D,E, 5D). Spherical structures were found in both outer and inner organic layers at all stages (S in Figures 2–6). Some cavities were found in the spherical structures and primary organic sheet (white arrows in Figures 2–6). These spherical structures varied in size between ~100 nm and ~1 μm. Occasionally, spherical structures with a diameter of ~0.5–1 μm were seen with a spongy interior (white dot in Figure 3C). Convex structures were observed on calcareous sides of the organic layer and were positionally arranged toward the calcareous layer (asterisks in Figure 4D) and the primary organic sheet (asterisk in Figure 5D). As the calcareous layer developed, larger spherical structure were formed overhanging into the space of the calcareous layer side from outer organic structure (LS in Figure 5E). Also, the convex shapes were found to intrude into the space toward calcareous layer (CO in Figure 5E). The spherical structures and cavities were more frequently found on the thicker specimens #3–#5 than the thinner specimens #1 and #2. Pore plates were also identified on specimen #2 (PP in Figure 3C). Outer and inner organic layers converged into each other at the position of the primary organic sheet.
Discussion
The benthic foraminifer Ammonia “beccarii” and other Ammonia species are widely distributed and can be found in many coastal environments including tidal flats, harbors and brackish lakes. Due to its tolerance to a wide range of environmental parameters, it is a popular genus to employ in laboratory cultures and are used to calibrate elemental/isotopic geochemical signatures as functions of physical and chemical conditions. As a result, over 20 studies have analyzed geochemical signatures and calcification process in this genus (Table 1). This makes understanding the detailed micro-configuration of the SOC in this genus crucially important in the interpretation of the results from such studies. This was made possible in this study through application of the FIB-SEM technique which allows making sections through calcareous material at a fine scale.
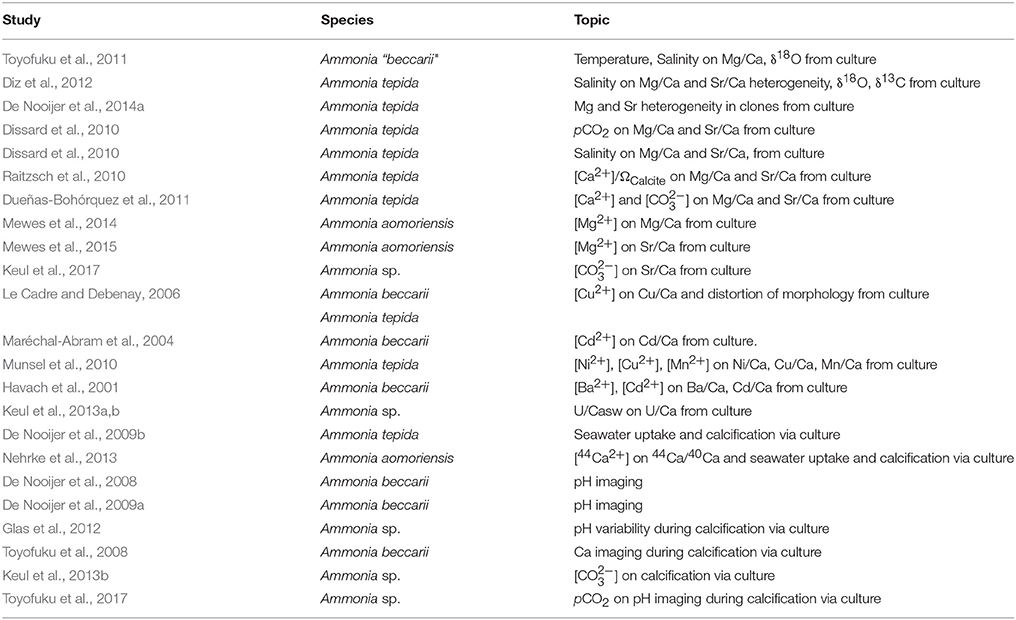
Table 1. Evaluation of geochemical signatures and calcification process in Ammonia species.
Structures Within the Site of Calcification During Chamber Formation
The foraminiferal SOC has not been pictured before in cross-section and our results allow for the first time to characterize the distribution of calcareous materials between the primary organic sheet and the outer and inner organic layers during chamber formation (Figures 2–8). These materials are shown to grow over time by gradually filling the space between the primary organic sheet and outer and inner organic layers (Figures 2C, 6C). Growth of the calcareous chamber wall is bidirectional from the primary organic sheet toward the outside as well as the cytoplasmic side, as was generally accepted. Meanwhile, some calcareous materials were found to attach only on the outer or inner organic layer (Figure 3D). At some locations, calcareous materials were bridged on either side of the primary organic sheet to the outer or inner organic layers (Figures 2C, 3C,D), while the cavities between materials appeared to have been filled-in horizontally afterwards (Specimen #3–#5). We interpret that the calcification processes happens continuously and that thereby the chamber wall thickens over time. In some locations, no calcareous materials grew yet and voids remained, which would supply the source for construction of calcareous wall. Then these voids would be pushed away by the growing calcareous test and moved to the top of the growing surface. A schematic illustration is shown in Figure 9.
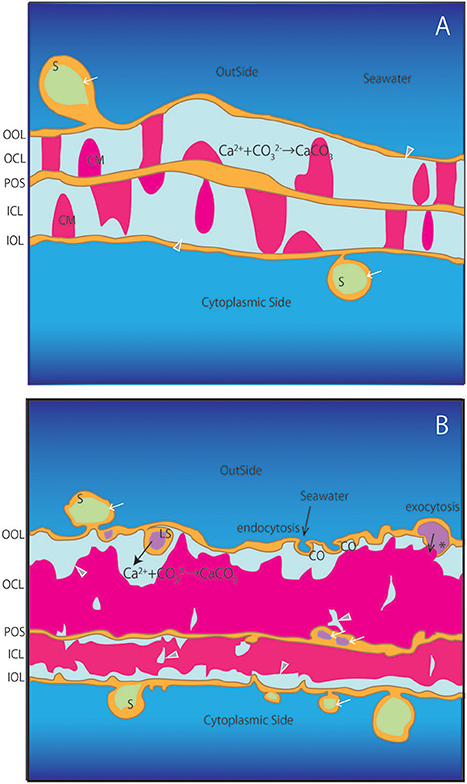
Figure 9. Schematic illustration of the SOC. (A) Earlier stages corresponding to specimens #1 and #2. (B) Later stages corresponding to specimens #3-#5. OOL, outer organic layer; OCL, outer calcareous layer; POS, primary organic sheet; ICL, inner calcareous layer; IOL, inner organic layer; S, spherical structures; CM, calcareous materials; PP, pore plate; gray triangles, void; white arrows, cavities in the organic structure; CO, concavity; asterisk, opening spherical structure from cavity into void; LS, spherical structure with larger cavity inside projection to voids.
Although the composition of fluids within these voids has not been characterized yet, it would likely have a similar composition to the calcification fluid described for bivalves and corals (Wilbur, 1964; Erez, 2003; Tambutté et al., 2011; De Nooijer et al., 2014b; Keul et al., 2017; Toyofuku et al., 2017). Previous studies (e.g., Angell, 1979) showed that the distribution of organic structures within the foraminiferal chamber wall and assumed that small black dots adhering to the membrane were calcium carbonate microcrystals. In addition, such calcium carbonate crystals were assumed to have filled the vacant holes in ultrathin TEM sections in the later stages of calcification, so that the discontinuous shape of early calcareous tests (as we observe in specimens #1 and #2; Figures 2, 3) may not have been fully preserved in former studies (e.g., Angell, 1979). In some previous TEM-studies (Angell, 1967), the sample preparation methods used likely resulted in artifacts in the prepared sections. As the resin used for embedding has a different hardness compared to the foraminiferal test, the cytoplasm (substituted with resin) was successfully thinly sliced while the calcite part of the test would be lost. It was therefore assumed that, any vacant spaces in the thin sections were completely filled with calcium carbonate crystals. In other studies (e.g., Spero, 1988) calcium carbonate were dissolved during sample preparation to enable ultrathin sectioning for the observation of the cytoplasm configuration during shell formation. With the calcareous materials absent, it was again assumed that the space between primary organic sheet and outer organic layer was completely filled by calcite crystals, which is different from what we observed here. On the other hand, the introduction of FIB technology made it possible to produce cross sections with both soft, delicate organic structures and hard, brittle calcium carbonate fully preserved, as exemplified by the present study. The results indicate that calcium carbonate grows not only from the primary organic sheet to the outer/inner organic layer but also vice versa unlike previously thought (Hemleben et al., 1977). Furthermore, this constitutes the first observation of numerous voids within both organic structures and calcareous layers. The primary organic sheet, outer and inner organic layers have been described previously and were also observed in this study. Previous studies suggested that the primary organic sheet was often discontinuous and does completely separate the outer from the inner lamellae in the bilamellar chamber wall (Spero, 1988).
Former studies have reported the existence of spherical structures thought to be vesicles around the outer and inner organic layers (Angell, 1967, 1979; Hemleben et al., 1986; Spero, 1988). Our observations confirm that there are many spherical structures associated with the outer and inner organic layers (S in Figures 2C,D, 3C–E, 4C–E, 5C,E, 6C,D). By using FIB-SEM to prepare the samples, we show that the inside of some spherical structures appeared to contain cavities (e.g., white allow in Figure 2D). In addition, cavities were also found as a seemingly integral part of the primary organic sheet (e.g., white arrows on POS in Figures 4D,E, 5D). If such cavities were related to foraminiferal vesicles as previous studies have described, they are likely to be filled with fluids. In addition, spherical structures were formed from the outer organic layer in contact with surrounding water (CO in Figures 5E, 9). It is likely that some of these spherical structures directly enclose a part of the surrounding seawater. In addition, a number of spherical structures with a diameter of ~1 μm were characterized by a spongy inner structure (white dot in Figure 3C). These structures (~1 μm) correspond to mitochondria, since they are present at high densities near organic layers during the calcification process (Spero, 1988). Furthermore, the voids and vesicles appeared to be connected to the outer and inner organic layers, indicating exocytosis (asterisks in Figures 4D, 5D, 9) and endocytosis (CO in Figures 5E, 9).
One possible significance of these spherical structures is in increasing the total exchangeable area between the ambient seawater and the foraminiferal calcification fluid, since continuous calcium and carbon source supply is, naturally, required during calcification. Meanwhile, the chemistry of the fluid should be strongly governed by the organism thoughout the process. The numerous vesicles could reflect an increased density of transmembrane transporters to achieve a high flux of ions (i.e., Ca2+ and inorganic carbon) from seawater to the SOC. Tyszka (in prep.) considers that the outer and inner organic layers are not just organic sheets but are actively involved in calcification. Our results support the hypothesis that these organic structures are indeed involved in mineralization, perhaps by collecting ions necessary for calcification, transporting them to specific locations, or by releasing unnecessary substances from the SOC (Figure 9). The relative importance of vesicles in the outer and inner organic layers are interpreted to increase as calcification proceeds, since they were more numerous in specimens #3–#5 than specimens #1 and #2. Together, these observations show that the primary organic sheet is not just a template for calcium carbonate deposition, but instead is actively involved in biomineralization. For example, calcium ions, carbon sources, and acidic amino acids made of cytoplasm would be supplied to both sides of the primary organic sheet. The outer and inner organic layers and primary organic sheet would be active at these earlier phases of chamber formation. Banner and Williams (1973) reported that the primary organic sheet acts simply as a template upon where calcification occurs, which appears to be different from the results of the present study; further work is required in this area.
Regarding the calcareous layer, it is evident that calcium carbonate is present in both calcareous layers (outer and inner calcareous layers) in all individuals observed in this study (Figure 8). In specimens #3-#5, especially, it is presumed that the nature of the calcium carbonate are calcite crystals because they resemble ordinary test cross sections (Nakajima et al., 2016). In specimen #1 and #2, the form of the calcareous materials is not of a typical crystalline appearance but appeared rather irregular. This is different from the previously reported appearance of calcitic walls of this species (Nakajima et al., 2016). Elemental analysis results with SEM-EDS support that these structures are indeed calcium carbonate, but the crystallographical structure remain uncharacterized and is a subject of future studies. Submicron periodic lateral layers (~200–450 nm) in a single lamellar structure has been reported previously and was considered to represent the smallest unit of crystal growth in foraminifera (Nakajima et al., 2016). These are comparable to crystals found in the planktonic Globigerina sp. and Groborotalia sp. (Cuif et al., 2011). In our cross-sections, the crystal units within the foraminiferal chamber wall do not appear to be formed by a spiral growth mode. This implies that partition coefficients for elements obtained from inorganic precipitation experiments (e.g., Rimstidt et al., 1998) are not directly comparable to those observed in foraminifera, since spiral crystal growth (e.g., Davis et al., 2000, 2004) has a different element incorporation rate than precipitation from an amorphous precursor (e.g., De Yoreo et al., 2015; Blue et al., 2017).
Contribution to Improvement of Suggested Foraminiferal Calcification Models
Our cross sections identified various structures within the foraminiferal SOC. Since there has been no study revealing the detailed ultrastructure of the SOC and the possible existence of calcification fluid, these newly revealed findings are crucial in constraining calcification models in foraminifera (e.g., Nehrke et al., 2013). It has been reported that in Ammonia sp., calcification is achieved by active, outward proton transport (Toyofuku et al., 2017). Likely, these protons are exchanged for calcium which enters the SOC by transmembrane transport (TMT) (Nehrke et al., 2013; Toyofuku et al., 2017). The numerous spherical structures reported here are expected to play an important role in this ion exchange, for example by surface enlargement (S in Figure 9). These structures are likely be produced by seawater endocytosis and transported from the surface of the SOC inwards (CO and LS in Figure 9). Ion pumps can be active through the surface of these spheres, which will result in concentrated element composition in the vesicles within the organic layer that will be exocytosed into the voids where calcification takes place (asterisk in Figure 9). As the total amount of spherical structures and vesicles increases during calcification, it is proposed that these structures plays a key role in transporting substances for calcification. Presence of such transmembrane transporters and transport pathways will need to be further confirmed by immunostaining on the spherical structure and organic layers in the SOC.
It is assumed that the process of calcification is similar between the inner calcareous layer at the cytoplasmic side and the outer calcareous layer at the outer side, although the contribution of ions from seawater vs. the cell should differ. Particularly, as chamber formation progresses, the precipitated calcite layer seems to form a barrier that hampers the transport of ions from the surrounding seawater to the growing inner calcareous layer. Then, the importance of ion transportation from the cytoplasmic side would increase. It is possible that the ions transported from the inside are also seawater-derived, as the chamber that is being formed appears to are not fully filled with cytoplasm, but instead with seawater, which in turn, be circulated with ambient seawater through the aperture. It has been reported that the calcium signal of the cell body increases during later stages of chamber formation (Toyofuku et al., 2008), implying that the contribution of cell-derived calcium ions (Ca2+) increases as chamber formation proceeds.
Conclusion
In this study, we observed the detailed structure of the SOC during chamber wall calcification in a foramnifer (Ammonia “beccarii”). By using the FIB-SEM technique we were able to observe the ultra- and microstructure of an intact SOC, complete with both calcified parts and the cytoplasm, which was not previously possible. For the first time, we show that numerous voids of calcareous layers and internal organic structures are present within the SOC during the calcification process and provide evidence to interpret their function which was previously totally unknown. Our results provide further support for the existence of calcification liquid within the enclosed SOC and suggest that organic layers are actively involved in calcite precipitation. By observing morphology of the SOC in great detail, we improved the understanding of foraminiferal biomineralization and key conditions under which element partitioning and isotope fractionation occur, which is widely significant as foraminifera is an important proxy in palaeoceanography.
Author Contributions
Scientific conception and experimental design: YN and TT. Data acquisition and analysis: YN, TT, and KU. Data processing: YN. Data interpretation: YN, TT. Manuscript writing: YN, TT, KU, and RW.
Conflict of Interest Statement
The authors declare that the research was conducted in the absence of any commercial or financial relationships that could be construed as a potential conflict of interest.
Acknowledgments
Our FIB work was partly supported by the Nagoya University microstructural characterization platform as a program of “Nanotechnology Platform” of the Ministry of Education, Culture, Sports, Science and Technology (MEXT), Japan. We thank S. Arai, T. Nakao, M. Nakano (Nagoya University), and S. Sadayama (FEI Japan) for FIB experiments. The authors thank Y. Iwadate, N. Kishigami, S. Kubo, S. Kawada (JAMSTEC), S. Kondo (JEOL), for their technical assistance and scientific advice on this study. Two reviewers are thanked for providing constructive and useful comments which improved the manuscript. We thank the editors and supporting staffs for their effort to publish this biomineralization special issue. We thank LJ De Nooijer (NIOZ), C. Chen (JAMSTEC) and B. Mamo (HKU) for constructive discussions and for improving the writing quality of the manuscript. We also acknowledge J. Bijma (AWI) for fruitful discussions. This work was supported by a grant from Faculty of Environment and Information Sciences, Yokohama National University (to YN) and a JSPS KAKENHI Grant Number 25247085 (to TT).
Supplementary Material
The Supplementary Material for this article can be found online at: https://www.frontiersin.org/articles/10.3389/fmars.2018.00067/full#supplementary-material
Figure S1. EDS profiles on the site of calcification (SOC) for specimens #1 to #5. (A–E) corresponding to specimen #1 to #5 respectively. −1, white rectangles show the measurement area; −2, EDS profile of spot measurement on the white rectangles in from A-1 to E-1.
References
Anand, P., Elderfield, H., and Conte, M. H. (2003). Calibration of Mg/Ca thermometry in planktonic foraminifera from a sediment trap time series. Paleoceanography 18:1050. doi: 10.1029/2002PA000846
Angell, R. W. (1967). The test structure and composition of the foraminifer Rosalina floridana. J. Protozool. 14, 299–307. doi: 10.1111/j.1550-7408.1967.tb02001.x
Angell, R. W. (1979). Calcification during chamber development in Rosalina floridana. J. Foram. Res. 9, 341–353. doi: 10.2113/gsjfr.9.4.341
Banner, F. T., and Williams, E. (1973). Test structure, organic skeleton and extrathalamous cytoplasm of Ammonia brüennich. J. Foram. Res. 3, 49–69. doi: 10.2113/gsjfr.3.2.49
Bentov, S., and Erez, J. (2006). Impact of biomineralization processes on the Mg content of foraminiferal shells: a biological perspective. Geochem. Geophys. Geosyst. 7:Q01P08. doi: 10.1029/2005GC001015
Blue, C. R., Giuffre, A., Mergelsberg, S., Han, N., De Yoreo, J. J., and Dove, P. M. (2017). Chemical and physical controls on the transformation of amorphous calcium carbonate into crystalline CaCO3 polymorphs. Geochim. Cosmochim. Acta 196, 179–196. doi: 10.1016/j.gca.2016.09.004
Cuif, J.-P., Dauphin, Y., and Sorauf, J. E. (2011). Biominerals and Fossils Through Time. Cambridge, UK: Cambridge University Press.
Davis, K. J., Dove, P. M., and De Yoreo, J. J. (2000). The role of Mg2+ as an impurity in calcite growth. Science 290, 1134–1137. doi: 10.1126/science.290.5494.1134
Davis, K. J., Dove, P. M., Wasylenki, L. E., and De Yoreo, J. J. (2004). Morphological consequences of differential Mg2+ incorporation at structurally distinct steps on calcite. Am. Mineral. 89, 714–720. doi: 10.2138/am-2004-5-605
De Nooijer, L. J., Hathorne, E. C., Reichart, G.-J., Langer, G., and Bijma, J. (2014a). Variability in calcitic Mg/Ca and Sr/Ca ratios in clones of the benthic foraminifer Ammonia tepida. Mar. Micropaleontol. 107, 32–43. doi: 10.1016/j.marmicro.2014.02.002
De Nooijer, L. J., Langer, G., Nehrke, G., and Bijma, J. (2009b). Physiological controls on seawater uptake and calcification in the benthic foraminifer Ammonia tepida. Biogeosciences 6, 2669–2675. doi: 10.5194/bg-6-2669-2009
De Nooijer, L. J., Spero, H. J., Erez, J., Bijma, J., and Reichart, G.-J. (2014b). Biomineralization in perforate foraminifera. Earth-Sci. Rev. 135, 48–58. doi: 10.1016/j.earscirev.2014.03.013
De Nooijer, L. J., Toyofuku, T., and Kitazato, H. (2009a). Foraminifera promote calcification by elevating their intracellular pH. Proc. Natl. Acad. Sci. U.S.A. 106, 15374–15378. doi: 10.1073/pnas.0904306106
De Nooijer, L. J., Toyofuku, T., Oguri, K., Nomaki, H., and Kitazato, H. (2008). Intracellular pH distribution in foraminifera determined by the fluorescent probe HPTS. Limnol. Oceanogr. Methods 6, 610–618. doi: 10.4319/lom.2008.6.610
De Yoreo, J. J., Gilbert, P. U., Sommerdijk, N. A., Penn, R. L., Whitelam, S., Dove, P. M., et al. (2015). Crystallization by particle attachment in synthetic, biogenic, and geologic environments. Science 349:aaa6760. doi: 10.1126/science.aaa6760
Dissard, D., Nehrke, G., Reichart, G.-J., and Bijma, J. (2010). Impact of seawater pCO2 on calcification and Mg/Ca and Sr/Ca ratios in benthic foraminifera calcite: results from culturing experiments with Ammonia tepida. Biogeosciences 7, 81–93. doi: 10.5194/bg-7-81-2010
Diz, P., Barras, C., Geslin, E., Reichart, G.-J., Metzger, E., Jorissen, F., et al. (2012). Incorporation of Mg and Sr and oxygen and carbon stable isotope fractionation in cultured Ammonia tepida. Mar. Micropaleontol. 92, 16–28. doi: 10.1016/j.marmicro.2012.04.006
Dueñas-Bohórquez, A., Raitzsch, M., De Nooijer, L. J., and Reichart, G.-J. (2011). Independent impacts of calcium and carbonate ion concentration on Mg and Sr incorporation in cultured benthic foraminifera. Mar. Micropaleontol. 81, 122–130. doi: 10.1016/j.marmicro.2011.08.002
Eggins, S., De Deckker, P., and Marshall, J. (2003). Mg/Ca variation in planktonic foraminifera tests: implications for reconstructing palaeo-seawater temperature and habitat migration. Earth Planet. Sci. Lett. 212, 291–306. doi: 10.1016/S0012-821X(03)00283-8
Elderfield, H., and Ganssen, G. (2000). Past temperature and δ18O of surface ocean waters inferred from foraminiferal Mg/Ca ratios. Nature 405, 442–445. doi: 10.1038/35013033
Elderfield, H., Bertram, C. J., and Erez, J. (1996). A biomineralization model for the incorporation of trace elements into foraminiferal calcium carbonate. Earth Planet. Sci. Lett. 142, 409–423. doi: 10.1016/0012-821X(96)00105-7
Erez, J. (2003). The source of ions for biomineralization in foraminifera and their implications for paleoceanographic proxies. Rev. Mineral. Geochem. 54, 115–149. doi: 10.2113/0540115
Glas, M. S., Langer, G., and Keul, N. (2012). Calcification acidifies the microenvironment of a benthic foraminifer (Ammonia sp.). J. Exp. Mar. Biol. Ecol. 424-425, 53–58. doi: 10.1016/j.jembe.2012.05.006
Havach, S. M., Chandler, G. T., Wilson-Finelli, A., and Shaw, T. J. (2001). Experimental determination of trace element partition coefficients in cultured benthic foraminifera. Geochim. Cosmochim. Acta 65, 1277–1283. doi: 10.1016/S0016-7037(00)00563-9
Hemleben, C., Be, A. W. H., Anderson, O. R., and Tuntivate, S. (1977). Test morphology, organic layers and chamber formation of the planktonic foraminifer Globorotalia menardii (d'Orbigny). J. Foram. Res. 7, 1–25. doi: 10.2113/gsjfr.7.1.1
Hemleben, C., Erson, O. R., Berthold, W., and Spindler, M. (1986). “Calcification and chamber formation in foraminifera - a brief overview,” in Biomineralization in Lower Plants and Animals: The Systematics Association, eds R. Riding and L. BSC (Oxford: Clarendon Press), 237–249.
Keul, N., Langer, G., De Nooijer, L. J., and Bijma, J. (2013b). Effect of ocean acidification on the benthic foraminifera Ammonia sp. is caused by a decrease in carbonate ion concentration. Biogeosciences 10, 6185–6198. doi: 10.5194/bg-10-6185-2013
Keul, N., Langer, G., De Nooijer, L. J., Nehrke, G., Reichart, G.-J., and Bijma, J. (2013a). Incorporation of uranium in benthic foraminiferal calcite reflects seawater carbonate ion concentration. Geochem. Geophys. Geosyst. 14, 102–111. doi: 10.1029/2012GC004330
Keul, N., Langer, G., Thoms, S., De Nooijer, L. J., Reichart, G.-J., and Bijma, J. (2017). Exploring foraminiferal Sr/Ca as a new carbonate system proxy. Geochim. Cosmochim. Acta 202, 374–386. doi: 10.1016/j.gca.2016.11.022
Kunioka, D., Shirai, K., Takahata, N., Sano, Y., Toyofuku, T., and Ujiie, Y. (2006). Microdistribution of Mg/Ca, Sr/Ca, and Ba/Ca ratios in Pulleniatina obliquiloculata test by using a NanoSIMS: implication for the vital effect mechanism. Geochem. Geophys. Geosyst. 7:Q12P20. doi: 10.1029/2006GC001280
Le Cadre, V., and Debenay, J. P. (2006). Morphological and cytological responses of Ammonia (foraminifera) to copper contamination: implication for the use of foraminifera as bioindicators of pollution. Environ. Pollut. 143, 304–317. doi: 10.1016/j.envpol.2005.11.033
Lear, C. H., Elderfield, H., and Wilson, P. A. (2000). Cenozoic Deep-sea temperatures and global ice volumes from Mg/Ca in benthic foraminiferal calcite. Science 287, 269–272. doi: 10.1126/science.287.5451.269
Mann, S. (2001). Biomineralization: Principles and Concepts in Bioinorganic Materials Chemistry. New York, NY: Oxford University Press on Demand.
Maréchal-Abram, N., Debenay, J.-P., Kitazato, H., and Wada, H. (2004). Cadmium partition coefficients of cultured benthic foraminifera Ammonia beccarii. Geochem. J. 38, 271–283. doi: 10.2343/geochemj.38.271
Mewes, A., Langer, G., De Nooijer, L. J., Bijma, J., and Reichart, G. J. (2014). Effect of different seawater Mg concentrations on calcification in two benthic foraminifers. Mar. Micropaleontol. 113, 56–64. doi: 10.1016/j.marmicro.2014.09.003
Mewes, A., Langer, G., Reichart, G.-J., De Nooijer, L. J., Nehrke, G., and Bijma, J. (2015). The impact of Mg contents on Sr partitioning in benthic foraminifers. Chem. Geol. 412, 92–98. doi: 10.1016/j.chemgeo.2015.06.026
Munsel, D., Kramar, U., Dissard, D., Nehrke, G., Berner, Z., Bijma, J., et al. (2010). Heavy metal incorporation in foraminiferal calcite: results from multi-element enrichment culture experiments with Ammonia tepida. Biogeosciences 7, 2339–2350. doi: 10.5194/bg-7-2339-2010
Nakajima, K., Nagai, Y., Suzuki, M., Oaki, Y., Naito, K., Tanaka, Y., et al. (2016). Mesoscopic crystallographic textures on shells of a hyaline radial foraminifer Ammonia beccarii. CrystEngComm 18, 7135–7139. doi: 10.1039/C6CE01611A
Nehrke, G., Keul, N., Langer, G., De Nooijer, L. J., Bijma, J., and Meibom, A. (2013). A new model for biomineralization and trace-element signatures of Foraminifera tests. Biogeosciences 10, 6759–6767. doi: 10.5194/bg-10-6759-2013
Nürnberg, D., Bijma, J., and Hemleben, C. (1996). Assessing the reliability of magnesium in foraminiferal calcite as a proxy for water mass temperatures. Geochim. Cosmochim. Acta 60, 803–814. doi: 10.1016/0016-7037(95)00446-7
Paris, G., Fehrenbacher, J. S., Sessions, A. L., Spero, H. J., and Adkins, J. F. (2014). Experimental determination of carbonate-associated sulfate δ34S in planktonic foraminifera shells. Geochem. Geophys. Geosyst. 15, 1452–1461. doi: 10.1002/2014GC005295
Raitzsch, M., Dueñas-Bohórquez, A., Reichart, G.-J., De Nooijer, L. J., and Bickert, T. (2010). Incorporation of Mg and Sr in calcite of cultured benthic foraminifera: impact of calcium concentration and associated calcite saturation state. Biogeosciences 7, 869–881. doi: 10.5194/bg-7-869-2010
Rimstidt, J. D., Balog, A., and Webb, J. (1998). Distribution of trace elements between carbonate minerals and aqueous solutions. Geochim. Cosmochim. Acta 62, 1851–1863. doi: 10.1016/S0016-7037(98)00125-2
Sadekov, A. Y., Eggins, S. M., and De Deckker, P. (2005). Characterization of Mg/Ca distributions in planktonic foraminifera species by electron microprobe mapping. Geochem. Geophys. Geosyst. 6:Q12P06. doi: 10.1029/2005GC000973
Spero, H. J. (1988). Ultrastructural examination of chamber morphogenesis and biomineralization in the planktonic foraminifer Orbulina universa. Mar. Biol. 99, 9–20. doi: 10.1007/BF00644972
Spero, H. J., Eggins, S. M., Russell, A. D., Vetter, L., Kilburn, M. R., and Honisch, B. (2015). Timing and mechanism for intratest Mg/Ca variability in a living planktic foraminifer. Earth Planet. Sci. Lett. 409, 32–42. doi: 10.1016/j.epsl.2014.10.030
Tambutté, S., Holcomb, M., Ferrier-Pagès, C., Reynaud, S., Tambutté, É., Zoccola, D., et al. (2011). Coral biomineralization: from the gene to the environment. J. Exp. Mar. Biol. Ecol. 408, 58–78. doi: 10.1016/j.jembe.2011.07.026
Toyofuku, T., and Kitazato, H. (2005). Micromapping of Mg/Ca values in cultured specimens of the high-magnesium benthic foraminifera. Geochem. Geophys. Geosyst. 6:Q11PQ05. doi: 10.1029/2005GC000961
Toyofuku, T., De Nooijer, L. J., Yamamoto, H., and Kitazato, H. (2008). Real-time visualization of calcium ion activity in shallow benthic foraminiferal cells using the fluorescent indicator Fluo-3 AM. Geochem. Geophys. Geosyst. 9:Q05005. doi: 10.1029/2007GC001772
Toyofuku, T., Matsuo, M. Y., De Nooijer, L. J., Nagai, Y., Kawada, S., Fujita, K., et al. (2017). Proton pumping accompanies calcification in foraminifera. Nat. Commun. 8:14145. doi: 10.1038/ncomms14145
Toyofuku, T., Suzuki, M., Suga, H., Sakai, S., Suzuki, A., Ishikawa, T., et al. (2011). Mg/Ca and δ18O in the brackish shallow-water benthic foraminifer Ammonia ‘beccarii’. Mar. Micropaleontol. 78, 113–120. doi: 10.1016/j.marmicro.2010.11.003
Van Dijk, I., De Nooijer, L. J., Boer, W., and Reichart, G. J. (2017). Sulfur in foraminiferal calcite as a potential proxy for seawater carbonate ion concentration. Earth Planet. Sci. Lett. 470, 64–72. doi: 10.1016/j.epsl.2017.04.031
Wilbur, K. M. (1964). “Shell formation and regeneration,” in Physiology of Mollusca, eds K. M. Wilbur and C.W. Yong (New York, NY: Academic Press), 243–282.
Keywords: foraminifera, biomineralization, ultrastructure, calcification, FIB, SEM, marine biology, micropaleontology
Citation: Nagai Y, Uematsu K, Wani R and Toyofuku T (2018) Reading the Fine Print: Ultra-Microstructures of Foraminiferal Calcification Revealed Using Focused Ion Beam Microscopy. Front. Mar. Sci. 5:67. doi: 10.3389/fmars.2018.00067
Received: 25 July 2017; Accepted: 14 February 2018;
Published: 28 February 2018.
Edited by:
Andrew Stanley Mount, Clemson University, United StatesReviewed by:
Gary H. Dickinson, The College of New Jersey, United StatesDennis A. Bazylinski, University of Nevada, Las Vegas, United States
Copyright © 2018 Nagai, Uematsu, Wani and Toyofuku. This is an open-access article distributed under the terms of the Creative Commons Attribution License (CC BY). The use, distribution or reproduction in other forums is permitted, provided the original author(s) and the copyright owner are credited and that the original publication in this journal is cited, in accordance with accepted academic practice. No use, distribution or reproduction is permitted which does not comply with these terms.
*Correspondence: Takashi Toyofuku, toyofuku@jamstec.go.jp