Environmental DNA (eDNA) From the Wake of the Whales: Droplet Digital PCR for Detection and Species Identification
 C. Scott Baker
 Debbie Steel
 Sharon Nieukirk
 Holger Klinck
- 1Hatfield Marine Science Center, Oregon State University, Newport, OR, United States
- 2Bioacoustics Research Program, Cornell Lab of Ornithology, Cornell University, Ithaca, NY, United States
Genetic sampling for identification of species, subspecies or stock of whales, dolphins and porpoises at sea remains challenging. Most samples have been collected with some form of a biopsy dart requiring a close approach of a vessel while the individual is at the surface. Here we have adopted droplet digital (dd)PCR technology for detection and species identification of cetaceans using environmental (e)DNA collected from seawater. We conducted a series of eDNA sampling experiments during 25 encounters with killer whales, Orcinus orca, in Puget Sound (the Salish Sea). The regular habits of killer whales in these inshore waters allowed us to locate pods and collect seawater, at an initial distance of 200 m and at 15-min intervals, for up to 2 h after the passage of the whales. To optimize detection, we designed a set of oligonucleotide primers and probes to target short fragments of the mitochondrial (mt)DNA control region, with a focus on identification of known killer whale ecotypes. We confirmed the potential to detect eDNA in the wake of the whales for up to 2 h, despite movement of the water mass by several kilometers due to tidal currents. Re-amplification and sequencing of the eDNA barcode confirmed that the ddPCR detection included the “southern resident community” of killer whales, consistent with the calls from hydrophone recordings and visual observations.
Introduction
Non-lethal genetic sampling for identification of whales, dolphins, and porpoises (cetaceans) at sea remains challenging. Most samples have been collected with some form of a biopsy dart projected with a crossbow (Lambertsen, 1987) or a modified veterinary capture rifle (Krützen et al., 2002). This requires a close approach of a vessel, usually within 10–20 m, while the individual is at the surface. It is also limiting because of access, distribution, or behavior of cetaceans. Some species are rare, cryptic, or both, e.g., beaked whales (Dalebout et al., 2004). Others species are difficult to approach because of their elusive behavior, e.g., the pygmy and dwarf sperm whale. Finally, some species are considered sensitive to disturbance from the close approach of a vessel or the biopsy sample itself (Noren and Mocklin, 2011).
Advances in analyses of environmental (e)DNA now offer an alternative for detection and identification of rare, cryptic, or vulnerable cetacean species. Here the DNA that is shed or excreted from individuals during normal activity can be collected from the environment, concentrated, and amplified via the Polymerase Chain Reaction (PCR) using primers targeted for specific taxonomic groups. eDNA has been used widely to detect vertebrate species in freshwater systems (Ficetola et al., 2008; Jerde et al., 2011; Ma et al., 2016; Stewart et al., 2017), and is now finding a growing number of applications in the marine environment (Thomsen et al., 2012), including detection and identification of marine megafauna (Foote et al., 2012; Port et al., 2016; Sigsgaard et al., 2016; Andruszkiewicz et al., 2017; Bakker et al., 2017; Gargan et al., 2017). Whales, dolphins and porpoises represent good candidates for eDNA sampling given their known tendency to release cellular DNA in shed skin (Amos et al., 1992), fecal plumes (Parsons, 1999), and the “spout” or blow (Hunt et al., 2013).
The methodology for eDNA sampling is advancing rapidly as the number and range of application increases. One of these advances is droplet-digital (dd)PCR. ddPCR is a powerful new technology for quantifying low levels of DNA by fractionating a PCR reaction into more than 20,000 droplets using an oil emulsion (Doi et al., 2015). Amplification of the target DNA is quantified by incorporating a fluorescent dye directly into the amplicon reaction or into a molecular probe designed to target a specific sequence bracketed by the PCR primers. The target-positive and target-negative droplets are individually counted by passing them in a single stream through a fluorescence detector similar to a flow cytometer. The ratio of the target-positive to the target-negative droplets is used to estimate the number of copies of the target DNA in the sample, under the assumptions that the target molecules are distributed among the 20,000 droplets according to a Poisson function. Thus, unlike conventional qPCR, ddPCR allows for direct quantification without the need for standard curves, eliminating the variance associated with creating and running standards with each batch (Cao et al., 2016).
Here, we have investigated the potential for ddPCR to detect eDNA from seawater collected following the passage of killer whales, Orcinus orca, in Puget Sound (the Salish Sea). For this, we took advantage of methods previously developed for species identification of cetacean products sold in Japanese and Korea markets (e.g., Baker and Palumbi, 1994; Baker et al., 2006), including a comprehensive reference database of mitochondrial (mt)DNA sequences from most recognized species of cetaceans (Ross et al., 2003; Dalebout et al., 2004). From these reference sequences, we designed primers for short fragments of the mtDNA, referred to as “mini-barcodes,” to target killer whales and improve amplification of degraded DNA. We chose killer whales in Puget Sound for this initial investigation because their well-described habits allowed us to locate and sample individuals or groups efficiently (Hauser et al., 2007). Additionally, the local distribution of killer whales includes multiple “communities” and ecotypes, identifiable by distinct vocalizations (Ford, 1991) and distinct mtDNA haplotypes (Parsons et al., 2013). This overlapping distribution includes the critically endangered “southern resident” community of killer whales (Hauser et al., 2007). Our sampling design was intended to quantify eDNA from the “wake of the whales,” i.e., from directed sampling assisted by visual or acoustic localization. However, the result of our serial sampling also provide some insight into the potential for spatial sampling of eDNA for the purposes of describing habitat use or estimating “occupancy” in the marine environment.
Materials and Methods
Field Surveys
Killer whales were located in the waters around the San Juan Islands during small-boat surveys operating out of the Friday Harbor Laboratory (FHL), during August and September 2015 (Figure 1). At each encounter with killer whales, the boat was moved into position 200 m behind the whales (to comply with local whale watching regulations, NOAA, 2011). A Lagrangian drifter (Microstar™ GPS drifter, Pacific Gyre Inc., Oceanside, CA, USA) was launched to maintain position in the water mass after the whales passed. The drifter tracked currents at 1 m beneath the surface and also recorded the sea surface temperature. Location and temperature data was stored in 30 s intervals on the instrument and downloaded after recovery. A Zoom H4n Pro™ (Zoom North America Inc., Hauppauge, NY, USA) handheld recorder and an HTI-96MIN™ (High Tech Inc., Long Beach, MS, USA) hydrophone were used to monitor vocalizations and, in some cases, to confirm the dialect of the southern resident pods.
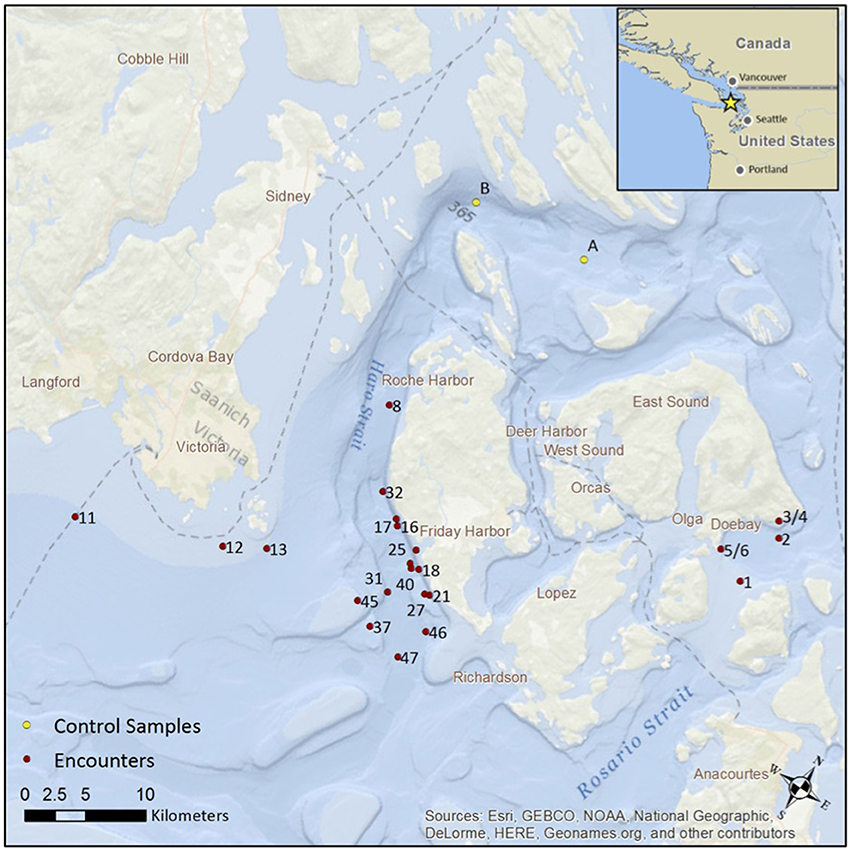
Figure 1. The location of 25 encounters with killer whales in the San Juan Islands during August and September 2015. The red dots show the location of the first eDNA sample, after positioning the vessel at a distance of 200 m behind the passage of the whales. The yellow dots show the location of two “no-whale” controls. Note, encounter numbers for collection of eDNA are sequential but not necessarily consecutive.
After initial positioning, seawater samples were collected from the surface or sub-surface in a 1L, wide mouth, sterile Nalgene™ bottle. Sub-surface samples were collected from ~50 to 80 cm below the surface using a PVC bilge pump. Surface collections were made at the air/surface interface. All single and serial samples were collected in pairs, one from the starboard and one from the port side of the boat, for a total of 2 L for each sample. Serial samples within an encounter were conducted at 15-min intervals for up to 2 h following the passage of the whales. Note that other events in the field were recorded as “encounters” and that encounter numbers for collection of eDNA are not necessarily consecutive.
Seawater Filtration and eDNA Extraction
The seawater samples were stored on ice on the boat and returned each evening to the laboratory. Depending on the flow rate, either 1 or 2 L of seawater were filtered through a 0.4 micron, Whatman Cyclopore polycarbonate membrane (GE Lifesciences, USA) using a portable Nalgene filter unit and low pressure vacuum pump at FHL The filters were stored in 1–2 ml of Longmire's solution (Wegleitner et al., 2015) on ice for transport back to our home laboratory. To avoid contamination in the field, we operated in a wet laboratory that had never been exposed to cetacean samples. We decontaminated sample bottles and filter units by soaking overnight in 10% diluted bleach, followed by rinsing with tap water. To test for cross-contamination during sample processing, we also filtered a “negative control” by replacing the seawater sample with tap water that was subsequently extracted and amplified.
The eDNA was extracted from the filters by conventional phenol/chloroform (PCI) methods (Renshaw et al., 2015). The volume or each extraction was adjusted to represent 1 L of seawater and the extracted DNA was re-suspended in 50 μL of TE. To avoid any contamination in the laboratory, all extractions were conducted in a “clean” room that has never been exposed to post-PCR products. We followed other standard protocols for preventing contamination including use of filtered tips, extraction blanks, and PCR blanks. Initial experiments indicated the presence of PCR inhibitors, a common problem in the extraction of eDNA (Jane et al., 2015). Inhibition was reduced (although probably not eliminated) by diluting the extracted eDNA in a 1:1 volume of laboratory grade water. As an additional control for contamination, we chose the southern resident killer whales for our study because no biological sample of this ecotype has ever been processed in our laboratory.
Primer and Molecular Probe Design
To optimize the detection and identification of eDNA from killer whales, we designed a set of PCR primers using available reference sequences for the mtDNA control region of the known killer whale ecotypes in the North Pacific (Figure 3). Many of these primers were slight modifications of primers used routinely for amplification of the cetacean control region and species identification, e.g., dlp4 and dlp5 (Dalebout et al., 2004; Baker et al., 2006). The objective was to design “mini-barcodes” that would amplify degraded eDNA but provide sufficient sequence information for identification of species and ecotypes. The primers Oordlp5Rleft and dlp8G amplified a fragment of 246 base pairs (bp) in length and the primers Oordlp6.5F and dlp8G amplified a fragment of 139 bp in length. These two primer pairs were used for the ddPCR with the EvaGreen™ fluorescent dye (see below). The sequence of the Oordlp6.5F primer was also used to synthesize a molecular probe (FAM labeled custom TaqMan®) for use with the bracketing primers, Oordlp5Rleft and dlp8G. The sequences of primers are included in Supplementary Material (SupMat Table 1).
Digital Droplet (dd)PCR
The eDNA of killer whales was detected and quantified using a Bio-Rad QX200™ AutoDG™ Droplet Digital™ PCR System at the Center for Genome Research and Biocomputing at Oregon State University. The system includes an Automated Droplet Generator that generates thousands of droplets from one ddPCR reaction containing the target DNA and a Droplet Reader for detecting the target fluorescence. Amplification of the target DNA was quantified by incorporating a fluorescent dye into the PCR reaction using QX200 ddPCR EvaGreen Supermix™, or into a TaqMan molecular probe designed to target a specific sequence bracketed by the PCR primers, using ddPCR Supermix for Probes™. The target-positive and target-negative droplets are visualized and analyzed using the manufacturer's software, QuantiSoft™. Quantification of target DNA, in copies/μL of reaction, is based on an assumption of a Poisson distribution of the target DNA among the more than 20,000 droplets from a typical 20 μL reaction (Miotke et al., 2015).
The optimal primer annealing temperature for ddPCR was determined using a gradient PCR. The gradient was run in 2°C increments from 50 to 60°C for the EvaGreen assays and from 54 to 64°C for the probe assay. For all assays 56°C was found to be the best annealing temperature, with the highest separation between positive and negative droplets. The final thermocycling profile for all assays was as per manufacturer's recommended protocols with the annealing/extensions step adjusted to 56°C. PCR mastermixs were made in a final volume of 22 μL under the following conditions; for EvaGreen assays, 1x supermix, 100 nM each primer and 5 μL DNA as described below; and for the Probe assay, 1x supermix, 900 nM each primer, 250 nM TaqMan Probe and 5 μL DNA as described below.
All samples were run in duplicate or triplicate, with negative controls (no-template controls) and positive controls included in each ddPCR run. Two of the replicates were used for quantification with the droplet reader and a third was used for re-amplification by conventional PCR and Sanger sequencing (see below). All values are expressed as the average of at least two runs, unless otherwise stated. Each experimental sample included 0.5 μL of the 50 μL re-suspended eDNA, using 5 μL of a 1/10 dilution series to reduce pipetting error. This volume of the extracted eDNA was chosen after initial “quenching experiments” showed evidence of inhibitors in conventional PCR experiments and initial ddPCR reactions showed evidence of droplet “rain” (Witte et al., 2016). The positive control was 1 μL of a 1/1,000 dilution of total cellular DNA extracted from a skin biopsy sample of a Hector's dolphin, Cephalorhynchus hectori hectori (Hamner et al., 2012). Based on Qubit Fluorometric Quantification, the concentration of genomic DNA in the positive control was 60 ng/μL, resulting in a mass of 60 pg/reaction after the 1/1,000 dilution. The Hector's dolphin was chosen because it is endemic to New Zealand and, thus, recognizably distinct by DNA barcoding from the cetacean community of the Salish Sea.
Re-Amplification and Sanger Sequencing
To confirm the species or ecotypes, we used conventional PCR to re-amplify the target amplicon from the ddPCR reaction after adding 20 μL of TE and breaking the oil emulsion, following manufacturers guidelines (Bio-Rad_Laboratories_Inc., 2014). Of the ~35 μL recovered from breaking the emulsion, 2 μL was added to subsequent conventional PCR reactions under the conditions detailed below. In addition, potential positive samples indicated from ddPCR runs were directly amplified by one or two rounds of conventional PCR under the following reaction conditions; 1x buffer, 2.5 mM MgCl, 0.4 μM each primer, 0.2 mM dNTP, 0.25 Units of Platinum Taq™ (ThermoFisher Scientific, USA) and 5 μL of 1/10 dilution of eDNA in a final volume of 20 μL. Six different primer pair combinations were used in various experiments (Figure 2) and all were run with the following thermocycling profile; initial denaturation at 95°C for 3 min followed by 35 cycles of denaturation at 95°C for 30 s, annealing at 56°C for 30 s, extension at 72°C for 60 s, and a final extension step at 72°C for 5 min. The amplicons were cleaned with Agencourt AMPure XP (Beckman Coulter, USA) and sequenced in both directions with Big Dye terminator chemistry (ThermoFisher Scientific, USA) following manufacturers protocols. Excess dye-terminators were removed with Agencourt CleanSEQ beads (Beckman Coulter, USA) prior to running on an ABI3730xl. Sequences were aligned to known killer whale haplotypes (Parsons et al., 2013) and visually inspected with the software Sequencher 4.1 (Gene Code).
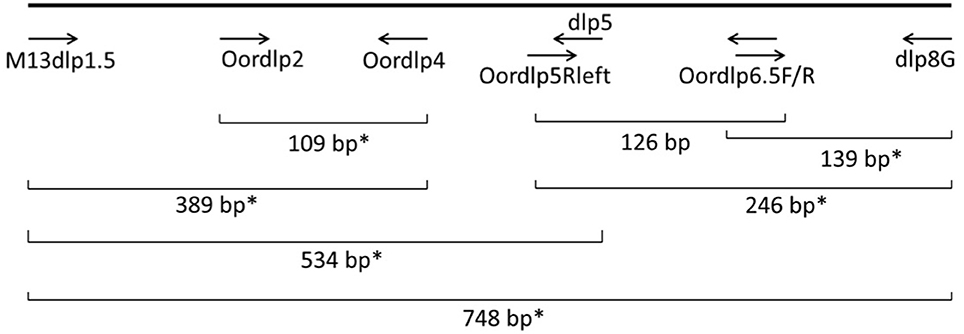
Figure 2. Locations of PCR primers and a molecular probe in the mtDNA control region of the killer whale. The probe assay amplified a 246 bp fragment from Oordlp5Rleft to dlp8G, using Oordlp6.5F as the probe. The EvaGreen assay amplified a 139 bp fragment from Oordlp6.5F to dlp8G. *Primer pairs used for conventional PCR.
Results
Seawater Sampling and eDNA Extraction
We collected seawater from the vicinity of killer whales on 17 encounters during the August field effort and on 8 encounters during the September (Figure 1). Group size ranged from 1 to 18, as judged by visual counts (SupMat Table 2). Southern resident killer whales were acoustically identified during some of the encounters (see SupMat Figure 1). The hand-held bilge pump was used for sub-surface sample collection during the 17 encounters in August. Based on this initial experience and a review of the literature (e.g., Moyer et al., 2014) we then changed to collecting samples from the air/surface interface for the eight encounters in September. From the 25 encounters, we collected, filtered and extracted DNA from 71 paired, 1 L samples of seawater from the passage of the whales. There was considerable variation in the number of samples collected during each encounter due to weather, tidal currents and the activity of other vessels. Of the 25 encounter, 11 were represented by a single point sample, 3 encounters by 2 serial samples, 4 by 3 serial samples, 4 by five serial samples and 2 by 9 serial samples (2 h total). Note that encounters were also recorded for other events in the field and that encounter numbers for collection of eDNA are not necessarily consecutive (see Figure 5). The well-recorded movements and predictable habits of the killer whales around the San Juan Islands also allowed us to collect two samples at locations where the whales had not been reported on the previous day (“no-whale” encounters).
Primer Design and Assay Sensitivity
Combinations of primers Oordlp5Rleft, Oordlp6.5F, and dlp8G tested positive against a “zoo-blot” of samples representing the family Delphinidae (the dolphins and “blackfish,” including the killer whales) using conventional PCR and sequencing. Assay sensitivity was then assessed by multiple runs of the positive control using the ddPCR. These showed good precision in paired replicate samples but an ~2-fold difference in sensitivity, apparently due to length of amplicon and method of incorporating the fluorescent (Figure 3). The most sensitive protocol was the EvaGreen incorporation into the shorter amplicon with the Oordlp6.5F to dlp8G primers (139 bp), providing an estimate of 47.75 copies/μl. The least sensitive assay was the molecular probe, nested within the longer fragment of the Oordlp5Rleft to dlp8G primers (246 bp). The EvaGreen incorporation with the Oordlp5Rleft to dlp8G primers was intermediate in sensitivity. The primer pair Oordlp2 and Oordlp4 was designed specifically for killer whales and to include sites considered diagnostic for the southern resident community (see Figure 7). Although we repeated the ddPCR experiments with various combinations of primers and probes, we focus here on the most comparable assays using EvaGreen incorporation with the primers Oordlp6.5F to dlp8G.
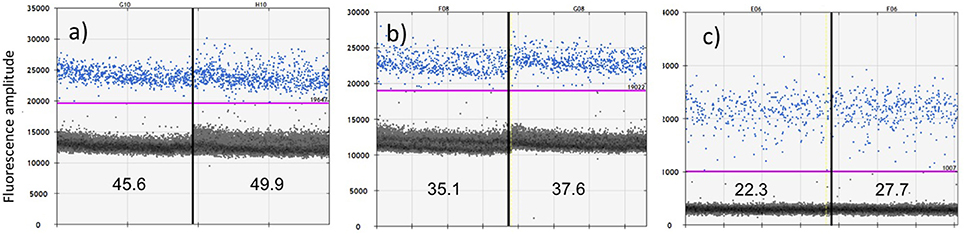
Figure 3. Comparative sensitivity of ddPCR in quantifying a positive control for cetacean mtDNA using three protocols: (a) primers Oordlp6.5F to dlp8G with EvaGreen fluorescent dye; (b) primers Oordlp5Rleft to dlp8G with EvaGreen fluorescent dye; and (c) a molecular probe (FAM labeled TaqMan) nested within Oordlp5Rleft to dlp8G. The samples were run in replicate, as represented on either side of the vertical lines. The estimated copies/μL for each replicate is shown near the bottom of each figure. The y axis shows units of amplitude for the fluorescent signal. The estimated copies/μL of DNA are measured by the number of target-positive droplets (shown in blue) above the baseline of target-negative droplets (shown as the dark layer), as visualized and analyzed using the software QuantiSoft. The purple line shows the upper threshold of the target-negative droplets calculated from the negative controls. The positive control represented ~60 pg of total genomic DNA extracted from the biopsy sample of a Hector's dolphin.
ddPCR Limits of Detection
To assess the relative sensitivity of the ddPCR, we conducted a serial dilution of the positive control using the EvaGreen incorporation with the Oordlp6.5F and dlp8G primer pair. The serial dilution started with the extracted genomic DNA of the Hector's dolphin (60 ng/μL), at the initial dilution of 1/1,000 used for the positive control in the experimental runs (i.e., a mass of 60 pg). This initial dilution was the starting point for an 8-fold series of 2x dilutions (e.g., 1/2,000 to 1/256,0000) and a negative control. The series included 6 replicates of each dilution. At the 1/1,000 dilution, the estimated concentration was 44.2 copies/μL (SE = 2.06), consistent with values for the positive control in the experimental runs. The decline in the estimates of the dilution series did not show a linear relationship but, instead, showed a stepwise decline (Figure 4). At a dilution of 1/32,000, the estimated concentration was 0.51 copies/μl (SE = 0.288). The lower limit of the detection series was 0.175 copies/μl (SE = 0.057), at a dilution of 1/128,000. At a dilution of 1/256,000, there was no detectable DNA. The negative control, however, included non-zero detections (0.05 copies/μL, SE = 0.024), presumably due to measurement artifacts (Hunter et al., 2017).
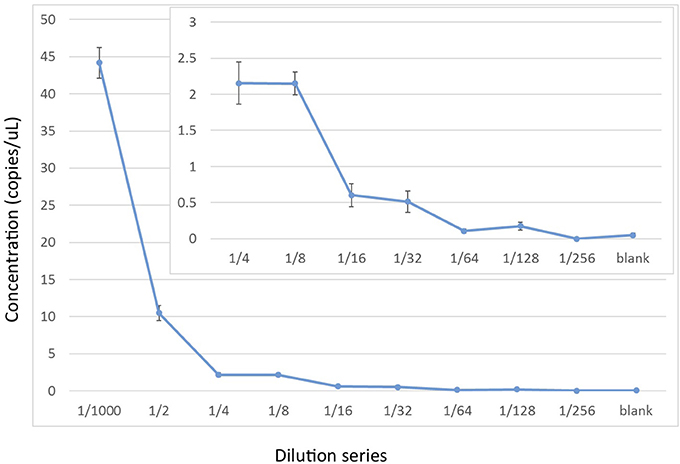
Figure 4. Experimental limits of detection for cetacean mtDNA by ddPCR using a 2x dilution series starting with ~60 pg of cellular DNA from a Hector's dolphin (i.e., a 1/1,000 dilution of a 60 ng/μL stock). The ddPCR were run with 6 replicates using EvaGreen reaction mix to amplify a 139 bp fragment from Oordlp6.5 to dlp8G.
Relating the 1/128,000 dilution to the estimated mass of the initial positive control (60 ng), suggested a lower end of detection of 0.047 pg of total cellular DNA in a ddPCR reaction (20 μL). At this lower end of detection, however, the lower 95% confidence limits overlapped with the maximum value of the negative controls in the experimental runs (0.12 copies/μL, see SupMat Figure 1). For this reason, we considered samples with > 0.5 copies/μL to have met a strict threshold for a detection. We considered samples that exceeded the average of the negative controls in the experimental runs, > 0.12 copies/μL to have met a relaxed threshold for a detections.
Killer Whale eDNA Quantification by ddPCR
We used ddPCR to quantify the copy number of eDNA from 71 samples of seawater collected during 25 encounters after the passage of killer whales and 2 “no-whale” samples, with a series of experimental controls (positive and negative). The results of the 71 individual samples showed considerable variation in detection of eDNA from the killer whales (SupMat Figure 2). The average concentration of eDNA for all 71 experimental samples was 4.08 copies/μL (SE = 2.31) but the distribution of values was non-parametric (Kolmogorov-Smirnov test, p < 0.01), with zero values and a few very high values. In one encounter (#e46), three samples yielded estimates of eDNA greater than the positive control (> 60 copies/μL). If these three samples were excluded, the mean declined to 0.44 copies/μL (SE = 0.14). Using the strict threshold of > 0.5 copies/μL derived from the dilution series, 21 of these samples were likely detections. Using the maximum for the negative controls as the lower threshold (0.12 copies/μL), another 35 samples were “relaxed detections,” for a total of 56 samples with strict or relaxed detection. The values for one of the “no-whale” samples fell below the threshold for relaxed detection (0.035 copies/μL) but the other exceeded the relaxed threshold (0.18 copies/μL).
Given the likely serial dependency of samples within a series (see below), we considered it more informative to judge the probability of detection on the basis of an encounter, rather than individual samples (Figure 5). Of the 25 encounters, 17 included one or more samples with a concentration of eDNA exceeding 0.12 copies/μL and 10 of these exceeded 0.5 copies/μL. We noted a positive relationship between the number of samples in a series and one or more positive samples, using either threshold for detection (Spearman's rank order correlation coefficient, R = 0.61 p = 0.001 for 0.12 copies/μL; R = 0.59, p < 0.002 for 0.5 copies/μL). We also noted a positive relationship between pod size and one or more positive samples in the encounter series, using either threshold for detection (Spearman's rank order correlation coefficient, R = 0.53 p = 0.006 for 0.12 copies/μL; R = 0.62, p < 0.001 for 0.5 copies/μL). Finally, we noted a greater detection probability for the eight encounters with sampling from the air/surface interface (encounters #e27 to #e47) compared to the 17 with sub-surface sampling, using either threshold of detection (Fisher's exact test, p = 0.026 for >0.12 copies/μL; p = 0.028 for >0.5 copies/μL).
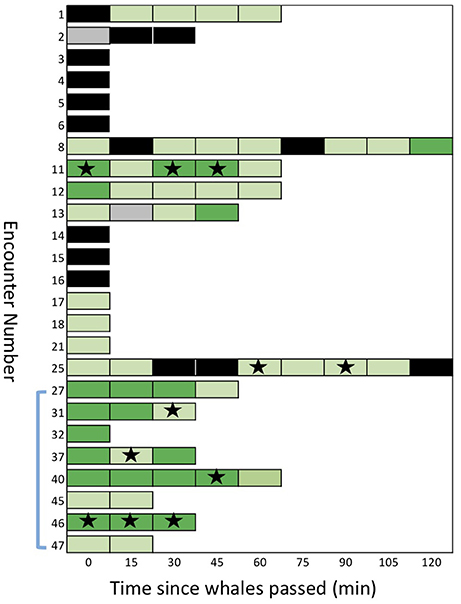
Figure 5. A sequential stack plot of the number of samples (for each of the 25 encounters) judged to be positive or negative for detection of eDNA under two different thresholds. Each block in the stack represents a sample: dark green are samples with an average of >0.5 copies/μl (strict detection); light green are greater than the maximum of the negative controls, >0.12 copies/μl, but < 0.5 copies/μl (relaxed detection). Samples shown in black are considered “no detection,” with < 0.12 copies/μl. Samples in gray are missing data. Stars indicate samples that provided mtDNA sequences after amplification of eDNA or re-amplification from ddPCR reactions. The blue bracket indicates the encounters during which samples were collected from the air/surface interface.
Serial Detection of the eDNA “Wake”
We found evidence of considerable persistence of detectable eDNA in the wake of the whales (Figure 5). Six of the encounters showed a positive detection (relaxed threshold) 60 min after the initial sample, two of these showed a positive detection after 90 min and one after 120 min (encounter #e08; see SupMat Figure 3). Although encounters with multiple samples had a greater probability of at least one detection, compared to single sample encounters (see above), there was no clear relationship between the order of serial samples and the quantification of eDNA (Figure 5). Of the 25 total encounters, 14 included 2 or more serial samples, 12 included three or more serial samples and 8 included 4 or more serial samples (Figure 5). Using a Wilcoxon signed-rank test (two tailed), we found no significant differences in the copies/μL of the first and second sample (n = 14; p = 0.133), the first and third sample (n = 12; p = 0.659) or the first and fourth sample (n = 9; p > 0.05).
However, we did find considerable stochastic variation in the copies/μL of serial samples, as illustrated by the case history of encounter #e11 (Figure 6). During this encounter, a pod of 12–18 killer whales was traveling steadily east after we initially positioned ourselves ~200 m behind the pod. Over the next 60 min we collected samples at 15-min intervals (samples #s45 to #s49) and drifted ~4 km, with the tidal current. The detection of eDNA varied from an average of 3.5 copies/μL in the first sample (#s45) to a low of 0.14 copies/μL in the second sample but then increased again in samples #s47 and #s48. One hour after the passage of the whales, there was an average of 0.34 copies/μL of eDNA in the subsurface water sample. All five samples exceeded the relaxed threshold of 0.12 copies/μL and three samples exceeded the strict threshold of 0.5 copies/μL. Three of the serial samples was re-amplified and sequenced to confirm the species (see Figure 5).
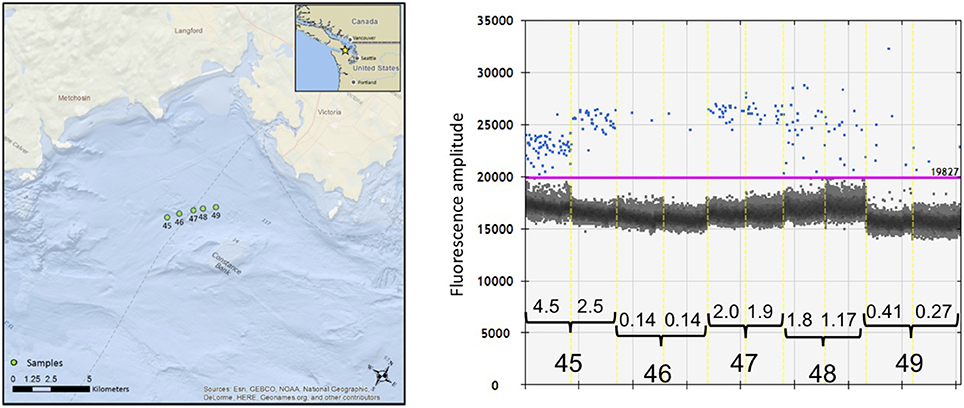
Figure 6. The location of samples collected during encounter #e11 with killer whales on August 12, 2015 and the result of the ddPCR quantification of eDNA from serial samples. (Left) Location of five serial samples (#s45 to #s49) as determined by the GPS of the Lagrangian drifter deployed initially 200 m after the passage of the whales. (Right) Visualization and analysis of five serial samples using the software QuantiSoft. The estimated copies/μL of eDNA from the killer whales measured by the number of target-positive droplets (shown in blue) above the baseline of target-negative droplets (shown as the dark cloud). The purple line shows the upper threshold of the target-negative droplets calculated from the negative controls. The black bars indicate the pairs of replicate samples, separated by the dashed yellow line. The calculated copies/μL are shown above the black brackets for each of the replicate samples. Two of the serial samples was re-amplified and sequenced to confirm the species (see text).
Species and Ecotype Identification by eDNA Sequencing
After breaking the emulsion of the triplicate ddPCR reaction, we were able to re-amplify and sequence a targeted fragment of mtDNA from 11 samples representing six encounters (see Figure 5). We note that 5 of these encounters had samples that exceeded the strict detection threshold (i.e., >0.5 copy/μl). Two of these samples (#s47 and #s48) are represented in the results for encounter 11 shown in Figure 5. One encounter (#e25) included samples that exceeded the relaxed threshold but not the strict detection threshold.
Although the length of these mini-barcodes was not sufficient to distinguish among the different ecotypes, they were sufficient to confirm the source of the eDNA was killer whale. From encounter #e46, however, there were three serial samples (#s94 to #s96) of sufficient quality and quantity to sequence over 700 bp of the mtDNA control region directly from the extracted eDNA (i.e., without an initial amplification by ddPCR). Using available reference sequences to define diagnostic sites for known ecotypes and communities in the North Pacific (Parsons et al., 2013), this sequence length allowed us to confirm that the encounter was a pod of the southern resident community (Figure 7). For a second encounter (#e25) we were able to sequence two fragments to confirm a southern resident haplotype after initial amplification of the ddPCR reaction. As we have never held tissue samples or DNA for this ecotype, we can exclude the potential for any contamination from other sources in our laboratory.
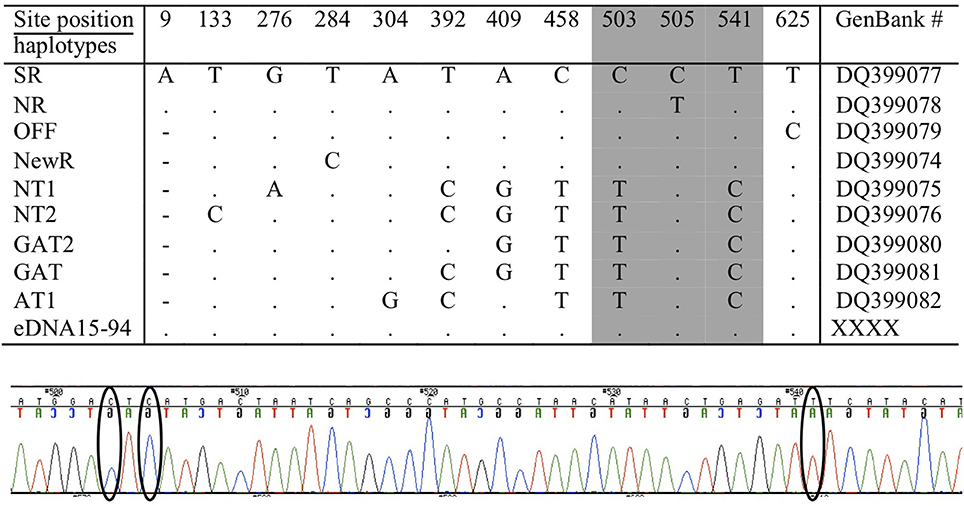
Figure 7. The positions of variable sites in the mtDNA control region of the killer whale, considered to be diagnostic (or characteristic) of ecotypes and communities in the North Pacific (note that numbering differs slightly) from (Parsons et al., 2013). Amplification and sequencing of eDNA from three samples of encounter #e46 matched the southern resident (SR), as shown on the first line, at all 12 variable sites. A representative segment of the sequencing electropherogram from encounter #e46 (sample eDNA15 #s94) is included to show the location of three diagnostic sites (indicated by ellipses), including position 505 that distinguishes the southern resident community (Haplotype SR) from the northern resident community (Haplotype NR). Other abbreviations refer to populations or ecotypes as reported in Parsons et al. (2013).
Discussion
Species and Ecotype Identification
We have demonstrated the potential for ddPCR to detect eDNA in samples of seawater after the passage of killer whales in inland waters. Using a relaxed threshold for false positives, we were able to detect eDNA of killer whales in 17 of the 25 encounters (68%). Using a strict threshold, we detected killer whales in 10 of these encounters (40% of the total). By re-amplification of the ddPCR amplicon and conventional sequencing, we were able to confirm that our eDNA detections were species specific and for, two encounters, that the sequences matched the mtDNA haplotype of the southern resident killer whales. Unlike direct sampling methods (e.g., biopsy sampling), our eDNA sampling imposed no disturbance to the whales and did not require an approach within the 200-yard limitation (182 m) of current vessel-approach regulations for killer whales (NOAA, 2011).
Limits of Detection
The choice of a threshold for a positive detection will depend on the tolerance of the research objectives for false positives or false negatives, as well as the precision of the measurements. Here our objective was to investigate the sensitivity of ddPCR for detecting and identifying our target species with a directed sampling design, rather than to estimate presence or absence of some unknown occupancy. For our objective, the strict threshold of >0.5 copies/μL was well supported by the limits of detection analysis and the negative controls of each run. Our choice of a relaxed threshold was more challenging. The value of 0.12 copies/μL was consistent with the lower limits of detection analysis and with the maximum of the negative controls in the experimental run but overlapped with the standard error of these negative controls and with other published estimates for limits of detection in ddPCR (e.g., 0.13 copies/μL, 95% CL 0.08–0.21; (Hunter et al., 2017). Although we were able to confirm some of the relaxed detections by re-amplification and sequencing of the mtDNA, a larger sample size and further experimentation with the ddPCR dynamics will be necessary to establish a more robust detection probability for occupancy modeling. This could include a standard dilution series for each plate in range of the assay expectations, as recommended by (Hunter et al., 2017). Limits of detection could also be improved by further technical development to improve the signal to noise ratio for the negative control and by reducing the inhibitors that tend to accumulate with increasing sample concentration (Williams et al., 2017).
Variation in Detection
As could be expected from the dynamics of sampling in the marine environment, there was considerable variation in detectable concentrations of eDNA from the killer whales. Although our sample size was not sufficient for multivariate analyses, we found a significant positive relationship for a detection (relaxed or strict) with the number of samples in an encounter, the pod size of the encounter and the collection of samples at the air/surface interface. Sampling at the air/surface interface compared to the subsurface sampling was a particularly influential variable. All of the 23 samples collected from the air/surface interface during the eight encounters in September showed a positive detection compared to 69% of the 48 subsurface samples from the 17 encounters in August. Surface sampling during one of these encounters yielded exceptionally high concentrations of eDNA, sufficient for sequencing nearly full-length fragments of the mtDNA control region. Likely contributors to this “surface effect” include advection of sloughed skin or feces, and the retention, by surface tension, of cellular DNA expelled from the spout or blow. Of these, an unobserved fecal plume would seem to be the most likely explanation for an anomalously high sample of eDNA. Although it is often assumed that whale feces are buoyant (Roman and McCarthy, 2011), this is likely to vary considerably by the prey type and the species of the consumer. Deployment of an Unmanned Aerial Vehicle (UAV) prior to eDNA sampling could provide evidence of the presence or absence of a fecal plume and species-specific differences in the persistence of a plume (Wolinsky, 2017).
Although the number of samples in an encounter was related to a positive detection, there was no significant difference in the concentration of eDNA (copies/μL) by order of serial sampling. This apparent absence of a sequential dilution effect is puzzling. Our best interpretation is that the fine-scale spatial distribution and vertical stratification of eDNA result in considerable variation from sample to sample within an encounter. This heterogeneity is greater than the potential homogenization of a dilution effect across the limited time span of the serial samples.
Persistence of Detection
The ability to detect eDNA persisted for at least an hour after the passage of the whales in six encounters and, in one of these encounters, for up to 2 h, despite movement of the water mass by more than 4 km due to tidal currents. The positive detection of one “no-whale” control suggests amplifiable DNA might persist longer under some conditions (e.g., Piaggio et al., 2014). This persistence bodes well for targeted sampling of elusive species like beaked whales. These species are very long-duration divers (e.g., Baird et al., 2006; Schorr et al., 2014) and difficult to approach for biopsy sampling during their limited time at the surface. However, with the assistance of acoustic localization and visual cues, it should be possible to sample eDNA from the approximate location of a dive, substantially increasing the efficiency of genetic sampling. Including localized spatial sampling with serial sampling could help in describing both the extent and persistence of an eDNA “wake” after the terminal dive. Although basic species identification remains the priority for beaked whales (e.g., Dalebout et al., 2014), species-specific primers could also be designed to identify intra-specific variation for stock identification of widely distributed species like Cuvier's beaked whales (Dalebout et al., 2005).
Conclusion
The development of ddPCR, with the incremental advances in primer design, seawater filtration, eDNA extraction, and sequencing, as evidenced here, provide a powerful new methodology for detection and identification of cetacean species, even those that are not easily identified by morphological or acoustic characteristics. If successful in open-ocean conditions, routine eDNA barcoding could complement the interpretation of acoustic and visual surveys now routinely used to monitor cetacean habitat, especially for rare or cryptic species like beaked whales. In general, genomic technology is advancing rapidly and sequencing costs are dropping rapidly, promising to make ubiquitous eDNA sequencing for surveys of biodiversity more efficient and affordable in the near future.
Ethics Statement
This research did not involve any animal manipulation. Seawater samples were collected at a distance greater than 200 meters after the passage of whales, in compliance with current regulations for vessel approach to killer whales in U.S. waters of Puget Sound (200 yards) and proposed guidelines for approach to southern resident killer whales in Canadian waters (200 m).
Author Contributions
CSB: contributed to the initial experimental design, directed the field collection of eDNA, provided oversight of analysis and was responsible for manuscript preparation; DS: participated in field collection of eDNA, was responsible for all laboratory analyses and for preparation of figure and tables; SN: participated in field collection of eDNA and acoustic recordings and was responsible for acoustic analysis and data archiving; HK: contributed to the initial experimental design, participated in the field collection of eDNA and acoustic recordings and provided oversight of analysis. All authors have reviewed the manuscript and approved submission.
Conflict of Interest Statement
The authors declare that the research was conducted in the absence of any commercial or financial relationships that could be construed as a potential conflict of interest.
The reviewer KJH and handling Editor declared their shared affiliation.
Acknowledgments
This work was funded by the Office of Naval Research (Contract Number: N00014-15-1-2297). We thank Mike Wiese for his interest and support of this research. We thank the following: Anjanette and Nevé Baker for assistance in the field; Bernadette Holthuis and Kristy Kull of the Friday Harbor Laboratory for assistance with accommodation and vessel support; Brad Hanson, John Durban, Holly Fernbach, and Lance Barret-Lennard for advice on field logistics; Candice Emmons for identification of killer whale calls; Jeanne Hyde and Jason Wood for coordination with whale-watching operations; Margaret Hunter (USGS) for technical advise; Taal Levi and Jennifer Allen for technical discussions; and, Anne-Marie Girard Pohjanpelto of the Center for Genome Research and Biocomputing for technical assistance.
Supplementary Material
The Supplementary Material for this article can be found online at: https://www.frontiersin.org/articles/10.3389/fmars.2018.00133/full#supplementary-material
References
Amos, W., Whitehead, H., Ferrari, M. J., Glockner-Ferrari, D. A., Payne, R., and Gordon, J. (1992). Restrictable DNA from sloughed cetacean skin: its potential for use in population analysis. Mar. Mamm. Sci. 8, 275–283. doi: 10.1111/j.1748-7692.1992.tb00409.x
Andruszkiewicz, E. A., Starks, H. A., Chavez, F. P., Sassoubre, L. M., Block, B. A., and Boehm, A. B. (2017). Biomonitoring of marine vertebrates in Monterey Bay using eDNA metabarcoding. PLoS ONE 12:e0176343. doi: 10.1371/journal.pone.0176343
Baird, R. W., Webster, D. L., McSweeney, D. J., Ligon, A. D., Schorr, G. S., and Barlow, J. (2006). Diving behaviour of Cuvier's (Ziphius cavirostris) and Blainville's (Mesoplodon densirostris) beaked whales in Hawai'i. Can. J. Zool. 84, 1120–1128. doi: 10.1139/z06-095
Baker, C. S., Lukoschek, V., Lavery, S., Dalebout, M. L., Yong-un, M., Endo, T., et al. (2006). Incomplete reporting of whale, dolphin and porpoise ‘bycatch’ revealed by molecular monitoring of Korean markets. Anim. Conserv. 9, 474–482. doi: 10.1111/j.1469-1795.2006.00062.x
Baker, C. S., and Palumbi, S. R. (1994). Which whales are hunted? A molecular genetic approach to monitoring whaling. Science 265, 1538–1539. doi: 10.1126/science.265.5178.1538
Bakker, J., Wangensteen, O. S., Chapman, D. D., Boussarie, G., Buddo, D., Guttridge, T. L., et al. (2017). Environmental DNA reveals tropical shark diversity in contrasting levels of anthropogenic impact. Sci. Rep. 7:16886. doi: 10.1038/s41598-017-17150-2
Bio-Rad_Laboratories_Inc (2014). Droplet DigitalTM PCR Applications Guide. Hercules:Bio-Rad Laboratories Inc. Available online at: http://www.bio-rad.com/webroot/web/pdf/lsr/literature/Bulletin_6407.pdf: Hercules:Bio-Rad Laboratories Inc.
Cao, Y., Griffith, J. F., and Weisberg, S. B. (2016). “The next-generation PCR-based quantification method for ambient waters: digital PCR,” in Marine Genomics: Methods and Protocols, ed. S. Bourlat (New York, NY: Springer), 113–130.
Dalebout, M. L., Baker, C. S., Cockroft, V. G., Mead, J. G., and Yamada, T. K. (2004). A comprehensive molecular taxonomy of beaked whales (Cetacea: Ziphiidae) using a validated mitochondrial and nuclear DNA database. J. Heredity 95, 459–473. doi: 10.1093/jhered/esh054
Dalebout, M. L., Baker, C. S., Steel, D., Thompson, K., Robertson, K. M., Chivers, S. J., et al. (2014). Resurrection of Mesoplodon hotaula Deraniyagala 1963: a new beaked whale in the tropical Indo-Pacific. Mar. Mamm. Sci. 30, 1081–1108. doi: 10.1111/mms.12113
Dalebout, M. L., Robertson, K. M., Frantzis, A., Englehaupt, D., Mignucci-Giannoni, A. A., Rosario-Delestre, R. J., et al. (2005). Worldwide structure of mtDNA diversity among Cuvier's beaked whales (Ziphius cavirostris): implications for threatened populations. Mol. Ecol. 14, 3353–3371. doi: 10.1111/j.1365-294X.2005.02676.x
Doi, H., Uchii, K., Takahara, T., Matsuhashi, S., Yamanaka, H., and Minamoto, T. (2015). Use of droplet digital PCR for estimation of fish abundance and biomass in environmental DNA surveys. PLoS ONE 10:e0122763. doi: 10.1371/journal.pone.0122763
Ficetola, G. F., Miaud, C., Pompanon, F., and Taberlet, P. (2008). Species detection using environmental DNA from water samples. Biol. Lett. 4, 423–425. doi: 10.1098/rsbl.2008.0118
Foote, A. D., Thomsen, P. F., Sveegaard, S., Wahlberg, M., Kielgast, J., Kyhn, L. A., et al. (2012). Investigating the potential use of environmental DNA (eDNA) for genetic monitoring of marine mammals. PLoS ONE 7:e41781. doi: 10.1371/journal.pone.0041781
Ford, J. K. B. (1991). Vocal traditions among resident killer whales (Orcinus orca) in coastal waters of British Columbia. Can. J. Zool. 69, 1454–1483. doi: 10.1139/z91-206
Gargan, L. M., Morato, T., Pham, C. K., Finarelli, J. A., Carlsson, J. E. L., and Carlsson, J. (2017). Development of a sensitive detection method to survey pelagic biodiversity using eDNA and quantitative PCR: a case study of devil ray at seamounts. Mar. Biol. 164, 112. doi: 10.1007/s00227-017-3141-x
Hamner, R. M., Pichler, F. B., Heimeier, D., Constantine, R., and Baker, C. S. (2012). Genetic differentiation and limited gene flow among fragmented populations of New Zealand endemic hector's and Maui's dolphins. Conserv. Genet. 13, 987–1002. doi: 10.1007/s10592-012-0347-9
Hauser, D. D. W., Logsdon, M. G., Holmes, E. E., VanBlaricom, G. R., and Osborne, R. W. (2007). Summer distribution patterns of southern resident killer whales Orcinus orca: core areas and spatial segregation of social groups. Mar. Ecol. Prog. Ser. 351, 301–310. doi: 10.3354/meps07117
Hunt, K. E., Moore, M. J., Rolland, R. M., Kellar, N. M., Hall, A. J., Kershaw, J., et al. (2013). Overcoming the challenges of studying conservation physiology in large whales: a review of available methods. Conserv. Physiol. 1:cot006. doi: 10.1093/conphys/cot006
Hunter, M. E., Dorazio, R. M., Butterfield, J. S., Meigs-Friend, G., Nico, L. G., and Ferrante, J. A. (2017). Detection limits of quantitative and digital PCR assays and their influence in presence–absence surveys of environmental DNA. Mol. Ecol. Resour. 17, 221–229. doi: 10.1111/1755-0998.12619
Jane, S. F., Wilcox, T. M., McKelvey, K. S., Young, M. K., Schwartz, M. K., Lowe, W. H., et al. (2015). Distance, flow and PCR inhibition: eDNA dynamics in two headwater streams. Mol. Ecol. Resour. 15, 216–227. doi: 10.1111/1755-0998.12285
Jerde, C. L., Mahon, A. R., Chadderton, W. L., and Lodge, D. M. (2011). “Sight-unseen” detection of rare aquatic species using environmental DNA. Conserv. Lett. 4, 150–157. doi: 10.1111/j.1755-263X.2010.00158.x
Krützen, M., Barré, L. M., Möller, L. M., Heithaus, M. R., Simmer, C., and Sherwin, W. B. (2002). A biopsy system for small cetaceans: darting success and wound healing in Tursiops spp. Mar. Mamm. Sci. 18, 863–878. doi: 10.1111/j.1748-7692.2002.tb01078.x
Lambertsen, R. H. (1987). A biopsy system for large whales and its use for cytogenetics. J. Mamm. 68, 443–445. doi: 10.2307/1381495
Ma, H., Stewart, K., Lougheed, S., Zheng, J., Wang, Y., and Zhao, J. (2016). Characterization, optimization, and validation of environmental DNA (eDNA) markers to detect an endangered aquatic mammal. Conserv. Gen. Resour. 8, 561–568. doi: 10.1007/s12686-016-0597-9
Miotke, L., Lau, B. T., Rumma, R. T., and Ji, H. P. (2015). High sensitivity detection and quantitation of DNA copy number and single nucleotide variants with single color droplet digital PCR. Anal. Chem. 86, 2618–2624. doi: 10.1021/ac403843j
Moyer, G. R., Díaz-Ferguson, E., Hill, J. E., and Shea, C. (2014). Assessing environmental DNA detection in controlled lentic systems. PLoS ONE 9:e103767. doi: 10.1371/journal.pone.0103767
Noren, D. P., and Mocklin, J. A. (2011). Review of cetacean biopsy techniques: factors contributing to successful sample collection and physiological and behavioral impacts. Mar. Mamm. Sci. 28, 154–199. doi: 10.1111/j.1748-7692.2011.00469.x
Parsons, K. M. (1999). Amplifying dolphin mitochondrial DNA from faecal plumes. Mol. Biol. 8, 1753–1768. doi: 10.1046/j.1365-294x.1999.00723-8.x
Parsons, K. M., Durban, J. W., Burdin, A. M., Burkanov, V. N., Pitman, R. L., Barlow, J., et al. (2013). Geographic patterns of genetic differentiation among killer whales in the northern North Pacific. J. Hered. 104, 737–754. doi: 10.1093/jhered/est037
Piaggio, A. J., Engeman, R. M., Hopken, M. W., Humphrey, J. S., Keacher, K. L., Bruce, W. E., et al. (2014). Detecting an elusive invasive species: a diagnostic PCR to detect Burmese python in Florida waters and an assessment of persistence of environmental DNA. Mol. Ecol. Resour. 14, 374–380. doi: 10.1111/1755-0998.12180
Port, J. A., O'Donnell, J. L., Romero-Maraccini, O. C., Leary, P. R., Litvin, S. Y., Nickols, K. J., et al. (2016). Assessing vertebrate biodiversity in a kelp forest ecosystem using environmental DNA. Mol. Ecol. 25, 527–541. doi: 10.1111/mec.13481
Renshaw, M. A., Olds, B. P., Jerde, C. L., McVeigh, M. M., and Lodge, D. M. (2015). The room temperature preservation of filtered environmental DNA samples and assimilation into a phenol/chloroform/isoamyl alcohol DNA extraction. Mol. Ecol. Resour. 15, 168–176. doi: 10.1111/1755-0998.12281
Roman, J., and McCarthy, J. J. (2011). The Whale Pump: marine mammals enhance primary productivity in a coastal basin. PLoS ONE 5:e13255. doi: 10.1371/journal.pone.0013255
Ross, H. A., Lento, G. M., Dalebout, M. L., Goode, M., Ewing, G., McLaren, P., et al. (2003). DNA surveillance: web-based molecular identification of whales, dolphins and porpoises. J. Hered. 94, 111–114. doi: 10.1093/jhered/esg027
Schorr, G. S., Falcone, E. A., Moretti, D. J., and Andrews, R. D. (2014). First long-term behavioral records from Cuvier's beaked whales (Ziphius cavirostris) reveal record-breaking dives. PloS ONE 9:e92633. doi: 10.1371/journal.pone.0092633
Sigsgaard, E. E., Nielsen, I. B., Bach, S. S., Lorenzen, E. D., Robinson, D. P., Knudsen, S. W., et al. (2016). Population characteristics of a large whale shark aggregation inferred from seawater environmental DNA. Nat. Ecol. Evol. 1:0004. doi: 10.1038/s41559-016-0004
Stewart, K., Ma, H., Zheng, J., and Zhao, J. (2017). Using environmental DNA to assess population-wide spatiotemporal reserve use. Conserv. Biol. 31, 1173–1182. doi: 10.1111/cobi.12910
Thomsen, P. F., Kielgast, J., Iversen, L. L., Møller, P. R., Rasmussen, M., and Willerslev, E. (2012). Detection of a diverse marine fish fauna using environmental DNA from seawater samples. PLoS ONE 7:e41732. doi: 10.1371/journal.pone.0041732
Wegleitner, B. J., Jerde, C. L., Tucker, A., Chadderton, W. L., and Mahon, A. R. (2015). Long duration, room temperature preservation of filtered eDNA samples. Conserv. Gen. Res. 7, 789–791. doi: 10.1007/s12686-015-0483-x
Williams, K. E., Huyvaert, K. P., and Piaggio, A. J. (2017). Clearing muddied waters: capture of environmental DNA from turbid waters. PLoS ONE 12:e0179282. doi: 10.1371/journal.pone.0179282
Witte, A. K., Mester, P., Fister, S., Witte, M., Schoder, D., and Rossmanith, P. (2016). A systematic investigation of parameters influencing droplet rain in the Listeria monocytogenes prfA assay - reduction of ambiguous results in ddPCR. PLoS ONE 11:e0168179. doi: 10.1371/journal.pone.0168179
Keywords: ddPCR, DNA barcoding, taxonomic, Killer whale, eDNA, mtDNA
Citation: Baker CS, Steel D, Nieukirk S and Klinck H (2018) Environmental DNA (eDNA) From the Wake of the Whales: Droplet Digital PCR for Detection and Species Identification. Front. Mar. Sci. 5:133. doi: 10.3389/fmars.2018.00133
Received: 16 December 2017; Accepted: 04 April 2018;
Published: 19 April 2018.
Edited by:
Peter H. Dutton, National Oceanic and Atmospheric Administration (NOAA), United StatesReviewed by:
Kirsten Jennifer Harper, Southwest Fisheries Science Center (NOAA), United StatesStefano Mariani, University of Salford, United Kingdom
Copyright © 2018 Baker, Steel, Nieukirk and Klinck. This is an open-access article distributed under the terms of the Creative Commons Attribution License (CC BY). The use, distribution or reproduction in other forums is permitted, provided the original author(s) and the copyright owner are credited and that the original publication in this journal is cited, in accordance with accepted academic practice. No use, distribution or reproduction is permitted which does not comply with these terms.
*Correspondence: C. Scott Baker, scott.baker@oregonstate.edu