Seasonal Variation in Transport of Zooplankton Into the Arctic Basin Through the Atlantic Gateway, Fram Strait
 Sünnje L. Basedow1*
  Arild Sundfjord2
  Wilken-Jon von Appen3
  Elisabeth Halvorsen1 Slawomir Kwasniewski4
  Marit Reigstad1
- 1Arctic and Marine System Ecology, Faculty of Biosciences, Fisheries and Economy, UiT The Arctic University of Norway, Tromsø, Norway
- 2Norwegian Polar Institute, Tromsø, Norway
- 3Helmholtz Center for Polar and Marine Research, Alfred-Wegener-Institute, Bremerhaven, Germany
- 4Institute of Oceanology, Polish Academy of Sciences, Sopot, Poland
The largest contribution of oceanic heat to the Arctic Ocean is the warm Atlantic Water (AW) inflow through the deep Fram Strait. The AW current also carries Atlantic plankton into the Arctic Basin and this inflow of zooplankton biomass through the Atlantic-Arctic gateway far exceeds the inflow through the shallow Pacific-Arctic gateway. However, because this transport has not yet been adequately quantified based on observational data, the present contribution is poorly defined, and future changes in Arctic zooplankton communities are difficult to project and observe. Our objective was to quantify the inflow of zooplankton biomass through the Fram Strait during different seasons, including winter. We collected data with high spatial resolution covering hydrography (CTD), currents (ADCP and LADCP) and zooplankton distributions (LOPC and MultiNet) from surface to 1,000 m depth along two transects crossing the AW inflow during three cruises in January, May and August 2014. Long-term variations (1997–2016) in the AW inflow were analyzed based on moored current meters. Water transport across the inflow region was of the same order of magnitude during all months (January 2.2 Sv, May 1.9 Sv, August 1.7 Sv). We found a higher variability in zooplankton transport between the months (January 51 kg C s−1, May 34 kg C s−1, August 50 kg C s−1), related to seasonal changes in the vertical distribution of zooplankton. However, high abundances of carbon-rich copepods were observed in the AW inflow during all months. Surface patches with high abundances of C. finmarchicus, Microcalanus spp., Pseudocalanus spp., and Oithona similis clearly contributed to the advected biomass, also in winter. The data reveal that the phenology of species is important for the amount of advected biomass, and that the advective input of zooplankton carbon into the Arctic Basin is important during all seasons. The advective zooplankton input might be especially important for mesopelagic planktivorous predators that were recently observed in the region, particularly during winter. The inflow of C. finmarchicus with AW was estimated to be in the order of 500,000 metric tons C y−1, which compares well to modeled estimates.
Introduction
The Arctic marine environment has undergone major changes in temperature and ice cover over the last decades, and is projected to continue to warm and thaw (Overland and Wang, 2013; IPCC, 2014). The largest oceanic heat transport to the Arctic Basin is the warm Atlantic Water (AW) inflow through the deep Fram Strait (Beszczynska-Möller et al., 2011). Over the last decades this AW inflow has become warmer (Beszczynska-Möller et al., 2012), and it has been identified as the main mediator of climate change in the Arctic marine environment (Spielhagen et al., 2011; Polyakov et al., 2012; Onarheim et al., 2014). In addition to heat, the AW current transports phytoplankton (Hegseth and Sundfjord, 2008; Metfies et al., 2016) and zooplankton of Atlantic origin, and with different functional roles (Kosobokova and Hirche, 2009; Kraft et al., 2013; Gluchowska et al., 2017b). Changes in ecosystem structure at lower latitudes are thus advected into the Arctic Basin and affect productivity and carbon cycling (Hunt et al., 2016). The input of zooplankton biomass through the Atlantic-Arctic gateway far exceeds the input through the shallow Pacific-Arctic gateway due to the large differences in water volume advected (Bluhm et al., 2015; Wassmann et al., 2015). However, this input has not yet been adequately quantified based on observational data, therefore the present contribution is poorly defined, and future changes in Arctic Basin zooplankton communities are still difficult to project and observe.
Atlantic expatriates in the Arctic Basin can considerably influence the composition of Arctic zooplankton communities; they might exert top-down control on primary production, and may also be an important food source for higher trophic levels (Olli et al., 2007; Kosobokova et al., 2011; Falk-Petersen et al., 2014). How the inflow of Atlantic species will manifest itself in Arctic food webs in the future is less clear. For example the Atlantic copepod Calanus finmarchicus contributes 30–40% to zooplankton biomass in the western Nansen basin (Mumm, 1993; Kosobokova and Hirche, 2009; Wassmann et al., 2015), but so far this species has not been able to reproduce in the Arctic Ocean and high non-predatory mortality is observed (Hirche and Kosobokova, 2007; Daase et al., 2014). The reasons for this are not fully understood, but low temperatures in the upper layer may slow development considerably, leading to a failure of reaching the main overwintering stages within one season (Hirche and Kosobokova, 2007; Daase et al., 2014). The delayed onset of the phytoplankton bloom in the Arctic domain also impacts survival and reproductive success of Atlantic copepods, by hindering development, maturation and egg production the following spring (Niehoff and Hirche, 2000). A warmer AW current might thus not only bring new species into the Arctic Ocean, but may also affect survival of those that are transported there.
North Atlantic and Arctic zooplankton species have adapted their life cycles to the pronounced seasonality at higher latitudes. Many herbivorours copepods tend to leave the productive epipelagic zone in winter, but variability occurs in the timing of their seasonal migrations throughout the Arctic (Daase et al., 2013). Other, omni- and detrivore species remain in the epipelagic (e.g., Oithona similis) or the mesopelagic zone (e.g., Triconia borealis) throughout the year, as a seasonal study from the Canadian Arctic has shown (Darnis and Fortier, 2014). The AW inflow in the Fram Strait stretches over the epipelagic into the mesopelagic zone and occupies roughly the upper 600–800 m. Species that stay in the epipelagic throughout the year will thus be advected into the Arctic Basin continuously, while species that perform seasonal migrations below the AW will be advected mainly during spring and summer. Seasonal variability occurs also in the strength and extension of the AW inflow: in summer the baroclinic offshore branch of the West Spitsbergen Current (WSC) is absent (Wekerle et al., 2017), such that in winter the WSC tends to be wider and stronger with two-fold higher transport (Beszczynska-Möller et al., 2012). The interplay between the seasonality of the currents and the variable seasonal migrations of zooplankton as part of their life cycle therefore strongly affects the potential of different species to be advected into the Arctic Basin.
The dominating Atlantic copepod C. finmarchicus has its core habitat in the Norwegian Sea, where it migrates to depths below the AW layer for overwintering (Gaardsted et al., 2011). During spring and summer C. finmarchicus stays in the upper layer and is then advected with AW to areas downstream (Edvardsen et al., 2003). In the region of AW inflow into the Arctic Basin C. finmarchicus recently has been observed in surface waters as early as January (Daase et al., 2014; Berge et al., 2015; Blachowiak-Samolyk et al., 2015). Winter data on zooplankton vertical distribution from Arctic regions are still scarce, but these recent observations challenge our understanding of the life cycle of one of the most well-studied copepods. A reduced understanding of fundamental principles also hinders the modeling of zooplankton transport into the Arctic Basin correctly, and stresses the need for seasonal observations.
Not all the AW that flows through the Atlantic gateway enters the Arctic Basin, in fact large amounts recirculate and eventually turn southwards (Hattermann et al., 2016; von Appen et al., 2016). However, a narrow barotropic branch flows northwards with high velocity along the steep continental slope in the eastern Fram Strait. Most of this water likely enters the Arctic Basin across the southeastern Yermak Plateau, although mesoscale instabilities shed off eddies that propagate westwards (Hattermann et al., 2016; von Appen et al., 2016). To the west of this continental slope current, to approximately 5 °E, the fate of the AW and included zooplankton is less certain. The AW flows northwards to the Yermak Plateau before either recirculating west- and southwards or entering the Arctic Basin across or around the perimeter of the plateau (Koenig et al., 2017). To the west of 5 °E the AW is likely recirculated. Zooplankton studies from the AW inflow in the northern Fram Strait so far have been limited to few (<10) stations and were mostly restricted to the upper 200 m (Hirche et al., 1991; Blachowiak-Samolyk et al., 2007; Svensen et al., 2011; Nöthig et al., 2015; Gluchowska et al., 2017a,b).
Time series of 9–14 years from the WSC indicate that with a warming AW we can expect higher abundances of the Atlantic-boreal species C. finmarchicus and Oithona similis (Weydman et al., 2014; Gluchowska et al., 2017a). However, based on optical data with high spatial resolution the generally patchy distribution of zooplankton has been confirmed for a region of the AW inflow in the Fram Strait (Trudnowska et al., 2016). Spatial variability explained as much of the variability in the analyzed time series as environmental factors did (Weydman et al., 2014). Often, statistical analyzes of net samples are complicated by the spatial resolution of the nets not matching the spatial resolution of the physical parameters. In this respect optical and acoustical methods that are collected in concert with physical parameters have the potential to greatly enhance our understanding of factors governing zooplankton distributions (Wu et al., 2014). In addition, these methods allow the collection of high-resolution data both in the vertical and horizontal plane, which needs to be taken into account when quantifying advection of zooplankton into the Arctic Basin.
Our main objective is to quantify the zooplankton biomass entering the Arctic Basin through the Fram Strait during different seasons, including winter. Based on an extensive biophysical dataset with high spatio-temporal resolution we aim to answer (1) how the interplay between the seasonal variability in AW inflow and zooplankton vertical distributions determines the advection of zooplankton species with different life cycles, and (2) how the input of external zooplankton biomass into the Arctic Basin compares to Arctic secondary production.
Materials and Methods
Field Sampling
Physical-biological data on the seasonal variation in hydrography, currents and plankton distributions were collected with high spatial resolution along two transects (referred to as C and D for consistency with other publications in this issue) crossing the Atlantic Water inflow into the Arctic Basin during three research cruises with R/V Helmer Hanssen in January, May and August 2014 (Figure 1, Table 1). Only one transect was completed in January due to time constraints. During the research cruises, currents were measured using a ship-mounted Acoustic Doppler Current Profiler (ADCP, RDI 75 kHz) along transects and a lowered ADCP (LADCP, RDI 300 kHz) profiling at stations. For an increased temporal resolution we used data from 6 moorings placed in the study region in 2014, and analyzed variations in the northward flow of Atlantic Water in 2014 compared to the long-term mean from 1997 to 2016 (von Appen et al., 2016). The moorings were located along 78°50′N, 79°N and 79°45′N near the 2,500 m isobaths. They contained rotor current meters and upward looking ADCPs at 250 m depth. More details on the mooring setup can be found in Beszczynska-Möller et al. (2012).
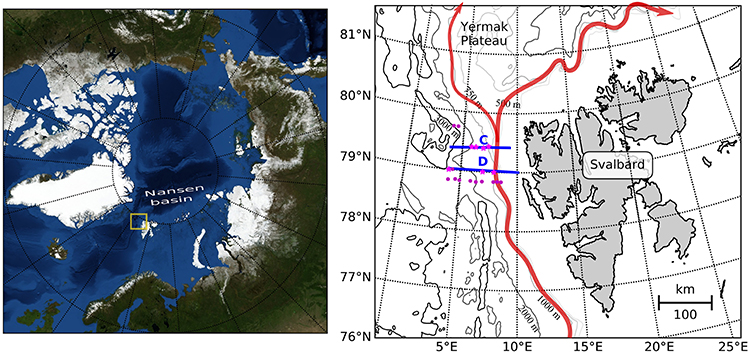
Figure 1. Map of the study area. The main inflow of Atlantic Water into the Arctic Basin is shown in red, after Hattermann et al. (2016). Continous sampling for hydrography and zooplankton distribution was performed along transects C and D (blue lines), which cross the Atlantic inflow. Magenta dots indicate mooring locations, pink stars indicate stations at which zooplankton was sampled.
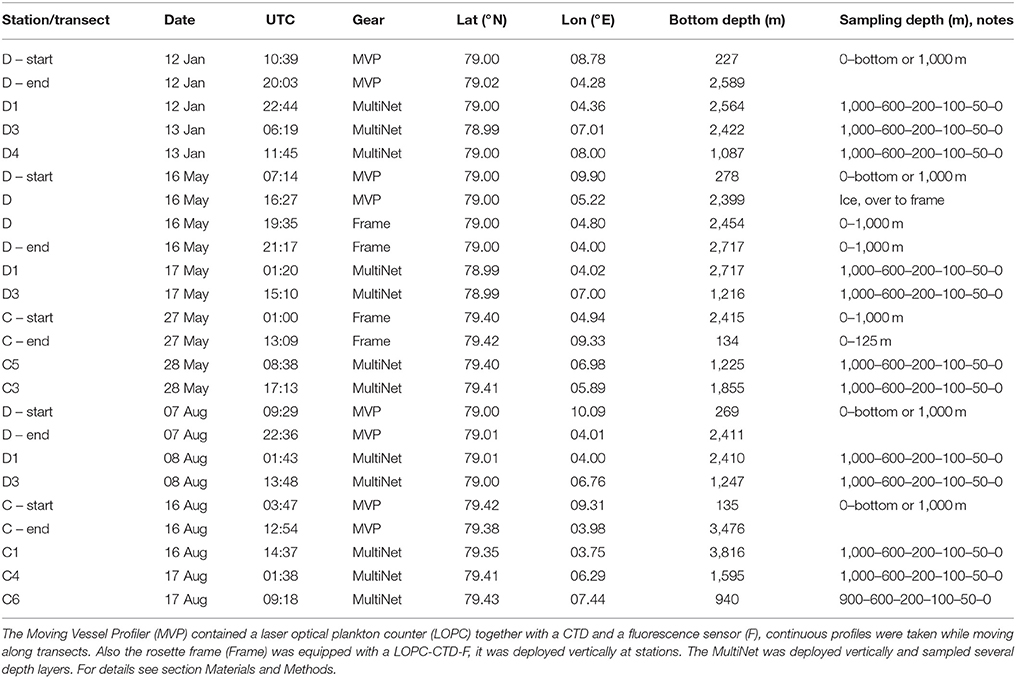
Table 1. Seasonal sampling for mesozooplankton across the Atlantic Inflow west of Svalbard in January, May, and August 2014.
To obtain high spatial resolution data on water mass properties and plankton distributions we used a free-fall Moving Vessel Profiler (MVP, ODIM Brooke Ocean, Rolls Royce Canada Ltd., Herman et al., 1998) that was equipped with a Conductivity-Temperature-Depth and a Fluorescence sensor (CTD, Applied Microsystems Micro CTD; F, WET Labs FLRT Chl a fluorometer), as well as a Laser Optical Plankton Counter (LOPC; ODIM-Brooke Ocean Rolls Royce Canada Ltd., Herman et al., 2004). These instruments provide quantitative data at a rate of 4 Hz (CTD-F) or 2 Hz (LOPC) on hydrography, fluorescence and mesozooplankton abundance. All instruments on the MVP are contained in a “fish” that is controlled by a remotely-operated winch system. In ice-free waters the MVP was used in free-wheel mode while the ship moved forward along transects. In this mode data are collected along profiles while the fish falls freely through the water column at 3.5–4 m s−1 vertical speed, and is then retrieved automatically by the winch. Sampling depth was from surface to 10 m above the bottom, but restricted to 1,000 m at maximum, which is well below the Atlantic Water layer (Table 1). Ship velocity along transects was 6–7 knots (3–3.6 m s−1) and bottom depth ranged between ca. 200 m on the shelf to >1,000 m offshelf, resulting in a distance between starting points of individual profiles of ca. 0.5 km on the shelf and ca. 5.5 km offshelf. When ice conditions did not permit continuous sampling, single profiles were taken with the MVP and the winch was then operated in continuous rounds-per-minute mode, resulting in downward velocities of the fish of ca. 3 m s−1. Alternatively, if conditions in total were too risky to deploy the MVP (i.e., a combination of darkness, sea ice, strong winds and high waves), the LOPC was mounted on a sturdy rosette frame together with a different CTD (Seabird 19plusV2, Seabird Electronics Inc., USA) and fluorescence sensor (WETLabs EcoFl, Seabird Electronics Inc., USA). In this case the instruments were deployed vertically at stations along the transects, and lowered with a speed of 0.7–0.8 m s−1.
To analyze the depth distribution of species and to aid interpretation of the high-resolution data, species composition in the study region was investigated based on vertically stratified net samples. These were collected by a MultiNet Midi (180 μm mesh size, 0.25 m2 mouth opening, Hydro-Bios, Kiel, Germany) that was deployed vertically at stations along transects (Table 1). Hauling speed was 0.5 m s−1. Samples were preserved in a solution of 80% seawater and 20% fixation agent (75% formaldehyde buffered with hexamine, 25% anti-bactericide propandiol), resulting in a final formaldehyde concentration of 4%.
Raw Data Analyses
Analyses of Water Masses
CTD data were screened for out-of-range values, which were removed prior to further analyses. Potential temperature (Θ) and density (σΘ) were computed from a running mean over 2 m of pressure, temperature and salinity using the seawater package (version 3.3.4) in python (www.python.org, version 2.7). Based on this, T-S diagrams (not shown) were made to help identifying water masses.
Analyses of Water Currents
The climatological northward transport for each month of the year was established based on mean gridded current data from the moorings as described in Beszczynska-Möller et al. (2012), but the data set was extended by 2 years, ranging from 2002 to 2012. Not all the moorings could be recovered in 2015, therefore we followed the approach of von Appen et al. (2016) to judge how similar 2014 was compared to the climatology. Current data obtained from the vessel-mounted ADCP and L-ADCP data were first processed by standard routines and afterwards tides were subtracted based on AOTIM (Padman and Erofeeva, 2004). The current data along transects were gridded using multivariate interpolation as specified in the function griddata in scipy.interpolate (www.scipy.org, version 0.18.1).
Two regions of possible inflow of AW into the Arctic Ocean were identified based on flux across transect D as observed by the moored instruments in this study, and as modeled in the study region (Hattermann et al., 2016): (1) The Inflow region in the upper 700 m along the continental slope between 8 and 9 °E, and (2) the Uncertain Fate region in the upper 700 m between 5.5 and 8 °E. Water and zooplankton in the Inflow region have a high likelihood of entering the Arctic Ocean, while in the Uncertain Fate region water and zooplankton may eventually end up in the Arctic Ocean or may be recirculated southwards in the East Greenland Current. We also analyzed the transport in the 700–1,000 m layer below both regions to estimate the transport of zooplankton residing below the AW layer.
Analyses of Zooplankton Distributions
Zooplankton distributions were analyzed with high spatial resolution based on LOPC data. The LOPC counts and measures particles that pass through its sampling channel while the instrument is towed through the water (Herman et al., 2004). Two types of particles are registered by the LOPC, single element particles (SEPs) and multi element particles (MEPs). SEPs are smaller particles which darken one to two of the 49 photodiodes of the LOPC, MEPs are larger particles that darken more than two photodiodes. Typically SEPs dominate in the size range below 0.6–0.8 mm equivalent spherical diameter (ESD), above which MEPs dominate. For MEPs additional features are registered, e.g., the transparency of particles, which is usually calculated as attenuation index (AI) that ranges from zero (completely transparent) to one (completely opaque). The size range of particles detected and registered by the LOPC is 0.1 μm to 35 mm ESD, but only particles between ca. 0.2 and 4 mm ESD are counted quantitatively. We analyzed particles in this size range as described in Basedow et al. (2014), which included thoroughly checking the quality of the data as described in Schultes and Lopes (2009) and Espinasse et al. (2017). The ESD is a relative measure of the diameter a particle has, in case of the LOPC it is the diameter equivalent to black calibration spheres. This means for example that large, transparent particles can have a relatively small ESD. The LOPC does not give any taxonomic information, and nets are not suited to capture marine snow or fragile zooplankton. Therefore, it is often unclear if transparent particles are marine snow or transparent zooplankton, and this varies in all likelihood regionally and seasonally (Ohman et al., 2012; Basedow et al., 2013). To separate zooplankton from other particles we followed the method developed by Espinasse et al. (2017) that indicates the ratio of zooplankton to detritus among small (SEPs) and large (MEPs) particles by analyzing two simple indicators, the percentage of MEPs in all counts, and the mean AI of MEPs.
During all months few faulty MEPs (as defined in Schultes and Lopes, 2009) were observed and the total number of MEPs was far below 106, showing that the LOPC was not overloaded and counted the correct amount of particles (Table A1). In January the mean AI was high (>0.2) and MEPs were relatively large (>1 mm ESD), which is typical for polar systems dominated by larger copepods (Basedow et al., 2013; Espinasse et al., 2017). In May and August parts of the transects (6 out of 9 files) were characterized by a high percentage of MEPs (≥2%) in combination with a low (August) to very low AI (May), Table A1. This is typical for hydrologically stratified systems, when the LOPC counts phytoplankton aggregates, other detritus and/or transparent zooplankton along with more opaque zooplankton (Espinasse et al., 2017). In May very high chlorophyll concentrations (up to 11.6 mg m−3) were observed in the area, indicating that phytoplankton aggregates might have contributed to LOPC counts. In August chlorophyll concentrations were lower (<4 mg m−3) indicating that detritus and/or transparent zooplankton might have contributed most to the large amount of transparent particles. More information on the distribution of chlorophyll can be found in Randelhoff et al. (this issue).
We divided particles into three different size groups and excluded transparent particles, i.e., MEPs with an AI <0.4, from our analyses so that the large size group consisted of zooplankton only, while the medium size group consisted of zooplankton for the most part. For the small size group, which consists mostly of SEPs, a division based on the transparency of particles is not possible, therefore the small size group in May and August most likely consisted of a mixture of zooplankton and detrital material. In January, however, the indicators developed by Espinasse et al. (2017) and applied to our data suggest that the small size group consisted mostly of zooplankton. The following three size groups were analyzed: small (S, 200–600 μm ESD), medium (M, 0.6–1.5 mm ESD) and large particles (L, 1.5–4 mm ESD). This size classification was chosen to separate dominating species in the study area into different groups, where possible (Basedow et al., 2014, and references therein).
Abundance of the three size groups was estimated based on particle counts and the water volume flowing through the sampling channel. For data that were collected during retrieval of the MVP “fish,” the water volume calculated based on LOPC data differed strongly from the water volume estimated trigonometrically from wire length, cable speed and the ships velocity. It is uncertain which of the estimated volumes is the correct one, therefore we constrained abundance analyses to downward profiles.
Analyses of the Zooplankton Community
From the fixed MultiNet samples zooplankton were counted and identified to the level of species (most copepods), genus or family (other groups). Conspicuous, large zooplankton (>5 mm, chaetognaths >10 mm) were identified and enumerated from the entire sample. From the rest of the sample, at least 500 individuals from a minimum of three sub samples (2 ml, obtained with an automatic pipette with tip end cut to leave a 5 mm opening) were identified, staged to life cycle and counted. This procedure allows for the analysis of abundance of common species and taxa with 10% precision and at a 95% confidence level (Postel, 2000). Copepods of the genus Calanus were identified to species based on their size (Kwasniewski et al., 2003). Specimens other than copepods were measured and sorted into different size categories (<5, 5–10, and 10–20 mm).
Analyzing Seasonal Variation in Transport of Zooplankton Into the Arctic Ocean
Transport of zooplankton biomass (kg C s−1) across the four different areas (Inflow region, Uncertain Fate region, and the layers below both, see section Analyses of Water Currents) was calculated by multiplying mean biomass in an area (mg C m−3) with mean northward water transport across that area (in Sv = 106 m3 s−1). Mean northward water transport was calculated based on the long-term data from 1997 to 2012 (Beszczynska-Möller et al., 2012, 2015), because we judged this to be more representative for the seasonal variation than the short-term data from the ship-mounted ADCP. Due to eddy activity in the region measured currents at any given time are representative for a few days only. Biomass transport was calculated for January, May and August, which in combination with the vertical distribution of zooplankton allowed us to analyze seasonal variation in the advection of zooplankton. A two-factorial analysis of variances (ANOVA) was performed to test if the depth distribution of zooplankton was significantly different between months and transport regions. Mean biomass was determined based on the zooplankton biovolume observed by the LOPC in each area. For this, biovolume was converted into carbon using a fixed ratio of 0.03 mg C mm−3 (Zhou et al., 2010). Biomass data from the downward profiles were gridded using multivariate interpolation as specified in the function griddata in scipy.interpolate (www.scipy.org, version 0.18.1). For each area the average carbon content per m3 was then computed based on the gridded data. Incorrectly interpolated data from depths below sampled depths at the shelf break were excluded from the analyses.
Results
Water Masses
During all cruises the dominating water mass in the upper 500 m was Atlantic Water (AW, Θ > 2°C, σT < 27.97, Rudels et al., 2005), Figure 2. Along transect D in January AW was observed from surface down to ca. 700 m along most of the transect, and down to ca. 400 m west of 5.6 °E. West of 5.6 °E the conductivity sensor was not working properly and this area is indicated by a gray rectangle in Figure 2. Also in May and August AW was observed all along the transect, but stretched down to ca. 450 m only and was overlain by a layer (ca. 50 m) of warm Polar Surface Water (wPSW, Θ > 0°C, σT < 27.7, Rudels et al., 2005). The layer of wPSW originates from sea ice that is melted by the relatively warm AW or by solar radiation (Rudels et al., 2005), see Figure 2 and Figure A1 for the distribution of wPSW along the transects in individual months. Below the warmer, less dense AW (Θ > 2°C) a part of AW with lower temperature was observed, down to ca. 900 m in January and ca. 750 m in May and August. This colder, denser AW, often called Arctic Atlantic Water, is characterized by 0°C < Θ < 2°C, σT > 27.97, σ0, 5 < 30.444, and by Θ and salinity increasing with depth (Rudels et al., 2005; Marnela et al., 2016). The main water mass below both these AW water masses was characterized by Θ < 0°C and σT > 27.97, properties typical for Arctic Intermediate Water (AIW, Marnela et al., 2016).
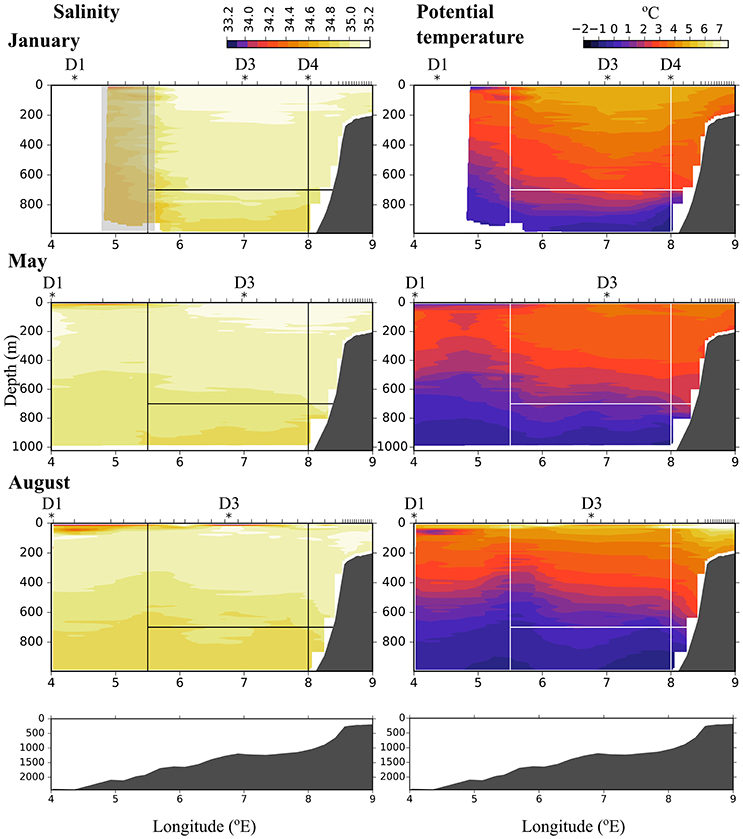
Figure 2. Salinity (Left) and potential temperature (Right) along transect D in January (Top), May (Middle), and August (Bottom). Ticks along the top axis indicate start points for vertical sampling profiles. Stars with labels depict stations at which zooplankton was sampled. In January, the conductivity sensor was not working properly west of 5.6 °E, this area is indicated by a gray rectangle. Black (Left) and white (Right) lines indicate the areas that were used for calculating flux. The bottom panels show the bottom topography along the transect.
Currents
Short-Term Currents Measured During the Cruises
In the Inflow region along the shelf break between 8 and 9 °E, both the ship-mounted ADCP (Figure 3) and the lowered ADCP (Figure 4) recorded a northward directed flow during all months. According to the ship-mounted ADCP the northward current was fastest in August, with more than 50 cm s−1, in an area not sampled by the LADCP. Conversely, in January the LADCP measured high current speed with nearly 50 cm s−1 at 8 °E, which was not detected by the ship-mounted ADCP. The northward flow was restricted to the upper 700 m during all sampled months. Below 700 m along the shelf break the current was flowing with variable velocities toward the southeast in January and May, and with low velocities toward the southwest in August (Figure 4). In the region of Uncertain Fate, between 5.5 and 8 °E, both instruments detected variable currents, with relatively strong northward velocities at times but also relatively strong southward velocities at other times, up to 30 cm s−1 at ca. 7.5 °E in January (Figure 3, top). West of 8 °E current direction below 700 m was mostly toward the northwest and the current speed was mostly low (Figure 4).
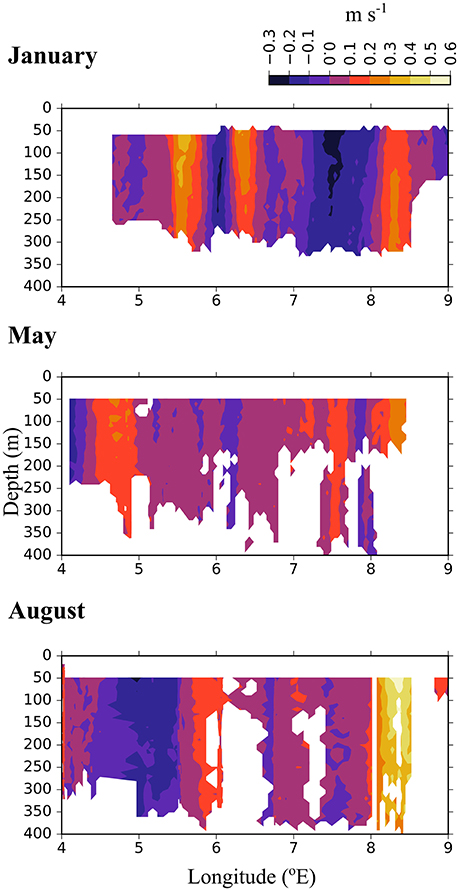
Figure 3. North-south directed current velocities across transect D, based on data collected by a ship-mounted ADCP during 3 months in 2014. The strong positive values east of 8 °E along the shelf break show the northward directed Atlantic inflow toward the Arctic Basin.
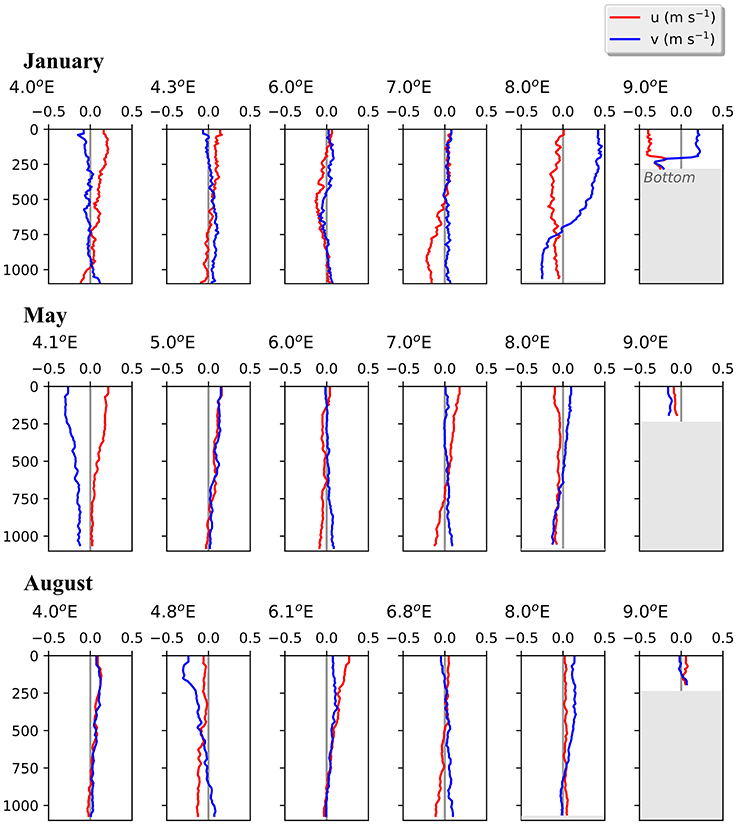
Figure 4. Vertical profiles of current velocities at six stations along transect D. Based on data collected by a lowered-ADCP during 3 months in 2014. Northward (v, blue) and eastward (u, red) directed currents are shown.
Long-Term Currents Observed by the Moorings
The currents observed by the ship-mounted ADCP and the LADCP (Figures 3, 4) at transect D were generally consistent with the currents observed at the mooring locations (Figure 5). Averaged over 1 to 31 January 2014 and 1 to 31 May 2014 a consistent northward flow at 75 m and 250 m was observed at the moorings along the continental slope (Figure 5). This is in agreement with the long-term measurements at the moorings, which showed a strong northward current in January, May and August (Figure 5, right panels). However, averaged over 1 to 31 August 2014 currents with highly variable directions were observed in the Inflow region, contrary to the long-term northward flow. During all months currents were more variable and weaker in the Uncertain Fate region than in the Inflow region along the shelf break. Currents at 250 m were not noticeably weaker than at 75 m (Figure 5), which is in agreement with the LADCP data that did not show a decrease in current velocity in the upper 500 m at most of the stations (Figure 4).
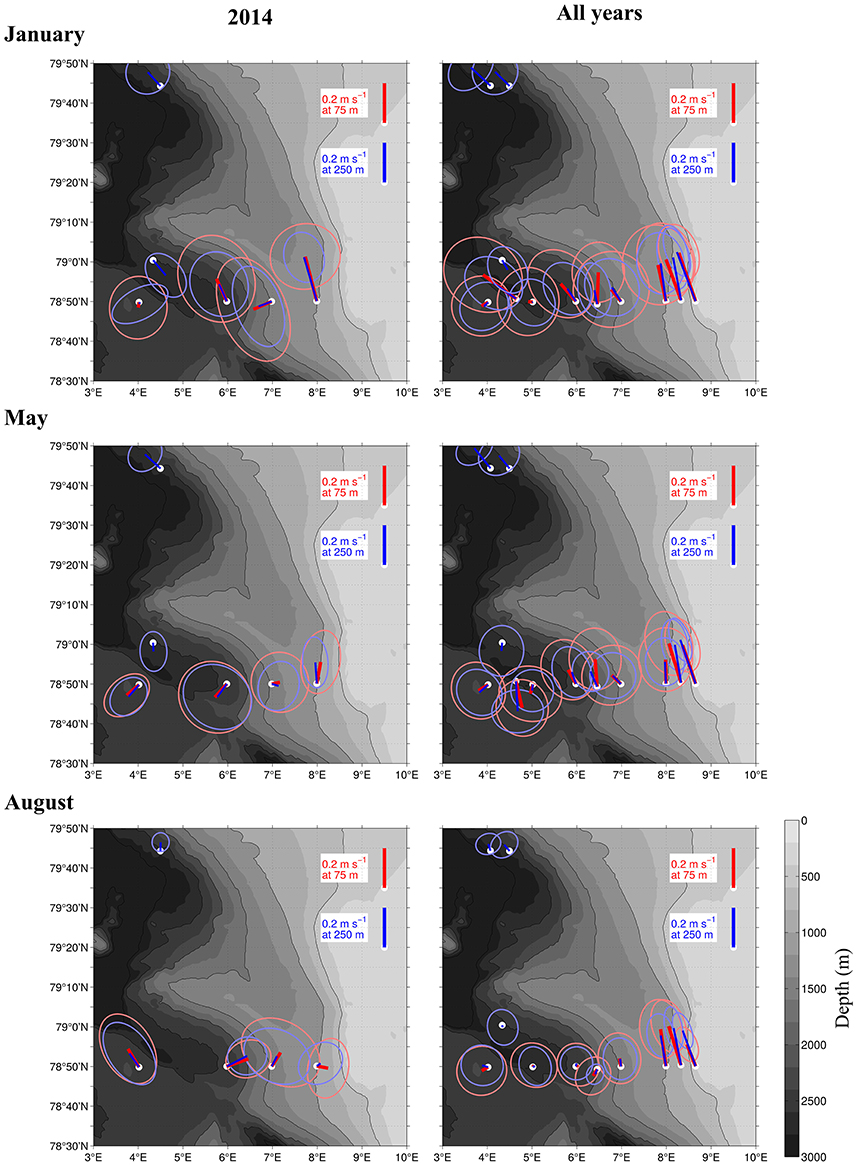
Figure 5. Current strength and direction (lines) in an area of the Atlantic Water inflow toward the Arctic Basin during 3 months in 2014 (Left), and averaged over 15 years from 1997 to 2012 (Right). Based on moored ADCPs that were placed at 75 m (red) and 250 m (blue). The ellipses around the lines show standard deviations of the currents. The averaging period was January 1–31st (top), May 1–31st (Center), and August 1–31st (Bottom).
Zooplankton Distribution
The distribution of zooplankton in the area indicates their potential of entering the Arctic Basin, depending on their vertical position in the water column (upper part or at depths > 600 m), and whether they are in the Inflow region (along the continental slope between 8 and 9 °E) or in the region of Uncertain Fate (5.5–8 °E). Significant seasonal differences were observed in the distribution of all zooplankton size groups (Figures 6–8, Table A2). In January, patches with high abundances of all size groups were observed in the surface layer, where they are subject to higher current velocities. Relatively high abundances were also observed below ca. 500 m, i.e., below the core of AW inflow (Table 2, Figures 6–8, top). In May, most medium-sized and large zooplankton was concentrated in AW, and very low abundances were observed below 700 m (Table 2, Figures 7, 8). In August, medium and large zooplankton were found in the entire water column, with the highest abundances of medium zooplankton in the upper 500 m (Figures 7, 8). The surface patches in January consisted predominantly of Calanus finmarchicus CIV and CV, but Microcalanus spp. and Pseudocalanus spp. also had high abundances, as well as the cyclopoid copepod Oithona similis (Table 2, and data for specific depth layers, not shown). Below the AW water layer these species, along with Metridia longa, were by far the dominating constituents of the zooplankton community in January.
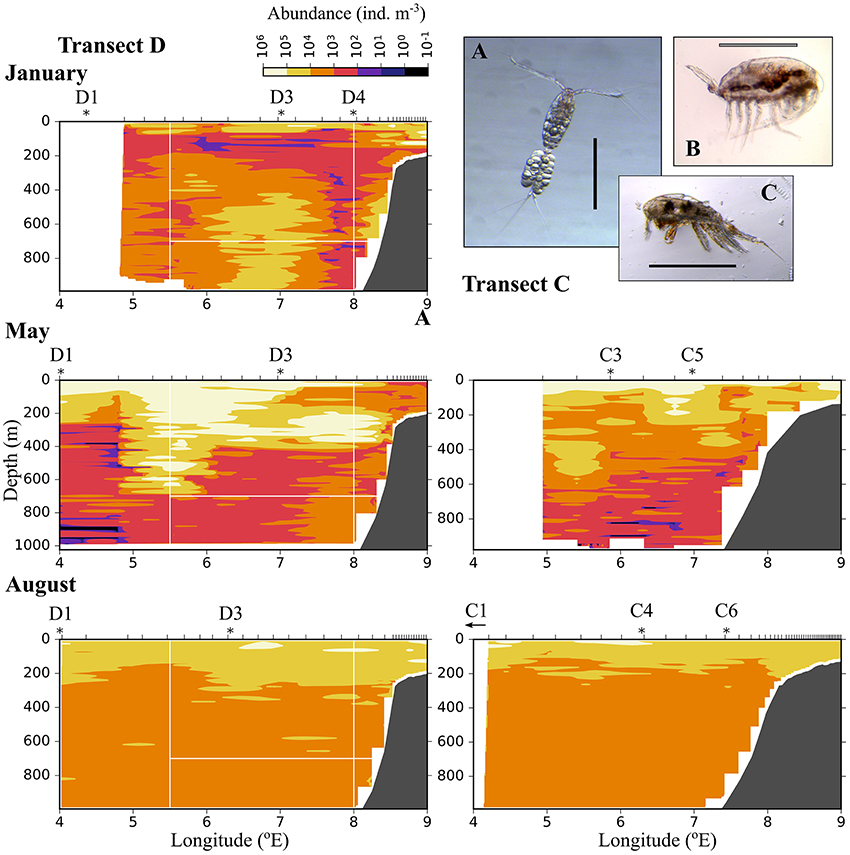
Figure 6. Distribution of small plankton and particles (200–600 μm equivalent spherical diameter) along three transects crossing the Atlantic inflow into the Arctic Basin. Based on data collected by a laser optical plankton counter (LOPC) in January (Top), May (Middle), and August (Bottom). See Figure 1 for location of transects. Ticks along the top axis indicate start points for vertical sampling profiles with the LOPC, stars denote the approximate position of MultiNet stations that were sampled after completion of sampling with the LOPC. A small arrow indicates that the MultiNet station lay outside the transect. Three of the most abundant zooplankton species in the MultiNet samples in this size range are shown: (A) Oithona similis, (B) Microcalanus sp., (C) Triconia borealis. The black scale bar is 0.5 mm, the gray scale bar is approximately 0.5 mm.
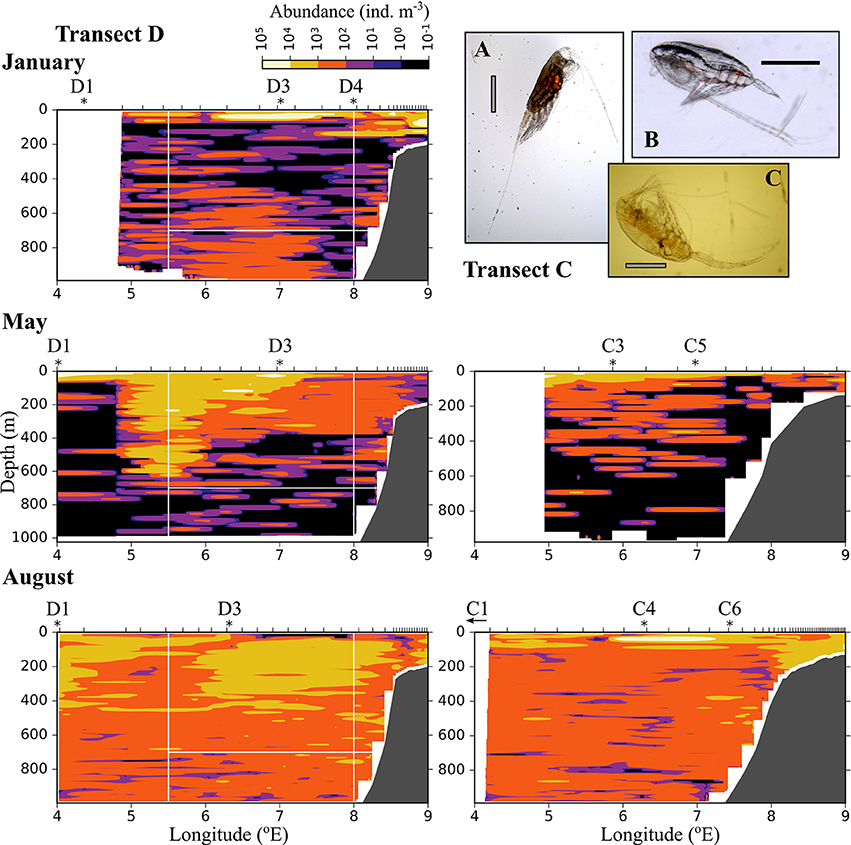
Figure 7. As Figure 6, but for medium-sized zooplankton (0.6–1.5 mm equivalent spherical diameter). (A) Heterorhabdus norvegicus (B) Calanus finmarchicus CIV, (C) Metridia longa female. The black scale bar is 1 mm, the gray scale bar is approximately 1 mm.
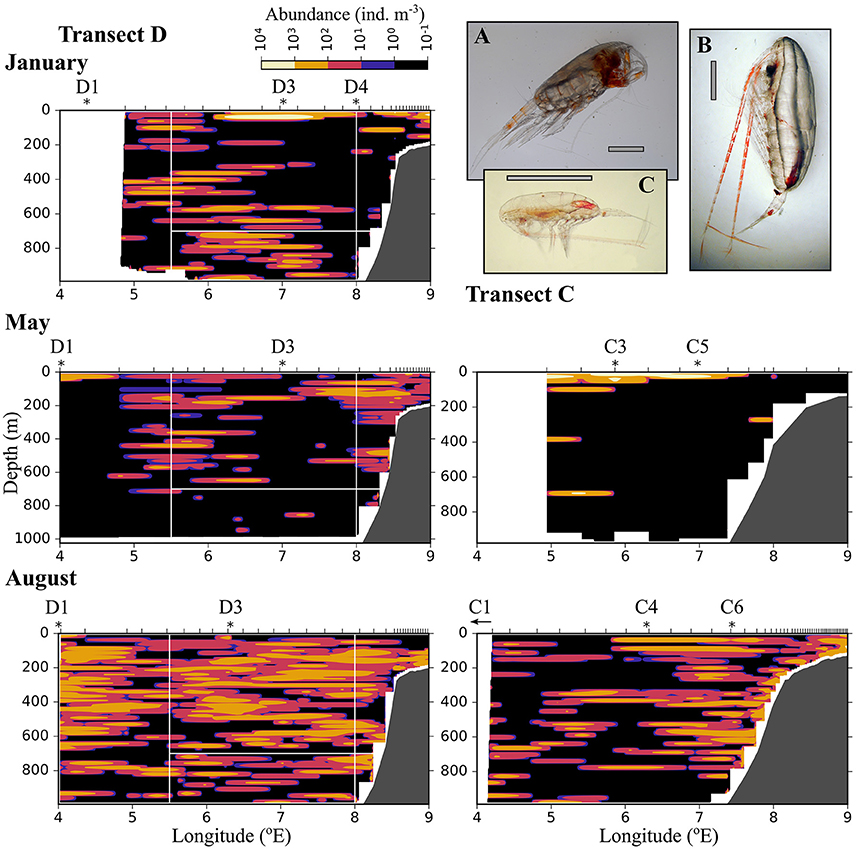
Figure 8. As Figure 6, but for large zooplankton (1.5–4 mm equivalent spherical diameter). (A) Paraeuchaeta sp. (B) Calanus hyperboreus, (C) Calanus finmarchicus female. The gray scale bar is approximately 2 mm.
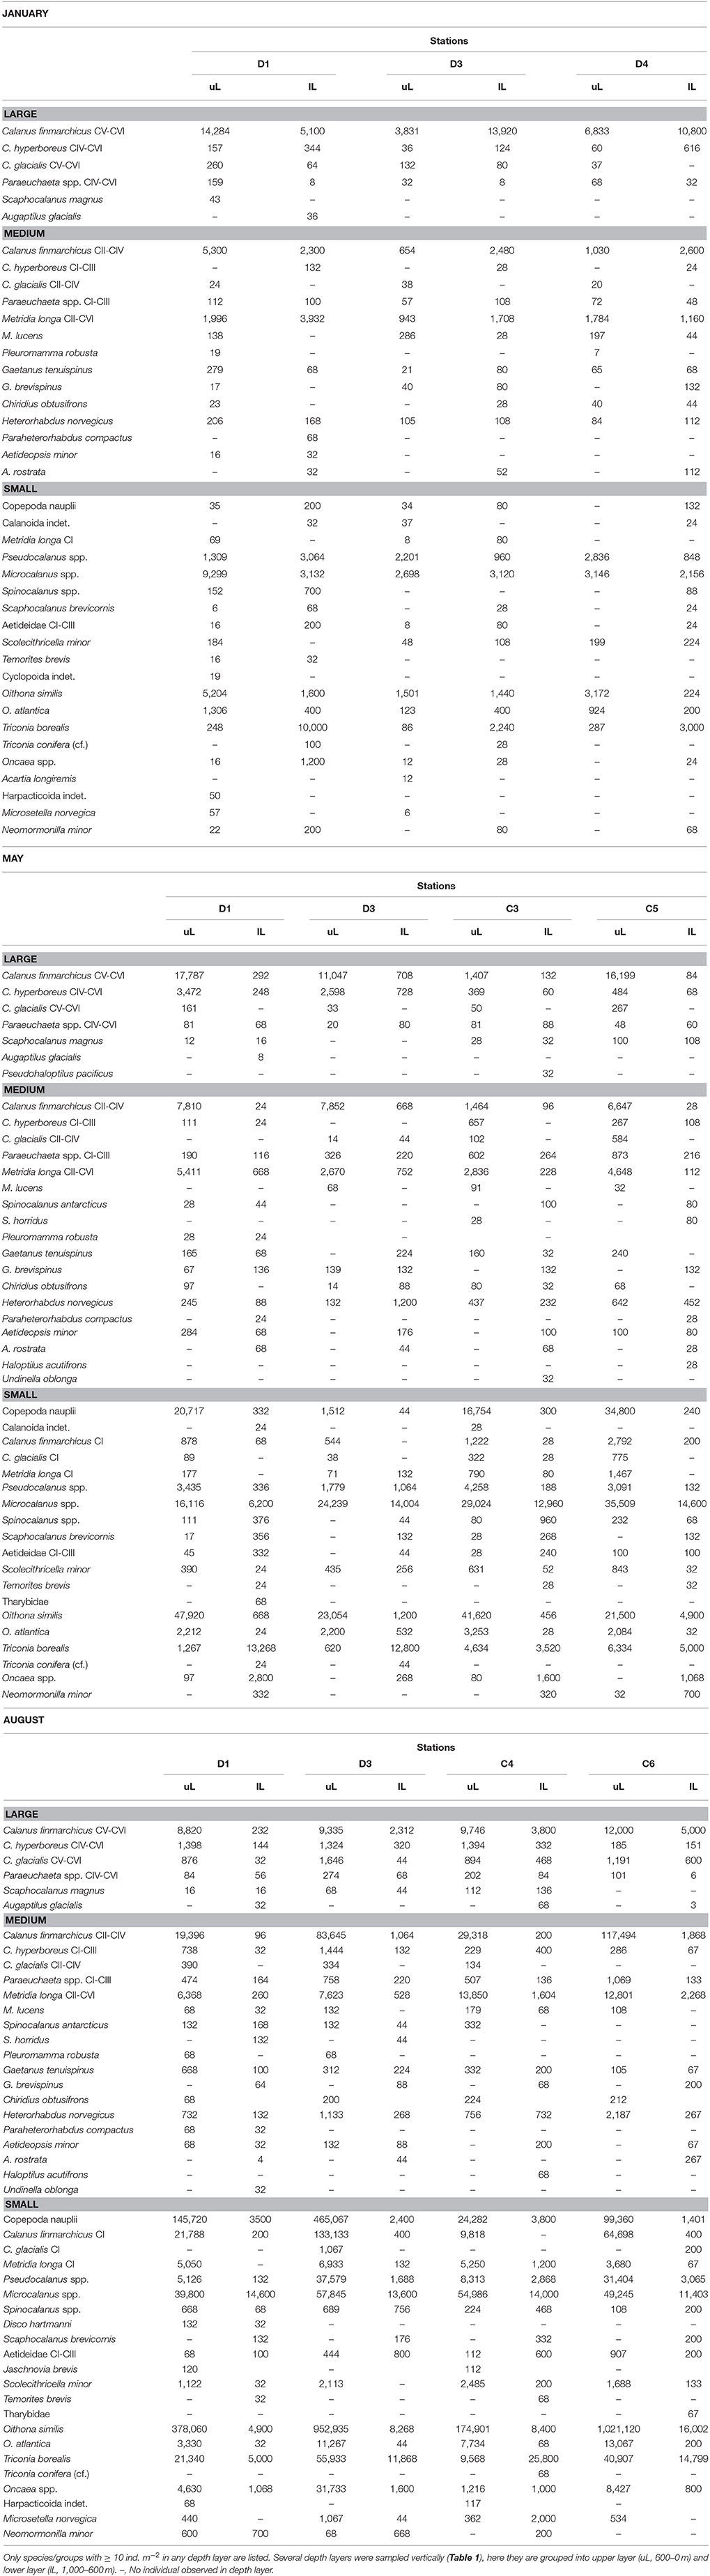
Table 2. Abundance of zooplankton species (individuals m−2) collected by a 180 μm-mesh MultiNet at stations across the Atlantic Water inflow into the Arctic Ocean in January, May and August 2014.
Relatively low abundances (<1,000 individuals m−3) of small plankton were observed offshelf between 100 and 200 m in January, and below 200 m east of 5 °E in May (Figure 6). Significantly higher abundances were observed along the shelf break in the Inflow region in January and also in May (Figure 6, Table A2). Keep in mind that the small size group likely contained a mixture of zooplankton and other particles in May and August, see Methods. In August, the distribution of small plankton and particles was very uniform along the transect, with very high abundances (between 104 and 106 m−3) in the epipelagic zone and high abundances (103-104 m−3) below (Figure 6). Net samples showed highest abundances of small zooplankton in the upper 600 m in May and August. Very high abundances of copepod nauplii, Oithona similis and Microcalanus spp. were observed in May. In August copepod nauplii, young stages of C. finmarchicus, Microcalanus spp. and Oithona similis dominated. Triconia borealis had very high abundances below the AW layer in May, and in the AW layer in August.
The distribution of medium-sized zooplankton in January was similar to the distribution of small zooplankton in this month, with highest abundances in patches in the surface layer (up to 105 ind. m−3), Figure 7. Relatively high abundances (up to 1,000 ind. m−3) were also observed in the Inflow region along the shelf break, and in a large area below 400 m and between approximately 5.5 and 7.5 °E. The dominating species in the medium size group were C. finmarchicus CII-CIV and Metridia longa (Table 2). In January and May, the areas of low abundances of medium-sized zooplankton coincided with areas in which low abundances of small plankton and particles were observed. In August, the distribution of medium-sized zooplankton seemed to be less uniform than that of the small size group (Figure 7). Lowest abundances were observed in the surface layer in the center of transect D, in wPSW, while highest abundances were observed in the center of transect C.
Large zooplankton was distributed more patchily than the other two size groups (Figure 8). C. finmarchicus CV was by far the dominating copepod in the large size group (Table 2, Figure 9) In January patches of more than 1,000 ind. m−3 were observed in the surface layer, and large zooplankton resided either close to the surface or below 600 m in the region of Uncertain Fate (Figure 8). In May, scattered patches were observed in AW along transect D, while highest abundances were found at the surface in wPSW along transect D and C. Almost all large zooplankton was concentrated in wPSW along transect C in May. The distribution of large zooplankton in August was patchy, but patches (with 100–1,000 ind. m−3) were distributed all along the transects and at all depths (Figure 8). Along transect C in August more patches were observed along the shelf break than farther west.
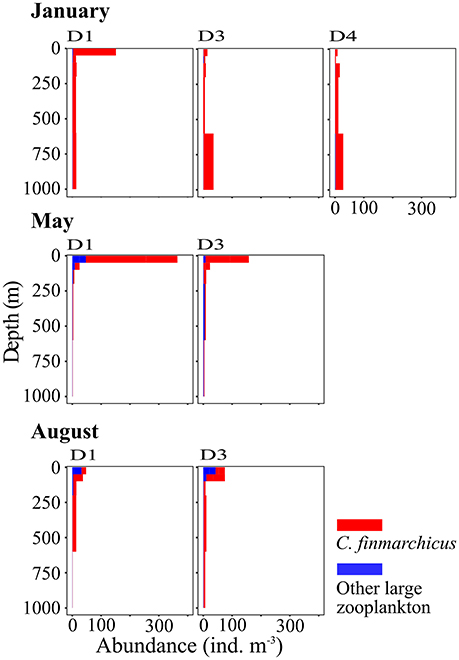
Figure 9. Vertical distribution of large zooplankton, mainly Calanus finmarchicus, at three stations along transect D. Based on data collected by vertical sampling with a MultiNet in January (Top), May (Center), and August (Bottom). See Table 1 for the location of stations.
Zooplankton and Water Transport
Northward water transport across transect D was in the same order of magnitude during all months, but largest in January and lowest in August (Table 3). Across the Inflow region northward transport was roughly 2 Sv during all months, while transport across the Uncertain Fate region was more variable with approx. 3 Sv in January, 2 Sv in May, and 1 Sv in August. Below 700 m depth water transport was generally much lower with ca. 0.1 Sv below the Inflow region and 0.3–0.7 Sv below the Uncertain Fate region. These low transport rates nevertheless have the potential to transport substantial amounts of zooplankton residing at depth during the winter months.
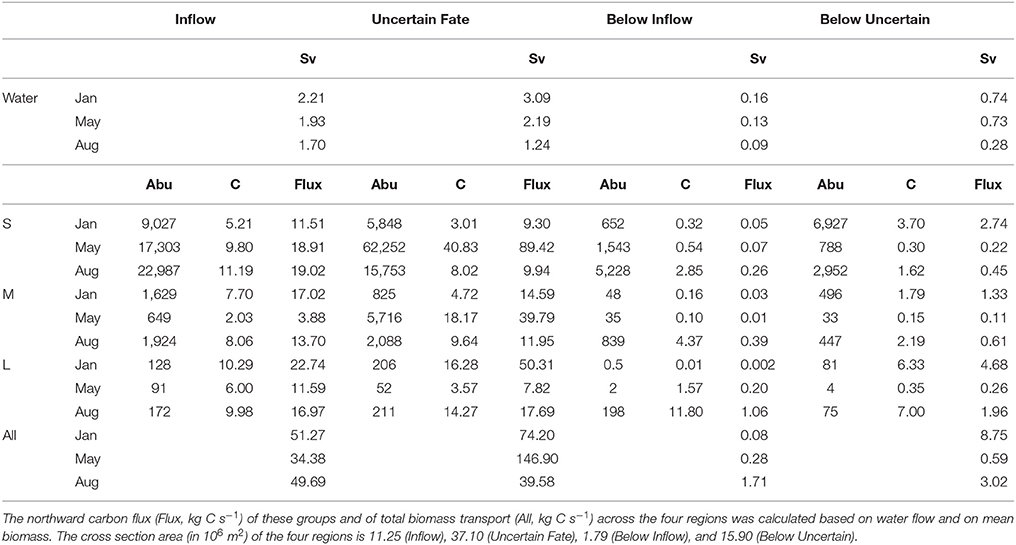
Table 3. Seasonal variation in northward water flux (Sv, 106 m3 s−1) and in mean abundance (Abu, individuals m−3) and biomass (C, mg C m−3) of three zooplankton size groups (small S, medium M, large L) transported across four regions of transect D.
Northward transport of zooplankton across the Inflow region during the different months was more variable than water transport (Table 3). In total about 50 kg C s−1 were transported across the Inflow region in January and August, and are highly likely to reach the Arctic Basin and to impact the ecosystem there. In May the total amount of carbon transported was lower, with about 34 kg C s−1 (Table 3). Additionally, a large but variable amount of carbon was transported northward across the Uncertain Fate region.
About 9,000 individuals m−3 of small zooplankton occurred in the Inflow region in January, mostly Microcalanus spp., Pseudocalanus spp., and Oithona similis (Table 2). This corresponded to a transport of ca. 11 kg C s−1 over the entire Inflow region (Table 3). In May and August about 19 kg C s−1 of small plankton and particles were transported across the Inflow region. The relative contribution of non-zooplankton particles was likely highest at depth, below the Inflow and Uncertain Fate regions, where net samples showed relatively low abundances of small zooplankton, but where the LOPC recorded moderate to high numbers of plankton and particles (Table 2, Figure 6).
Across the Inflow region northward biomass transport of medium-sized zooplankton was lowest in May (ca. 4 kg C s−1), higher in August (ca. 14 kg C s−1) and highest in January (ca. 17 kg C s−1), Table 3. The medium size group consisted mostly of CII-CIV copepodids (Table 2), which in January and May were predominantly CIV, whereas in August they were CIII and CII (data not shown). The average carbon content per individual (mean biomass m−3 divided by mean abundance m−3, Table 3) that was estimated for the medium group was lower in May than in January and August, and abundances were lower in May, resulting in a comparatively low biomass transport in May (Table 3). The high abundances of the dominating C. finmarchicus CIV in the upper layer in January (Table 2), together with the slightly higher average carbon content in this month (Table 3), and the slightly larger water transport compared to August, all resulted in the large transport of medium-sized zooplankton carbon across the Inflow region in winter (Table 3).
The same tendency that was observed for the medium size group was also seen for the large size group. In January, large zooplankton resided in the upper layer, had a relatively high average carbon content and a relatively large water transport was measured. Thus, a high amount of large zooplankton biomass was transported across the Inflow region in January (23 kg C s−1, Table 3). Transport of large plankton across the Inflow region was also relatively high in May and August, 12 and 17 kg C s−1, respectively, Table 3. Substantial amounts of large zooplankton were also transported northward across the Uncertain Fate region, between 4 kg C s−1 in May and 16 kg C s−1 in January (Table 3). Below the Inflow region transport differed by three orders of magnitude between 2 g C s−1 in January and 1 kg C s−1 in August.
Discussion
This study provides the first quantification of abundance and biomass of zooplankton that flows with Atlantic Water (AW) through the Fram Strait into the Arctic Basin (AB). The occurrence of carbon-rich species in the upper 600 m, where northward current velocities were strongest, resulted in large amounts of carbon being transported with the AW across the Inflow region. Furthermore, some of the zooplankton that is transported northward across the Uncertain Fate region may reach the AB, and likely more so in winter than in summer (Koenig et al., 2017). This suggest that the external input of zooplankton carbon, on the order of 34–50 kg C s−1 depending on the season (Table 3), is important for AW-influenced areas of the AB during all seasons, including winter. Below we discuss how the interplay between zooplankton phenology and physical factors influences the advection of zooplankton into the AB (sections Zooplankton Phenology and Implications for Their Advection Toward the AB and Eddy Activity and Zooplankton Transport). Based on our data we perform calculations to relate our estimates of zooplankton input into the AB to observed and modeled zooplankton advection and to Arctic secondary production (sections Advection of the Atlantic Copepod C. finmarchicus to Implications of Advected Biomass for Arctic Productivity and Higher Trophic Levels).
Zooplankton Phenology and Implications for Their Advection Toward the AB
We observed a lower variability in water transport than in zooplankton transport between the months, indicating that zooplankton patchiness and vertical migrations influenced the advected biomass. Zooplankton patchiness is well known (e.g., Trudnowska et al., 2016) and also clearly visible in our data, e.g., when comparing the abundance of large zooplankton between transect D and C in May (Figure 8). This highlights the necessity to sample with high spatial resolution for an increased certainty when quantifying transport. Many species carried out seasonal vertical migrations between the upper 600 m and greater depths below the AW inflow (Table 2). In this study from an open ocean area with bottom depths >2,000 m we observed large and significant variations in vertical distribution of zooplankton between the months, also for those species that were mostly confined to certain depth ranges in the relatively shallow (<500 m) Amundsen Gulf of the Canadian Arctic (Darnis and Fortier, 2014). For example, the abundant, small cyclopoid Triconia borealis occurred mostly below 600 m in January and May, and mostly above 600 m in August. Thus, these copepods were transported rapidly northward in summer, when they stayed in the layer with higher current velocities, compared to winter and spring, when they stayed in the 700–1,000 m layer, where southward currents were observed and where northward transport was very small.
The occurrence of high abundances of C. finmarchicus CV in the upper layer in January contradicts their classic life cycle, which postulates that the copepods overwinter at depths below 600 m from late summer/autumn to early spring (e.g., Edvardsen et al., 2006). Our observations are, however, in line with recent observations from the AW inflow region in January that also show high abundances of C. finmarchicus in the surface layer during winter months (Daase et al., 2014; Berge et al., 2015). It is unclear how universal this observed behavior is, and if C. finmarchicus in this region does overwinter at depth at all, or if they stay in the upper layer throughout autumn and winter. Our data indicate that the copepods might start their downward migration in August, when they were distributed over the entire water column, and might ascend already in December. In January high abundances were observed in the surface layer but also at greater depths. The C. finmarchicus abundances observed in the surface layer in January were comparable to abundances observed elsewhere in its distribution range during summer (Melle et al., 2014).
This unexpected phenology has large impacts on the potential of these dominating copepods being advected into the AB. Ontogenetic migrations may help to maintain populations at the center of their distribution in advective environments (Kimmerer et al., 2014), as we observed southward flow toward the core habitat of C. finmarchicus in the Norwegian Sea at depth. However, the occurrence at the surface would transport C. finmarchicus rapidly into the AB and thereby out of the area where they can complete their life cycle; they would reach the western Nansen Basin within approximately 3 weeks (Hattermann et al., 2016). In a warmer climate zooplankton species might modulate their phenology as a response to temperature (Mackas et al., 2012), and our data are an example showing that slight changes in the phenology, e.g., in the timing of overwintering, can transport populations into habitats with very different abiotic conditions that may or may not be suitable. The Calanus sp. CV that were observed in the upper layer in August may also represent a second generation that could develop under favorable conditions further south (Weydman et al., 2014). This alternative scenario suggests another possible mechanism of increasing advection of zooplankton biomass into the Arctic Basin as a result of climate change.
The data reveal that the amount of zooplankton biomass that is transported into the AB depends strongly on the phenology of the species. If Calanus sp. would follow their classical life cycle and overwinter at depths below the inflowing AW for up to 6 months, as it is observed in its core habitat (Gaardsted et al., 2011), biomass in the Inflow region would be lower than observed during our study. Assuming that Calanus sp. overwinters at depths during 3–4 months would reduce our estimates of its annual transport into the AB by 25–33%.
Uncertainty in the Carbon Estimates
Our carbon estimates are based on a fixed conversion from biovolume to carbon, which is not realistic since carbon content of same-sized plankton varies. Our estimates of carbon flux are thus somewhat uncertain. Changing the conversion ratio by 10% has been modeled to change growth rate estimates based on carbon by 3% (Basedow et al., 2014). At the same time, our data are based on several million data points, compared to traditional sampling that often is limited to <10 stations. The increased certainty due to the large amount of data will therefore ameliorate the increased uncertainty due to a fixed conversion ratio. The LOPC counts all particles, although fragile ones are likely destroyed when towing it. Analyses of the particles showed that in May and August non-zooplankton particles also contributed to the counts in the small size group, especially at greater depths, see section Materials and Methods. Thus, the estimates of carbon transport of the small size group in May and August include both the abundant small zooplankton species, and an unknown fraction of non-zooplankton particles.
Eddy Activity and Zooplankton Transport
The variable current directions that were observed in the Uncertain Fate region during our cruises are consistent with the large eddy activity known in this recirculation region (Hattermann et al., 2016; von Appen et al., 2016; Wekerle et al., 2017). Although we show the northward flux of zooplankton across the Uncertain Fate region in Table 3, this zooplankton biomass may or may not reach the AB (Hattermann et al., 2016; Koenig et al., 2017). Instead, zooplankton in the Uncertain Fate region might remain in recirculating AW, and could also be transported westward toward Greenland (Hattermann et al., 2016). Model simulations have shown that episodic events can transport cod larvae hatched outside the Norwegian coast toward Northeast Greenland, by taking the route with AW northward toward Svalbard and then westward across Fram Strait (Strand et al., 2017). The high abundances of Calanus sp. that were observed also in the Uncertain Fate region could be a potential source of food for these cod larvae on their way toward potential new habitats. Additionally, a potential second generation of C. finmarchicus that develops in concert with the cod larvae might be very favorable for these larvae. Eddy activity was also indicated by the pronounced switches between north- and southward currents (Figure 3). The horizontal distance between these switches matches the size of mesoscale eddies at this latitude very well, as those would typically have a size similar to the local Rossby deformation radius, around 5 km (Nurser and Bacon, 2014). While it is difficult to identify similarly clear signatures of eddies in the hydrography, the combination of downward doming temperature at 4.5 E and upward at 5.5 E in August (Figure 2) is an example that could be associated with a dipole pair of anticyclonic and cyclonic eddies, respectively, centered at those longitudes. The high biomass that we observed in the upper layer in August might result in part from a concentration of copepods in an eddy, instead of a continuous northward flow. This is supported by our observations compared to long-term averages; the shelf break branch of the West Spitsbergen Current (WSC) was much weaker in August 2014 compared to the long-term data. Observed currents that deviate from long-term observations are common, and in January we also observed a weak southward flow in the offshore branch of the WSC, contrary to the climatological northward flow (Figure 5).
Advection of the Atlantic Copepod C. finmarchicus
Based on our data a very rough estimate of an annual C. finmarchicus inflow of about 500,000 metric tons (t) C y−1 through the Fram Strait into the AB can be calculated. This is based on the assumption that the large group consisted exclusively of C. finmarchicus (Figure 9). The average inflow equals then (22.74 + 11.59 + 16.97)/3 ~ = 17 kg C s−1 over the 3 months January, May and August (Table 3). Assuming further that the medium group consisted of 50% C. finmarchicus (Table 2), this results in an average inflow of 0.5 * (17.02 + 3.88 + 13.7)/3 ~ = 5.8 kg C s−1 (Table 3). Combining both (17 + 5.8 = 22.8 kg C s−1), and multiplying by 31.536 million s y−1, this yields 719,020,800 kg C y−1, or roughly 720,000 t C y−1. As stated above, the copepods likely overwinter at depth for 3–5 months (ca. 0.3 y), during which they would stay below the Inflow region. Our estimate for the annual transport would thus be ca. 220,000 t C lower (720,000 t C y−1 * 0.3 y ~ = 222,000 t C), which yields a transport of ca. 500,000 t C y−1. Obviously this is a very rough estimate only, but it gives an idea on the order of magnitude of the amount of C. finmarchicus that is transported from population centers further south toward the AB.
The annual estimate of 500,000 t C y−1 compares very well to modeled advection of C. finmarchicus into the AB. Wassmann et al. (2015) modeled a transport of 1,674 t C d−1, whereas our estimate corresponds to 1,369 t C d−1. However, the model indicates lowest transport rates during winter and peak advection during summer, while we observed similar rates in winter and summer. The model uses the classical life cycle that is known for C. finmarchicus, with long overwintering at depth. This might be refined once we get more seasonal observations and thus a better understanding on the factors that govern the copepods life cycle in Arctic regions.
Annual production estimates of C. finmarchicus range between 75 Mega tons C y−1 for the Nordic Seas to 300 Mt C y−1 for the Norwegian Sea alone, with one Mt = 109 kg (Aksnes and Blindheim, 1996; Skjoldal, 2004). More recently a stock size of 150 Mt C was estimated for the copepod in the Norwegian Sea (Hjøllo et al., 2012). An advection of about 500,000 t C into the AB thus constitutes between 2 and 7 per mille of the annual production or about 3 per mille of the standing stock of C. finmarchicus. Large amounts of C. finmarchicus are also advected with AW into the Barents Sea (Edvardsen et al., 2003; Gluchowska et al., 2017a). Edvardsen et al. (2003) calculated an inflow of about 250,000 t C zooplankton, mainly C. finmarchicus, for the month of June. This is ca. 4 times more than what is advected into the AB, according to our monthly estimate for August.
Advection of the Arctic Copepod C. glacialis
C. glacialis is an Arctic key zooplankton species that is mostly observed in the Arctic shelf seas, where high production rates have been observed (Kosobokova, 1999). Conversely, in the Arctic Basin modeled production of C. glacialis is very low and in fact mostly negative, especially along the Eurasian shelf break (Slagstad et al., 2011). This negative production in the model results when respiration is larger than production, and thus is an indication of advection of biomass from areas with positive production. Based on our data and on the observed biomass of C. glacialis in the Nansen Basin, we can roughly calculate the equivalent biomass of C. glacialis that is advected from the Barents and Kara Seas.
In the Nansen Basin the observed biomass of the Arctic copepod Calanus glacialis is ca. 19% of total mesozooplankton biomass, while the biomass of the Atlantic copepod C. finmarchicus constitutes ca. 9.5% (Kosobokova and Hirche, 2009). Thus, the observed biomass of C. glacialis is nearly twice as large as the biomass of C. finmarchicus in the Nansen Basin. In the AW inflow we observed a clear dominance of C. finmarchicus, and the biomass of C. glacialis ranged between 0.5 and 3.5% (Table 2, Inflow and Uncertain Fate region combined). This implies that the difference between 200% C. glacialis in the Nansen Basin and 0.5–3.5% C. glacialis in the AW inflow either is produced locally or is advected from the Barents and Kara Seas. If we take our estimate of an inflow of 500,000 t C y−1 of C. finmarchicus, and assume that (1) 50% C. finmarchicus biomass is lost on the way to the Nansen Basin (Wassmann et al., 2015) and (2) that local C. glacialis production is negligible, we can calculate the biomass of C. glacialis that is advected from the adjacent shelf seas. This C. glacialis biomass in the Nansen Basin is on the order of 491,250–498,750 t C y−1 (196.5–199.5% of 250,000 t C y−1), with a mean of 495,000 t C y−1, i.e., very similar to the calculated inflow of C. finmarchicus through the Fram Strait. This crude estimate is based on our calculations of the advection of C. finmarchicus and thus has a higher uncertainty; it is also sensitive to the underlying data on C. glacialis and C. finmarchicus biomass in the Nansen Basin (Kosobokova and Hirche, 2009). Our estimate (1,356 t C d−1) compares well to the modeled advection from the Barents Sea of 1,712 t C d−1 (Wassmann et al., 2015). More data on the distribution and local production of C. glacialis in the Nansen Basin will likely refine both our estimate and the model.
Implications of Advected Biomass for Arctic Productivity and Higher Trophic Levels
Data on mesozooplankton production in the AB are scarce making it difficult to compare our data with others, but the observed biomass transport between 12 kg C s−1 (May) and 23 kg C s−1 (January) of large herbivores and similar amounts of smaller zooplankton species certainly is important. To compare, the total allowable catch of Northeast Arctic cod (Gadus morhua) for 2018 is set to 775,000 t (weight, not carbon). This indicates that an advective inflow on the order of 500,000 t C C. finmarchicus with AW through the Fram Strait, plus ca. 500,000 t C C. glacialis from the Barents Sea surely contributes significantly to the marine food web in the Nansen Basin.
The Arctic marine environment is characterized by a pulsed production of zooplankton, which is strongly bottom-up driven and thus coupled to the peak of the primary production (Søreide et al., 2010; Leu et al., 2011; Daase et al., 2013). Recently this view has been challenged based on a high level of biological activity that was observed in an Arctic fjord (Kongsfjorden) in January (Berge et al., 2015). However, this fjord is an advective fjord heavily influenced by AW (Basedow et al., 2004; Pavlov et al., 2013). Our data also show a northward flow of zooplankton carbon with AW in the West Spitsbergen Current during winter when local production presumably is low. This continuous transport might serve as another form of bottom-up forcing of the ecosystem and might in part explain the biological activity that was observed during winter in Kongsfjorden.
Recent observations indicate high abundances of mesopelagic predators during early autumn and winter in the southwestern Nansen basin, where the AW inflow is pronounced (Gjøsæter et al., 2017). Many of the most abundant predators that were observed in this layer are planktivorous, e.g., herring (Clupea harengus), Lion's mane jellyfish (Cyanea capillata) and the carnivorous amphipod Themisto libellula. For these predators the advected zooplankton carbon might be a significant part of their diet, especially in winter. Historically, the southwestern Nansen Basin has been known as an area of high abundances of whales (Falk-Petersen et al., 2014), which might be related to the additional biomass input of zooplankton that serves as food for higher trophic levels.
Conclusion
This study provides the first quantification of abundance and biomass of zooplankton that flows with Atlantic Water through the Fram Strait and into the Arctic Basin. This quantification was possible because seasonal data on zooplankton abundance was combined with concurrent data on ocean current direction and velocity, all collected with high spatial resolution down to 1,000 m. Seasonal variability in zooplankton transport was higher than the variability in water transport, but contrary to our expectations the seasonal variation on the inflow of zooplankton biomass into the Arctic Basin was not pronounced. High abundances of lipid-rich zooplankton species were observed in the core of the Atlantic Water inflow during all seasons, and the advective input presumably far exceeded local production. The phenology of different zooplankton species had a large impact on their advection, exemplified by the unexpected occurrence of C. finmarchicus in the surface layer in January.
Data Availability
The datasets analyzed for this study can be found in the PANGAEA data base in the following data sets:
[Data set] Basedow, S.L. (2017) CarbonBridge January 2014: Zooplankton abundance, biovolume and size structure along transect D crossing the Fram Strait. PANGAEA, https://doi.pangaea.de/10.1594/PANGAEA.879799
[Data set] Basedow, S.L. (2017) CarbonBridge May 2014: Zooplankton abundance, biovolume and size structure along transect D crossing the Fram Strait. PANGAEA, https://doi.pangaea.de/10.1594/PANGAEA.879808
[Data set] Basedow, S.L. (2017) CarbonBridge August 2014: Zooplankton abundance, biovolume and size structure along transect D crossing the Fram Strait. PANGAEA, https://doi.pangaea.de/10.1594/PANGAEA.879805
[Data set] Basedow, S.L. (2017) CarbonBridge May 2014: Zooplankton abundance, biovolume and size structure along transect C crossing the Fram Strait. PANGAEA, https://doi.pangaea.de/10.1594/PANGAEA.879814
[Data set] Basedow, S.L. (2017) CarbonBridge August 2014: Zooplankton abundance, biovolume and size structure along transect C crossing the Fram Strait. PANGAEA, https://doi.pangaea.de/10.1594/PANGAEA.879811
[Data set] Bauerfeind, E., Beszczynska-Möller, A., von Appen, W.-J., Soltwedel, T., Sablotny, B., Lochthofen, N. (2015) Physical oceanography and current meter data from mooring FEVI27 at Hausgarten North. Alfred Wegener Institute, Helmholtz Center for Polar and Marine Research, Bremerhaven, PANGAEA, https://doi.org/10.1594/PANGAEA.845621
[Data set] Bauerfeind, E., Beszczynska-Möller, A., von Appen, W.-J., Soltwedel, T., Sablotny, B., Lochthofen, N. (2015) Physical oceanography and current meter data from mooring FEVI28 at Hausgarten IV. Alfred Wegener Institute, Helmholtz Center for Polar and Marine Research, Bremerhaven, PANGAEA, https://doi.org/10.1594/PANGAEA.845622
[Data set] Halvorsen, E., Kwasniewski, S. (2017) CarbonBridge January 2014: Mesozooplankton species composition and abundance. The Arctic University of Norway, PANGAEA, https://doi.org/10.1594/PANGAEA.881889
[Data set] Halvorsen, E., Kwasniewski, S. (2017) CarbonBridge May 2014: Mesozooplankton species composition and abundance. The Arctic University of Norway, PANGAEA, https://doi.org/10.1594/PANGAEA.881892
[Data set] Halvorsen, E., Kwasniewski, S. (2017) CarbonBridge August 2014: Mesozooplankton species composition and abundance. The Arctic University of Norway, PANGAEA, https://doi.org/10.1594/PANGAEA.881893
[Data set] Randelhoff, A., Sundfjord, A. (2017). Carbon Bridge CTD hydrography 2014. Norwegian Polar Institute. https://doi.org/10.21334/npolar.2017.f40317d5
[Data set] von Appen, W.-J., Beszczynska-Möller, A., Fahrbach, E. (2015) Physical oceanography and current meter data from mooring F3-15. Alfred Wegener Institute, Helmholtz Center for Polar and Marine Research, Bremerhaven, PANGAEA, https://doi.org/10.1594/PANGAEA.853902
[Data set] von Appen, W.-J., Beszczynska-Möller, A., Fahrbach, E. (2015) Physical oceanography and current meter data from mooring F4-15. Alfred Wegener Institute, Helmholtz Center for Polar and Marine Research, Bremerhaven, PANGAEA, https://doi.org/10.1594/PANGAEA.853903
[Data set] von Appen, W.-J., Beszczynska-Möller, A., Fahrbach, E. (2015) Physical oceanography and current meter data from mooring F5-15. Alfred Wegener Institute, Helmholtz Center for Polar and Marine Research, Bremerhaven, PANGAEA, https://doi.org/10.1594/PANGAEA.853904
[Data set] von Appen, W.-J., Beszczynska-Möller, A., Fahrbach, E. (2015) Physical oceanography and current meter data from mooring F7-12. Alfred Wegener Institute, Helmholtz Center for Polar and Marine Research, Bremerhaven, PANGAEA, https://doi.org/10.1594/PANGAEA.853905.
Author Contributions
SB and MR outlined the study. AS collected and interpreted the ship-borne ADCP data. W-JvA was responsible for and interpreted the data from the moored ADCPs. SK and EH analyzed the MultiNet data. SB analyzed the LOPC data, prepared most figures and wrote most of the MS. All authors contributed with text and comments on the whole manuscript and approved the final version.
Funding
This work was funded by the Norwegian Research Council through the project CarbonBridge (project number 226415).
Conflict of Interest Statement
The authors declare that the research was conducted in the absence of any commercial or financial relationships that could be construed as a potential conflict of interest.
Acknowledgments
We thank captain and crew of R/V Helmer Hanssen for their helpful cooperation, and the engineers from UiT for skillful support. B. Rudels is thanked for input on the clarification of water masses. Thanks to Achim Randelhoff and Sebastian Menze for processing of the ADCP data. Zooplankton photographs were taken by Malin Daase, Coralie Barth-Jensen, and SK. We thank Erin Kunisch for language editing.
Supplementary Material
The Supplementary Material for this article can be found online at: https://www.frontiersin.org/articles/10.3389/fmars.2018.00194/full#supplementary-material
References
Aksnes, D. L., and Blindheim, J. (1996). Circulation patterns in the North Atlantic and possible impact on population dynamics of Calanus finmarchicus. Ophelia 44, 7–28. doi: 10.1080/00785326.1995.10429836
Basedow, S. L., Eiane, K., Tverberg, V., and Spindler, M. (2004). Advection of zoopankton in an Arctic fjord (Kongsfjorden, Svalbard). Estuar. Coast. Shelf Sci. 60, 113–124. doi: 10.1016/j.ecss.2003.12.004
Basedow, S. L., Tande, K. S., Norrbin, M. F., and Kristiansen, S. (2013). Capturing quantitative zooplankton information in the sea: performance test of laser optical plankton counter and video plankton recorder in a Calanus finmarchicus dominated summer situation. Prog. Oceanogr. 108, 72–80. doi: 10.1016/j.pocean.2012.10.005
Basedow, S. L., Zhou, M., and Tande, K. S. (2014). Secondary production at the Polar Front, Barents Sea, August 2007. J. Mar. Syst. 130, 147–159. doi: 10.1016/j.jmarsys.2013.07.015
Berge, J., Daase, M., Renaud, P. E., Ambrose, W. G., Darnis, G., Last, K. S., et al. (2015). Unexpected levels of biological activity during the polar night offer new perspectives on a warming Arctic. Curr. Biol. 25, 2555–2561. doi: 10.1016/j.cub.2015.08.024
Beszczynska-Möller, A., Fahrbach, E., Schauer, U., and Hansen, E. (2012). Variability in Atlantic water temperature and transport at the entrance to the Arctic Ocean, 1997 – 2010. ICES J. Mar. Sci. 69, 852–863. doi: 10.1093/icesjms/fss056
Beszczynska-Möller, A., von Appen, W.-J., and Fahrbach, E. (2015). Physical oceanography and current meter data from moorings F1-F14 and F15/F16 in the Fram Strait, 1997-2012. PANGAEA. doi: 10.1594/PANGAEA.150016
Beszczynska-Möller, A., Woodgate, R. A., Lee, C., Melling, H., and Karcher, M. (2011). A synthesis of exchanges through the main oceanic gateways to the Arctic Ocean. Oceanography 24, 82–99. doi: 10.5670/oceanog.2011.59
Blachowiak-Samolyk, K., Kwasniewski, S., Dmoch, K., Hop, H., and Falk-Petersen, S. (2007). Trophic structure of zooplankton in the Fram Strait in spring and autumn 2003. Deep-Sea Res. II 54, 2716–2728. doi: 10.1016/j.dsr2.2007.08.004
Blachowiak-Samolyk, K., Wiktor, J. M., Hegseth, E. N., Wold, A., Falk-Petersen, S., and Kubiszyn, A. M. (2015). Winter tales: the dark side of planktonic life. Polar. Biol. 38, 23–36. doi: 10.1007/s00300-014-1597-4
Bluhm, B., Kosobokova, K., and Carmack, E. (2015). A tale of two basins: an integrated physical and biological perspective of the deep Arctic Ocean. Prog. Oceanogr. 139, 89–121. doi: 10.1016/j.pocean.2015.07.011
Daase, M., Falk-Petersen, S., Varpe, Ø., Darnis, G., Søreide, J. E., Wold, A., et al. (2013). Timing of reproductive events in the marine copepod Calanus glacialis: a pan-Arctic perspective. Can. J. Fish. Aquat. Sci. 70, 871–884. doi: 10.1139/cjfas-2012-0401
Daase, M., Varpe, Ø., and Falk-Petersen, S. (2014). Non-consumptive mortality in copepods: occurrence of Calanus spp. Carcasses in the Arctic Ocean during winter. J. Plankton Res. 36, 129–144. doi: 10.1093/plankt/fbt079
Darnis, G., and Fortier, L. (2014). Temperature, food and the seasonal vertical migration of key arctic copepods in the thermally stratified Amundsen Gulf (Beaufort Sea, Arctic Ocean). J. Plankton Res. 36, 1092–1108. doi: 10.1093/plankt/fbu035
Edvardsen, A., Tande, K. S., and Slagstad, D. (2003). The importance of advection on production of Calanus finmarchicus in the Atlantic part of the Barents Sea. Sarsia 88, 261–273. doi: 10.1080/00364820310002254
Edvardsen, A., Pedersen, J. M., Slagstad, D., Semenova, T., and Timonin, A. (2006). Distribution of overwintering Calanus in the North Norwegian. Ocean Sci. 2, 87–96. doi: 10.5194/os-2-87-2006
Espinasse, B., Basedow, S., Schultes, S., Zhou, M., Berline, L., and Carlotti, F. (2017). Conditions for assessing zooplankton abundance with LOPC in coastal waters. Prog. Oceanogr. 163, 260–270. doi: 10.1016/j.pocean.2017.10.012
Falk-Petersen, S., Pavlov, V., Berge, J., Cottier, F., Kovacs, K. M., and Lydersen, C. (2014). At the rainbow's end: high productivity fueled by winter upwelling along an Arctic shelf. Polar Biol. 38, 5–11. doi: 10.1007/s00300-014-1482-1
Gaardsted, F., Tande, K. S., and Pedersen, O. P. (2011). Vertical distribution of overwintering Calanus finmarchicus in the NE Norwegian Sea in relation to hydrography. J. Plankton Res. 33, 1477–1486. doi: 10.1093/plankt/fbr042
Gjøsæter, H., Wiebe, P. H., Knutsen, T., and Ingvaldsen, R. B. (2017). Evidence of diel vertical migration of mesopelagic sound-scattering organisms in the Arctic. Front. Mar. Sci. 4:332. doi: 10.3389/fmars.2017.00332
Gluchowska, M., Dalpadado, P., Beszczynska-Möller, A., Olszewska, A., Ingvaldsen, R. B., and Kwasniewski, S. (2017a). Interannual zooplankton variability in the main pathways of the Atlantic water flow into the Arctic Ocean (Fram Strait and Barents Sea branches). ICES J. Mar. Sci. 74, 1921–1936. doi: 10.1093/icesjms/fsx033
Gluchowska, M., Trudnowska, E., Goszczko, I., Kubiszyn, A. M., Blachowiak-Samolyk, K., Walczowski, W., et al. (2017b). Variations in the structural and functional diversity of zooplankton over vertical and horizontal environmental gradients en route to the Arctic Ocean through the Fram Strait. PLoS ONE 12:e0171715. doi: 10.1371/journal.pone.0171715
Hattermann, T., Isachsen, P. E., von Appen, W., Albretsen, J., and Sundfjord, A. (2016). Eddy-driven recirculation of Atlantic Water in Fram Strait. Geophys. Res. Lett. 43, 3406–3414. doi: 10.1002/2016GL068323
Hegseth, E., and Sundfjord, A. (2008). Intrusion and blooming of Atlantic phytoplankton species in the high Arctic. J. Mar. Sys. 74, 108–119. doi: 10.1016/j.jmarsys.2007.11.011
Herman, A. W., Beanlands, B., and Phillips, E. F. (2004). The next generation of Optical Plankton Counter: the Laser-OPC. J. Plankton Res. 26, 1135–1145. doi: 10.1093/plankt/fbh095
Herman, A. W., Beanlands, B., Chin-Yee, M., Furlong, A., Snow, J., Young, S., et al. (1998). The Moving Vessel Profiler (MVP): in-situ sampling of plankton and physical parameters at 12 kts and integration of a new laser optical plankton counter. Oceanology 98, 123–135.
Hirche, H., Baumann, M. E. M., Kattner, G., and Gradinger, R. (1991). Plankton distribution and the impact of copepod grazing on primary production in Fram Strait, Greenland Sea. J. Mar. Sys. 2, 477–494.
Hirche, H.-J., and Kosobokova, K. (2007). Distribution of Calanus finmarchicus in the northern North Atlantic and Arctic Ocean—Expatriation and potential colonization. Deep-Sea Res. II 54, 2729–2747. doi: 10.1016/j.dsr2.2007.08.006
Hjøllo, S. S., Huse, G., Skogen, M. D., and Melle, W. (2012). Modelling secondary production in the Norwegian Sea with a fully coupled physical/primary production/individual-based Calanus finmarchicus model system. Mar. Biol. Res. 8, 508–526. doi: 10.1080/17451000.2011.642805
Hunt, G. L., Drinkwater, K. F., Arrigo, K., Berge, J., Daly, K. L., Danielson, S., et al. (2016). Advection in polar and sub-polar environments: impacts on high latitude marine ecosystems. Prog. Oceanogr. 149, 40–81. doi: 10.1016/j.pocean.2016.10.004
IPCC (2014). Climate Change 2014: Synthesis Report. Contribution of Working Groups, I., II and III to the Fifth Assessment Report of the Intergovernmental Panel on Climate Change [Core Writing Team, R.K. Pachauri and L.A. Meyer (eds.)]. IPCC, Geneva, Switzerland, 151 pp.
Kimmerer, W. J., Gross, E. S., and MacWilliams, M. L. (2014). Tidal migration and retention of estuarine zooplankton investigated using a particle-tracking model. Limnol. Oceanogr. 59, 901–916. doi: 10.4319/lo.2014.59.3.0901
Koenig, Z., Provost, C., Sennéchael, N., and Gascard, J.-C. (2017). The Yermak Pass Branch: a major pathway for the atlantic water north of svalbard? J. Geophys. Res. Oceans 122, 9332–9349. doi: 10.1002/2017JC013271
Kosobokova, K. (1999). Reproductive cycle and life history of the Arctic copepod Calanus glacialis in the White Sea. Polar Biol. 22, 254–263. doi: 10.1007/s003000050418
Kosobokova, K., and Hirche, H.-J. (2009). Biomass of zooplankton in the eastern Arctic Ocean – A base line study. Prog. Oceanogr. 82, 265–280. doi: 10.1016/j.pocean.2009.07.006
Kosobokova, K. N., Hopcroft, R. R., and Hirche, H.-J. (2011). Patterns of zooplankton diversity through the depths of the Arctic's central basins. Mar. Biodiv. 41, 29–50. doi: 10.1007/s12526-010-0057-9
Kraft, A., Nöthig, E.-M., Bauerfeind, E., Wildish, D. J., Pohle, G. W., Bathmann, U. V., et al. (2013). First evidence of reproductive success in a southern invader indicates possible community shifts among Arctic zooplankton. Mar. Ecol. Prog. Ser. 493, 291–296. doi: 10.3354/meps10507
Kwasniewski, S., Hop, H., Falk-Petersen, S., and Pedersen, G. (2003). Distribution of Calanus species in Kongsfjorden, a glacial fjord in Svalbard. J. Plankton Res. 25, 1–20. doi: 10.1093/plankt/25.1.1
Leu, E., Søreide, J. E., Hessen, D. O., Falk-Petersen, S., and Berge, J. (2011). Consequences of changing sea ice cover for primary and secondary producers in European Arctic shelf seas: timing, quantity and quality. Prog Oceanogr 90, 18–32. doi: 10.1016/j.pocean.2011.02.004
Mackas, D. J., Greve, W., Edwards, M., Chiba, S., Tadokoro, K., Eloire, D., et al. (2012). Changing zooplankton seasonality in a changing ocean: comparing time series of zooplankton phenology. Prog. Oceanogr. 97–100, 31–63. doi: 10.1016/j.pocean.2011.11.005
Marnela, M., Rudels, B., Goszczko, I., Beszczynska-Möller, A., and Schauer, U. (2016). Fram strait annd Greenland Sea transport, water masses, and water mass transformations 1999-2010 and beyond. J. Geophys. Res. Oceans 121, 2314–2346. doi: 10.1002/2015JC011312
Melle, W., Runge, J., Head, E., Plourde, S., Castellani, C., Licandro, P., et al. (2014). The North Atlantic Ocean as habitat for Calanus finmarchicus: Environmental factors and life history traits. Prog. Oceanogr. 129, 244–284. doi: 10.1016/j.pocean.2014.04.026
Metfies, K., von Appen, W.-J., Kilias, E., Nicolaus, A., and Nöthig, E.-M. (2016). Biogeography and photosynthetic biomass of Arctic marine pico-eukaryotes during summer of the record sea ice minimum 2012. PLoS ONE 11:e0148512. doi: 10.1371/journal.pone.0148512
Mumm, N. (1993). Composition and distribution of mesozooplankton in the Nansen Basin, Arctic Ocean, during summer. Polar Biol. 13, 51–461. doi: 10.1007/BF00233136
Niehoff, B., and Hirche, H.-J. (2000). The reproduction of Calanus finmarchicus in the Norwegian Sea in spring. Sarsia 85, 15–22. doi: 10.1080/00364827.2000.10414552
Nöthig, E.-M., Bracher, A., Engel, A., Metfies, K., Niehoff, B., Peeken, I., et al. (2015). Summertime plankton ecology in Fram Strait a compilation of long- and short-term observations. Polar Res. 34:23349. doi: 10.3402/polar.v34.23349
Nurser, A. J. G., and Bacon, S. (2014). The rossby radius in the Arctic Ocean. Ocean Sci. 10, 967–975. doi: 10.5194/os-10-967-2014
Ohman, M. D., Powell, J. R., Picheral, M., and Jensen, D. W. (2012). Mesozooplankton and particulate matter responses to a deep-water frontal system in the southern California Current System. J. Plankton Res. 34, 815–827. doi: 10.1093/plankt/fbs028
Olli, K., Wassmann, P., Reigstad, M., Ratkova, T. N., Arashkevich, E., Pasternak, A., et al. (2007). The fate of production in the central Arctic Ocean – top–down regulation by zooplankton expatriates? Prog. Oceanogr. 72, 84–113. doi: 10.1016/j.pocean.2006.08.002
Onarheim, I. H., Smedsrud, L. H., Ingvaldsen, R. B., and Nilsen, F. (2014). Loss of sea ice during winter north of Svalbard. Tellus A 66:23933. doi: 10.3402/tellusa.v66.23933
Overland, J. E., and Wang, M. (2013). When will the summer Arctic be nearly sea ice-free? Geophys. Res. Lett. 40, 2097–2101. doi: 10.1002/grl50316
Padman, L., and Erofeeva, S. Y. (2004). A barotropic inverse tidal model for the Arctic Ocean. Geophys. Res. Lett. 31, 2–5. doi: 10.1029/2003GL019003
Pavlov, A. K., Tverberg, V., Ivanov, B. V., Nilsen, F., Falk-Petersen, S., and Granskog, M. (2013). Warming of Atlanic water in two west Spitsbergen fjords over the last century (1912 to 2009). Polar Res. 32:11206. doi: 10.3402/polar.v32i0.11206
Polyakov, I. V., Pnyushkov, A. V., and Timokhov, L. A. (2012). Warming of the Intermediate Atlantic Water of the Arctic Ocean in the 2000s. J. Clim. 25, 8362–8370. doi: 10.1175/JCLI-D-12-00266.1
Postel, L. (2000). “Biomass and abundance,” in ICES Zooplankton Methodology Manual, eds R. Harris, P. Wiebe, J. Lenz, H. R. Skjoldal and M. Huntley (London: Academic Press), 83–192
Randelhoff, A., Reigstad, M., Chierici, M., Sundfjord, A., Ivanov, V., Cape, M., et al. (this issue). Seasonality of the Physical Biogeochemical Hydrography of the Fram Strait iBranch. Frontiers Mar. Sci.
Rudels, B., Björk, G., Nilsson, J., Winsor, P., Lake, I., and Nohr, C. (2005). The interaction between the waters from the Arctic Ocean and the Nordic Seas north of Fram Strait and along the East Greenland Current: results from the Arctic Ocean O2 Oden expedition. J. Mar. Sys. 55, 1–30. doi: 10.1016/j.jmarsys.2004.06.008
Schultes, S., and Lopes, R. M. (2009). Laser optical plankton counter and zooscan intercomparison in tropical and subtropical marine ecosystems. Limnol. Oceanogr. Methods 7, 771–784. doi: 10.4319/lom.2009.7.771
Slagstad, D., Ellingsen, I. H., and Wassmann, P. (2011). Evaluating primary and secondary production in an Arctic Ocean void of summer sea ice: an experimental simulation approach. Prog. Oceanogr. 90, 117–131. doi: 10.1016/j.pocean.2011.02.009
Søreide, J. E., Leu, E., Berge, J., Graeve, M., and Falk-Petersen, S. (2010). Timing of blooms, algal food quality and Calanus glacialis reproduction and growth in a changing Arctic. Glob. Change Biol. 16, 3154–3163. doi: 10.1111/j.1365-2486.2010.02175.x
Spielhagen, R. F., Werner, K., Sørensen, S. A., Zamelczyk, K., Kandiano, E., Budeus, G., et al. (2011). Enhanced modern heat transfer to the Arctic by warm Atlantic Water. Science 331, 450–453. doi: 10.1126/science.1197397
Strand, K. O., Sundby, S., Albretsen, J., and Vikebø, F. B. (2017). The Northeast Greenland shelf as a potential habitat ofr the Northeast Arctic Cod. Front. Mar. Sci. 4:304. doi: 10.3389/fmars.2017.00304
Svensen, C., Seuthe, L., Vasilyeva, Y., Pasternak, A., and Hansen, E. (2011). Zooplankton distribution across Fram Strait in autumn: are small copepods and protozooplankton important? Prog. Oceanogr. 91, 534–544. doi: 10.1016/j.pocean.2011.08.001
Trudnowska, E., Gluchowska, M., Beszczynska-Möller, A., Blachowiak-Samolyk, K., and Kwasniewski, S. (2016). Plankton patchiness in the Polar Front region of the West Spitsbergen Shelf. Mar. Ecol. Prog. Ser. 560, 1–18. doi: 10.3354/meps11925
von Appen, W.-J., Schauer, U., Hattermann, T., and Beszczynska-Möller, A. (2016). Seasonal cycle of mesoscale instability of the West Spitsbergen current. J. Phys. Oceanogr. 46, 1231–1254. doi: 10.1175/JPO-D-15-0184.1
Wassmann, P., Kosobokova, K. N., Slagstad, D., Drinkwater, K. F., Hopcroft, R. R., Moore, S. E., et al. (2015). The contiguous domains of Arctic Ocean advection: trails of life and death. Prog. Oceanogr. 139, 42–65. doi: 10.1016/j.pocean.2015.06.011
Wekerle, C., Wang, Q., von Appen, W.-J., Danilov, S., Schourup-Kristensen, V., and Jung, T. (2017). Eddy-resolving simulation of the Atlantic Water reciruculation in Fram Strait with focus on the seasonal cycle. J. Geophys. Res. 122, 8385–8405. doi: 10.1002/2017JC012974
Weydman, A., Carstensen, J., Goszczko, I., Dmoch, K., Olszewska, A., and Kwasniewski, S. (2014). Shift towards the dominance of boreal species in the Arctic: inter-annual and spatial zooplankton variability in the West Spitsbergen Current. Mar. Ecol. Prog. Ser. 501, 41–52. doi: 10.3354/meps10694
Wu, D., Zhou, M., Pierce, S. D., Barth, J. A., and Cowles, T. (2014). Zooplankton distribution and transport in the California Current off Oregon. Mar. Ecol. Prog. Ser. 508, 87–103. doi: 10.3354/meps10835
Keywords: advection, West Spitsbergen current, mesozooplankton, laser optical plankton counter, Atlantic Water, seasonal, Arctic Ocean, winter
Citation: Basedow SL, Sundfjord A, von Appen W-J, Halvorsen E, Kwasniewski S and Reigstad M (2018) Seasonal Variation in Transport of Zooplankton Into the Arctic Basin Through the Atlantic Gateway, Fram Strait. Front. Mar. Sci. 5:194. doi: 10.3389/fmars.2018.00194
Received: 11 December 2017; Accepted: 14 May 2018;
Published: 04 June 2018.
Edited by:
Alberto Basset, University of Salento, ItalyReviewed by:
Daria Martynova, Zoological Institute (RAS), RussiaMario Barletta, Universidade Federal de Pernambuco (UFPE), Brazil
Copyright © 2018 Basedow, Sundfjord, von Appen, Halvorsen, Kwasniewski and Reigstad. This is an open-access article distributed under the terms of the Creative Commons Attribution License (CC BY). The use, distribution or reproduction in other forums is permitted, provided the original author(s) and the copyright owner are credited and that the original publication in this journal is cited, in accordance with accepted academic practice. No use, distribution or reproduction is permitted which does not comply with these terms.
*Correspondence: Sünnje L. Basedow, sunnje.basedow@uit.no