Meter-Scale Early Diagenesis of Organic Matter Buried Within Deep-Sea Sediments Beneath the Amazon River Plume
 Lauren S. Chong
 William M. Berelson
 James McManus
 Nick E. Rollins1
- 1Department of Earth Sciences, University of Southern California, Los Angeles, CA, United States
- 2College of Earth, Ocean, and Atmospheric Sciences, Oregon State University, Corvallis, OR, United States
- 3Bigelow Laboratory for Ocean Sciences, East Boothbay, ME, United States
Gravity cores and multi-cores were collected from the Demerara Abyssal plain to examine meter-scale downcore features of early diagenesis in the sediments and relate them to the location of the Amazon River plume in the North Atlantic Ocean. At all sites, the oxygen penetration depth, inferred from nitrate and dissolved manganese profiles, was ~10–20 cm and nitrate was depleted within ~50 cm. However, most of the cores also had a secondary nitrate maximum (4–13 μM) at ~50 cm, at a location where we observed changes in gradients of dissolved manganese, iron, and ammonium. Although there is spatial heterogeneity in the profile behavior across the study, we do find subtle diagenetic profile patterns that occur in sediments in relation to their position below the Amazon plume. Dissolved silica profiles show an initial increase downcore, but then all show a decrease to depths of 30–100 cm, thereafter concentrations increase. We suggest this zone of silica uptake is due to reverse weathering processes, possibly involving iron oxidation. A semi-lithified iron crust appeared at nearly all sites, and its position is relict, likely an indicator of the transition from glacial to interglacial sediments.
Introduction
Of all the organic material produced by primary production in the surface ocean, only a small fraction settles on the sea floor, depositing ~17% on the upper slopes, but <1% in the deep (>3,500 m), open ocean (Wollast, 1998). When organic matter reaches the ocean floor, it is subjected to a variety of mineralization processes. Marine sediments record the sequence of these degradation processes in the shape and positioning of dissolved oxidant and metabolite profiles in pore waters (Froelich et al., 1979; Goloway and Bender, 1982; Jahnke et al., 1982; Heggie et al., 1987). In the upper mm's and cm's of the sediment column, organic matter is most plentiful, macrofauna and microbiota are most abundant, and it is a short distance for solutes to diffuse into the overlying water column. The suite of reactions occurring in these sediments is termed “early diagenesis.” A few meters down, the reaction rates in pore waters presumably are much slower, yet we don't know much about what reactions occur at these depths, much less the microbial communities driving them, since multi- and box cores obtained for pore water analysis are not usually longer than 50 cm.
The outflow of the Amazon River forms a plume of low salinity (<36 ppt) water that extends to the northwest over the north Brazilian continental shelf and then passes over the Demerara Slope and Abyssal Plain. These waters can be traced northwest to the Caribbean (Neumann, 1969; Froelich et al., 1979; Lentz, 1995; Smith and DeMaster, 1996; Goes et al., 2013), as well as eastward into the eastern North Atlantic due to the seasonal retroflection of the North Brazil Current (Muller-Karger et al., 1988), dispensing 1.2 × 10⁹ tons year−1 of suspended sediment (Meade et al., 1985). The majority of work on marine sediments in the area of the Amazon Plume has been limited to the river mouth and the adjacent continental shelf (Kuehl et al., 1986, 1996; DeMaster et al., 1996; Geyer et al., 1996; Kineke et al., 1996; Nittrouer and DeMaster, 1996; Keil et al., 1997; Aller, 1998, 2004; Blair et al., 2004; Aller and Blair, 2006; Figueiredo et al., 2009; Hoorn et al., 2010, 2017). Our work includes sites 500–1,200 km away from the Amazon River mouth and focuses primarily on deep-sea (>4,000 m) sites in the open ocean. Here, we examine the downcore patterns of pore water and biogenic solid phase constituents in sediments in the Western North Atlantic Ocean throughout the Amazon River plume region that were obtained by gravity coring.
Long cores have previously been studied from sites on the Amazon Fan (~5.14°N, 46.58°W), however these sites were in an area that currently experiences little influence from the modern river plume (Schulz et al., 1994). In that study, pore waters revealed that the zone extends to ~40 cm into the sediments, reflecting the relatively low Corg input during the Holocene, and profiles of dissolved metals were found to be closely related to both the degradation of organic matter and Fe oxides contained within Glacial-aged sediments (Schulz et al., 1994).
Throughout the Demerara Abyssal Slope and Plain, sedimentation rates are fairly uniform at 2–4 cm kyr−1 (Damuth, 1977; Chong et al., 2016), Corg remineralization rates vary from 0.16 to 1.92 mmol m−2 d−1 throughout the region (Chong et al., 2014). Chong et al. (2014) previously discussed the degradation of Corg over the length scale of a multi-core, 30–50 cm, where Corg degradation is dominated by oxygen and . Here we use the longer depth scale of gravity cores to examine the diagenetic zonation deeper in the sediments and explore what suboxic and possibly anoxic processes may occur at depth. Multi-cores from the same stations were used to assemble geochemical profiles connecting the gravity core data to the SWI and to correct for the core-top loss occurring from gravity core collection (Lebel et al., 1982). Further, we used determinations of diffusive fluxes to attempt to constrain mass balances and stoichiometric relationships of various reactions. Our objective was to expand on previously reported spatial patterns of early diagenesis (Chong et al., 2014) and define changes in sediment composition representing glacial/early Holocene sedimentation.
Materials and Methods
Seven gravity cores were collected aboard the R/V Melville in 2011 as part of the ANACONDAS (Amazon iNfluence on the Atlantic: CarbOn export from Nitrogen fixation by DiAtom Symbioses) project (Figure 1, Table 1). Six of these stations also had multi-cores collected at the same station. Station 29 did not have a corresponding multi-core collected, and so data from the next nearest station (28) was used for comparison to the gravity core. Upon recovery, the gravity cores were placed upright on the deck of the ship and secured for immediate processing. After measuring the overall core length, the overlying water (OLW) was drained from the core tube. Holes were drilled below the core top at 10 cm intervals for the first 5 samples, and then at 20 cm intervals thereafter. Rhizon soil samplers (Rhizosphere Research Products) were used to extract pore waters directly into acid cleaned plastic syringes with polyethylene plungers (20 ml Norm-Ject). Overall sample volume varied between 5 and 20 mL, which were split into separate samples bottles for subsequent analysis of dissolved Mn+2 and Fe+2, , and Si(OH)4.
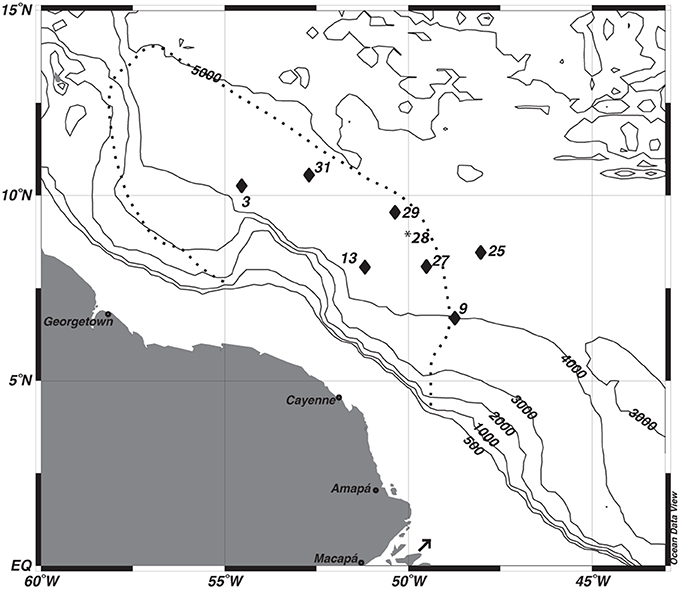
Figure 1. Map of study sites. *The multi-core data from station 28 was used to correct the depth assignments of the gravity core from station 29. The dashed line depicts the general location of Amazon River Plume during peak outflow. The arrow indicates the location of the Amazon River mouth.
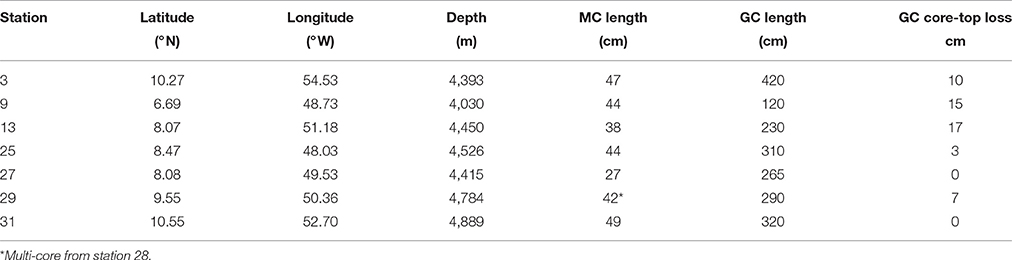
Table 1. Site descriptions and lengths of Multi-Cores (MC) and Gravity Cores (GC).
At stations 25, 27, 29, and 31, porosity samples were taken from 5 to 6 depths throughout the length of the gravity core by drilling a 1.5 cm diameter hole into the core tube and extracting mud with a clean spatula. Depths were chosen to achieve an even distribution of samples throughout the length of the core. An aliquot of mud from each interval was collected in a pre-weighed glass container and used to determine the porosity by weight loss after drying. Dried sediment was subsequently ground to a fine powder for solid phase analyses. After collecting the pore waters, the gravity core was packaged for transport back to the lab.
Dissolved Si(OH)4 was analyzed shipboard on a flow-through spectrophotometer following Chong et al. (2014) (analytical uncertainty for standard replicates was < ±6%). There is a 2.5% increase in silicic acid concentration per °C above in situ temperatures (McManus et al., 1995). We measured the temperature of the OLW of each gravity core using a temperature probe, and continued to measure the temperature as the core warmed over time during sample collection. To correct our samples for warming, we took the midpoint of the total collection time and assumed an average temperature correction based on a plot of temperature vs. time. The midpoint temperature was generally elevated by ~4°C above the ambient temperature. The uncertainty in temperature correction may add up to a 10% uncertainty for the dissolved Si values.
Nitrate was analyzed on 100 μL samples using a Teledyne NOx box with a chemiluminescence detector (Braman and Hendrix, 1989; Mortazavi, 2012). The detection limit for was 0.1 μM. Uncertainty in replicate standards and samples averaged ~ 3%.
Ammonium was analyzed shipboard fluorometrically using the orthophthaldialdehyde (OPA) method (protocol B) described by Holmes et al. (1999). Analyses were completed on a Turner Designs Trilogy Fluorometer equipped with an detection module. Uncertainty in replicate standards averaged ~6.5%.
Analyses for dissolved metals were performed either on a Thermo Elemental X-Series II ICP-MS or a Leeman Labs Prodigy ICP-OES at Oregon State University. Samples were acidified with trace metal clean HCl to pH ~2 prior to analysis. Standards were matrix matched using either Chelexed seawater or a trace element clean artificial seawater mixture. The detection limit over the different runs ranged from 0.19 to 3.6 μM for Mn, and from 0.16 to 4.8 μM for Fe. Analysis of CASS5 Seawater Reference Material on the ICP-MS obtained an Mn value of 45.37 ± 0.7 (n1/410) compared to the standard value of 47.77 ± 1.8. Sample uncertainties are based on the standard error of the regression and the uncertainty based on the standard deviation of the replicate analyses performed during the run. We combine these two uncertainties as the square root of the sum of squares.
At stations 13 and 31, wt% and δ13C of solid phase inorganic carbon (TIC) were determined by acidification of 40–70 mg of sediment and analysis of the evolved CO2 with a Picarro G2121-i isotopic CO2 analyzer following Subhas et al. (2015) and Chong et al. (2016). Sediment samples from station 13 were also analyzed for Total C content (TC) using an Elantech 1110 Elemental Analyzer (EA) connected to the Picarro, and Corg was determined by the difference between TC and TIC.
The depths of the gravity cores were adjusted to “true depth” by matching the pore water profiles from the gravity cores of all four constituents [, Si(OH)4, Mn+2, and Fe+2] as well as by using profiles of magnetic susceptibility measurements on the solid phase (Mortazavi, 2012). For the pore waters, the depth was adjusted until the best agreement between the multi-core profiles and gravity core profiles was found. As an additional check of our correlation between multi-cores and gravity cores, 8 magnetic susceptibility “features” observed in the sediment profiles were used for depth correlation (Mortazavi, 2012).
Results
All data that presented here, as well as additional unpublished data, is available in tabular form in Chong (2013) and on the ANACONDAS data repository web site (http://www.bco-dmo.org/project/2097).
Porosity
The porosity measured from the gravity cores at stations 25, 27, 29, and 31 had values ranging from 0.64 to 0.85 across all four cores (Table 2). The mean porosity at each station was 0.72, 0.79, 0.78, and 0.81 respectively and there was little change downcore. Since porosity was not directly measured at stations 3, 9, and 13, we took the porosity data measured from the multi-cores, selecting the deepest few depths that overlapped with the gravity core depths (Chong, 2013), and used this data for the subsequent flux calculations.
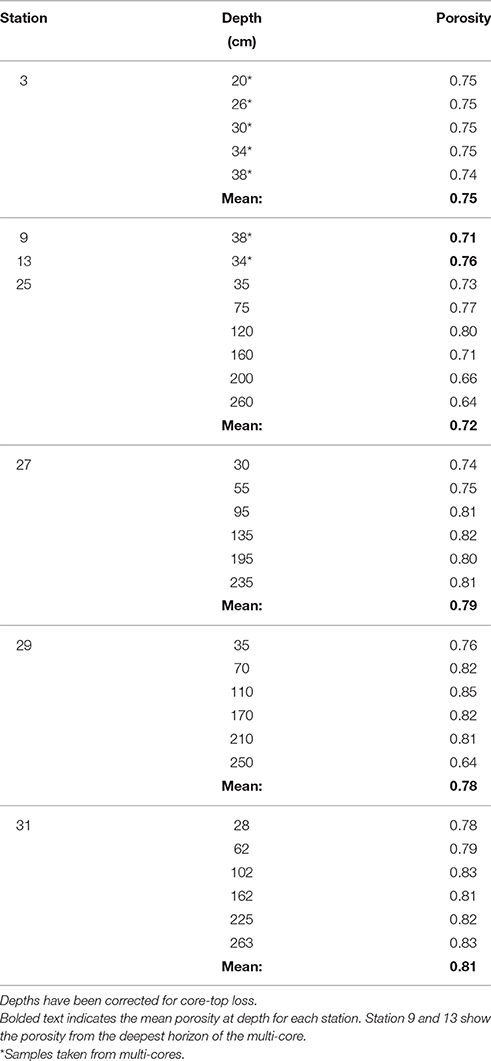
Table 2. Gravity core porosity.
Pore Water Analyses
The multi-core pore water profiles have been discussed extensively in Chong et al. (2014); here we combine these data with the additional gravity core pore water data in combined profiles. All profiles showed an increase just below the SWI to a maximum ranging from 20 to 35 μM (Figures 2A,E,I,M,Q,U,Y). Bottom waters in this region are 20–25 μM. The depth of the maximum ranged from 2 to 10 cm. Below this maximum, concentrations decreased, reaching near-zero values at a depths of 10–40 cm. Few gravity core profiles showed values of zero at depth, but the value measured was generally <2 μM. We attribute this non-zero value to an artifact of some oxidation during sampling. All of the stations, except station 9, had a secondary (4–14 μM) peak that appeared at a depth between 50 and 60 cm. As discussed below, we believe that this peak is not a sampling artifact.
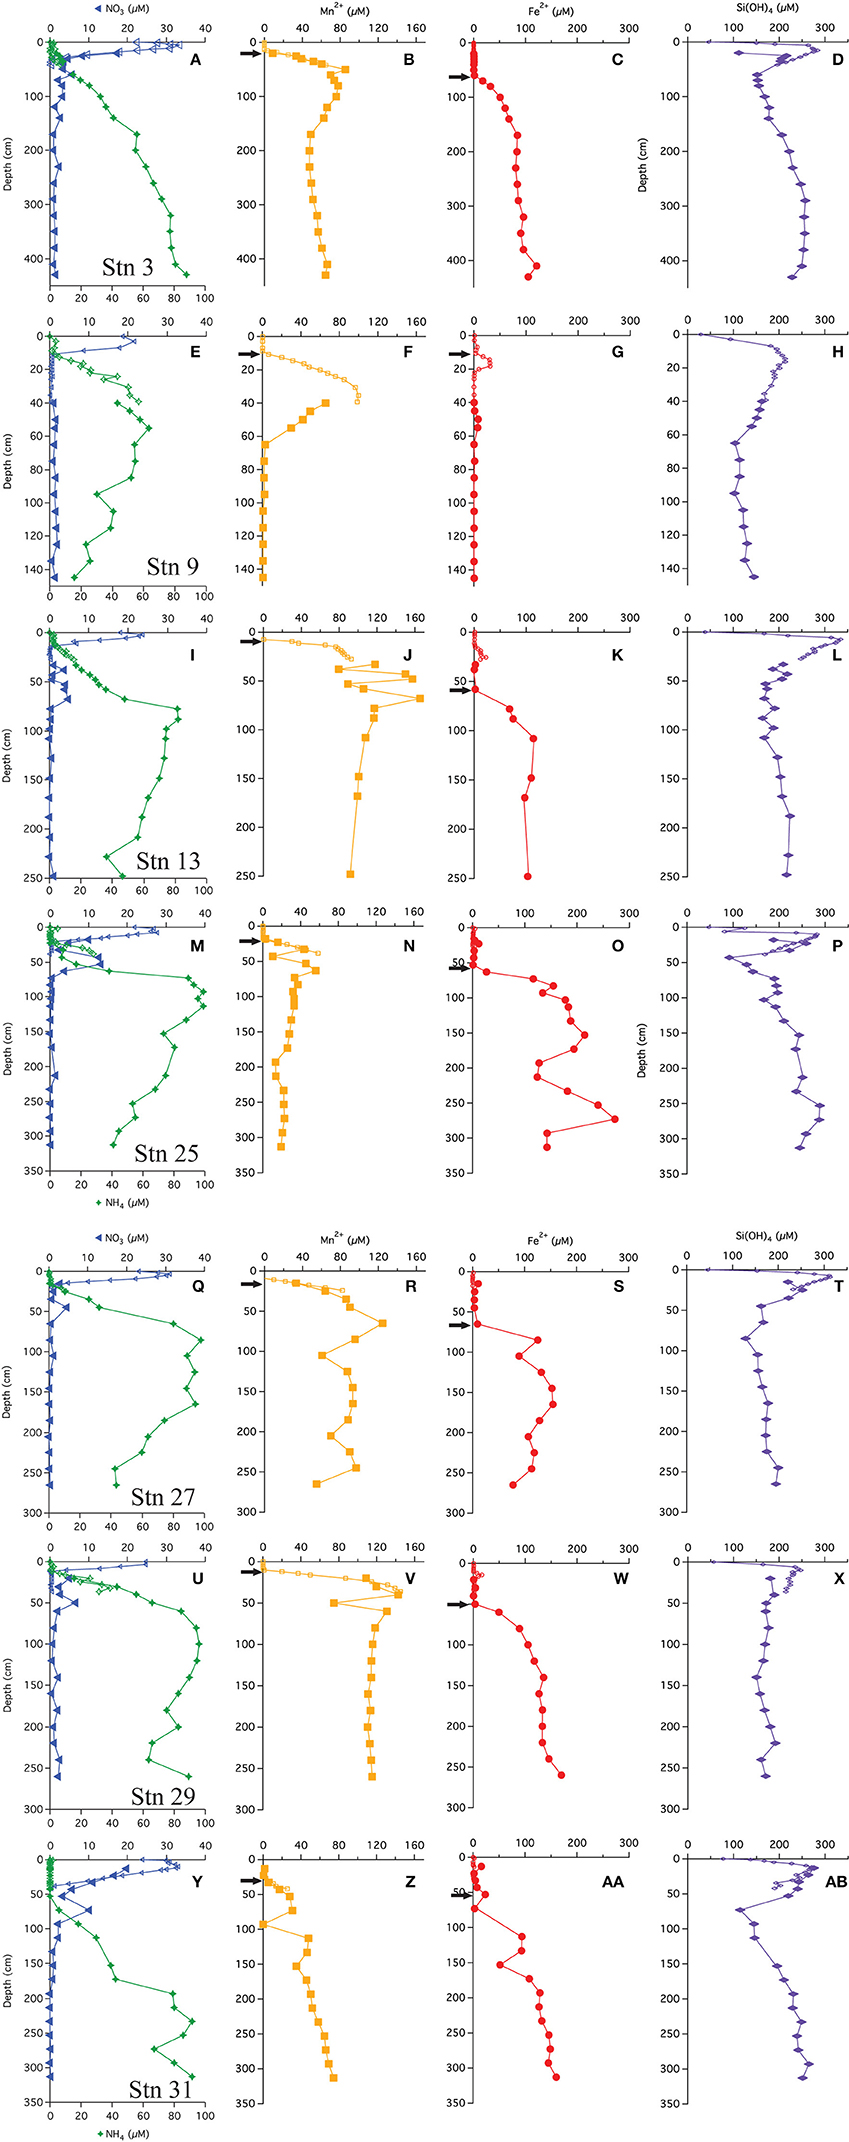
Figure 2. Pore water profiles of  ,
,  , Mn+2
  , Fe+2
  , and Si(OH)4
  . Arrows indicate depths where the flux was calculated following Fick's first law. (A-D) Profiles from station 3, (E-H) Profiles from station 9, (I-L) Profiles from station 13, (M-P) Profiles from station 25, (Q-T) Profiles from station 27, (U-X) Profiles from station 29, (Y-AB) Profiles from station 31.
Ammonium concentrations were near zero at the SWI (Figures 2A,E,I,M,Q,U,Y). At all stations, in the upper 10–50 cm is negligible (<2 μM), thereafter, concentrations increase. The gravity cores from stations 3 and 31 (most distal from river mouth) showed concentrations monotonically increasing with depth. At the other stations, the profiles reach a maximum, and then decrease with depth.
Chong et al. (2014) also discussed the appearance depth of Mn+2 in the multi-cores. It is assumed to be the depth where O2 goes to zero (Froelich et al., 1979) and at the stations discussed in this study, ranged from 8 to 30 cm. The gravity core Mn+2 profiles were consistent with the multi-core profiles (Figure 2), and many (station 3, 13, 25, 27, 29) showed a Mn+2 maximum before decreasing to a nearly constant value or zero (Stn. 9). The maxima appeared at depths between 40 and 70 cm. Stations 9 and 13 had the most pronounced Mn maxima. At station 31, the Mn profile steadily increased with depth. There may be a spurious Mn value in this core at ~90 cm.
The multi-cores generally had very little (<1 μM) to no measureable dissolved Fe+2 in the pore waters, however four stations (9, 13, 25, and 29) showed a small peak in dissolved Fe+2 between 10 and 35 cm (Figure 2). At station 9, Fe+2 appeared at 16 cm, rose to a concentration of 30 μM at 18 cm and then disappeared by 22 cm. At station 13, Fe+2 appeared at 15 cm, rising to 22 μM at 25 cm and disappearing at ~30 cm. At station 25, Fe+2 rose to 12 μM at 23 cm and disappeared by 33 cm. At station 29, Fe+2 appeared at 12 cm, reached a peak of 16 μM at 14 cm and disappeared at 24 cm.
The “major” dissolved Fe+2 appearance depth, defined as the depth where we observed a continuous increase (not including the minor peaks discussed above) in concentration with depth, ranged from 60 to 80 cm. At stations 3, 13, 27, 29, and 31, the Fe+2 profiles increased to a generally asymptotic value (~200 ± 50 μM) with depth. The profile from station 31 increased with depth starting at ~50 cm and steadily increased to a concentration of ~150 μM at depth. At station 9, the concentrations of dissolved Fe+2 remained at or near zero throughout the gravity core, although there was the aforementioned peak at 14–16 cm and a second, small maximum at ~50 cm depth.
Dissolved silica profiles (Figure 2) all increased with depth throughout the multi-cores, reaching a maximum value (200–300 μM) between 9 and 15 cm, and then decreased thereafter. The gravity core data matched quite well with multi-core data in defining these maxima. The profiles appear to reach a constant value with depth, although at stations 3, 25, and 31, dissolved Si decreased to a minimum before increasing.
Solid Phase Analyses
Solid phase analyses were performed on two gravity cores, 13 and 31. These sites are separated by 340 km; station 13 lies closer to the primary axis of the river plume, and station 31 lies off this axis and further to the NW. The wt% CaCO3 from stations 13 and 31 show very similar patterns where both increase and then decrease with depth. At station 13, the profile reached a maximum (33 wt%) at ~50 cm and decreased to <1 wt% around 90 cm depth (Figure 3). The wt% Corg measured at this station shows the opposite trend, decreasing with depth, reaching a minimum (0.2 wt%) at 60–70 cm. Values increased below this depth. At station 31, the CaCO3 profile followed a similar pattern, reaching a maximum (35 wt%) at ~30 cm, decreasing to near zero at 50–60 cm depth.
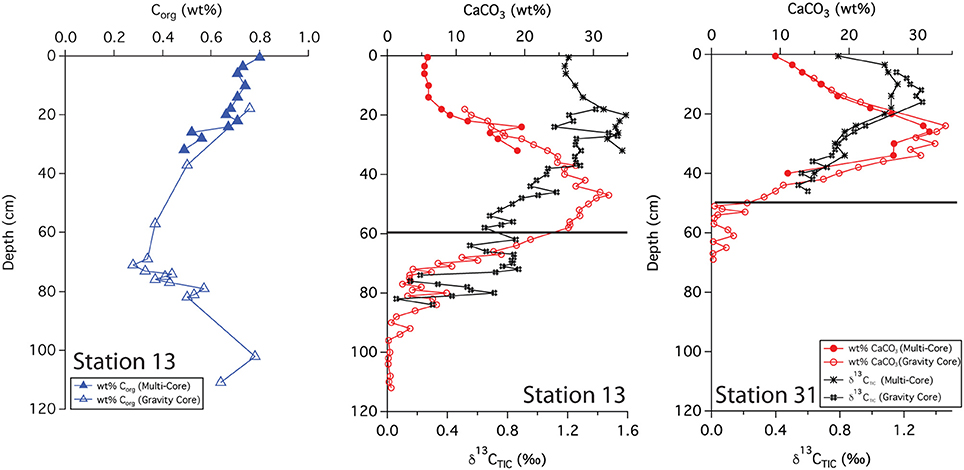
Figure 3. Downcore profiles of Corg, CaCO3 and δ13C(TIC). Black lines indicate the depth of the indurated iron crust.
The δ13C (TIC) values from both stations show a maximum and then a decrease with depth. However, slight differences between the two profiles were evident; the maximum was somewhat shallower at station 31, occurring at ~15 cm with an isotopic value of ~1.2%0 while at station 13, the maximum was at ~20 cm with a value of ~1.5%0. The surface isotopic concentration also differed, with a value of 0.8%0 at station 31 compared to a value of 1.2%0 at station 13.
Discussion
Depth Adjustment
In order to use gravity core profiles in the subsequent discussion and analysis, we first adjusted the depth of gravity core horizons, accounting for the amount of core-top lost by the “bow wave” effect during coring. Correlations between multi-cores and gravity cores based on pore water profiles indicate that the amount of core-top loss varied from 0 to 17 cm (Table 1). There was good agreement between independent depth corrections performed by simultaneously correlating four pore water constituents (Figure 2).
Matching solid phase properties, is another way to assess the position of the gravity core relative to the multi-core. The adjusted depth assigned by pore water matching was compared to adjustments based on solid phase magnetic susceptibility profiles (Mortazavi, 2012). For all cores, there was good coherence in all cases. The agreement between pore water profile matching and solid phase magnetic property matching is such that we are confident that the depth assignments used in the subsequent discussion are accurate to ± 3–5 cm.
Fluxes, Diagenetic Zonation, and Profile Shape
Oxygen and Nitrate
Generally, the gravity cores reflected pore water zonations expected from Corg diagenesis (Froelich et al., 1979), though due to the low Corg content, the redox zones have expanded over several meters (Figure 2). Based on the appearance of dissolved Mn+2 in the pore waters (Froelich et al., 1979), we concluded that the maximum depth of oxygen penetration was between 10 and 30 cm, similar to previous observations (Schulz et al., 1994). As Chong et al. (2014) discussed, this is consistent with the depth at which denitrification begins. All profiles reached a maximum below the SWI and then was consumed and depleted at depth. A secondary peak (Figure 4C) was a consistent feature in 6 of the 7 cores analyzed and is discussed below in the context of the gradient.
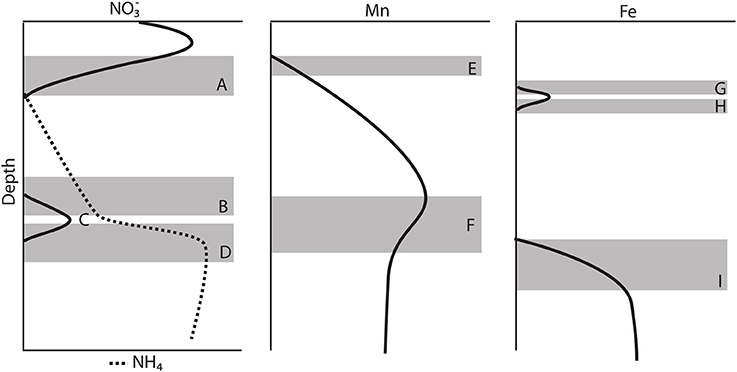
Figure 4. Schematic model of the major features observed in most of the gravity core pore water profiles. (A) Consumption zone of the primary peak. (B) Upper zone of the secondary peak. (C) Secondary peak, change in gradient. (D) Lower zone of the secondary peak. (E) Mn+2 appearance depth. (F) Change in the concentration gradient of Mn+2 (G) Upper zone of the primary Fe+2 peak. (H) Lower zone of the primary Fe+2 peak. (I) Appearance of the secondary Fe+2 production zone.
Gradients and Fluxes of , Mn+2, Fe+2, and
As in many other sediment pore water studies, for a given diagenetic reaction, the diffusive flux of a reactant may be used to predict the formation rate of a product, or fluxes may be assessed in terms of possible reaction stoichiometries. In the interest of investigating flux stoichiometries and also to assess rates of product formation, we calculated fluxes of Mn+2, and Fe+2 using Fick's first law following Hammond et al. (1996):
where ϕ is the average porosity from the gravity core horizon of interest, Dsw is the molecular diffusivity in seawater, corrected for temperature (cm2 s−1), and dC/dz is the concentration gradient. dC/dz was determined by fitting a line through 3–6 points within the depth range of the selected concentration gradient. We used a value n = 2.6 following previous work to correct for tortuosity (McManus et al., 1995; Hammond et al., 1996). Molecular diffusivities at 2°C were calculated following Li and Gregory (1974) and Schulz et al. (1994) and the values we used in these calculations were: Mn+2 = 3.20 × 10⁻⁶ cm2 s−1, Fe+2 = 3.20 × 10⁻⁶ cm2 s−1.
The flux of Mn+2 at the position of the arrow (Figures 2B,F,J,N,R,V,Z and Figure 4E) ranged from 1.2 to 7.5 μmol m−2 d−1 with the highest flux at station 29 and the lowest at station 25 (Table 3). There does not appear to be a geographic pattern in these fluxes, which suggests that Mn diagenesis is not simply a function of the location of the river plume nor proximity to the Amazon Fan. If the dissolved Mn+2 sink is reaction with oxygen, the strength of the flux toward this boundary is likely controlled by the intensity of Mn oxide (MnOx) reduction in the sediments just below this horizon. The amount and lability of Corg would factor into both oxygen disappearance and MnOx remineralization and we'd expect steeper dissolved Mn+2 gradients and larger fluxes where the oxygen disappearance depth was shallow. Figure 5 demonstrates that this hypothesis is supported, stations with a higher flux generally have a shallow Mn+2 appearance depth. Of course this outcome is also a function of MnOx availability between sites and with depth. Chong et al. (2014) defined geographic zones of river plume influence as “central” (south of 10°N and west of 50°W), “north” (north of 10°N) and “east” (east of 50°W). Generally, stations with a shallow Mn2+ appearance occur in the central zone, where the river plume is present year-round and the sediments receive a higher influx of organic matter (since Chong et al., 2014 determined that river plume location correlated positively with Corg export).
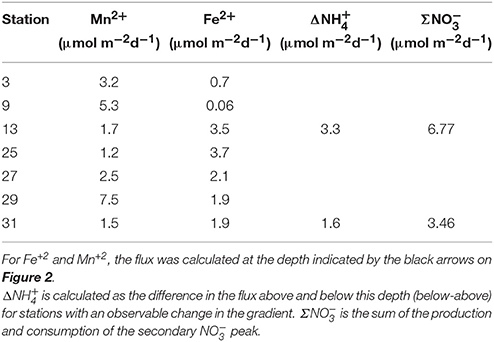
Table 3. Fluxes calculated using Fick's first law applied to the concentration gradient.
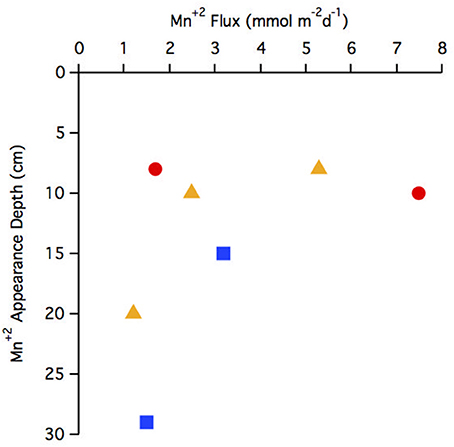
Figure 5. Comparison of Mn+2 appearance depth to flux. Geographic zonations are indicated with different symbols: central (red circle), north (blue square), east (yellow triangle).
Most of the pore water Mn+2 profiles reached a near constant concentration at depth, and hence a near zero flux. The value of this constant concentration ranged between 0 and 110 μM, with station 29 having the highest value. Schulz et al. (1994) studied a core from the base of the Amazon Fan (5.14°N 46.57°W, 3511 m depth), where dissolved Mn+2 gradually decreased with depth to near zero values at 700 cm depth. The Mn+2 profile at station 25 shows some similarity to this previous work, with concentrations dropping to ~30 μM at 300 cm depth, but the other stations do not. Since our cores are shorter than Schulz et al. it is possible that the Mn+2 profiles do reach zero at greater depths, but it is also possible that there is spatial variability in pore water diagenesis throughout the region and/or that the Mn sink in sediments proximal to the Amazon Fan is not present in Abyssal plain sediments. This variability could stem from changes in sedimentation on the Amazon Fan through time, as sedimentation rates have been shown to fluctuate significantly between glacial and interglacial periods (Damuth, 1977; Schulz et al., 1994). It is possible that the sediments in the Demerara Abyssal Plain are more carbon limited at depth. For the sites in this study where Mn+2 reaches a semi-constant concentration, another possibility is that Mn+2 concentration is controlled by the mineral solubility and oxidation state of Mn oxides as discussed below.
Most of the profiles (except station 9) had a secondary peak (4–13 μM) (Figure 4C), some defined by one point, others defined by multiple points. We presume that all produced from aerobic nitrification is consumed at shallower depths (Figure 4A), thus, the production of this additional is curious. It is possible that this feature is an artifact stemming from the oxidation of during sampling under aerobic conditions, but the fact that this secondary appears over a limited depth range and at a specific depth, associated with other solutes, across all gravity cores makes the artifact interpretation less likely. It is also possible that this is an artifact of rhizon sampling water derived from the overlying water, trapped and perhaps channeled down the inside of the gravity core tube. We rule out this artifact because dissolved Si does not show an interruption in its profile. Bioirrigation is also ruled out for the same reason.
Previous observations of deep subsurface in deep ocean sediments (Aller et al., 1998; Anschutz et al., 2000; Mortimer et al., 2004) suggest that this feature (Figure 4C) could be created by anoxic nitrification coupled to MnOx reduction (Table 4 Equations IIA, IIB) (Aller et al., 1998; Hulth et al., 1999). (Thamdrup and Dalsgaard, 2000) found that anoxic nitrification was insignificant at a site in Skagerrak, however, Anschutz et al. (2005) demonstrated that the Mn oxides in Skagerrak basin consist of Mn(IV) oxides (Canfield et al., 1993) that are less reactive to ammonia than Mn(III) phases. Their findings show that MnOx reduction by is possible, though anoxic nitrification may not be ubiquitous in all anoxic sediments. More recently, a study on cores from the Clarion-Clipperton Fracture Zone in the Eastern Tropical North Pacific suggests that ammonium generated during organic matter degradation may act as a reducing agent for manganese oxides in Corg starved sediments (Mogollón et al., 2016).
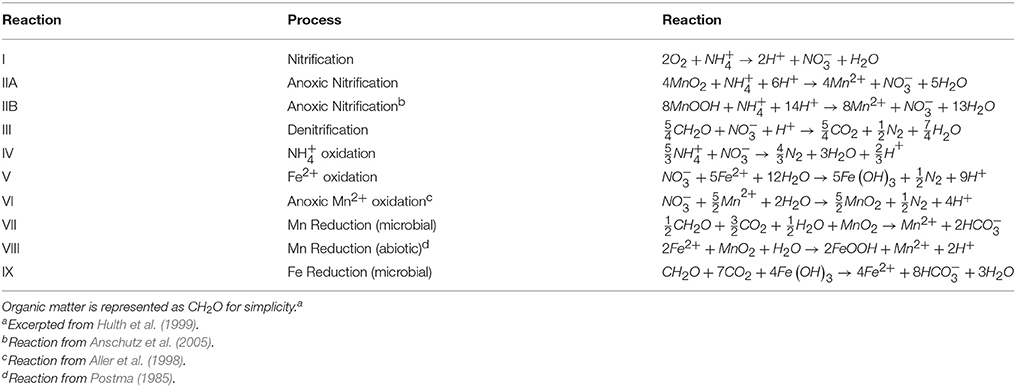
Table 4. Stoichiometries of known and hypothetical pathways of sedimentary redox processes.
If anoxic nitrification is responsible for producing the secondary peak, then the total flux (production and consumption) of at this feature should be equal to the change in the flux of . To explore the plausibility of this reaction, we constructed an N mass balance for stations 13 and 31, chosen because they most distinctly show a correlation between the appearance and disappearance of and the change in the slope of the concentration gradient of . Flux uncertainties ranging from 2 to 36% were determined (assuming most of the flux uncertainty could be attributed to uncertainty in gradient fitting) using least squares (LINEST in Microsoft Excel).
At station 13, the Δ was 3.3 ± 0.7 μmol m−2 d−1 and the Σ was 6.8 ± 1.3 μmol m−2 d−1. At station 31, Δ was 1.6 ± 0.6 μmol m−2 d−1 and the Σ was 3.5 ± 1.2 μmol m−2 d−1. Based on the predicted reaction stoichiometry in Table 4, anoxic nitrification would yield a ratio of 1:1 between and . Although our calculation of nitrate production flux was about 2X the ammonium consumption flux, within our uncertainties, the estimated fluxes show that this reaction is plausible as the reason for the secondary peak. These findings support the notion that MnOx reduction by may be occurring in these sediments resulting in the production of . In some cores (13, 25, 27), it appears possible that a reaction involving ammonium + nitrate (anammox) could be responsible for uptake. Organic carbon-based denitrification should also consume .
The secondary peak is consumed both above and below the depth of its appearance (Figures 4B,D, respectively). In feature B, the secondary diffuses upwards and is likely consumed by denitrification (Table 4 Equation III), though it is also possible that is involved in the oxidation of or in the anoxic reoxidation of Mn+2 at some sites (Table 4 Equations IV and VI, respectively). The lower boundary of the secondary max (feature D) could be generated by diffusion and consumption by reaction with Fe+2 (Table 4 Equation V). The depth of feature C is nearly coincident with the depth where feature I (Fe+2) appears (Table 5).
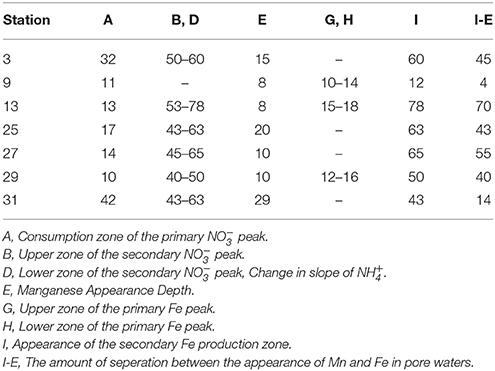
Table 5. Depths of the features observed in the pore water profiles of , Mn and Fe as defined in Figure 4. All values are in (cm).
The fluxes of dissolved Fe+2 at the position of the arrow in Figure 2 (and feature I in Figure 4) ranged from 0.06 to 3.7 μmol m−2 d−1. According to Table 4, Equation 5, we'd anticipate a flux of Fe+2 that was 5 times greater than the consumption flux of . It does not appear to be large enough to account for consumption rates presented above. Although Fe oxidation with may be occurring at this horizon, insofar as there is sufficient sink to account for the Fe+2 gradient, there is likely a second sink necessary to account for the all the downward flux.
With the exception of station 9, the appearance of dissolved Fe+2 was fairly consistent throughout the region, 45–65 cm. Further downcore, Fe+2 reached a near constant concentration of ~100 μM at stations 3, 13, 29, and 31. The profiles from stations 25 and 27 showed more variation, indicating that there may be more iron recycling downcore at these sites. At station 9, very little dissolved Fe+2 was found at depth, perhaps removed by the production of Fe-sulfides as has been observed on the Amazon Fan (Schulz et al., 1994). It was noted that sediments in this core were very dark colored, however, we do not have sulfide data from these sites to test this hypothesis. We discuss the possible relationship between Fe+2 uptake and silica in the following section.
Stations 9, 13, and 29 all had peaks (between 16 and 31 μM) in dissolved Fe+2 that appear very shallow in the sediment column (Figures 4G,H), 20–40 cm above the major gradient of dissolved Fe+2 (feature I) and within the zone of Mn reduction (Table 5). These primary peaks in Fe+2 imply local production and consumption. Generally, Fe reduction is not expected to take place at the same depth as Mn reduction due to the lower energy yield of the reaction (Froelich et al., 1979). However, the free energy calculations used to generate the expected energetic yield from anaerobic diagenetic reactions generally assume that the metal oxides are well-characterized, crystalline minerals (Burdige, 1993). It could be possible for localized Fe reduction to occur at concurrent depths with Mn reduction if the Fe oxides were poorly crystallized, amorphous solids. The shallow peaks of dissolved Fe+2 are also coincident with the depth at which the primary peak goes to zero (Figure 4A, Table 5). In feature G, the newly produced Fe+2 is consumed as it diffuses upwards, perhaps oxidized by the (Table 4 Equation V), although this cannot be tested given the poor data coverage. In feature H, just below the primary Fe peak, it is unclear what reaction is responsible for Fe consumption, as by this depth, all has been consumed. Postma (1985) proposed a reaction between Fe+2 and Mn-oxides (Table 4 Equation VIII) as a potential Fe sink.
It has been generally found that iron reduction occurs at a depth coinciding with the disappearance of from pore waters (Lyle, 1983; Burdige, 1993). However, here, only stations 9 and 31 displayed this type of pattern. At the other stations, dissolved Fe+2 appeared 30–65 cm below the depth of “major” disappearance (Table 5). We also examined the depths of appearance of the major gradients of Mn+2 and Fe+2 and found that while stations 9 and 31 had very little separation between the appearances of the two metals (4 and 14 cm, respectively), the other stations showed a separation ranging from 40 to 70 cm. One possible cause of this large spacing between the diagenetic zones is that the Corg content of the sediments is quite low. At station 13, we measured the Corg wt% of the upper 120 cm of the gravity core, and found that concentrations decreased with depth to 70 cm, after which concentrations increased (Figure 3). This minimum in Corg correlates to the appearance of Fe+2 in the pore waters (feature I). Others have shown that this is a ubiquitous phenomenon in the sediments of the equatorial Atlantic (Funk et al., 2003). However, it is also possible that sulfides produced below the zone sequester any dissolved Fe2+, and so the depth where Fe2+ increases indicates the depth where sulfate reduction slows. In this case, Fe2+ would only increase if it were being produced faster than the rate of sulfide production.
Dissolved Silica
While all of the profiles of dissolved silica increased with depth, they did not reach a constant value, as seen in many other deep sea profiles (Martin et al., 1991; Zabel et al., 1998; Shibamoto and Harada, 2010). The dissolution of biogenic opal in sediments typically generates a pore water asymptotic value within 5–30 cm below the SWI that can range from 100 to 850 μM (Fanning and Pilson, 1974; Archer et al., 1993; McManus et al., 1995; Sayles et al., 1996; Rabouille et al., 1997; Dixit et al., 2001), though these values are well below the solubility of fresh plankton (Lawson et al., 1978; Van Cappellen and Qiu, 1997). At sites studied here, they reach maxima of 100–250 μM. One possible explanation is that the there is a kinetic “competition” between the dissolution of bSi and the formation of alumino-silicate minerals (Mackenzie and Garrels, 1966; Ristvet, 1978; Mackenzie et al., 1981; McManus et al., 1995). Clay formation produced by reverse weathering has been documented experimentally (Dixit et al., 2001), and has also been identified as an important reaction in the sediments of the Brazilian-French Guianan continental shelf underlying the Amazon Plume (Michalopoulos and Aller, 1995, 2004; Michalopoulos et al., 2000). Thus, it is quite possible that reverse weathering also plays an important role in opal preservation in the deep-sea sediments underlying the Amazon plume. The rapid dissolution of bSi in the surface sediments could be curtailed by the production of dissolved Al(III) from the detrital minerals raining from Amazon plume waters. Al(III) has been shown to reduce silica solubility and induce precipitation of authigenic alumino-silicates (Dixit et al., 2001). The asymptotic value at depth could represent the new balance between the kinetics of fresh opal dissolution and reverse weathering processes. The co-occurrence of the dissolved Si minimum and the steep Fe+2 gradient may imply Fe uptake is involved as a sink for dissolved Si.
It is also possible that shelf-derived silica makes it to the deep sea. (DeMaster et al., 1996) noted that Amazon shelf waters exhibit high rates of silica production (10 mmol m−2 d−1); diatoms on the Amazon shelf may sink and be carried landward by the estuarine subsurface flow or seaward via suspension events. It is also possible that turbidity currents carry sediments off the Amazon shelf through the channel and levee system of the Amazon Fan (Damuth et al., 1988) and this process may supply additional terrigenous material to the abyssal plain. Al(III) supplied by this mechanism could contribute to dissolved Si uptake.
Location of the Indurated Iron Crust vs. Pore Water Profiles
Previous work in this region has revealed that indurated, or semi-lithified, metal-rich layers are fairly common in the sediments of the Western Equatorial Atlantic (Mcgeary and Damuth, 1973; Damuth, 1977; Flood et al., 1995). Metal-rich layers can form either within sediments from enrichment due to post-depositional redistribution of metals or at the SWI from direct precipitation or deposition from the water column. Iron-rich crusts in this area appear to correlate to the Last Glacial-Holocene boundary and were suggested to have been formed by the oxidation of reduced iron at the SWI after the post-glacial sea level rise (Mcgeary and Damuth, 1973). More recent studies have suggested that the crust is formed within the sediments due to non-steady state diagenetic processes resulting from the downward progression of redox boundaries stemming from the decrease in sedimentation rates following sea level rise (Schulz et al., 1994; Kasten et al., 1998, 2003) and resulting increase in oxygen penetration depth. Under steady state conditions, solid-phase enrichments gradually migrate upwards as ongoing sedimentation moves these layers into increasingly reducing conditions and they are dissolved. However, a decrease in Corg burial over time can cause a fixation of the redox boundaries at a particular depth in the sediments for a prolonged period, thus creating higher solid-phase concentrations of the metal than would be produced during steady state (Schulz et al., 1994; Kasten et al., 1998, 2003). In this region it appears that the Fe(II)/Fe(III) redox boundary has become trapped at the upper boundary of the most recent change in TOC deposition, while the Mn enrichment has migrated upwards due to the faster reduction kinetics of Mn compared to Fe (Funk et al., 2003; Kasten et al., 2003).
Four of the cores from this study have a semi-hardened crust and one (Station 9) has a distinct color change from tan (above) to gray but no crust (Mortazavi, 2012). The crust was defined by texture and visual inspection, and these observations matched those of previous workers whose subsequent measurements identified this as an Fe-rich layer (Mcgeary and Damuth, 1973; Damuth, 1977; Flood et al., 1995; Kasten et al., 1998). Mortazavi concluded that while the crust occurs near the Pleistocene-Holocene transition, it is not a direct marker of the exact boundary. Her means of age control were some 14C dates and correlations established using magnetic stratigraphy.
The best-developed iron crusts were identified in cores from the central region of the study area (south of 10°N and west of 50°W) at sites influenced by both the spring plume and fall retroflection but not directly below the axis of the plume. While not at the same exact depth across all cores, the iron crust consistently appeared at the depth where dissolved iron appeared in the pore waters (Figure 6). We can infer that there is likely an iron crust at stations 25 and 27 located where the Fe2+ gradient begins, however there was no sedimentary analysis of these cores.
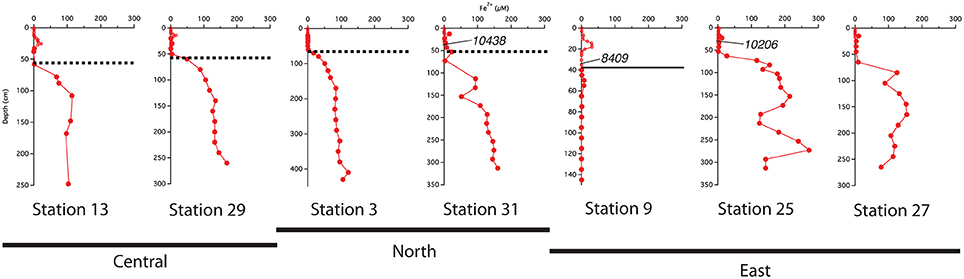
Figure 6. Comparison of the location of the indurated iron crust with the pore water profiles. Dashed lines represent the iron crust identified by Mortazavi (2012). The solid line at station 9 represents the depth of the color change from tan to gray. Central refers to stations south of 10°N and west of 50°W; North refers to stations above 10°N; East refers to stations east of 50°W. Calendar ages measured from bulk 200 μm sieved material are indicated where available.
We used sedimentary Corg and CaCO3 data to help constrain correlations between multi-core and gravity cores and to help assess general patterns of accumulation and preservation of these biogenic constituents. Solid phase CaCO3 measurements can also be used to infer where the transition between glacial and interglacial sediments occurs. Clay deposition in the Atlantic was higher during glacial times, resulting in lower CaCO3 concentrations in glacial sediments (Bacon, 1984; Balsam and McCoy, 1987; Thomson et al., 1990). Based on 14C age measurements made from bulk 200 μm sieved material (Chong et al., 2016), the age of sediments at 38 cm from station 31 is ~10,400 ypb. The CaCO3 profile at this site rapidly decreases from the SWI, reaching zero at 50 cm (Figure 3); thus the depletion of CaCO3 downcore is a good indicator of the transition from glacial to interglacial sediments. At station 31, the depth of disappearance of CaCO3 from the sediment correlates quite well to the location of the iron crust, but at station 13, there is a ~30 cm offset between the disappearance of CaCO3 and the depth of the iron crust (Figure 3). It is possible that station 13 has somewhat higher concentrations of Corg in early Holocene sediments; thus the iron layer was able to migrate upwards over time at this site. Higher concentrations of Corg downcore may also explain why station 9, located at the base of the Amazon Fan, has a color change from tan to gray but no observable crust. Additional Corg would make the reaction kinetics of Fe reduction more favorable, allowing for the complete dissolution of the crust. Overall, these results confirm that the iron crust can be used as a relative, but not exact, indicator of the transition from glacial to interglacial sediments.
Knowing that the age of the sediments near the crust horizon is ~10,000 ybp, we tried to determine if the modern-day Fe2+ flux is sufficient to create the crust in this length of time. We used the porosity from the depth interval closest to the crust depth (~50 cm) to determine the sediment density at that depth, assuming an overall grain density of 2.5 g cm−3. Using a sediment Fe concentration of 30 g Fe(III) kg−1 from measurements of crust deposits on the Amazon Fan (Kasten et al., 1998), and measured thicknesses of 0.5–7 cm (Mortazavi, 2012), we calculated the length of time it would take to create the observed crust (Table 6). At stations 13 and 25, the flux of Fe+2 is sufficient to produce the Fe crust within ~10,000 years, while stations 27 and 31 require ~20,000 years, and station 3 requires 50,000 years. At station 29, the Fe flux is sufficiently large, and the crust sufficiently small that it could form in ~2,000 years (Mortazavi, 2012). It is possible that there is additional Fe in the sediments surrounding the 0.5 cm lithified crust, and that the actual thickness of the crust is larger than what can be visually observed. A 4 cm crust depth at station 29 would take ~13,000 years to form. The results of this calculation indicate that the Fe crust is likely a relic of the change from glacial to interglacial sedimentation, where low Corg deposition during the Holocene and hence higher pore water oxygen penetration depths has effectively trapped Fe diagenesis at this horizon.
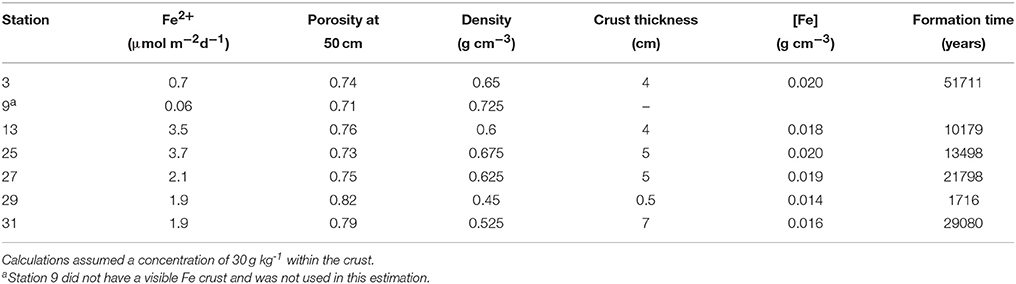
Table 6. Iron crust formation times.
Summary
Throughout the sites examined here, the depth of oxygen penetration was generally 10–20 cm below the SWI as indicated by the transition from nitrification to denitrification and consistent with the appearance of Mn+2 in pore waters. Nitrate is present in pore waters to ~30 cm. Nearly all of the cores also had a secondary maximum (4–13 μM) at ~50 cm depth perhaps derived from the oxidation of . We propose that coupled oxidation and Mn-oxide reduction may be responsible for the secondary maximum. The disappearance of the secondary peak of coincided with the increase of dissolved Fe at depth. Most of the profiles of dissolved metals generally showed a near zero flux at depth, and at most sites, the major gradient of Fe+2 occurred well below the depth of the major disappearance, indicating that the sediments are likely carbon limited at depth but that there is sufficient organic C to drive denitrification.
Dissolved silica profiles indicate rapid dissolution within the upper 30 cm followed by dissolved Si consumption, with maximum values between 250 and 300 μM followed by minimum values of 100–150 μM. We attribute the decrease in Si(OH)4 concentration to a zone of reverse weathering and the downcore asymptotic concentration indicative of the balance between the kinetic competition between dissolution and the formation of authigenic alumino-silicate minerals. Pore water gradient locations are consistent with the hypothesis that Fe+2 oxidation is also responsible for dissolved Si uptake.
Spatial variability in stoichiometric flux budgets show the prevalence of one reaction over another is possibly related to heterogeneity in the availability of Corg, oxidation state of available metal oxides or the availability of aluminosilicates. This region below the Amazon River plume does display diagenesis of Mn and Fe and and that may be unique compared to other deep ocean sites. We posit that the abundance of metals in terrestrially-derived particles helps drive Si uptake (reverse weathering) that has not been widely documented in the deep ocean.
The depth of an indurated iron-rich crust is a relative indicator of the transition from glacial to interglacial sediments that agrees fairly well with an assessment of this boundary based on CaCO3 content and 14C dates. However, the actual location of the crust depends on the amount of Corg present in the sediments. At sites with sufficient Corg content, the crust can migrate upwards due to reduction-reoxidation processes. Diffusive flux calculations show that 10,000 years is a sufficient amount of time to form the observed crusts.
Author Contributions
All authors listed have made a substantial, direct and intellectual contribution to the work and approved it for publication.
Funding
This work was supported by NSF grant #OCE-0934073 awarded to WB. LC was partially supported by fellowship support from the Earth Sciences department and Dornsife College at the University of Southern California.
Conflict of Interest Statement
The authors declare that the research was conducted in the absence of any commercial or financial relationships that could be construed as a potential conflict of interest.
Acknowledgments
We are grateful to the captain and crew of the R/V Melville. We would also like to acknowledge the members of the at-sea and shore-based science party and all contributors to the ANACONDAS project especially Chief Scientist Patricia Yager. We thank Jesse Muratli at Oregon State University for his assistance in dissolved metal analysis. We also thank Steve Lund, Emily Mortazavi, Troy Gunderson, Alice Bitzer, Cara Fassino, and Jake Porter for their assistance and contributions to this work.
References
Aller, R. C. (1998). Mobile deltaic and continental shelf muds as suboxic, fluidized bed reactors. Mar. Chem. 61, 143–155. doi: 10.1016/S0304-4203(98)00024-3
Aller, R. C. (2004). Conceptual models of early diagenetic processes: the muddy seafloor as an unsteady, batch reactor. J. Mar. Res. 62, 815–835. doi: 10.1357/0022240042880837
Aller, R. C., and Blair, N. E. (2006). Carbon remineralization in the Amazon-Guianas tropical mobile mudbelt: a sedimentary incinerator. Cont. Shelf Res. 26, 2241–2259. doi: 10.1016/j.csr.2006.07.016
Aller, R. C., Hall, P. O., Rude, P., and Aller, J. Y. (1998). Biogeochemical heterogeneity and suboxic diagenesis in hemipelagic sediments of the Panama Basin. Deep Sea Res. I 45, 133–165. doi: 10.1016/S0967-0637(97)00049-6
Anschutz, P., Dedieu, K., Desmazes, F., and Chaillou, G. (2005). Speciation, oxidation state, and reactivity of particulate manganese in marine sediments. Chem. Geol. 218, 265–279. doi: 10.1016/j.chemgeo.2005.01.008
Anschutz, P., Sundby, B., Lefrancois, L., and Luther, G. W. III (2000). Interactions between metal oxides and species of nitrogen and iodine in bioturbated marine sediments. Geochim. Cosmochim. Acta 64, 2751–2763. doi: 10.1016/S0016-7037(00)00400-2
Archer, D. E., Lyle, M. W., Rodgers, K., and Froelich, P. N. (1993). What controls opal preservation in tropical deep-sea sediments. Paleoceanography 8, 7–21. doi: 10.1029/92PA02803
Bacon, M. P. (1984). Glacial to interglacial changes in carbonate and clay sedimentation in the Atlantic Ocean estimated from 230 Th measurements. Chem. Geol. 46, 97–111. doi: 10.1016/0009-2541(84)90183-9
Balsam, W. L., and McCoy, F. W. (1987). Atlantic sediments: glacial/interglacial comparisons. Paleoceanography 2, 531–542. doi: 10.1029/PA002i005p00531
Blair, N. E., Leithold, E., and Aller, R. C. (2004). From bedrock to burial: the evolution of particulate organic carbon across coupled watershed-continental margin systems. Mar. Chem. 91, 141–156. doi: 10.1016/j.marchem.2004.06.023
Braman, R., and Hendrix, S. (1989). Nanogram nitrite and nitrate determination in environmental and biological materials by vanadium (III) reduction with chemiluminescence detection. Anal. Chem. 61, 2715–2718. doi: 10.1021/ac00199a007
Burdige, D. J. (1993). The biogeochemistry of manganese and iron reduction in marine sediments. Earth Sci. Rev. 35, 249–284. doi: 10.1016/0012-8252(93)90040-E
Canfield, D. E., Thamdrup, B., and Hansen, J. W. (1993). The anaerobic degradation of organic matter in Danish coastal sediments: iron reduction, manganese reduction, and sulfate reduction. Geochim. Cosmochim. Acta 57, 3867–3883. doi: 10.1016/0016-7037(93)90340-3
Chong, L. S. (2013). Diagenesis of C, N and Si in Marine Sediments from the Western Tropical North Atlantic and Eastern Subtropical North Pacific: Pore Water Models and Sedimentary studies. California, CA: University of Southern California.
Chong, L. S., Berelson, W. M., Hammond, D. E., Fleisher, M. Q., Anderson, R. F., Rollins, N., et al. (2016). Marine Geology. Mar. Geol. 379, 124–139. doi: 10.1016/j.margeo.2016.05.015
Chong, L. S., Berelson, W. M., McManus, J., Hammond, D. E., Rollins, N., and Yager, P. L. (2014). Carbon and biogenic silica export influenced by the Amazon River Plume: patterns of remineralization in deep-sea sediments. Deep Sea Res. I 85, 124–137. doi: 10.1016/j.dsr.2013.12.007
Damuth, J. E. (1977). Late Quaternary sedimentation in the western equatorial Atlantic. GSA Bull. 88, 695. doi: 10.1130/0016-7606(1977)88<695:LQSITW>2.0.CO;2
Damuth, J. E., Flood, R. D., Kowsmann, R. O., Belderson, R. H., and Gorini, M. A. (1988). Anatomy and growth pattern of Amazon deep-sea fan as revealed by long-range side-scan sonar (GLORIA) and high-resolution seismic studies. AAPG Bull. 72, 885–911.
DeMaster, D. J., Smith, W. O. Jr, Nelson, D. M., and Aller, J. Y. (1996). Biogeochemical processes in Amazon shelf waters: chemical distributions and uptake rates of silicon, carbon and nitrogen. Cont. Shelf Res. 16, 617–643. doi: 10.1016/0278-4343(95)00048-8
Dixit, S., Van Cappellen, P., and van Bennekom, A. J. (2001). Processes controlling solubility of biogenic silica and pore water build-up of silicic acid in marine sediments. Mar. Chem. 73, 333–352. doi: 10.1016/S0304-4203(00)00118-3
Fanning, K. A., and Pilson, M. E. (1974). The diffusion of dissolved silica out of deep-sea sediments. J. Geophys. Res:Oceans 79, 1293–1297. doi: 10.1029/JC079i009p01293
Figueiredo, J., Hoorn, C., van der Ven, P., and Soares, E. (2009). Late Miocene onset of the Amazon River and the Amazon deep-sea fan: evidence from the Foz do Amazonas Basin. Geology 37, 619–622. doi: 10.1130/G25567A.1
Flood, R. D., Piper, D., and Klaus, A. (1995). Proceedings of the Ocean Drilling Program, Initial Reports. College Station, TX: Ocean Drilling Progam.
Froelich, P. N., Klinkhammer, G. P., Bender, M. L., Luedtke, N. A., Heath, G. R., Cullen, D., et al. (1979). Early oxidation of organic matter in pelagic sediments of the eastern equatorial Atlantic: suboxic diagenesis. Geochim. Cosmochim. Acta 43, 1075–1090. doi: 10.1016/0016-7037(79)90095-4
Funk, J. A., Dobeneck, T. v., Wagner, T., and Kasten, S. (2003). “Late quaternary sedimentation and early diagenesis in the Equatorial Atlantic Ocean: Patterns, trends and processes deduced from rock magnetic and geochemical records,” in South Atlantic in the Late Quaternary, eds G. Wefer, S. Mulitza, and V. Ratmeyer (Berlin: Springer), 461–497.
Geyer, W. R., Beardsley, R. C., Lentz, S. J., Candela, J., Limeburner, R., Johns, W. E., et al. (1996). Physical Oceanography of the Amazon Shelf. Cont. Shelf Res. 16, 575–616. doi: 10.1016/0278-4343(95)00051-8
Goes, J. I., Gomes, H. R., and Chekalyuk, A. M. (2013). Influence of the Amazon River discharge on the biogeography of phytoplankton communities in the western tropical north Atlantic. Prog. Oceanogr. 120, 29–40. doi: 10.1016/j.pocean.2013.07.010
Goloway, F., and Bender, M. L. (1982). Diagenetic models of interstitial nitrate profiles in deep sea suboxic sediments. Limnol. Oceanogr. 624–638. doi: 10.4319/lo.1982.27.4.0624
Hammond, D. E., McManus, J., Berelson, W. M., Kilgore, T. E., and Pope, R. H. (1996). Early diagenesis of organic material in equatorial Pacific sediments: stoichiometry and kinetics. Deep Sea Res. II Top. Stud. Oceanogr. 43, 1365–1412. doi: 10.1016/0967-0645(96)00027-6
Heggie, D. T., Maris, C., Hudson, A., Dymond, J., Beach, R., and Cullen, J. L. (1987). Organic carbon oxidation and preservation in NW Atlantic continental margin sediments. Geol. Soc. Lond. Spec. Publ. 31, 215–236. doi: 10.1144/GSL.SP.1987.031.01.15
Holmes, R., Aminot, A., Kérouel, R., Hooker, B., and Peterson, B. (1999). A simple and precise method for measuring ammonium in marine and freshwater ecosystems. Can. J. Fish. Aquat. Sci. 56, 1801–1808. doi: 10.1139/f99-128
Hoorn, C., A, G. R. B., Romero-Baez, M., Lammertsma, E. I., Flantua, S. G. A., Dantas, E. L., et al. (2017). Global and Planetary Change. Glob. Planet. Change 153, 51–65. doi: 10.1016/j.gloplacha.2017.02.005
Hoorn, C., Wesselingh, F. P., Steegeter, H., Bermudez, M. A., Mora, A., Sevink, J., et al. (2010). Amazonia through time: andean uplift, climate change, landscape evolution, and biodiversity. Science 330, 927–931. doi: 10.1126/science.1194585
Hulth, S., Aller, R. C., and Gilbert, F. (1999). Coupled anoxic nitrification/manganese reduction in marine sediments. Geochim. Cosmochim. Acta 63, 49–66. doi: 10.1016/S0016-7037(98)00285-3
Jahnke, R. A., Emerson, S. R., and Murray, J. W. (1982). A model of oxygen reduction, denitrification, and organic matter mineralization in marine sediments. Limnol. Oceanogr. 27, 610–623. doi: 10.4319/lo.1982.27.4.0610
Kasten, S., Freudenthal, T., Gingele, F. X., and Schulz, H. D. (1998). Simultaneous formation of iron-rich layers at different redox boundaries in sediments of the Amazon deep-sea fan. Geochim. Cosmochim. Acta 62, 2253–2264. doi: 10.1016/S0016-7037(98)00093-3
Kasten, S., Zabel, M., Heuer, V., and Hensen, C. (2003). “Processes and signals of nonsteady-state diagenesis in deep-sea sediments and their pore waters,” in The South Atlantic in the Late Quaternary: Reconstruction of Material Budget and Current Systems, (Berlin: Springer), 431–459.
Keil, R. G., Mayer, L., Quay, P. D., Richey, J. E., and Hedges, J. I. (1997). Loss of organic matter from riverine particles in deltas. Geochim. Cosmochim. Acta 61, 1507–1511. doi: 10.1016/S0016-7037(97)00044-6
Kineke, G. C., Sternberg, R. W., Trowbridge, J. H., and Geyer, W. R. (1996). Fluid-mud processes on the Amazon continental shelf. Continental Shelf Res. 16, 667–696. doi: 10.1016/0278-4343(95)00050-X
Kuehl, S. A., DeMaster, D. J., and Nittrouer, C. A. (1986). Nature of sediment accumulation on the Amazon continental shelf. Continental Shelf Res. 6, 209–225. doi: 10.1016/0278-4343(86)90061-0
Kuehl, S. A., Nittrouer, C. A., Allison, M. A., Faria, L. E. C., Dukat, D. A., Jaeger, J. M., et al. (1996). Sediment deposition, accumulation, and seabed dynamics in an energetic fine-grained coastal environment. Continental Shelf Res. 16, 787–815. doi: 10.1016/0278-4343(95)00047-X
Lawson, D. S., Hurd, D. C., and Pankratz, H. S. (1978). Silica dissolution rates of decomposing phytoplankton assemblages at various temperatures. Am. J. Sci. 278, 1373–1393. doi: 10.2475/ajs.278.10.1373
Lebel, J., Silverberg, N., and Sundby, B. (1982). Gravity core shortening and pore water chemical gradients. Deep Sea Res. A Oceanogr. Res. Pap. 29, 1365–1372. doi: 10.1016/0198-0149(82)90014-0
Lentz, S. J. (1995). Seasonal variations in the horizontal structure of the Amazon Plume inferred from historical hydrographic data. J. Geophys. Res. 100, 2391–2400. doi: 10.1029/94JC01847
Li, Y., and Gregory, S. (1974). Diffusion of ions in sea water and in deep-sea sediments. Geochim. Cosmochim. Acta 38, 703–714. doi: 10.1016/0016-7037(74)90145-8
Lyle, M. W. (1983). The brown-green color transition in marine sediments: a marker of the Fe (III)-Fe (II) redox boundary. Limnol. Oceanogr. 28, 1026–1033. doi: 10.4319/lo.1983.28.5.1026
Mackenzie, F. T., and Garrels, R. M. (1966). Chemical mass balance between rivers and oceans. Am. J. Sci. 264, 507–525. doi: 10.2475/ajs.264.7.507
Mackenzie, F. T., Ristvet, B. L., Thorstenson, D. C., Lerman, A., and Leeper, R. H. (1981). “Reverse weathering and chemical mass balance in a coastal environment,” in River inputs from Ocean Systems, eds J. Martin, J. D. Burton, and D. Eisma (Geneva: United Nations Environmental Programme, United Nations Educational, Scientific, and Cultural Organization), 152–187.
Martin, W. R., Bender, M. L., Leinen, M., and Orchardo, J. (1991). Benthic organic carbon degradation and biogenic silica dissolution in the central equatorial Pacific. Deep Sea Res. A Oceanogr. Res. Pap. 38, 1481–1516. doi: 10.1016/0198-0149(91)90086-U
Mcgeary, D., and Damuth, J. E. (1973). Postglacial Iron-Rich Crusts in Hemipelagic Deep-Sea Sediment. GSA Bull. 84, 1201–1212. doi: 10.1130/0016-7606(1973)84<1201:PICIHD>2.0.CO;2
McManus, J., Hammond, D. E., Berelson, W. M., Kilgore, T. E., DeMaster, D. J., Ragueneau, O. G., et al. (1995). Early diagenesis of biogenic opal: dissolution rates, kinetics, and paleoceanographic implications. Deep Sea Res. II 42, 871–903. doi: 10.1016/0967-0645(95)00035-O
Meade, R. H., Dunne, T., Richey, J. E., de Santos, U. M., and Salati, E. (1985). Storage and remobilization of suspended sediment in the lower Amazon River of Brazil. Science 228, 488–490. doi: 10.1126/science.228.4698.488
Michalopoulos, P., and Aller, R. C. (1995). Rapid clay mineral formation in Amazon delta sediments: reverse weathering and oceanic elemental cycles. Science 614–614. doi: 10.1126/science.270.5236.614
Michalopoulos, P., and Aller, R. C. (2004). Early diagenesis of biogenic silica in the Amazon delta: alteration, authigenic clay formation, and storage. Geochim. Cosmochim. Acta 68, 1061–1085. doi: 10.1016/j.gca.2003.07.018
Michalopoulos, P., Aller, R. C., and Reeder, R. (2000). Conversion of diatoms to clays during early diagenesis in tropical, continental shelf muds. Geology 28, 1095–1098. doi: 10.1130/0091-7613(2000)28
Mogollón, J. M., Mewes, K., and Kasten, S. (2016). Quantifying manganese and nitrogen cycle coupling in manganese-rich, organic carbon-starved marine sediments: examples from the Clarion-Clipperton fracture zone. Geophys. Res. Lett. 43, 7114–7123. doi: 10.1002/2016GL069117
Mortazavi, E. (2012). Western Equatorial Atlantic Sedimentation: A Study of Magnetic Properties. California, CA: University of Southern California.
Mortimer, R., Harris, S., Krom, M., Freitag, T. E., Prosser, J. I., Barnes, J., et al. (2004). Anoxic nitrification in marine sediments. Mar. Ecol. Prog. Ser. 276, 37–51. doi: 10.3354/meps276037
Muller-Karger, F. E., Mcclain, C., and Richardson, P. L. (1988). The dispersal of the Amazon's water. Nature 333, 56–59. doi: 10.1038/333056a0
Neumann, G. (1969). Seasonal salinity variations in the upper Strata of the western tropical Atlantic Ocean-Sea surface salinities. Deep Sea Res. Suppl. 16, 165–177.
Nittrouer, C. A., and DeMaster, D. J. (1996). The Amazon shelf setting: tropical, energetic, and influenced by a large river. Cont. Shelf Res. 16, 553–573. doi: 10.1016/0278-4343(95)00069-0
Postma, D. (1985). Concentration of Mn and separation from Fe in sediments—I. Kinetics and stoichiometry of the reaction between birnessite and dissolved Fe (II) at 10 C. Geochim. Cosmochim. Acta 49, 1023–1033.doi: 10.1016/0016-7037(85)90316-3
Rabouille, C., Gaillard, J.-F., Treguer, P., and Vincendeau, M.-A. (1997). Biogenic silica recycling in surficial sediments across the Polar Front of the Southern Ocean (Indian Sector). Deep Sea Res. II Top. Stud. Oceanogr. 44, 1151–1176. doi: 10.1016/S0967-0645(96)00108-7
Ristvet, B. L. (1978). Reverse Weathering Reactions Within Recent Nearshore Marine Sediments. Kaneohe Bay, Oahu; Chicago, IL: Northwestern University.
Sayles, F. L., Deuser, W. G., Goudreau, J. E., DIckinson, W. H., Jickells, T. D., and King, P. (1996). The benthic cycle of biogenic opal at the Bermuda Atlantic time series site. Deep Sea Res. I Oceanogr. Res. Pap. 43, 383–409. doi: 10.1016/0967-0637(96)00027-1
Schulz, H. D., Dahmke, A., Schinzel, U., Wallmann, K., and Zabel, M. (1994). Early diagenetic processes, fluxes, and reaction rates in sediments of the South Atlantic. Geochim. Cosmochim. Acta 58, 2041–2060. doi: 10.1016/0016-7037(94)90284-4
Shibamoto, Y., and Harada, K. (2010). Silicon flux and distribution of biogenic silica in deep-sea sediments in the western North Pacific Ocean. Deep Sea Res. I Oceanogr. Res. Pap. 57, 163–174. doi: 10.1016/j.dsr.2009.10.009
Smith, W. O. Jr, and DeMaster,D. J. (1996). Phytoplankton biomass and productivity in the Amazon River plume: correlation with seasonal river discharge. Cont. Shelf Res. 16, 291–319. doi: 10.1016/0278-4343(95)00007-N
Subhas, A. V., Rollins, N., Berelson, W. M., Dong, S., Erez, J., and Adkins, J. F. (2015). A novel determination of calcite dissolution kinetics in seawater. Geochim. Cosmochim. Acta 170, 51–68. doi: 10.1016/j.gca.2015.08.011
Thamdrup, B., and Dalsgaard, T. (2000). The fate of ammonium in anoxic manganese oxide-rich marine sediment. Geochim. Cosmochim. Acta 64, 4157–4164. doi: 10.1016/S0016-7037(00)00496-8
Thomson, J., Wallace, H. E., Colley, S., and Toole, J. (1990). Authigenic uranium in Atlantic sediments of the last glacial stage—a diagenetic phenomenon. Earth Planet. Sci. Lett. 98, 222–232. doi: 10.1016/0012-821X(90)90061-2
Van Cappellen, P., and Qiu, L. (1997). Biogenic silica dissolution in sediments of the Southern Ocean. I. Solubility. Deep Sea Res. II Top. Stud. Oceanogr. 44, 1109–1128. doi: 10.1016/S0967-0645(96)00113-0
Wollast, R. (1998). Evaluation and comparison of the global carbon cycle in the coastal zone and in the open ocean. Sea 10, 213–252–252.
Keywords: carbon diagenesis, nitrogen, manganese, iron, biogenic silica, sedimentation, pore waters, Amazon River Plume
Citation: Chong LS, Berelson WM, McManus J and Rollins NE (2018) Meter-Scale Early Diagenesis of Organic Matter Buried Within Deep-Sea Sediments Beneath the Amazon River Plume. Front. Mar. Sci. 5:250. doi: 10.3389/fmars.2018.00250
Received: 01 May 2017; Accepted: 28 June 2018;
Published: 18 July 2018.
Edited by:
Patricia Lynn Yager, University of Georgia, United StatesReviewed by:
Karen G. Lloyd, University of Tennessee, Knoxville, United StatesNils Edvin Asp, Universidade Federal do Pará, Brazil
Copyright © 2018 Chong, Berelson, McManus and Rollins. This is an open-access article distributed under the terms of the Creative Commons Attribution License (CC BY). The use, distribution or reproduction in other forums is permitted, provided the original author(s) and the copyright owner(s) are credited and that the original publication in this journal is cited, in accordance with accepted academic practice. No use, distribution or reproduction is permitted which does not comply with these terms.
*Correspondence: Lauren S. Chong, lschong@alumni.usc.edu