Underwater Acoustic Ecology Metrics in an Alaska Marine Protected Area Reveal Marine Mammal Communication Masking and Management Alternatives
 Christine M. Gabriele1*
  Dimitri W. Ponirakis2
  Christopher W. Clark2
  Jamie N. Womble1 Phoebe B. S. Vanselow1
- 1Glacier Bay National Park and Preserve, Gustavus, AK, United States
- 2Cornell Lab of Ornithology, Bioacoustics Research Program, Ithaca, NY, United States
Vessel-generated underwater noise can affect humpback whales, harbor seals, and other marine mammals by decreasing the distance over which they can communicate and detect predators and prey. Emerging analytical methods allow marine protected area managers to use biologically relevant metrics to assess vessel noise in the dominant frequency bands used by each species. Glacier Bay National Park (GBNP) in Alaska controls summer visitation with daily quotas for vessels ranging from cruise ships to yachts and skiffs. Using empirical data (weather, AIS vessel tracks, marine mammal survey data, and published behavioral parameters) we simulated the movements and acoustic environment of whales and seals on 3 days with differing amounts of vessel traffic and natural ambient noise. We modeled communication space (CS) to compare the area over which a vocalizing humpback whale or harbor seal could communicate with conspecifics in the current ambient noise environment (at 10-min intervals) relative to how far it could communicate under naturally quiet conditions, known as the reference ambient noise condition (RA). RA was approximated from the quietest 5th percentile noise statistics based on a year (2011) of continuous audio data from a hydrophone in GBNP, in the frequency bands of whale and seal sounds of interest: humpback “whup” calls (50–700 Hz, 143 dB re 1 μPa source level, SL); humpback song (224–708 Hz, 175 dB SL), and harbor seal roars (4–500 Hz, 144 dB SL). Results indicate that typical summer vessel traffic in GBNP causes substantial CS losses to singing whales (reduced by 13–28%), calling whales (18–51%), and roaring seals (32–61%), especially during daylight hours and even in the absence of cruise ships. Synchronizing the arrival and departure timing of cruise ships did not affect CS for singing whales, but restored 5–12% of lost CS for roaring seals and calling whales, respectively. Metrics and visualizations like these create a common currency to describe and explore methods to assess and mitigate anthropogenic noise. Important next steps toward facilitating effective conservation of the underwater sound environments will involve putting modeling tools in the hands of marine protected area managers for ongoing use.
Introduction
Hearing is a primary sensory modality that marine mammals use to exchange information and detect environmental cues. Effective conservation must include protection of the acoustic environment (Barber et al., 2011) because many marine and terrestrial species are highly social and rely on acoustic communication for vital life functions such as feeding, breeding, and rearing young (Brumm and Slabbekoorn, 2005; Tyack, 2008). Motorized vessels generate underwater noises that overlap in frequency, space and time with marine mammal sounds (Richardson et al., 1995), and these noises presumably hinder effective communication. Several studies have described the increasingly noisy ocean in which these animals live (Payne and Webb, 1971; Malme et al., 1982; Andrew et al., 2002; Erbe, 2002; Hatch et al., 2008; Simard et al., 2008; Bassett et al., 2012; Miksis-Olds et al., 2013; Houghton et al., 2015; Blair et al., 2016; McKenna et al., 2017; Stafford et al., in press). Marine mammals and other taxa are known to be affected by noise and sometimes adjust their behavior to communicate in noisy environments (Terhune et al., 1979; Lengagne and Slater, 2002; Parks et al., 2007, 2009; Di Iorio and Clark, 2009; Holt et al., 2009; Dunlop et al., 2014; Ellison et al., 2016; Shannon et al., 2016; Tennessen and Parks, 2016; Fournet et al., 2018a). Across marine mammal taxa, the specific biological consequences of noise are difficult to pinpoint (Nowacek et al., 2007), but the disruption of social bonds, lost opportunities for mating and feeding, increased energy expenditure in vocalizing louder (Holt et al., 2009; Parks et al., 2010; Fournet et al., 2018a), in addition to a reduced ability to detect predators (Deecke et al., 2002), seem likely to be among the proximate causes that ultimately manifest as population level effects (Bejder et al., 2006).
Protected areas are by no means immune from the effects of noise; fortunately, methods to assess the effects of noise on wildlife in natural areas are advancing (Barber et al., 2011; Hatch et al., 2012). Historically, received sound level has been used as the primary metric for predicting both harmful and behavioral impacts from anthropogenic noise (Southall et al., 2007). However, a growing number of observations indicate that received level does not adequately predict response and that social and other aspects of context are critical factors (Buck and Tyack, 2000; Deecke et al., 2002; Southall et al., 2007; Ellison et al., 2012). In this study, we adapt emerging techniques to quantify lost opportunities for humpback whales (Megaptera novaeangliae) and harbor seals (Phoca vitulina richardii) to communicate in varying noise conditions in a large marine protected area in southeastern Alaska.
Communication sounds must propagate through the acoustic environment from sender to receiver in order for acoustic communication to occur (Wiley and Richards, 1978). The distance over which such communication can occur was first referred to as “active space” in studies of terrestrial species (Marten and Marler, 1977; Brenowitz, 1982; Lohr et al., 2003). The acoustic environment is composed of the aggregate of all sounds at a particular time and place, including both natural and manmade sound sources that might influence the ability of animals to communicate. In the ocean, wind is the dominant natural source of ocean noise (Wenz, 1962), but other natural biotic (animals), natural abiotic (e.g., earthquakes, ice, rain, lightning) and manmade abiotic (e.g., aircraft, boats, energy exploration, construction, sonar) sources (Richardson et al., 1995) are also typical contributors to the marine acoustic environment. The specific frequency bands utilized by a particular species (both passively and actively) for basic life functions can be thought of as the acoustic habitat of that species (Clark et al., 2009; Ellison et al., 2012; Moore et al., 2012; Merchant et al., 2015).
Acoustic masking occurs when sound from one or more sources interferes with a listener's ability to detect, recognize, and/or understand sounds of interest (Marten and Marler, 1977; Richardson et al., 1995). Communication masking occurs when noise reduces a receiving animal's ability to hear sounds from conspecifics, or reduces the likelihood that a vocalizing animal's sounds will be received by conspecifics. For example, Jensen et al. (2009) estimated reductions in the distances over which bottlenose dolphins (Tursiops sp.) and short-finned pilot whales (Globicephala macrorhynchus) could possibly communicate in vessel noise. Clark et al. (2009, 2016) developed a means to quantify the reduction in the area over which a baleen whale's communication sounds are detectable by conspecifics in a present noise condition relative to the area assumed to be available under the historically quiet natural conditions. Expanding on the concept of active space, the Clark et al. (2009, 2016) methods take into account in situ empirical measurements of ambient noise, the source levels of communication sounds and noise sources, and the acoustic habitat of the species of interest, and can be done from the perspective of the vocalizing animal (sender) and/or their intended listeners (receivers). This approach to estimating communication masking has been applied to a variety of cetaceans including fin, humpback, killer, minke, and right whales (Hatch et al., 2012; Williams et al., 2013; Cholewiak et al., 2018).
Arriving at a meaningful estimate of communication masking relative to natural quiet (devoid of manmade noise) relies on choosing an appropriate reference ambient noise condition. Clark et al. (2009, 2016) recommended using the lowest 5th percentile noise level statistic under naturally quiet conditions as a reasonable estimate of this reference condition. This recommendation was based on the hypothesis that for frequencies below 1 kHz, baleen whale auditory thresholds are noise-limited, and there would be a selective advantage for hearing sensitivity to be close to the quietest ambient noise condition (Clark and Ellison, 2004). For any acoustically active marine mammal, the reference condition is intended to capture the historical acoustic environment available without the influence of manmade noise. In estimating mysticete communication masking in Massachusetts Bay, where continuous ship traffic noise makes it impossible to use contemporary noise level statistics to approximate historically quiet conditions, Hatch et al. (2012) and Cholewiak et al. (2018) used a reference noise condition of 10 dB below the empirically measured present day median noise conditions as an approximation of the historical noise condition.
Refinements and new uses of emerging communication masking metrics in marine protected areas create opportunities to understand and mitigate the effects of noise. These studies and others have advanced knowledge on what geographic areas are of highest concern for anthropogenic noise, which species' communication sounds are most affected by vessel-generated noise, and what vessel attributes or operational practices affect noise production (Hatch et al., 2012, 2016; Williams et al., 2013, 2015; Frankel and Gabriele, 2017; Cholewiak et al., 2018).
Humpback whales and harbor seals are two acoustically active marine mammals that are of management concern in Glacier Bay National Park (GBNP or Park), in southeastern Alaska (Womble et al., 2010; Gabriele et al., 2017). The Park functions as one of the largest marine mammal protected areas in the world with regulations to minimize threats to these species and sustain a healthy ecosystem. For example, Park regulations require all vessels to reduce speed in areas of high concentrations of humpback whales and harbor seals (Code of Federal Regulations Title 36, Part 13, Subpart N) and exclude vessels from important seal habitat during pupping and molting periods (Code of Federal Regulations Title 36, Part 13, Subpart N). Both species produce communication sounds in the context of feeding and reproduction during their time in Park waters.
The communication sounds of these two species of interest include calls and mating-related displays produced in a variety of social contexts. We examined three types of vocalizations: (1) the humpback whale “whup” call, heard in Alaska in all seasons, believed to function as a contact call (Wild and Gabriele, 2014; Fournet et al., 2015); (2) humpback whale song, a male display common on winter breeding grounds (Payne and McVay, 1971; Darling et al., 2006) and in southeastern Alaska in the fall (McSweeney et al., 1989; Gabriele and Frankel, 2002); (3) the harbor seal roar, a male breeding display (Van Parijs et al., 2003; Hayes et al., 2004) heard primarily in May through July in Glacier Bay (Matthews et al., 2017a).
Humpback whales are a globally distributed, migratory baleen whale that was profoundly depleted by twentieth-century commercial whaling (Rice, 1978; Ivaschchenko et al., 2013). In 1973, the humpback whale was declared “endangered” under the Endangered Species Act (ESA) and thus became a prime management concern in GBNP (Code of Federal Regulations, Title 36, Part 13, Subpart N). The Hawaii Distinct Population Segment (DPS) is one of nine DPSs worldwide recently removed from the U.S. Endangered Species List, while the Mexico DPS remains listed as “threatened” (NOAA, 2016). Whales from both the Hawaii DPS and the Mexico DPS feed in GBNP waters. The harbor seal is a widely distributed pinniped that occupies various habitats in the Northern Hemisphere (Bigg, 1981). Over the last few decades, harbor seal numbers steeply declined in GBNP (Mathews and Pendleton, 2006; Womble et al., 2010), leading to management concern and regulatory action to minimize disturbance to hauled out seals (Code of Federal Regulations, Title 36, Part 13, Subpart N). In this study, we incorporated empirical data from acoustic monitoring in GBNP and applied the Clark et al. (2009, 2016) approach to quantify the degree to which vessel noise can compromise the ability of vocalizing humpback whales and harbor seals to communicate with conspecifics. Our results characterize the spatial and temporal dynamics of GBNP's underwater acoustic environment over a full year, provide the first comprehensive models of vessel traffic noise in GBNP, and quantitatively estimate the degree to which vessel noise masks humpback whale and harbor seal sounds. An understanding of communication masking over meaningful temporal and geographical scales is highly informative when management decisions are needed to address the effects of anthropogenic noise on species of concern.
Methods
Study Area
The GBNP encompasses a tidewater glacier fjord with over 2,400 km2 of marine waters. The Park experiences tourism-related vessel traffic mainly in May through September. The National Park Service has jurisdiction over the marine waters of the Park, and during visitor season controls private and commercial vessel traffic using a permit system. Administrative data indicate the date/time that each vessel enters and exits GBNP. Bounded by land on all sides except its mouth, Glacier Bay is acoustically removed from distant shipping noise. Freight-carrying vessels crossing the Gulf of Alaska bypass Glacier Bay because it is not a thoroughfare and contains no major commercial port.
Conceptual Approach
Communication masking metrics were calculated using an agent-based model comprised of multiple sound sources (including vocalizing whales and seals, wind-generated ambient noise, and vessel noise) and an underlying grid of potential receivers (see Clark et al., 2009, 2016). We modeled communication masking on 3 days with varying amounts of vessel traffic conditions and wind-generated ambient noise. The model used custom-built Sound Ecology, Detection, and Noise Analysis software (SEDNA, Dugan et al., 2011) to simulate vocalizing marine mammals and noise-producing vessels, known as “animats,” that move through three-dimensional space and time according to behavioral rules set in the model (Frankel et al., 2002).
Glacier Bay was partitioned into a grid of 1 km2 cells with a modeled whale or seal listener (i.e., an animat receiver) in the center of each grid cell (Figure 1A). To capture noise conditions over the course of each of the 24-h days, for each grid cell we computed aggregated sound levels from wind and from vessels at 10-min time intervals. These noise levels served as estimated received levels for a modeled animal listening in the center of each grid cell. For each communication sound, we computed CS metrics under three noise conditions: present ambient noise, present ambient and aggregated vessel noise combined, and aggregated vessel noise.
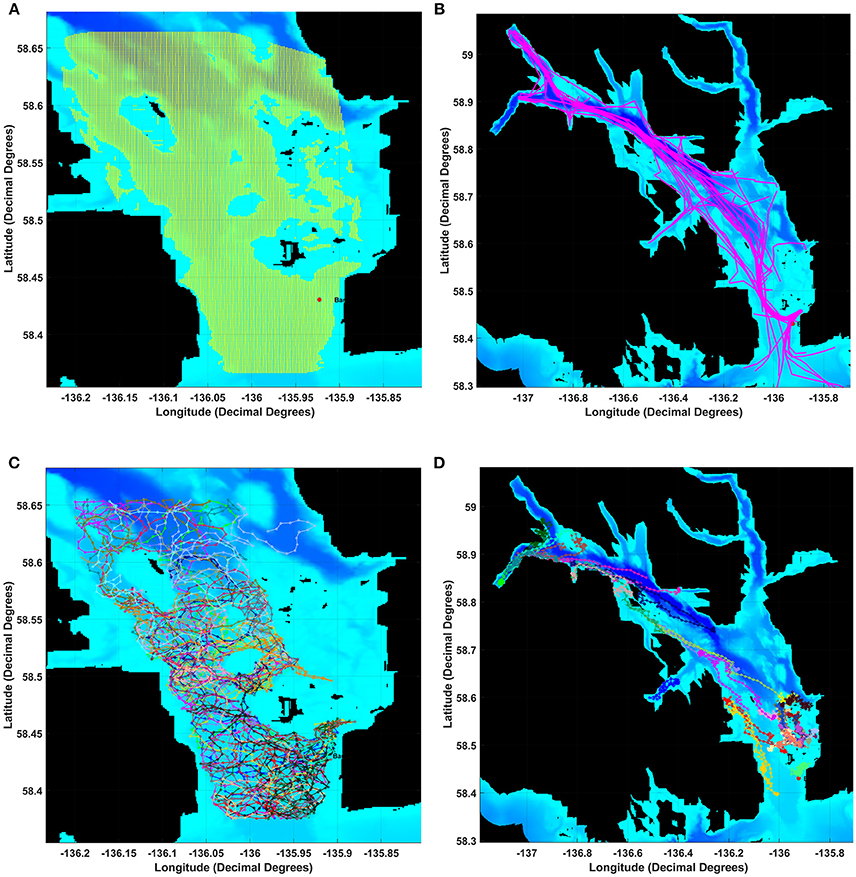
Figure 1. Map of Glacier Bay showing the (A) grid of 1 km by 1 km boxes and data layers for the movements of (B) individual vessel, (C) humpback whale or (D) harbor seal animats. After adding wind-generated noise, we estimated received levels for a modeled whale or seal listening in each grid square using a 17 log R propagation model for each 10-min time slice of a 24 h day. To calculate a masking index for each 10-min slice in each grid-square we compared communication space (CS) under Present Ambient noise (PrA) relative to CS under Reference Ambient noise (RA).
To calculate communication masking indices for each communication sound and noise conditions, we compared their communication space metrics relative to communication space under a naturally quiet ambient noise condition. By this process we derived estimates of communication masking dynamics for humpback whale and harbor seal sounds under different vessel traffic conditions.
Ambient Noise Data Collection
We used continuous digital recordings of the acoustic environment from 1 January through 30 December 2011 for this study. These data were collected via a hydrophone in Bartlett Cove near the mouth of Glacier Bay (58.43501 N, 135.92297 W), deployed at a depth of 30.2 m (Figure 1A). The system consisted of a calibrated ITC type 8215A broadband omnidirectional hydrophone (nominal sensitivity −178 dB re 1 V/μPa) mounted on an anchoring tripod 1 m above the seafloor. This seafloor is a remnant of a glacial moraine and is fairly flat at a depth of 40–60 m. A submerged 5-mile cable connects the hydrophone to a control unit at Park headquarters, where continuous recordings were made 24 h a day, archived as 5-min sound files (National Instruments 4451 Digital Signal Analyzer, 22.05 kHz sampling rate, 24-bits per sample). The recording system had a flat frequency response from 20 Hz to 20 kHz (±2 dB). The Least Significant Bit Level (LSB) is the lowest noise level that will trigger the first bit in the sensor, and allows determination of the quietest sound that the sensor can measure. The LSB and the Most Significant Bit (MSB, i.e., the loudest sound the sensor can measure) describe the range of dB levels that the sensor can measure, and are essential for determining the amplitudes of ambient noise measured during the study.
The LSB was calculated from the formula:
LSB dB = 20 * log10(Maximum Input Voltage/2(bitdepth−1) – Hydrophone Sensitivity - Hydrophone Preamp Gain - NI4451 Gain. Where:
With a calculated LSB of 9.5 dB, we derived the MSB (148 dB) and dynamic range of 138.5 dB.
Ambient Noise Data Processing
Sound level metrics were computed using the SEDNA, referred to Raven-X (Dugan et al., 2011)1 in a two-stage process. The AIF audio files were processed on a high performance computing platform. Traditional spectrograms (16,384 FFT, 0% overlap, Hann window) were computed with a 1 μPa calibration reference level, a frequency resolution of 1 Hz, and a temporal resolution of 10 s.
A second-stage Raven-X analyzer then generated broadband and 1/3-octave band metrics that were averaged into 10-min sound level values, referred to as Leq, 10min. The Leq, is the continuous equivalent sound level defined as the single sound pressure level (SPL) that, if constant over the analysis period (e.g., 10 min), would contain the same energy as the actual measured sound level that is fluctuating over that same period.
Sound measurements were computed for each species-specific frequency band (Matthews et al., 2017b; Fournet et al., 2018b) for the communication sound types of interest. The hourly (Leq, 10min) sound levels for species-specific frequency bands were summarized as percentile sound level distributions at hourly and monthly resolutions.
Whale, Seal, and Vessel Animat Distributions and Movements
Vessel animats: We used actual vessel records on the number, types, and tracks of vessels in GBNP for 3 days in summer 2011 to represent low, moderate and high vessel traffic conditions. These subjective categories centered on the number of cruise ships, but also included different numbers of medium and small vessels. Our high traffic day (High) had 32 vessels including 2 cruise ships that arrived and departed GBNP 1 hr apart, our moderate traffic day (Moderate) had 26 vessels including one cruise ship, and our low traffic day (Low) had 16 vessels and no cruise ships (Table 1). To represent actual vessel schedules and compare the difference in loss of communication space for marine mammals exposed to simultaneous cruise ship events vs. events separated significantly in time (see also Frankel and Gabriele, 2017), we also ran a version of the high traffic day in which the cruise ships arrived 3 h apart. In all scenarios, vessels moved according to AIS tracks gathered from PACTRACS (Marine Exchange of Alaska, unpublished data) or knowledge of the entry time, exit time and maximum speed of each vessel. GBNP uses quotas to manage vessel entries into Glacier Bay during the June—August visitor season. Whale and seal animats: Realistic distributions and movements of animats are critical to realistic estimates of the CS available to a vocalizing animal. Distributions of calling seal and whale animats were based on 2011 visual survey data (Figures 1C, D). Whale animats were programmed to move at 3.7 km/h (2 kts). Seal animats started at a haulout, traveled at ~5.9 km/h (±1.4; range: 0.6–11.6 km/h) (3.2 kts) between the haulout and likely foraging areas, and moved at slower rates of travel [0.6 km/h (0.3 kts)] while foraging. This pattern, based on observations of radio-tagged seals, includes likely searching and foraging behavior characterized by repeated dives in the general same area (Womble et al., 2014). Because harbor seals tend to haul out for several hours daily, at times which may vary due to tide, time of day, or other environmental variables, we incorporated this pattern into the model (Simpkins et al., 2003; Womble et al., 2014). For 50% of the seals in model runs where haul-out behavior was incorporated, sound exposures that occurred between 12:00 and 17:00 were omitted from calculations of the seals' communication masking metrics. Whale and seal animats turned at every 10-min interval with a maximal turn radius of 120°. If an animat moved into a water depth less than 10 m, the animat was programmed to turn sharply to return to deeper water (Dolphin, 1987a,b; Dalla Rosa et al., 2008; Witteveen et al., 2008). Seals, whales and vessels were not programmed to approach or avoid each other; thus separation distances were determined solely by vessel course and the movement pattern of an animat.
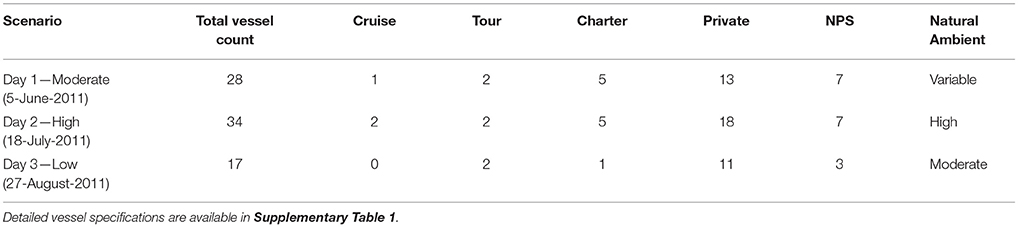
Table 1. Vessel scenarios.
Whale and Seal Communication Sounds
Based on a long-term underwater sound dataset, humpback whale, and harbor seal communication sounds are the most common and conspicuous in the Park (McKenna et al., 2017). We chose and modeled the most relevant frequency band for each of three species-specific sound types based on published reports (Table 2; Fournet et al., 2015; Matthews et al., 2017b) and examination of the acoustic data. The low- frequency and high-frequency values bracket the 1/3rd-octave frequency bands for each sound type. We used the best available information on SL and frequency characteristics (Au et al., 2006; Matthews et al., 2017b; Fournet, 2018). We assumed 17 log R sound propagation loss based on measurements in GBNP (Malme et al., 1982). The maximal communication range (CR) for each type of communication sound was based upon published literature (Watkins and Schevill, 1979; Tyack, 2008), and best professional judgment. For harbor seal roars (0.7 km) and humpback whale whup calls (2.3 km), our choices of CR were informed by the median of the empirical distribution of how far away individual animals were acoustically localized in a 2015-2016 study in GBNP. For harbor seal roars, the median and maximal ranges at which harbor seals were localized were 710 and 2026 m, respectively (L. Matthews, unpublished data). Humpback whale whups were localized at median and maximal ranges of 1,350 m and 2,260, respectively (M. Fournet, unpublished data).
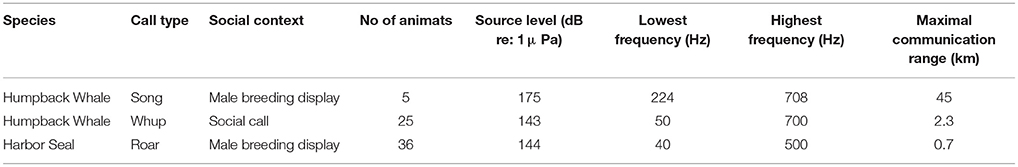
Table 2. Characteristics of modeled humpback whale and harbor seal communication sounds.
Ambient Noise
We calculated ambient noise levels for each 10-min period during a full year (2011) of audio recordings from the Bartlett Cove hydrophone (Figure 1). The lowest 5th percentile of band level noise for the year was regressed against wind speed data from the National Data Buoy Center station BLTA2 in Bartlett Cove and the resulting relationship was used to predict the contribution of wind to ambient noise levels for each 10-min time period during each of the 3 modeled days. These levels are referred to as “Present Ambient” (PrA) noise levels. To calculate communication masking metrics, a reference ambient noise level (RA) was needed to represent the naturally quiet conditions of historical times. We assumed that Glacier Bay's nighttime ambient noise level could represent this historical reference level because manmade noise is virtually absent at night (and during the winter), and distant ship traffic is only audible when a large vessel transits near the mouth of the bay. Since the difference between median daytime (with shipping) and nighttime ambient noise levels were consistently around 2dB (Supplementary Figure 1), we used 2 dB as our reference ambient level (RA). Therefore, in calculating communication masking metrics (see section Communication Space and Masking Index), we subtracted 2 dB from the Present Ambient (PrA) for each 10-min time period to represent historical naturally quiet conditions.
Vessel Noise
We modeled aggregate noise field levels from all known vessels in Glacier Bay (Figure 1B, Supplementary Table 1). The resultant noise level is referred to as the Present Vessel (PrV) noise level. Resultant noise fields were based on vessel SLs, vessel movements, sound propagation, and biologically appropriate frequency bands, at 10-min intervals, for each sound type on each modeled day. Calibrated noise signatures for individual charter, cruise, government, private, and tour vessels were used, as available, or estimated based on published and unpublished sound signatures for similar type vessels (Kipple, 2004, 2010, 2011; Kipple and Gabriele, 2004; Bassett et al., 2012). SL measurements were not available for the day tour catamaran Baranof Wind which is particularly important because it carries passengers daily from Bartlett Cove to the West Arm glaciers and back, during tourist season. Therefore, the Baranof Wind's SL was calculated based on the analysis of opportunistic recordings from the Bartlett Cove hydrophone, paired with AIS tracks as the Baranof Wind traveled at 14 knots past the hydrophone on 3 days in 2011 with a closest point of approach from the hydrophone of 546 m. This yielded an estimated broadband RMS SL of 180 dB re 1 μPa at 1 m for Baranof Wind. This corresponds with a previous estimate by Frankel and Gabriele (2017) of 177.5 dB re 1 μPa at 1 m.
We simulated the tracks for all vessels that were actually in Glacier Bay on each of the three modeled days in 2011 (NPS, unpublished data, Table 2) using GPS and AIS tracks for individual charter, cruise, government, and tour vessels. If a vessel's track was not available, we created a proxy track constructed from known destination(s) and speed capabilities of that vessel, or used an AIS track from a similar vessel. Vessel specifications for each modeled day, are provided as Supplementary Table 1.
Communication Space and Masking Index
We followed the analytical process proposed by Clark et al. (2009, 2016) to calculate an index of communication masking (M) defined as the proportional area that is available to a vocalizing animal under current noise conditions, relative to the potential area that would have been available under the reference noise condition. M is expressed either as a value between 0 and 1 or as a percentage of lost communication space (CS) under present noise conditions. CS, a synonym for active space, is defined as the area within which receivers of the vocalizing animal's communication sounds have the potential to experience a signal excess (SE) of greater than zero. Signal excess (SE) for any potential receiver depends on the signal source level (SL), transmission loss (TL), signal to noise ratio (SNR), detection threshold (DT), directivity index (DI), and a signal processing gain (SG). Like Clark et al. (2009, 2016), we used a recognition differential (RD) term that combines DT, DI, and SG into a single value that encapsulates the animal's ability to detect and recognize a signal in noise. We used RD to weigh SE, where PR = 0.5 at SE = 0 dB, and PR = 1 at SE ≥ 18 dB (Table 3). It is important to note that the probability of a receiver recognizing the signal decreases as SE approaches zero, but in some cases a signal of interest can be recognized even with SNR < 1 (Clark et al., 2009, 2016; Cholewiak et al., 2018).
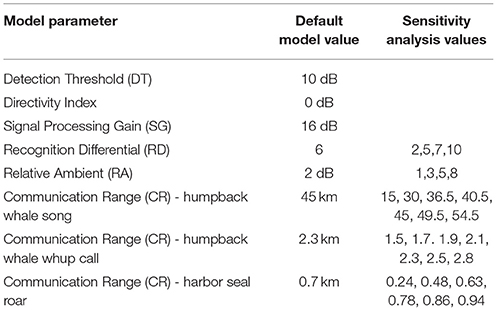
Table 3. Modeling parameters.
We computed CS estimates at 10-min resolution based on a grid of theoretical receivers for three conditions: (1) present ambient noise (PrA) relative to RA only (CSPrA), (2) present ambient noise (PrA) and aggregate vessel noise (PrS) relative to RA (CSPrA+PrS), and (3) aggregate vessel noise (PrS) relative to RA (CSPrS).
Sensitivity Analysis
Modeling, by nature, requires assumptions about parameters within the model. We conducted a sensitivity analysis to investigate how variation in CS estimates can be apportioned to model input parameters, which are subject to some uncertainty. Using the whale, seal, and vessel animats and ambient noise conditions from Day 3, we systematically varied CR, RD, and RA to assess the role of the model parameters (Table 3) on the results, using values based on our best professional judgment and lessons learned from previous work (Hatch et al., 2012; Cholewiak et al., 2018). For all three sound types, we chose RA = 2 dB and RD = 6 dB in the main model. For the sensitivity analysis, we varied RD (2, 5, 6, 7, or 10 dB) and RA (1, 2, 3, 5, or 8 dB). Communication range (CR) variations were specific to each sound type because they differ in source level and propagation. For humpback whale song, we used seven levels of CR between 15 and 54.5 km. For humpback whale calls, we varied CR between 1.5 and 2.8 km. For harbor seal roars, we varied CR between 0.24 and 0.94 km.
Results
Ambient Noise
We converted the year-long acoustic data into diel plots for each of the three species-specific frequency bands (Figure 2, Table 1). These plots show ambient noise levels at a 10-min resolution for each day of 2011 in the frequency ranges of importance to a singing humpback whale (Figure 2A), calling humpback whale (Figure 2B), and a roaring harbor seal (Figure 2C). Each ambient noise profile is influenced seasonally by wind, rain and biological sounds. Although male harbor seals produce a 3-s roar in the 78–147 Hz band (Matthews et al., 2017b) about once per minute (Matthews, 2017), thus also contributing to ambient noise (Matthews et al., 2017a; McKenna et al., 2017), noise level dynamics are positively correlated with vessel activity levels during the seasonal and daily periods of highest vessel activity near the Bartlett Cove hydrophone.
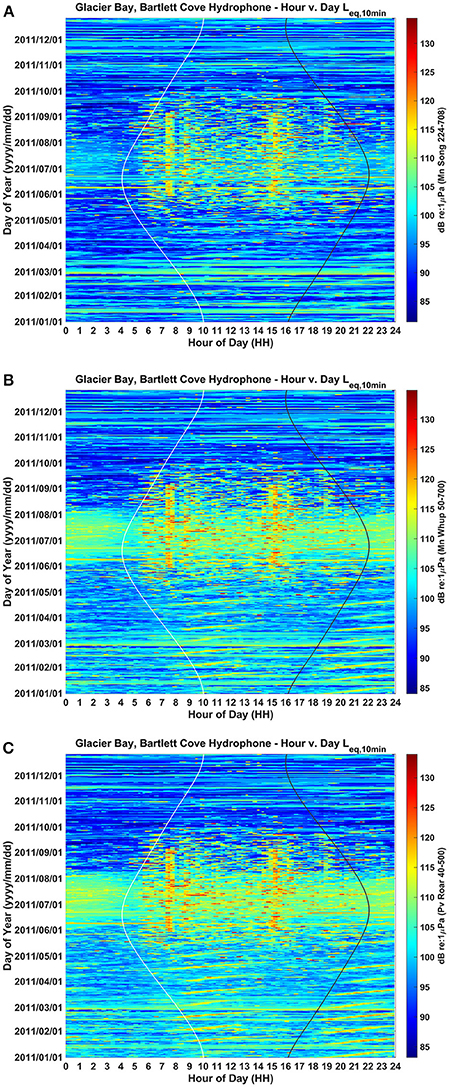
Figure 2. Yearlong and daily patterns of ambient background noise in the frequency bands of (A) humpback whale song (224–708 Hz), (B) humpback whale calls (50–700 Hz), and (C) harbor seal roars (40–500 Hz) as recorded from a single hydrophone located in lower Glacier Bay. Aggregate noise from seasonal vessel traffic is evident during June, July and August, while aggregate noise from daily traffic entering and leaving the Park is evident as two vertical bands around 7:30 AM and 15:30 PM Alaska local time (UST-8 or UST-9). Values are in dB (RMS re 1 μPa). Sunrise and sunset times are represented by white and black vertical lines, respectively.
Seasonally, aggregate noise from vessel traffic is most evident during June, July, and August, tapering off in May and September and much less common from October to April. The 24-h median received sound levels in June, July and August were ~98 dB re: 1 μPa in the song frequency band, 103 dB in the whup frequency band, and 103 dB re: 1 μPa in the roar frequency band (Figure 2; Clark and Ponirakis, in review). For June through August, the daily pattern of traffic entering and leaving the Park resulted in noise levels that were higher during daylight hours (05:00 and 20:00 Alaska Daylight Time [ADT]) than during the night (20:00 to 05:00). This was true in each of the three communication bands: roughly 5 dB louder in the song band, 1.5 dB louder in the whup band and 3 dB louder in the roar band (Figure 2; Supplementary Figure 1; Clark and Ponirakis, in review). Vessel noise was particularly prominent around 7:30 and 15:30 during the summer months when the loudest ambient noise levels of the day occurred, coincident with vessels passing close to the Bartlett Cove hydrophone (Figure 1) during their entrance and departure from the Park.
Communication Space and Masking
Communication masking metrics CS and M varied as a function of species-specific sound type and vessel conditions, summarized as follows.
Humpback Whale Song
Day 1, Moderate Vessel Traffic: The median communication space for singing humpback whales under the reference ambient noise condition, CSRA, was 1,421 km2. When the present ambient and the moderate vessel traffic noise conditions were aggregated, the median communication space, CSPrA+PrV, decreased to 1,200 km2 (Figure 3A). At times, modeled whales under this aggregate noise condition experienced communication space as small as 91 km2 for parts of the day (Supplementary Figure 2A). Similarly, daily median masking levels varied as a function of noise condition: singers lost a total of 35% of their CS under the aggregate, PrA + PrV, moderate traffic noise condition, including 28% which was due to PrV in the moderate vessel traffic condition (Table 4).
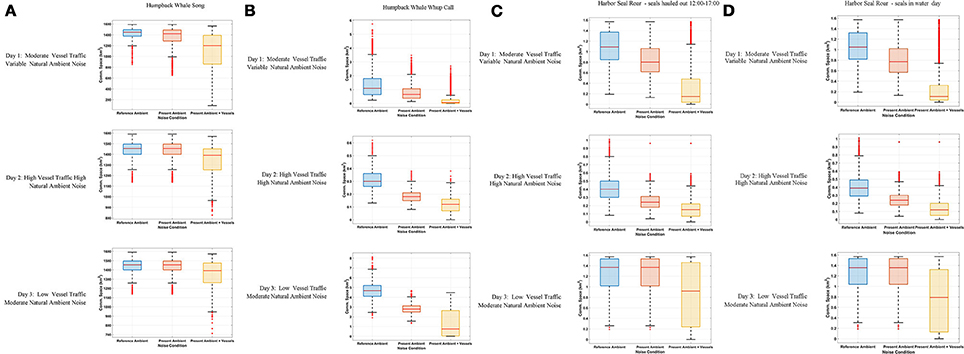
Figure 3. Boxplot showing the distribution of the communication space (CS) metric at 10-min resolution under Reference Ambient (RA), Present Ambient (PrA) and Present Ambient with Vessels (PrA+PrV) in Glacier Bay on three different days within the primary frequency bands of (A) humpback whale song (224–708 Hz), (B) humpback whale calls (50–700 Hz), and (C) harbor seal roars (40–500 Hz) with seals hauling out for part of the day (D) harbor seal roars (40–500 Hz) with seals in the water all day.
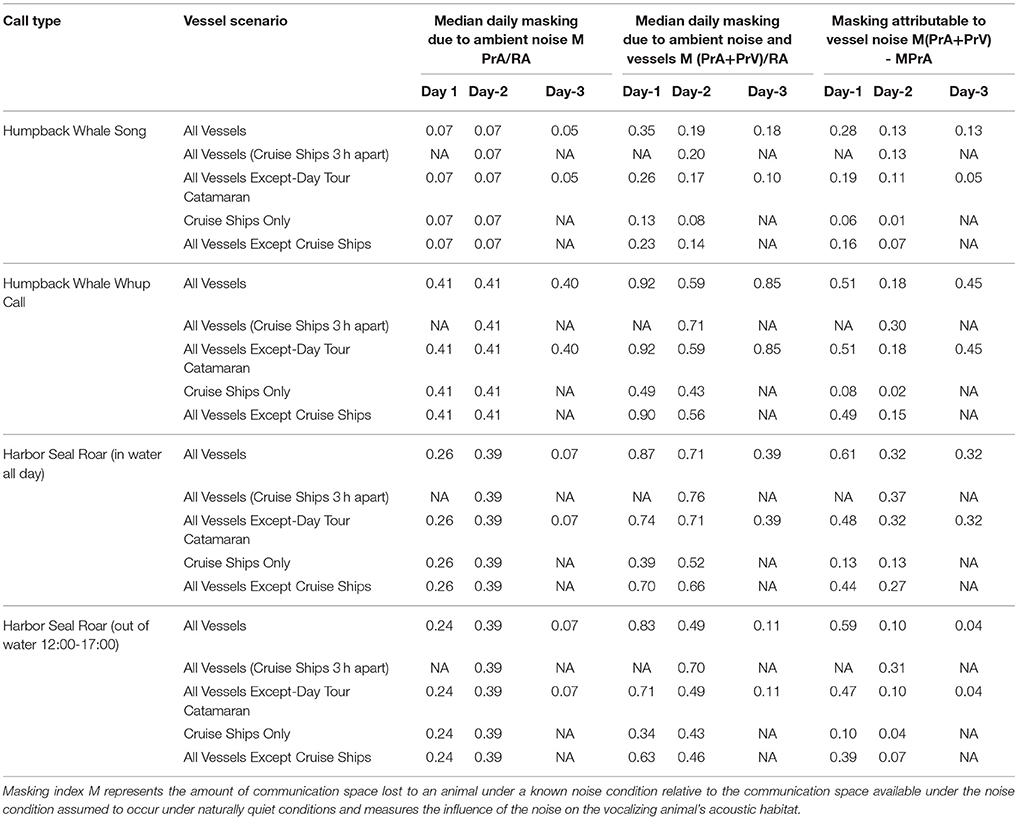
Table 4. Daily median 10-min communication masking resulting from vessels and natural ambient noise.
Day 2, High Vessel Traffic: Under the high vessel traffic condition the median CS for singing humpback whales, decreased to 1,390 km2 under the aggregate noise condition (CSPrA+PrV) from the1,455 km2 available under the reference ambient noise condition (CSRA) (Figure 3A). Modeled whales under the aggregate noise condition experienced communication space as small as 826 km2 for parts of the day (Supplementary Figure 2A). Based on median daily masking indices, singing whales lost a total of 19% of potential CS under the aggregate noise condition, including 13% due to vessel noise (Table 4, Supplementary Figure 3A).
Day 3, Low Vessel Traffic: The median CS for singing whales under natural reference ambient conditions (CSRA) was 1,454 km2, and decreased to 1,389 km2 when vessel noise was included (CSPrA+PrV) (Figure 3A). Minimum CS under the aggregate noise condition was 713 km2 for parts of the day (Supplementary Figure 2A). Median daily masking indices indicate that singers lost a total of 18% of CS under the aggregate noise, 13% of which was due to vessel noise under the low traffic noise condition (Table 4, Supplementary Figure 3A).
Overall, median CS for singers in the models decreased by between 18 and 35% due to combined ambient noise and vessel noise with the highest loss due to vessel noise (28%, Table 4) occurring on the moderate vessel traffic day (Figure 3A).
Humpback Whale Whup
Day 1, Moderate Vessel Traffic: The median CS for calling humpback whales under the moderate vessel traffic, reference ambient noise condition (CSRA) was 1.09 km2, and decreased to 0.07 km2 under the aggregate noise condition (CSPrA+PrV) (Figure 3B). For long periods of time, modeled whales experienced a total loss of CS (0.00 km2) due to combined natural and vessel generated noise (Supplementary Figure 2B). Median daily masking indices indicate that calling whales lost a total of 92% of CS under the aggregate, moderate traffic noise; 51% of which was due to vessels and 41% of which was due to natural ambient noise (Table 4, Supplementary Figure 3B).
Day 2, High Vessel Traffic: On the high traffic day, (which was also a windy day), the median CS for calling humpback whale under reference ambient noise condition (CSRA) was 0.35 km2, and decreased to 0.12 km2 when vessel traffic was included (CSPrA+PrV) (Figure 3B). All of the modeled whales experienced almost a total loss of CS (0.00–0.01 km2) in the morning and afternoon (Supplementary Figure 2B). Based on median daily masking indices, calling whales lost a total of 59% of CS under the aggregate, high traffic noise condition including 41% due to natural ambient noise and 18% due to vessels (Table 4, Supplementary Figure 3B).
Day 3, Low Vessel Traffic: Calling humpback whales under the low vessel traffic, reference ambient noise condition (CSRA) had median CS of 4.68 km2, which declined to 2.79 km2 when vessel traffic was included (CSPrA+PrV) (Figure 3B). Total loss of CS (0.00–0.01 km2) occurred for prolonged time periods for all modeled whales (Supplementary Figure 2B). Calling whales lost a total of 85% under the aggregate, low traffic noise condition, including 40% due to the reference noise condition, an additional 45% due to vessel noise (Table 4, Supplementary Figure 3B).
Overall, median CS for calling humpback whales in the models decreased by between 59 and 92% of CS due to combined ambient noise and vessel noise with the highest losses due to vessel noise occurring on the moderate and low vessel traffic days (51, 45%, respectively, Table 4, Figure 3B).
Harbor Seal Roar
Day 1, Moderate Vessel Traffic: In some model runs for harbor seal underwater communication sounds, we incorporated haul-out behavior that affected their CS as compared with seals that were in the water all day. Median CS for roaring harbor seals that hauled out of the water daily from 12:00 to 17:00 under the reference ambient noise condition (CSRA) was 1.09 km2, and decreased to 0.15 km2 under the aggregate noise condition (CSPrA+PrV) (Figure 3C). The median CS for roaring harbor seals that were in the water all day under the low traffic aggregate noise condition was 0.11 km2 (Figure 3D). In both cases, there were times of day when all modeled seals under the aggregate noise condition experienced a near total loss of CS (0.00–0.01 km2) although this affected seals that were in the water all day to a greater degree (Supplementary Figure 2C). Based on the median daily masking index, roaring seals who hauled out at mid-day lost slightly less total CS (83%) than seals that stayed in the water all day (87%) with 59 vs. 61%, respectively, due to vessel noise under the aggregate moderate traffic noise condition (Table 4, Supplementary Figure 3C).
Day 2, High Vessel Traffic: The median communication space for roaring harbor seals that hauled out of the water under CSRA was 0.39 km2, which decreased to 0.12 km2 CSPrA+PrV when vessel traffic noise was included (Figure 3C). For seals that were in the water all day, median CS was 0.11 km2 (Figure 3D). In both cases, in the morning and afternoon there were times when 20 of 36 modeled seals under the aggregate noise condition experienced a total loss of CS (0.00 km2) (Supplementary Figure 2C). Roaring seals that hauled out of the water from 12:00 to 17:00 lost a total of 49% under the aggregate, high traffic noise condition but only 10% was attributed to vessel traffic noise (Table 4, Supplementary Figure 3C). In contrast, seals that stayed in the water all day lost 71% of CS under the aggregate, moderate traffic noise condition, with 32% due to vessel noise (Table 4).
Day 3, Low Vessel Traffic: The median CS for roaring harbor seals that hauled out of the water under the low vessel traffic under the aggregate vessel noise condition (CSPrA+PrV) was 0.79 km2 as compared to 0.11 km2 for seals that were in the water all day (Figures 3C,D). In both cases, there were times of day when 6 of 36 modeled seals under the aggregate noise condition experienced a total loss of CS (0.00 km2) (Supplementary Figure 2C). Seals that stayed in the water all day lost 39% of CS under the aggregate, moderate traffic noise condition whereas seals that hauled out lost only 11% of CS, based on median daily masking indices (Table 4, Supplementary Figure 3C).
Overall, for roaring harbor seals, median CS in the models decreased by between 39 and 87% of CS due to combined ambient noise and vessel noise with the highest loss due to vessel noise (61%, Table 4) occurring on the moderate vessel traffic day (Figure 3B). To varying degrees, seals that hauled out of the water lost up to 32% less CS than seals that stayed in the water all day.
Effects of Management Action on Available Communication Space
Cruise ships alone contributed 1–16% of the daily median masking level attributable to vessels, with highest levels under moderate vessel traffic (Table 4). The single cruise ship on Day 1 had a much larger influence on CS because that day had a lower vessel traffic overall. For singing whales and roaring seals, removing the day tour catamaran decreased the daily median masking level attributable to vessels by 0–13%, and had the least impact on Day 2 with high vessel traffic and the highest natural ambient noise. The substantial remainder of lost CS attributable to vessels (10–51%) was due to noise from other vessel types (Table 4, Supplementary Table 1).
The moderate vessel traffic condition, with one cruise ship, showed substantially more lost CS attributable to vessels (35–87%) than the high vessel traffic (19–71%), which had two cruise ships. On the two-ship day, scheduling cruise ships to arrive and depart within an hour of each other (rather than staggering them 3 h apart) restored the most lost CS to calling whales (12%) and roaring seals that hauled out at mid-day (12%), followed by roaring seals that stayed in the water all day (5%), with no improvement in CS for singing whales (Table 4).
Sensitivity Analysis
Using the model parameters for Day 3 as a basis, when we varied the Recognition Differential, RD, which encapsulates the animal's ability to detect and recognize a signal in noise, we found the largest mean difference from the default model (where RD was set at 6 for all simulations) at RD = 2, with estimates of masking due to natural ambient noise and vessels ranging from 8 to 12% higher than our main model (Table 5A). Our highest value of RD (RD = 10) gave results that were 5 to 12% lower than our main model. However, most differences were in the 1 to 3% range.
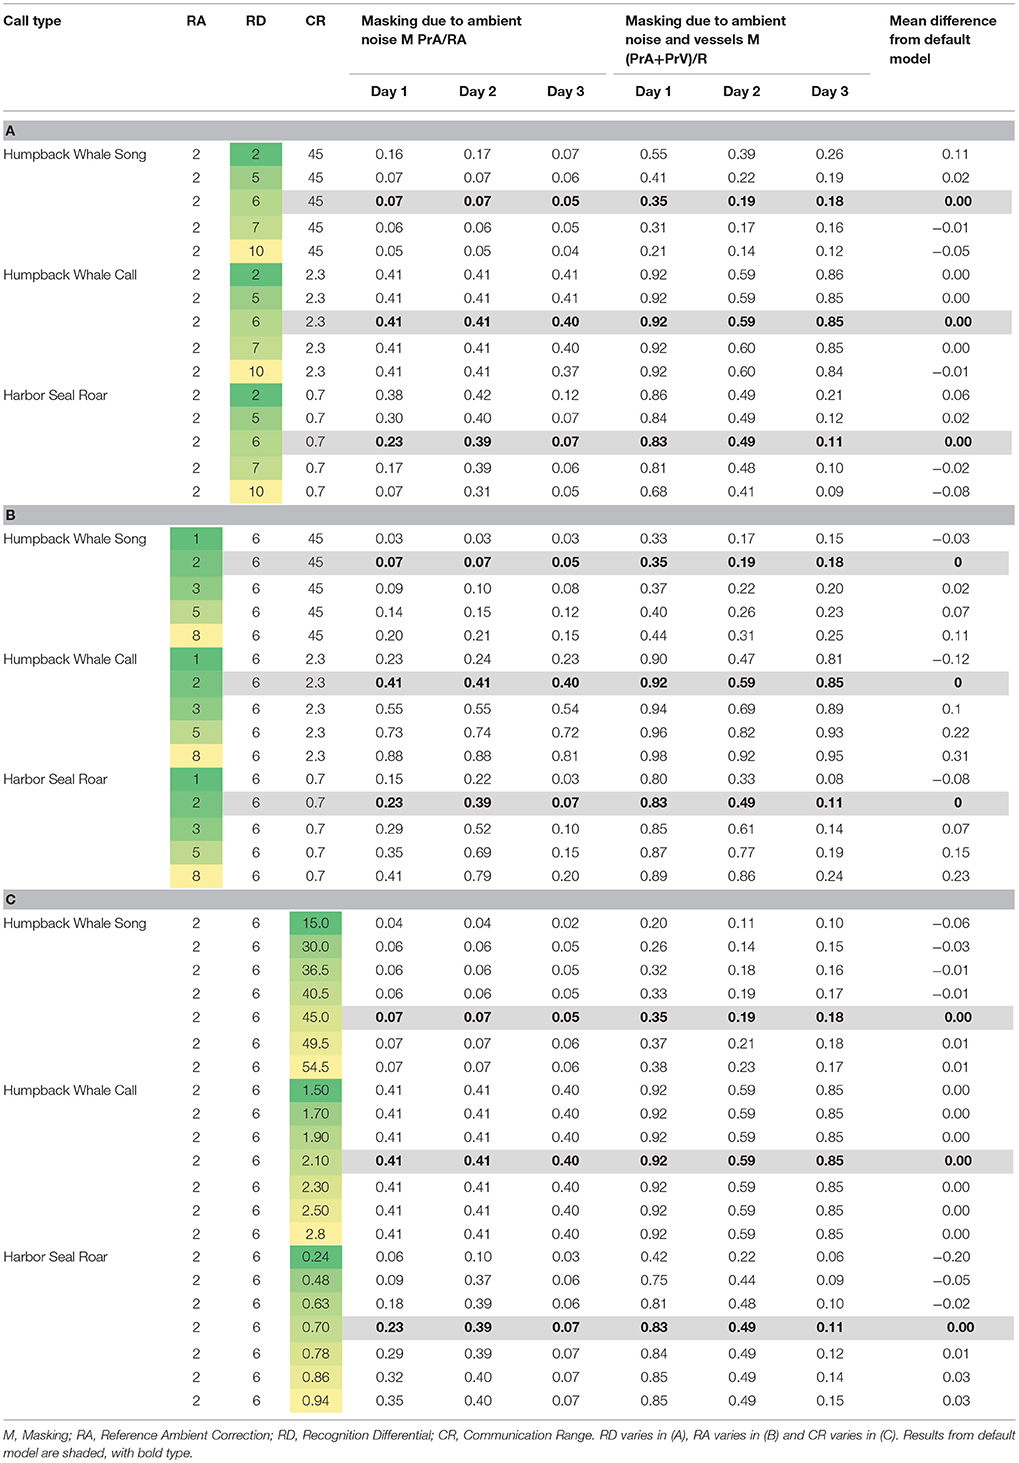
Table 5. Varying model parameters to compare daily median of 10-min communication masking levels resulting from vessels and natural ambient noise.
When we varied the value of Reference Ambient correction factor (RA), the resulting masking values were within 18% of the findings from the default model (where RA was set at 2 dB, Supplementary Figure 1), with the largest masking values when RA was increased to 8 dB (Table 5B). Overall, varying RA between 1 and 8 dB yielded masking estimates within 2 to 13 percentage points of the default model. RA exerted the strongest effects on Day 2 (the day with the most vessels and highest natural ambient noise levels) for whale calls and seal roars.
Communication Range (CR) was varied between 15 and 54.5 km for humpback whale song, which yielded masking values within 6% of the default model (Table 5C). For humpback whale whups, varying CR between 1.5 and 2.8 km yielded masking estimates that were no different from the default model. For harbor seal roars, varying CR between 0.24 and 0.94 km, yielded masking estimates within 1–5% of the default model, except that when CR was set at 0.24 km the masking estimate was 20% lower than the default model.
Discussion
In this study, we implemented models to characterize seasonal and diurnal patterns of ambient noise under different vessel traffic conditions in GBNP, one of the largest marine protected areas in the Northern Hemisphere. Our results demonstrate that both natural and manmade noise are seasonally and diurnally prominent in Glacier Bay's underwater sound environment and likely exert substantial impacts on the area over which harbor seals and humpback whales are able to communicate. The communication masking indices we calculated, using the best available empirical data, provided a highly informative first look at the potential effects of aggregate vessel noise in GBNP on communication for these two acoustically active species. We illustrated the usefulness of this information to protected area managers by examining the acoustic contributions of cruise ships relative to the day tour catamaran and aggregate vessel traffic (Table 4) and determining that synchronizing ship schedules could slightly improve the availability of acoustic habitat for humpback whale and harbor seal communication. Moreover, we demonstrated that while the masking indices were sensitive to varying some of the model parameters, the resulting differences were usually less than differences attributable to the disparate amounts of natural and vessel-generated noise on each modeled day.
Successful communication has direct consequences to the fitness of individual animals (Brumm and Slabbekoorn, 2005) and plays an indirect but vital role in maintaining the complex animal social networks that affect survival and reproductive success (Snijders and Naguib, 2017). The effects of vessel noise on behavior pertinent to survival and reproductive success have been documented in marine vertebrate and invertebrates (Lusseau et al., 2009; Wale et al., 2013; Voellmy et al., 2014a,b). While few studies have been able to document population level effects (Bejder et al., 2006), it is reasonable to presume that when noise interferes with communication, its effects can be far reaching and ecologically significant (Barber et al., 2009), particularly in highly social aquatic species in which acoustics is the dominant modality. In this study, we demonstrated that vessel noise decreases the area over which humpback whale songs and harbor seal roars can reach their intended listeners, it seems likely that this could reduce mating opportunities to some degree. Similarly, having demonstrated that vessel noise substantially decreases the area over which humpback whale whup calls are available to conspecifics, it is plausible that these lost communication opportunities have implications for foraging success, calf rearing, and social behavior. We know that these pervasive communication behaviors are important to vital life functions but it will be difficult to directly quantify the fitness consequences of communication masking in terms of the reduced caloric intake, survival, or reproductive success of individuals. Moreover, the efficacy of vocal frequency shifts and the energetic costs of compensating for a noisy ambient noise environment by vocalizing louder or more often, and the ramifications of postponing calls until conditions improve are not well-understood. Nevertheless, these results represent important first steps toward understanding communication masking in humpback whales and harbor seals in GBNP, and how different combinations of vessels could be managed so as to reduce their aggregate impacts on the Park's acoustic environment and marine mammals.
Ambient Noise
The aggregate of vessel noise within GBNP strongly influences the underwater acoustic environment with a noticeable seasonal and diurnal pattern (Figure 2, Supplementary Figure 1). Vessel noise associated with summer visitation to the Park, primarily in the daylight hours, affected all the dominant frequency bands used by all three sound types, but particularly the harbor seal roar and humpback whale call. GBNP is one of the few places in the world where it is possible replicate historical underwater acoustic environment, due to its remote location and the fact that the vast majority of vessel traffic results from regulated seasonal tourism that predominantly occurs in the daytime. Year round, even in the absence of vessel traffic, Leq broadband noise demonstrated that nighttime levels were about 2 dB lower than during the day (Supplementary Figure 1).
Communication Space and Masking
Marine mammals and their communication systems evolved in an ocean where wind, rain and other natural sounds at times reduced their ability to communicate, but manmade noise was not a factor. The days we chose to model illustrated typical patterns of natural sound in GBNP, with high wind-generated ambient noise on summer afternoons, and a tendency for natural noise levels to decrease overnight (Supplementary Figure 1). Natural and manmade noise both exert a tangible influence on the frequency bands used for communication by GBNP marine mammals (Figure 3).
In our choice of reference ambient (RA), our goal was to capture the optimal communication environment available to humpback whales and harbor seals and avoid including any manmade noise. Based on the best available knowledge for GBNP, the 5th percentile ambient noise statistic was the best approximation of natural ambient noise levels devoid of manmade noise events; even the 25th percentile levels showed evidence of vessel noise events (Clark and Ponirakis, in review). Fine-scale sensitivity analysis could help determine what noise statistic between the 5 and 25th percentile would exclude manmade noise and still include some of the louder natural sound conditions in GBNP. Our choice of RA means that our analysis emphasizes the extent to which wind, rain and other natural sounds result in communication masking but do not affect our ability to discern masking as a result of vessel traffic. Future researchers applying communication masking metrics to different study areas will need to carefully consider the unique attributes of the underwater sound environment in their area and select a reference ambient noise condition that best represents natural quiet. Above and beyond the effects of natural ambient sound levels, vessel traffic conditions during GBNP's summer visitor season result in substantial communication masking for whales and seals, especially for lower frequency communication sounds (Figure 3). In short, vessel noise affects marine mammal communication in GBNP in summer, even on the days with relatively low levels of vessel traffic.
The amount of communication masking was strongly affected by the frequency content of a communication sound. Harbor seal roars, a low frequency, relatively low source level male display had the highest median daily loss of CS (27–44%) to vessel noise even in the absence of cruise ships, especially during the daytime (Table 4, Supplementary Figures 2C, 3C). Roaring seals lost 4–28% less CS when we incorporated mid-day haul-out behavior (Table 4) so this behavioral trait may reduce the influence of communication masking. However, male harbor seals roar at all hours of the day, thus the predominance of daytime vessel noise still reduces the CS available to displaying males (Matthews et al., 2017a; McKenna et al., 2017) even if some of their conspecifics are out of the water.
Humpback whale whup calls, which are low source level, short duration sounds of relatively low frequency (Table 2) experienced median levels of lost CS (18–51%) during all three vessel conditions, even in the absence of cruise ships (15–49%), and especially during daylight hours when most vessels were in the bay (Table 4, Supplementary Figures 2B, 3B). Humpback whales produce these putative contact calls at all hours of the day (Wild and Gabriele, 2014), thus reduced or lost communication opportunities likely have a tangible biological cost to the individual whale. Collaborative work in progress that suggests that humpback whales in GBNP adjust their call rate and/or loudness to accommodate vessel noise and are less likely to call in higher vessel noise conditions (Fournet et al., 2018a).
The loud and higher frequency humpback whale song (Table 2) experienced less masking overall and cruise ship noise appeared less important to song masking than the other types of vessels (Table 4). Daily median values for singing whales indicate that they lost 18–35% of their CS under aggregate vessel noise conditions on the 3 modeled days. Notably, singing humpback whales have also been observed to stop singing abruptly when vessel noise or presence disrupts their behavior (GBNP, unpublished data), representing a complete loss of communication opportunity. The impact of lost communication opportunities on male reproductive success is difficult to assess, especially given that it is unclear how often mating occurs in high-latitude habitats, although song occurs there (Gabriele and Frankel, 2002; Clark and Clapham, 2004). Although scientific understanding of song function is incomplete, it is unwise to discount the biological importance of song in high-latitudes.
Effects of Management Action on Available Communication Space
Ambient noise levels show two strong bands of noise during the morning passage of vessels into the Park and the evening passage out of the Park (Figure 2). Communication masking is clearly higher in noise conditions with vessels relative to those without vessels (Figure 3). Independent of cruise ship numbers, daily CS was strongly influenced by the aggregate noise from other vessels. The day tour catamaran alone showed a fairly small influence on lost CS overall, which is not surprising given that it was a single event in the context of the aggregate of numerous other vessels. Vessel traffic schedule management has the potential to mitigate noise impacts: synchronizing the arrival and departure timing of ships restored up to 12% of lost CS and was especially beneficial for calling whales.
Some results did not conform to our expectation that higher numbers of vessels would generate greater communication masking, but the reasons for this discrepancy are informative. The lowest losses of CS occurred under the low vessel traffic condition (17 vessels total and no cruise ship). However, it was surprising that moderate vessel traffic (28 vessels including one 1,423 passenger cruise ship and one U.S. Coast Guard cutter) produced more CS loss than the higher traffic day (34 vessels including two cruise ships equipped to carry a total of 4,690 passengers) (Figure 3, Supplementary Figures 2, 3). While the Coast Guard vessels that happened to be present on our modeled days are not a frequent occurrence, their greater sound output (Supplementary Table 1) which is equivalent to cruise ships or mega-yachts that often visit (GBNP, unpublished data) skewed the results of the low and medium traffic days that were defined largely by the number of cruise ships. The finding illustrates that the type of vessel traffic is equally important as the number of vessels and, moreover, that the number of large ships can be less important than their noise characteristics (Kipple, 2004, 2010, 2011). Vessel behavior is also an important determinant of the resulting acoustic environment (McKenna et al., 2017). Managers seeking to mitigate underwater noise may be able to select quieter ships, and/or implement vessel speed limits (McKenna et al., 2017) as opposed to simply allowing fewer ships (and visitors) and still minimize communication masking. This is quite important given the National Park Service mission to preserve resources and allow visitor access to parks. The sheer variety of vessels that enter GBNP on a given summer day is highly variable, and has perhaps the strongest effect on the acoustic environment (Supplementary Table 1). Future modeling and continued efforts to obtain calibrated sound signatures for a range of vessel types will allow managers to weigh the acoustic influence of various vessels types, enabling access to various user groups with the least impact on the acoustic environment.
The nine scenarios reported here are just a handful of the numerous iterations that could examine a variety of questions relevant to management. By modeling a greater number of days and controlling for ambient noise levels and the exact vessels in each simulation, future efforts will allow us to move toward attributing the differences to a specific factor or factors. For example, reduced ship speeds result in decreased ambient noise levels (McKenna et al., 2017) and sound exposure levels to humpback whales (Frankel and Gabriele, 2017) in Glacier Bay and it stands to reason that communication masking would follow the same pattern.
Sensitivity Analysis
The communication masking exercise was sensitive to varying the parameters used, but overall, we found more variation due to differences in natural and vessel-generated ambient noise between days than we found by varying CR, RA, and RD. The greatest change occurred for harbor seal roar with a sudden increase in masking if CR was set at 0.24 rather than the more realistic higher values (Table 5C). This suggests underestimating CR can lead to underestimation of communication masking. In contrast, adjusting CR for humpback whale whup had no visible effect on estimates of communication masking (Table 5C). Our highest value of RD (RD = 10) gave results that were 5 to 12% lower than our main model. Varying RA yielded the largest communication masking values when RA was increased to 8 dB (Table 5B). Given our empirical approach to calculating RA (Supplementary Figure 1) we presume that 2 dB is a more appropriate value for GBNP.
Conclusions and Next Steps
The ecological ramifications of noise interference are prominent in dialogs about biological resource conservation in natural areas (Barber et al., 2011) despite uncertainties about individual fitness consequences. While some vertebrates are known to adapt their communication sounds to compensate for noisy environments (Brumm and Slabbekoorn, 2005; Slabbekoorn and Peet, 2003; Scheifele et al., 2005; Parks et al., 2010; Snijders and Naguib, 2017), this phenomenon and its biological costs are not well-understood (Patricelli and Blickley, 2006). While these unknowns represent the next challenges in the conservation of acoustic habitats, it is known that marine mammals worldwide face environmental changes that are increasingly widespread, complex and difficult to predict. Mitigating manmade noise to maintain high quality acoustic habitats is thus even more important to maximizing marine mammal survival on decadal and evolutionary time scales.
The tools are clearly in place to conduct sophisticated simulations of marine mammal communication masking, and these methods continue to develop. Important next steps toward facilitating effective conservation of the underwater sound environments will involve putting these tools in the hands of marine protected area managers for ongoing use. Future investigators adapting these methods to other areas and/or species may find challenges in areas where the acoustic and oceanographic environments are undocumented, or in species whose communication sound characteristics are not well-understood. A key step that protected area managers can take to help bring communication masking modeling tools into routine use is to begin collecting representative vessel sound signatures and baseline ambient noise measurements that can later be used to inform such models.
Underwater acoustics is a complex discipline that many managers without advanced training in acoustics find difficult to understand, potentially creating a formidable deterrent to using the resulting information in management decisions. And yet, noise mitigation is one of management's most powerful tools because, unlike many other types of habitat degradation, noise pollution responds immediately to the reduction or removal of noise. Simple metrics and visualizations (for example, the animation in Supplementary Material) like those used here can help managers understand how the relative contributions of vessel classes and operating conditions reduce animal communication opportunities. Quantitative metrics that create a common currency for describing noise impacts help promote conversations among marine protected area managers, and facilitate the testing and sharing of methods to mitigate the negative effects of elevated noise levels. Fostering this understanding more broadly in the management community is essential to improving acoustic habitats for acoustically active species in natural areas worldwide.
Author Contributions
Conceived and designed the model simulations: CC, CG, and DP. Collected and analyzed the data: CG, DP, CC with contributions to data collection from JW and PV. Advised on the analysis: JW. Wrote the manuscript: CG, with contributions to drafting, critical review, and editorial input from CC, DP, JW, and PV.
Funding
Major funding for this project was provided by Glacier Bay National Park and Preserve's Marine Management Funds and supplemented by the Cornell University Bioacoustics Research Program. This work was conducted through the National Park Service's Pacific Northwest Cooperative Ecosystem Studies Unit Agreement #9815060532.
Conflict of Interest Statement
The authors declare that the research was conducted in the absence of any commercial or financial relationships that could be construed as a potential conflict of interest.
Acknowledgments
Thanks to the many vessel operators who provided vessel specifications and/or voluntarily participated in vessel sound signature measurements, including Holland America and Princess Cruise Lines, with funding from the NPS Ocean Alaska Science Learning Center. Thanks to Blair Kipple, Russ Dukek and Larry Arndt at the Naval Surface Warfare Center, Carderock Division and Mantech, Incorporated, for their longstanding efforts to maintain and improve the data collection and analysis systems that have so greatly advanced the understanding of Glacier Bay's underwater sound environment. Thanks to Christine Erbe and Christopher Bassett for providing vessel signature data, and Peter Dugan, Marian Popescu, Mike Pitzrick, Bobbi Estabrook for vital technical assistance. Many GBNP staff and volunteers helped with the underwater sound monitoring program over the years. This work was funded by GBNP commercial user fees. The manuscript was improved by comments from three reviewers.
Supplementary Material
The Supplementary Material for this article can be found online at: https://www.frontiersin.org/articles/10.3389/fmars.2018.00270/full#supplementary-material
Audio 1. Glacier Bay_Humpback_whale_song_09_29_2009_15sec.
Audio 2. Glacier Bay_Humpback whup_volley_04_22_2013_18sec.
Audio 3. Glacier Bay_Harbor_seal roars 06-22_2001_15sec.
Video 1. Communication space model for humpback whale whup Day2.
Footnotes
1. ^In the initial years of this project we used customized software code referred to as SEDNA (Sound Ecology, Detection, and Noise Analysis), but this evolved into a more comprehensive system now referred to as Raven-X containing SEDNA and DeLMA-HPC (Detection Classification for Machine learning using High Performance Computing).
References
Andrew, R. K., Howe, B. M., Mercer, J. A., and Dzieciuch, M. A. (2002). Ocean ambient sound: comparing the 1960s with the 1990s for a receiver off the California coast. Acoust. Res. Lett. Online 3, 65–70. doi: 10.1121/1.1461915
Au, W. W., Pack, A. A., Lammers, M. O., Herman, L. M., Deakos, M. H., and Andrews, K. (2006). Acoustic properties of humpback whale songs. J. Acoust. Soc. Am. 120, 1103–1110. doi: 10.1121/1.2211547
Barber, J. R., Burdett, C. L., Reed, S. E., Warner, K. A., Formichella, C., Crooks, K. R., et al. (2011). Anthropogenic noise exposure in protected natural areas: estimating the scale of ecological consequences. Lands. Ecol. 26, 1281–1295. doi: 10.1007/s10980-011-9646-7
Barber, J. R., Crooks, K. R., and Fristrup, K. M. (2009). The costs of chronic noise exposure for terrestrial organisms. Trends Ecol. Evol. 25, 180–189. doi: 10.1016/j.tree.2009.08.002
Bassett, C., Polagye, B., Holt, M., and Thomson, J. (2012). A vessel noise budget for Admiralty Inlet, Puget Sound, Washington (USA). J. Acoust. Soc. Am. 132, 3706–3719. doi: 10.1121/1.4763548
Bejder, L., Samuels, A. M., Whitehead, H. A., Gales, N., Mann, J., Connor, R., et al. (2006). Decline in relative abundance of bottlenose dolphins exposed to long-term disturbance. Conserv. Biol. 20, 1791–1798. doi: 10.1111/j.1523-1739.2006.00540.x
Bigg, M. A. (1981). “Harbour seal, Phoca vitulina Linnaeus, 1758 and Phoca largha Pallas, 1811,” in Handbook of Marine Mammals, eds S. H. Ridgeway and R. J. Harrison (London: Academic Press), 1–27.
Blair, H. B., Merchant, N. D., Friedlaender, A. S., Wiley, D. N., and Parks, S.E. (2016). Evidence for ship noise impacts on humpback whale foraging behaviour. Biol. Lett. 12:20160005. doi: 10.1098/rsbl.2016.0005
Brenowitz, E. A. (1982). The active space of red-winged blackbird song. J. Comp. Physiol. 147, 511–522.
Brumm, H., and Slabbekoorn, H. (2005). Acoustic communication in noise. Adv. Stud. Behav. 35, 151–209. doi: 10.1016/S0065-3454(05)35004-2
Buck, J. R., and Tyack, P. L. (2000). Response of gray whales to low frequency sounds. J. Acoust. Soc. Am. 107, 2774. doi: 10.1121/1.428908
Cholewiak, D., Clark, C. W., Frankel, A., Hatch, L. T., Ponirakis, D., Risch, D., et al. (2018). Communicating amidst the noise: modeling the aggregate effect of ambient noise and multiple vessel types on the communication space of baleen whales in the Stellwagen Bank National Marine Sanctuary. Endanger. Species Res. 36, 59–75. doi: 10.3354/esr00875
Clark, C. W., and Clapham, P. J. (2004). Acoustic monitoring on a humpback whale (Megaptera novaeangliae) feeding ground shows continual singing into late spring. Proc. R. Soc. Lond. B 271, 1051–1057. doi: 10.1098/rspb.2004.2699
Clark, C. W., and Ellison, W. T. (2004). “Potential use of low-frequency sounds by baleen whales for probing the environment: evidence from models and empirical measurements,” in Echolocation in Bats and Dolphins, eds J. Thomas, C. Moss, and M. Vater (Chicago, IL: The University of Chicago Press), 564–582.
Clark, C. W., Ellison, W. T., Southall, B. L., Hatch, L., Van Parijs, S. M., Frankel, A., et al. (2009). Acoustic masking in marine ecosystems: intuitions, analysis, and implication. Mar. Ecol. Prog. Ser. 395, 201–222. doi: 10.3354/meps08402
Clark, C. W., Ellison, W. T., Southall, B. L., Hatch, L., Van Parijs, S. M., Frankel, A., et al. (2016). Acoustic masking in marine ecosystems: intuitions, analysis, and implication. Mar. Ecol. Prog. Ser. 254:281.
Dalla Rosa, L., Secchi, E. R., Maia, Y. G., Zerbini, A. N., and Heide-Jorgensen, M. P. (2008). Movements of satellite-monitored humpback whales on their feeding ground along the Antarctic Peninsula. Polar Biol. 31, 771–781. doi: 10.1007/s00300-008-0415-2
Darling, J. D., Jones, M. E., and Nicklin, C. P. (2006). Humpback whale songs: do they organize males during the breeding season? Behaviour 143, 1051–1101. doi: 10.1163/156853906778607381
Deecke, V. B., Slater, P. J. B., and Ford, J. K. B. (2002). Selective habituation shapes acoustic predator recognition in harbour seals. Nature 420, 171–173. doi: 10.1038/nature01030
Di Iorio, L., and Clark, C. W. (2009). Exposure to seismic survey alters blue whale acoustic communication. Biol. Lett. 6, 51–54. doi: 10.1098/rsbl.2009.0651
Dolphin, W. F. (1987a). Dive behavior and estimated energy expenditure of foraging humpback whales in Southeast Alaska. Can. J. Zool. 65, 354–362. doi: 10.1139/z87-055
Dolphin, W. F. (1987b). Ventilation and dive patterns of humpback whales, (Megaptera novaeangliae), on their Alaskan feeding grounds. Can. J. Zool. 65, 83–90. doi: 10.1139/z87-013
Dugan, P. J., Ponirakis, D. W., Zollweg, J. A., Pitzrick, M. S., Morano, J. L., Warde, A. M., et al. (2011). SEDNA – bioacoustic analysis toolbox: Matlab platform to support high performance computing, noise analysis, event detection and event modeling. Proc. IEEE Oceans 2011, 1–10. doi: 10.23919/OCEANS.2011.6107289
Dunlop, R. A., Cato, D. H., and Noad, M. J. (2014). Evidence of a Lombard response in migrating humpback whales (Megaptera novaeangliae). J. Acoust. Soc. Am. 136, 430–437. doi: 10.1121/1.4883598
Ellison, W. T., Racca, R., Clark, C. W., Streever, B., Frankel, A. S., Fleishman, E., et al. (2016). Modeling the aggregated exposure and responses of bowhead whales Balaena mysticetus to multiple sources of anthropogenic underwater sound. Endanger. Species Research 30, 95–108. doi: 10.3354/esr00727
Ellison, W. T., Southall, B. L., Clark, C. W., and Frankel, A. (2012). A new context-based paradigm to assess behavioral responses of marine mammals to sound. Conserv. Biol. 26, 21–28. doi: 10.1111/j.1523-1739.2011.01803.x
Erbe, C. (2002). Underwater noise of whale-watching boats and potential effects on killer whales (Orcinus orca), based on an acoustic impact model. Mar. Mamm. Sci. 18, 394–418. doi: 10.1111/j.1748-7692.2002.tb01045.x
Fournet, M. E., Gabriele, C. M., Sharpe, F., Straley, J. M., and Szabo, A. (2018a). Feeding calls produced by solitary humpback whales. Mar. Mam. Sci. 34, 851–865. doi: 10.1111/mms.12485
Fournet, M. E. (2018). Humpback Whale Calling Behavior in Southeast Alaska: a Study in Acoustic Ecology and Noise. Ph.D. dissertation, Oregon State University.
Fournet, M. E., Matthews, L. P., Gabriele, C. M., Mellinger, D. K., and Klinck, H. (2018b). Source levels of foraging humpback whale calls. J. Acoust. Soci. Am. 143:EL105. doi: 10.1121/1.5023599
Fournet, M. E., Szabo, A., and Mellinger, D. K. (2015). Repertoire and classification of non-song calls in Southeast Alaskan humpback whales (Megaptera novaeangliae). J. Acoust. Soc. Am. 137, 1–10. doi: 10.1121/1.4904504
Frankel, A. S., Ellison, W. T., and Buchanan, J. (2002). Application of the Acoustic Integration Model (AIM) to predict and minimize environmental impacts. IEEE Proc. 3, 1438–1443. doi: 10.1109/OCEANS.2002.1191849
Frankel, A. S., and Gabriele, C. M. (2017). Predicting the acoustic exposure of humpback whales from cruise and tour vessel noise in Glacier Bay, Alaska, under different management strategies. Endanger. Species Res. 34, 397–415. doi: 10.3354/esr00857
Gabriele, C. M., and Frankel, A. S. (2002). The occurrence and significance of humpback whale songs in Glacier Bay, Southeastern Alaska. Arct. Res. United States 16, 42–47.
Gabriele, C. M., Neilson, J. L., Straley, J. M., Baker, C. S., Cedarleaf, J. A., and Saracco, J. F. (2017). Natural history, population dynamics, and habitat use of humpback whales over 30 years on an Alaska feeding ground. Ecosphere 8:e01641. doi: 10.1002/ecs2.1641
Hatch, L., Clark, C., Merrick, R., Van Parijs, S., Ponirakis, D., Schwehr, K., et al. (2008). Characterizing the relative contributions of large vessels to ocean noise fields: a case study using the Gerry, E. Studds Stellwagen Bank National Marine Sanctuary. Environ. Manage. 42, 735–752. doi: 10.1007/s00267-008-9169-4
Hatch, L. T., Clark, C. W., Van Parijs, S. M., Frankel, A. S., and Ponirakis, D. W. (2012). Quantifying loss of acoustic communication space for right whales in and around a U.S. national marine sanctuary. Conserv. Biol. 26, 983–994. doi: 10.1111/j.1523-1739.2012.01908.x
Hatch, L. T., Wahle, C. M., Gedamke, J., Harrison, J., Laws, B., Moore, S. E., et al. (2016). Can you hear me here? Managing acoustic habitat in US waters. Endanger. Species Res. 30, 171–186. doi: 10.3354/esr00722
Hayes, S. A., Kumar, A., Costa, D. P., Mellinger, D. K., Harvey, J. T., Southall, B. L., et al. (2004). Evaluating the function of the male harbour seal, Phoca vitulina, roar through playback experiments. Anim. Behav. 67, 1133–1139. doi: 10.1016/j.anbehav.2003.06.019
Holt, M. M., Noren, D. P., Veirs, V., Emmons, C. K., and Veirs, S. (2009). Speaking up: killer whales (Orcinus orca) increase their call amplitude in response to vessel noise. J. Acoust. Soc. Am. 125, 29–32. doi: 10.1121/1.3040028
Houghton, J., Holt, M. M., Giles, D. A., Hanson, M. B., Emmons, C. K., Hogan, J. T., et al. (2015). The relationship between vessel traffic and noise levels received by Killer Whales (Orcinus orca). PLoS ONE 10:e0140119. doi: 10.1371/journal.pone.0140119.
Ivaschchenko, Y. V., Clapham, P. J., and Brownell, J. R. L. (2013). Soviet catches of whales in the North Pacific: revised totals. J. Cetacean Res. Manage. 13, 59–71.
Jensen, F. H., Bejder, L., Wahlberg, M., Aguilar Soto, N., Johnson, M., and Madsen, P. T. (2009). Vessel noise effects on delphinid communication. Mar. Ecol. Prog. Ser. 395, 161–175. doi: 10.3354/meps08204
Kipple, B. M. (2004). Coral Princess Underwater Acoustic Levels. Bremerton, WA: Naval Surface Warfare Center; Detachment Bremerton.
Kipple, B. M. (2010). Volendam Underwater Acoustic Levels. Bremerton, WA: Naval Surface Warfare Center; Detachment Puget Sound).
Kipple, B. M. (2011). Diamond Princess Underwater Acoustic Levels. Bremerton, WA: Naval Surface Warfare Center; Detachment Puget Sound.
Kipple, B. M., and Gabriele, C. M. (2004). Glacier Bay Watercraft Noise - Noise Characterization for Tour, Charter, Private and Government Vessels. Bremerton, WA: Naval Surface Warfare Center.
Lengagne, T., and Slater, P. J. (2002). The effects of rain on acoustic communication: tawny owls have good reason for calling less in wet weather. Proc. R. Soc. Lond. B Biol. Sci. 269, 2121–2125. doi: 10.1098/rspb.2002.2115
Lohr, B., Wright, T. F., and Dooling, R. J. (2003). Detection and discrimination of natural calls in masking noise by birds: estimating the active space of a signal. Anim. Behav. 65, 763–777. doi: 10.1006/anbe.2003.2093
Lusseau, D., Bain, D. E., Williams, R., and Smith, J. C. (2009). Vessel traffic disrupts the foraging behavior of southern resident killer whales Orcinus orca. Endanger. Species Res. 6, 211–221. doi: 10.3354/esr00154
Malme, C. I., Miles, P. R., and McElroy, P. T. (1982). “Acoustic environment of humpback whales in Glacier Bay and Frederick Sound, Alaska,” in Acoustical Society of America: 102nd Meeting (Cambridge, MA).
Marten, K., and Marler, P. (1977). Sound transmission and its significance for animal vocalization. Behav. Ecol. Sociobiol. 2, 271–290.
Mathews, E. A., and Pendleton, G. W. (2006). Declines in harbor seal (Phoca vitulina) numbers in Glacier Bay National Park, Alaska, 1992-2002. Mar. Mamm. Sci. 22, 167–189. doi: 10.1111/j.1748-7692.2006.00011.x
Matthews, L. P. (2017). Harbor Seal (Phoca vitulina richardii) Reproductive Advertisement Behavior and the Effects of Vessel Noise. Ph.D. dissertation, Syracuse University.
Matthews, L. P., Gabriele, C. M., and Parks, S. E. (2017a). The Role of season, tide, and diel period in the presence of Harbor Seal (Phoca vitulina) breeding vocalizations in Glacier Bay National Park and Preserve, Alaska. Aquat. Mamm. 43, 537–546. doi: 10.1578/AM.43.5.2017.537
Matthews, L. P., Parks, S. E., Fournet, M. E., Gabriele, C. M., Womble, J. N., and Klinck, H. (2017b). Source levels and call parameters of harbor seal breeding vocalizations near a terrestrial haulout site in Glacier Bay National Park and Preserve. J. Acoust. Soc. Am. 141:EL274. doi: 10.1121/1.4978299
McKenna, M. F., Gabriele, C. M., and Kipple, B. (2017). Effects of marine vessel management on the underwater acoustic environment of Glacier Bay National Park, AK. Ocean Coast. Manage. 139, 102–112. doi: 10.1016/j.ocecoaman.2017.01.015
McSweeney, D., Chu, K. C., Dolphin, W. F., and Guinee, L. N. (1989). North Pacific humpback whale songs: a comparison of southeast Alaskan feeding ground songs with Hawaiian wintering ground songs. Mar. Mamm. Sci. 5, 139–148. doi: 10.1111/j.1748-7692.1989.tb00328.x
Merchant, N. D., Fristrup, K. M., Johnson, M. P., Tyack, P. L., Witt, M. J., Blondel, P., et al. (2015). Measuring acoustic habitats. Methods Ecol. Evol. 6, 257–265. doi: 10.1111/2041-210X.12330
Miksis-Olds, J. L., Bradley, D. L., and Niu, X. M. (2013). Decadal trends in Indian Ocean ambient sound. J. Acoust. Soc. Am. 134, 3464–3475. doi: 10.1121/1.4821537
Moore, S. E., Reeves, R. R., Southall, B. L., Ragen, T. J., Suydam, R. S., and Clark, C. W. (2012). A new framework for assessing the effects of anthropogenic sound on marine mammals in a rapidly changing Arctic. Bioscience 62, 289–295. doi: 10.1525/bio.2012.62.3.10
NOAA (2016). Endangered and threatened species; identification of 14 distinct population segments of the Humpback Whale (Megaptera novaeangliae) and revision of species-wide listing. Fed. Regist. 81, 62260–62319.
Nowacek, D. P., Thorne, L. H., Johnson, D. W., and Tyack, P. L. (2007). Responses of cetaceans to anthropogenic noise. Mamm. Rev. 37, 81–115. doi: 10.1111/j.1365-2907.2007.00104.x
Parks, S., Clark, C. W., and Tyack, P. L. (2007). Short- and long-term changes in right whale calling behavior: the potential effects of noise on acoustic communication. J. Acoust. Soc. Am. 122, 3725–3731. doi: 10.1121/1.2799904
Parks, S. E., Johnson, M., Nowacek, D., and Tyack, P. L. (2010). Individual right whales call louder in increased environmental noise. Biol. Lett. 7, 33–35. doi: 10.1098/rsbl.2010.0451
Parks, S. E., Urazghildiiev, I., and Clark, C. W. (2009). Variability in ambient noise levels and call parameters of North Atlantic right whales in three habitat areas. J. Acoust. Soc. Am. 125, 1230–1239. doi: 10.1121/1.3050282
Patricelli, G. L., and Blickley, J. L. (2006). Avian communication in urban noise: causes and consequences of vocal adjustment. Auk 123, 639–649. doi: 10.1642/0004-8038(2006)123[639:ACIUNC]2.0.CO;2
Payne, R. S., and McVay, S. (1971). Songs of humpback whales. Science 173, 585–597. doi: 10.1126/science.173.3997.585
Payne, R. S., and Webb, D. (1971). Orientation by means of long range acoustic signaling in baleen whales. Ann.N. Y. Acad. Sci. 188, 110–141.
Rice, D. W. (1978). “The humpback whale in the North Pacific: distribution, exploitation, and numbers”, in Workshop on Problems Related to Humpback Whales (Megaptera novaeangliae) in Hawaii, eds K. S. Norris & R. R. Reeves (Seattle, WA: National Marine Fisheries Service), 29–44.
Richardson, W. J., Greene, C. R., Malme, C. I., and Thomson, D. H. (1995). Marine Mammals and Noise. San Diego, CA: Academic Press.
Scheifele, P. M., Andrew, S., Cooper, R. A., and Darre, M. (2005). Indication of a Lombard vocal response in the St. Lawrence River beluga. J. Acoust. Soc. Am. 117, 1486–1492. doi: 10.1121/1.1835508
Shannon, G., McKenna, M. F., Angeloni, L. M., Crooks, K. R., Fristrup, K. M., Brown, E., et al. (2016). A synthesis of two decades of research documenting the effects of noise on wildlife. Biol. Rev. 91, 982–1005. doi: 10.1111/brv.12207
Simard, Y., Roy, N., and Gervaise, C. (2008). Passive acoustic detection and localization of whales: effects of shipping noise in Saguenay–St. Lawrence Marine Park. J. Acoust. Soc. Am. 123, 4109–4117. doi: 10.1121/1.2912453
Simpkins, M. A., Withrow, D. E., Cesarone, J. C., and Boveng, P. L. (2003). Stability in the proportion of harbor seals hauled out under locally ideal conditions. Mar. Mamm. Sci. 19, 791–805. doi: 10.1111/j.1748-7692.2003.tb01130.x
Slabbekoorn, H., and Peet, M. (2003). Birds sing at a higher pitch in urban noise. Nature 424, 267. doi: 10.1038/424267a
Snijders, L., and Naguib, M. (2017). Communication in animal social networks: a missing link. Adv. Stud. Behav. 49, 298–341. doi: 10.1016/bs.asb.2017.02.004
Southall, B. L., Bowles, A. E., Ellison, W. T., Finneran, J. J., Gentry, R. L., Greene, C. R. Jr., et al. (2007). Marine mammal noise exposure criteria: initial scientific recommendations. Aquat. Mamm. 33, 411–414.
Stafford, K.M., Castellote, M., Guerra, M., and Berchok, C.L (in press). Seasonal acoustic environments of beluga bowhead whale core-use regions in the Pacific Arctic. Deep Sea Res. Part II. doi: 10.1016/j.dsr2.2017.08.003
Tennessen, J. B., and Parks, S. E. (2016). Acoustic propagation modeling indicates vocal compensation in noise improves communication range for North Atlantic right whales. Endanger. Species Res. 30, 225–237. doi: 10.3354/esr00738
Terhune, J. M., Stewart, R. E. A., and Ronald, K. (1979). Influence of vessel noises on underwater vocal activity of harp seals. Can. J. Zool. 57, 1337–1338. doi: 10.1139/z79-170
Tyack, P. L. (2008). Implications for marine mammals of large-scale changes in the marine acoustic environment. J. Mammal. 89, 549–558. doi: 10.1644/07-MAMM-S-307R.1
Van Parijs, S. M., Corkeron, P. J., Harvey, J., Hayes, S. A., Mellinger, D. K., Rouget, P. A., et al. (2003). Patterns in the vocalizations of male harbor seals. J. Acoust. Soc. Am. 113, 3403–3410. doi: 10.1121/1.1568943
Voellmy, I. K., Purser, J., Flynn, D., Kennedy, P., Simpson, S. D., and Radford, A. N. (2014a). Acoustic noise reduces foraging success in two sympatric fish species via different mechanisms. Anim. Behav. 89, 191–198. doi: 10.1016/j.anbehav.2013.12.029
Voellmy, I. K., Purser, J., Simpson, S. D., and Radford, A. N. (2014b). Increased noise levels have different impacts on the anti-predator behaviour of two sympatric fish species. PLoS ONE 9:e102946. doi: 10.1371/journal.pone.0102946
Wale, M. A., Simpson, S. D., and Radford, A. N. (2013). Noise negatively affects foraging and antipredator behaviour in shore crabs. Anim. Behav. 86, 111–118. doi: 10.1016/j.anbehav.2013.05.001
Watkins, W. A., and Schevill, W. E. (1979). Aerial observation of feeding behavior in four baleen whales: Eubalaena glacialis, Balaenoptera borealis, Megaptera novaeangliae, and Balaenoptera physalus. J. Mammal. 60, 155–163. doi: 10.2307/1379766
Wenz, G. M. (1962). Acoustic ambient noise in the ocean: spectra and sources. J. Acoust. Soc. Am. 34, 1936–1956. doi: 10.1121/1.1909155
Wild, L. A., and Gabriele, C. M. (2014). Putative contact calls made by humpback whales (Megaptera novaeangliae) in southeastern Alaska. Can. Acoust. 42, 23–31.
Wiley, R. H., and Richards, D. G. (1978). Physical constraints on acoustic communication in the atmosphere: implications for the evolution of animal vocalizations. Behav. Ecol. Sociobiol. 3, 69–94. doi: 10.1007/BF00300047
Williams, R., Clark, C. W., Ponirakis, D., and Ashe, E. (2013). Acoustic quality of critical habitats for three threatened whale populations. Anim. Conserv. 17, 174–185. doi: 10.1111/acv.12076
Williams, R., Erbe, C., Ashe, E., and Clark, C. W. (2015). Quiet(er) marine protected areas. Mar. Pollut. Bull. 100, 154–161. doi: 10.1016/j.marpolbul.2015.09.012
Witteveen, B. H., Foy, R. J., Wynne, K. M., and Tremblay, Y. (2008). Investigation of foraging habits and prey selection by humpback whales (Megaptera novaeangliae) using acoustic tags and concurrent fish surveys. Mar. Mamm. Sci. 24, 516–534. doi: 10.1111/j.1748-7692.2008.00193.x
Womble, J. N., Blundell, G. M., Gende, S. M., Horning, M., Sigler, M. F., and Csepp, D. J. (2014). Linking marine predator diving behavior to local prey fields in contrasting habitats in a subarctic glacial fjord. Mar. Biol. 161, 1–14. doi: 10.1007/s00227-014-2424-8
Womble, J. N., Pendleton, G. W., Mathews, E. A., Blundell, G. M., Bool, N. M., and Gende, S. M. (2010). Harbor seal (Phoca vitulina richardii) decline continues in the rapidly changing landscape of Glacier Bay National Park, Alaska 1992–2008. Mar. Mamm. Sci. 26, 686–697. doi: 10.1111/j.1748-7692.2009.00360.x
Keywords: acoustic ecology, Alaska, humpback whale, communication space, harbor seal, National Park, marine protected area, agent-based modeling
Citation: Gabriele CM, Ponirakis DW, Clark CW, Womble JN and Vanselow PBS (2018) Underwater Acoustic Ecology Metrics in an Alaska Marine Protected Area Reveal Marine Mammal Communication Masking and Management Alternatives. Front. Mar. Sci. 5:270. doi: 10.3389/fmars.2018.00270
Received: 16 December 2017; Accepted: 17 July 2018;
Published: 08 August 2018.
Edited by:
Lars Bejder, Hawai'i Institute of Marine Biology, University of Hawaii, United StatesReviewed by:
Clive Reginald McMahon, Sydney Institute of Marine Science, AustraliaGail Schofield, Queen Mary University of London, United Kingdom
Luke Rendell, University of St Andrews, United Kingdom
Copyright © 2018 Gabriele, Ponirakis, Clark, Womble and Vanselow. This is an open-access article distributed under the terms of the Creative Commons Attribution License (CC BY). The use, distribution or reproduction in other forums is permitted, provided the original author(s) and the copyright owner(s) are credited and that the original publication in this journal is cited, in accordance with accepted academic practice. No use, distribution or reproduction is permitted which does not comply with these terms.
*Correspondence: Christine M. Gabriele, chris_gabriele@nps.gov