One-Single Extraction Procedure for the Simultaneous Determination of a Wide Range of Polar and Nonpolar Organic Contaminants in Seawater
 Vincent Fauvelle*
  Javier Castro-Jiménez
  Natascha Schmidt
  Benoit Carlez Christos Panagiotopoulos
  Richard Sempéré*
- Aix-Marseille Univ., Université de Toulon, CNRS, IRD, Mediterranean Institute of Oceanography (M I O), Marseille, France
A rapid analytical method including one-single solid-phase extraction (SPE) procedure followed by gas and liquid chromatography coupled with high resolution mass spectrometry detection (GC–MS and LC–HRMS respectively) was developed for the quantification of 40 organic compounds (1.6 < log Kow < 9.5) in seawater including both legacy and emerging contaminants, with a focus on the most common plastic organic additives. This new method allowed for the analyses of nine organophosphate esters (OPEs), seven phthalates (PAEs), six bisphenols (BPs), five perfluorinated compounds (PFCs), and thirteen legacy organochlorinated compounds (OCs, including polychlorobiphenyles and pesticides) with recoveries in the ranges of 57–124% for OPEs, 52–163% for PAEs, 64–118% for BPs, 63–124% for PFCs, and 40–95% for OCs. As a result of (i) strict cleanup protocols, (ii) material, and solvent selection, and (iii) the use of an ISO 6 cleanroom for sample treatment, the procedural blank levels were always lower than 5 ng L−1, even for the most abundant and ubiquitous compounds like tris-(2-chloro, 1-methylethyl) phosphate (TCPP) and diethylhexyl phthalate (DEHP). The quantification limits were in the ranges of 0.03–0.75 ng L−1 for OPEs, 0.03–0.25 ng L−1 for PAEs, 0.1–5 ng L−1 for BPs, 0.1–8 ng L−1 for PFCs, and 0.02–1.1 ng L−1 for OCs, matching seawater analysis requirements. Dissolved water phase samples collected in Marseille Bay (NW Mediterranean Sea) were analyzed using the developed method reveling the concentration of PAEs up to 140 ng L−1 (DEHP) and that of OCs up to 70 ng L−1 (α-endosulfan). For the first time, we also provided the concentrations of OPEs (TCPP up to 450 ng L−1), BPs (bisphenol S up to 123 ng L−1), and PFCs (PFOS up to 5 ng L−1) in this area. A sampling station close to the municipal waste water treatment plant outfall exhibited the highest concentration levels for all compounds.
Introduction
Over the past decades, the dramatic increase in chemical diversity, production volume, uses and sources has led to the widespread occurrence of organic contaminants in all waterbodies including marine environments and numerous living organisms (Sousa et al., 2017). Organochlorine legacy contaminants [OCs, e.g., polychlorinated biphenyls (PCBs), organochlorine pesticides (OCPs)] together with emerging substances (e.g., flame retardants, other organic plastic additives, pharmaceuticals) are increasingly monitored in relation with stricter national and European regulations (Allan et al., 2006). Moreover, the persistence of emerging contaminants, such as perfluorinated flame retardants (PFCs), together with their ubiquitous detection and high toxicity resulting in sub-ppt EU Environmental Quality Standard (EQS) prompted growing concern (Kaserzon et al., 2012). In addition to the direct release of chemicals in the environment, several organic compounds, such as plastic additives, can be indirectly introduced in aquatic environment following leaching of marine litter such as plastic debris (Net et al., 2015b; Murphy et al., 2016; Suhrhoff and Scholz-Böttcher, 2016; Paluselli et al., 2018b). The release of organic compounds initially included in plastic materials, e.g., phthalates (PAEs), organophosphate esters (OPEs), and bisphenols (BPs) is otherwise identified among the most critical hazards associated with plastic discharge in the environment (Hermabessiere et al., 2017; Hahladakis et al., 2018).
Substantially most of the above-mentioned chemical families exhibit endocrine-disrupting properties and are thus potentially associated with both health and environmental deleterious effects whose mechanisms are largely unknown (Messerlian et al., 2017; Barrios-Estrada et al., 2018), especially for mixtures of contaminants (Kim-Tiam et al., 2016). Most of them are found in marine environmental compartments, sometimes significantly exceeding μg L−1 level in estuarine waters (Chau et al., 2015; Zhang et al., 2018) or being close to it in coastal waters (Pojana et al., 2007; Hu et al., 2014; Paluselli et al., 2018b), whereas offshore waters generally exhibit ng L−1 or lower levels (Brumovský et al., 2017; Lammel et al., 2017; Paluselli et al., 2018a). The various classes of contaminants cited above may induce their toxic effect via direct contact or by biomagnifying in the marine food web from phyto- and zooplankton, which are mainly affected by the dissolved water phase fraction of the contaminants (Kim-Tiam et al., 2016).
Although a number of previous reports on a reliable trace-level detection of different families of organic contaminants in the dissolved water phase have been published (Holadová et al., 2007; Pojana et al., 2007; Kaserzon et al., 2012; Assoumani et al., 2013; Hu et al., 2014; Chau et al., 2015; Net et al., 2015a; Brumovský et al., 2017; Lammel et al., 2017; Li et al., 2017; Paluselli et al., 2018a), they focused on one class of chemicals, making analyses of several classes of organic contaminants time-consuming. Thus, reliable detection of a large set of organic contaminants from different chemical families and polarities in natural water is only scarcely reported (Chau et al., 2015). Although solid-phase extraction (SPE), commonly followed by gas and liquid chromatography (i.e., GC and LC, respectively) coupled with mass spectrometry (MS) analyses, is now accepted as a method of choice for all the contaminant families mentioned above (Pojana et al., 2007; Kaserzon et al., 2012; Hu et al., 2014; Chau et al., 2015; Net et al., 2015a; Brumovský et al., 2017; Lammel et al., 2017; Li et al., 2017; Paluselli et al., 2018a), their fractionated elution from a one-single extraction step for simultaneous GC and LC analyses has been investigated only scarcely to the best of our knowledge.
The aims of this study are (i) to propose a systematic strategy for SPE fractionated elution step able to extract simultaneously a wide range of contaminants (1.6 < log Kow < 9.5) from seawater dissolved fraction for subsequent LC–MS and GC–MS analysis, (ii) to validate the analytical method at environmentally relevant concentrations, and (iii) to apply the method to real samples in order to verify its performance, in line with existing requirements for seawater monitoring.
Materials and Methods
Chemicals and Reagents
Hexane, ethyl acetate (EtOAc), dichloromethane (DCM), acetone, and toluene were purchased from Promochem (Picograde, LGC standard). MeOH was provided by Biosolve (ULC-MS grade), whereas ultrapure water (MQ) was obtained from a Millipore (resistivity > 18.2 MΩ) Milli-Q system. All standards and key physical-chemical properties are listed in Table 1. PAEs were obtained from Supelco (USA), BPs and native PFCs from AccuStandard (USA), and isotope labeled PFCs from Wellington Laboratories (Canada). Individual native OPE and OC standards and labeled 2,4-DDT-d8, 4,4-DDT-d8, and α-endosulfan-d4 were purchased from Dr. Ehrenstorfer GmbH (Germany), whereas labeled standards of tri-n-butyl-d27-phosphate, triphenyl-d15-phosphate, tri-n-propyl-d21-phosphate, malathion-d7, α-HCH-d6, and γ-HCH-d6 were obtained from C/D/N Isotopes Inc. (Canada) and tris(2-chloroisopropyl)-d18-phosphate, tris(1,3-dichloro-2-propyl)-d15-phosphate, tris(2-chloroethyl)-d12-phosphate, 13C12-PCB-28,−118, and−180 were from Cambridge Isotope Laboratories, Inc. (USA). Monomolecular stock solutions (250–100 ng μL−1) were prepared in toluene except for PFCs and BPs (acetone). Working mix solutions were prepared in isooctane or acetone by dilution to 10 ng μL−1.
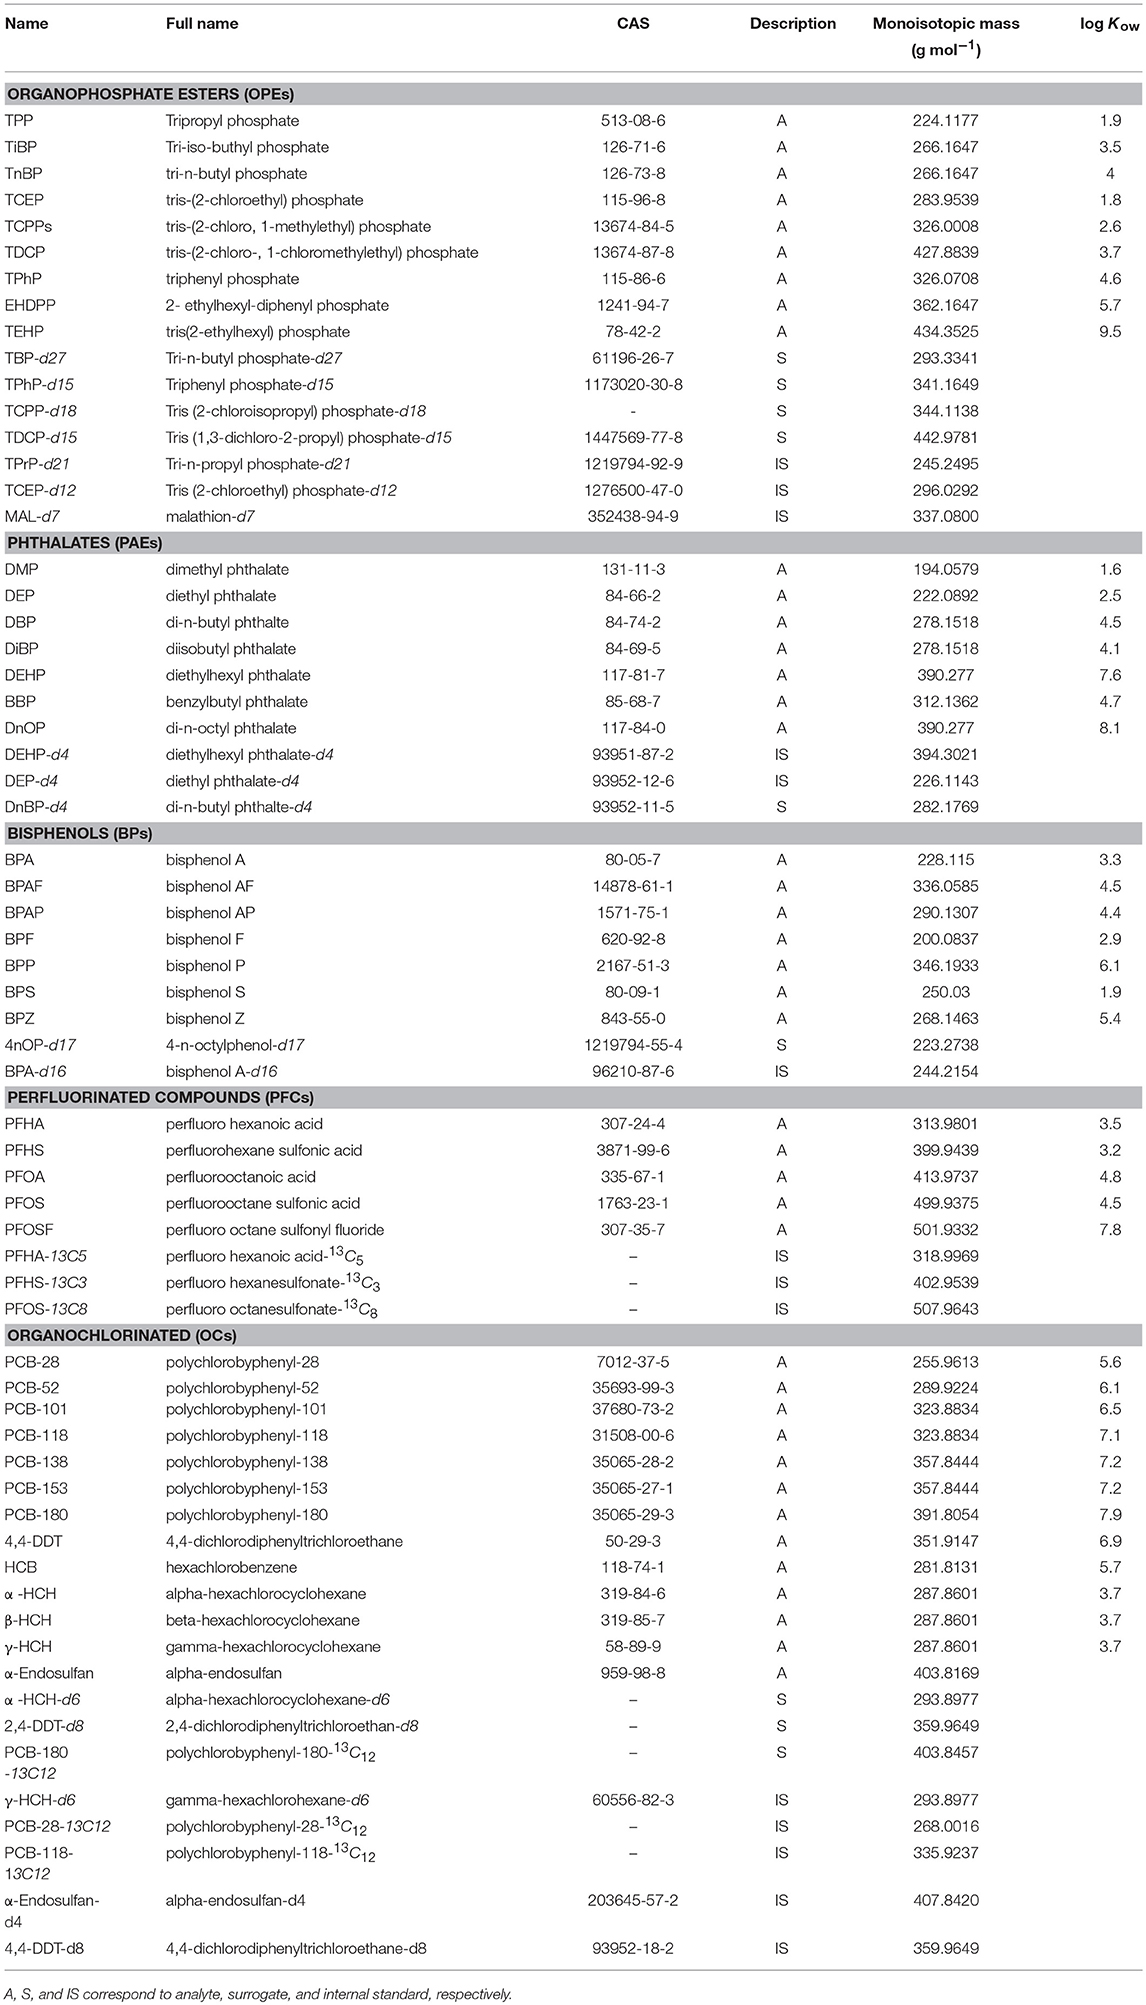
Table 1. Identification and physico-chemical properties of target substances.
Solid Phase Extraction Procedure
The SPE method developed here is based on a previous procedure described for PAEs by Paluselli et al. (2018a) and optimized with a fractionated elution step in order to recover different contaminant classes (OPEs, PAEs, BPs, PFCs, and OCs). A 1 L subsurface seawater sample was collected in Marseille Bay with a stainless-steel beaker, filtered through a precombusted (450°C, 6 h) 0.7 μm glass fiber filter the same day, and stored at −20°C if extractions were not performed the same day. The whole SPE protocol was conducted on a manifold under vacuum (Supelco Visiprep®). SPE cartridges were prepared in the laboratory [Waters Oasis hydrophilic-lipophilic balance (HLB)® bulk sorbent, 30 μm, 250 mg, glass cartridge, polytetrafluoroethylene (PTFE) frits] and conditioned with 3 cycles of acetone (5 mL), EtOAc (5 mL), DCM (5 mL), and finally 10 mL of MQ. The freshly collected seawater samples were spiked with the corresponding surrogate mix (Table 1, 100 ng sample−1) before the sample loading on the cartridges (10 mL min−1, ~2 h). A subsequent washing step (5 mL MQ) allowed removing salts from the cartridges. The cartridges were then dried under vacuum for ~2 h in order to remove any residual water that may affect subsequent GC–MS analysis. Special attention was paid to ensure complete dryness since poly(divinylbenzene-co-N-vinylpyrrolidone) (Oasis HLB) is more wettable than conventional poly(styrene-co-divinylbenzene) SPE sorbents. Four eluting fractions covering a wide range of solvent polarity were studied separately by implementing a multi-elution step following the polarity gradient, in order to give a general scheme for potential further contaminant inclusion: 5 mL hexane (F1), 5 mL hexane/DCM 50:50 (v/v) (F2), 5 mL EtOAc (F3), and then 5 mL MeOH (F4). Depending on the chemical family one fraction might not be needed, but we chose to keep these four fractions that include both polar and nonpolar, as well as protic and non-protic solvents. The four fractions were collected separately in pre-combusted 22 mL glass flasks, evaporated to ~1 mL under gentle N2 flux, transferred into 2 mL pre-combusted conical glass vials, spiked with an appropriate internal standard (IS) mixture (Table 1, 100 ng sample−1), and evaporated again to a final volume of approximately 50 μL for the GC–MS analysis or 1000 μL for the LC–high-resolution mass spectrometry (HRMS) analysis. The concentration factors were 20,000 for the GC-MS analysis and 1,000 for the LC–HRMS analysis. Considering the injection volumes on GC (2 μL) and LC (10 μL), 40 and 10 mL seawater volume equivalents were injected on each instrument. The whole procedure was conducted in an International Standards Organization (ISO) 6 cleanroom, and strict quality assurance and quality control (QA/QC) procedures were implemented (see the QA/QC section).
GC–MS Analysis
According to the literature, PAE, OPE, and OC analyses were conducted with Agilent 7820A Series GC coupled with Agilent 5977E MS, operating in selected ion monitoring and electron impact (70 eV) modes. The separation was achieved in a 30 m × 0.25 mm internal diameter × 0.25 μm HP-5MS capillary column (Agilent J&W). All target contaminants were quantified by the IS procedure. Supplementary Table 1 shows selected ions for detection and quantification for each compound. The injection volume was 2 μL, and the helium carrier gas flow was 1 mL min−1. The temperatures of the MS transfer line, ion source, and quadrupole were set at 300, 230, and 150°C, respectively. For OPEs and PAEs, the following conditions were applied: the injector temperature was 270°C (splitless), and the oven was programmed from 90 to 132°C at 3°C min−1, to 166°C at 10°C min−1, to 175 at 1°C min−1 (holding time: 2 min), to 232°C at 2°C min−1, and then to 300°C at 25°C min−1 (holding time: 5 min). For OCs, the injector temperature was 250°C (splitless), and the oven was programmed from 90 to 140°C at 25°C min−1 (holding time: 10 min), to 158°C at 1°C min−1, to 188 at 20°C min−1, to 208°C at 1°C min−1, and then to 300°C at 25°C min−1 (holding time: 5 min).
LC–HRMS Analysis
Simultaneous quantification of BPs and PFCs was achieved by analyzing 10 μL with LC–electrospray ionization quadrupole time of flight mass spectrometry (LC-ESI-QTOF, Agilent 1290 Infinity LC system coupled with Agilent 6530 Accurate-Mass Q-TOF, Agilent Technologies, Les Ulis, France). LC was chosen for BPs and PFCs according to the literature. Syringe was washed externally with 1 mL MeOH for 20 s before injection to avoid contamination of the injection port or the following samples. Separation was achieved on an Agilent Zorbax Eclipse XDB reversed phase column (50 mm × 2.1 mm, 1.8 μm), with a temperature of 30°C. Elution was performed with MQ (A) and MeOH (B) under gradient conditions: 0 min 95:5 A/B, 1 min 95:5 A/B, 10 min 0:100 A/B, 15 min 0:100 A/B, 15.1 min 95:5 A/B, and 20 min 95:5 A/B. The ESI interface was operated in the negative mode (3.5 kV capillary voltage), and MS TOF mass acquisition was performed in the range of 50–600 m/z at a rate of 1 spectrum s−1. The ESI parameters were set as follows: 300°C gas temperature, 11 L min−1 drying gas, 40 psig nebulizer, 350°C sheath gas temperature, and 11 L min−1 sheath gas flow. The TOF parameters were: 1,500 V nozzle voltage, 175 V fragmentor voltage, 65 V skimmer voltage, and 750 V octopole voltage. Ion chromatogram extraction was performed with 10 ppm mass tolerance, based on the exact monoisotopic mass (Table 1) and retention time (Supplementary Table 2). A typical chromatogram for selected compounds is available in Supplementary Figure 1.
Application to Seawater Samples
The method was applied to real seawater samples collected at l'Estaque, Frioul, and Cortiou sites in May 2017 in the Marseille city coastal area (Figure 1) from R/V Antedon II, and followed the protocol described in the “SPE procedure” section. L'Estaque is under the influence of the commercial harbor, Frioul is considered the least impacted site, whereas the Cortiou station is around 150 m from the municipal wastewater treatment plant outfall (WWTP, 2.1 106 population equivalent capacity, 1 106 effective population).
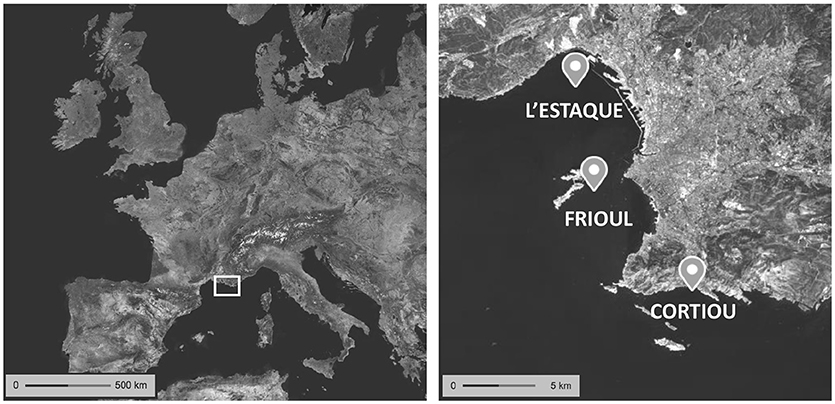
Figure 1. Sampling locations in Marseille Bay. Map from the French National Institute of Geographic and Forestry Information.
QA/QC
Most of the target chemicals may be found ubiquitously in technical laboratory items at each stage of sample processing (sampling, filtration, SPE, analysis), in particular the emerging contaminants. As a result, several systematic precautions were taken throughout the sample preparation processes: a pre-combusted (i.e., 450°C for 6 h) aluminum foil was used to prevent direct contact between seawater and plastic items (e.g., bottle caps); stainless steel, pre-combusted glassware and PTFE were used instead of polyethylene and polypropylene materials; all samples were processed in an ISO class 6 cleanroom (22°C, +15 Pa cleanroom pressure, 50 vol h−1 brewing rate); all lab hood was cleaned with MeOH; all materials were covered with a pre-combusted aluminum foil; and the cartridges were covered during drying. PTFE might be a source of PFCs. Therefore, its use was limited to SPE cartridge frits and SPE sample loading lines, and each PFTE item was cleaned drastically with MeOH in order to lower PFC contamination to acceptable levels. Corresponding procedural blanks were performed.
Other precautions were taken for the analytical part: a ultra-high pressure liquid chromatography grade solvent was chosen, the LC syringe was washed externally with MeOH for 20 s before each injection, and the column was flushed with both MeOH and MQ included in the LC gradient for 5 min. The GC injection syringe was washed 10 times with DCM and isooctane before and after each individual injection in order to minimize cross-contamination at the GC injection port. The QA/QC were based on (i) procedural blank quantification for each SPE batch, (ii) instrumental blanks every five samples, (iii) surrogates' recovery evaluation for each individual sample, (iv) the use of appropriate IS quantification, and (v) initial method validation for recovery and the limit of quantification for a target chemical in the matrix of interest. The average procedural blanks (n = 3) ranged from < the limits of detection to 3.4 ng L−1 (average: 0.35 ng L−1), exhibiting generally very low amounts of target analytes (Supplementary Table 3). No particular instrumental blanks or cross-contamination was observed during the GC–MS analyses. However, during the LC–HRMS analysis, we experienced instrumental blank issues, which were solved by a copious external syringe-washing step (MeOH flushing for 20 s) after each LC sampling. The nine isotope labeled surrogates (Table 1) added in the seawater samples before SPE showed acceptable recoveries in the range of 40–108% (Table 3). The LC matrix effects, i.e., ion suppression in the ESI source (Taylor, 2005), were always lower than 40% signal loss. These limited matrix effects were obtained by applying a lower SPE concentration factor than the one applied for the GC–MS analyses (1,000 vs. 20,000 see the “SPE procedure” section).
Results and Discussion
SPE Optimization
The selection of an SPE sorbent that includes both polar and nonpolar moieties was the first requirement for retaining the whole range of target chemicals (1.6 < log Kow < 9.5). Among them, Oasis HLB is identified as the best candidate for extracting a wide range of contaminants (Kaserzon et al., 2012; Fauvelle et al., 2015; Net et al., 2015a). An important SPE step was the selection of an appropriate elution fraction. As our analytes cover a large polarity range, a preliminary fractionation experiment was performed to better understand the HLB-to-solvent partitioning for each contaminant using a solvent polarity gradient: first nonpolar fraction (hexane), second slightly more polar fraction (hexane/DCM), third moderately polar fraction (EtOAc), and last polar fraction (MeOH). Table 2 shows the distribution of all 40 target analytes in the four fractions defined in the “SPE procedure” section. OPEs were only found in F1 and F2 and not detected in F3 and F4. PAEs were mainly recovered in F1 and F2, whereas < 1% was found in F3, and they were not detected in F4. OCs were also recovered predominantly in F1 and F2, while F3 contained < 5% of the total amount, and F4 did not show detectable amounts. BPs were only found both in F3 and F4, except for BPP, which was detected only in F1 and F2. PFCs were otherwise only detected in F3 and F4. In summary, PAEs, OPEs, and OCs were recovered in the first two fractions, whereas BPs and PFCs were predominantly found in fractions F3 and F4. A limited number of PAEs and OCs were found in F3, with relative abundances always lower than 5%. One major exception for BPs was BPP, found mainly in F1, in line with its higher log Kow value (i.e., 6.1, see Table 1).
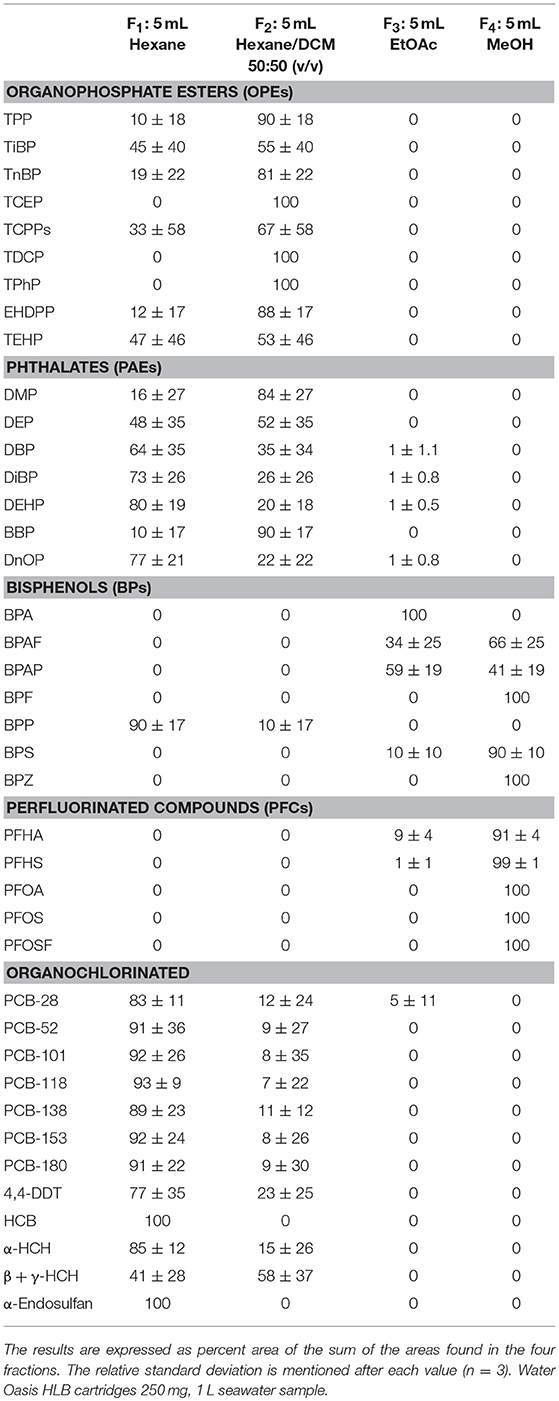
Table 2. Distribution of 40 target analytes in the four consecutive elution fractions.
Therefore, the final SPE protocol consisted in collecting F1 with F2 (called Fa thereafter) for the GC–MS analysis of OPEs, PAEs, and OCs and F3 with F4 (called Fb thereafter) for the LC–HRMS analysis of BPs and PFCs. As BPP was recovered in Fa, but analyzed by LC–HRMS, it was removed from the target list. A schematic view of the final protocol is available in Figure 2.
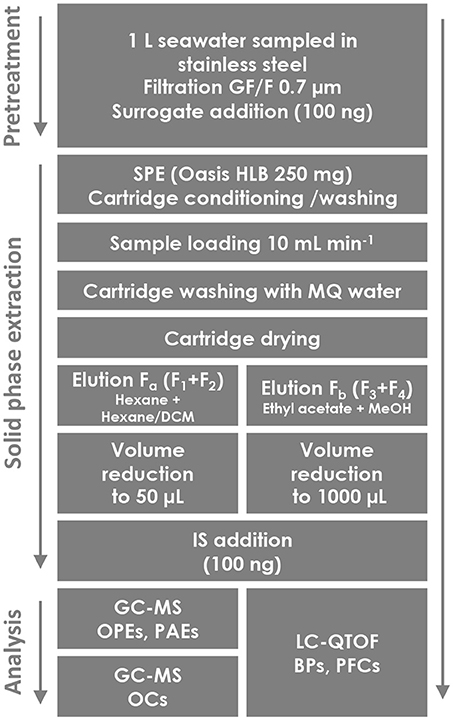
Figure 2. Flowchart of the sampling and the SPE procedure of 40 contaminants extracted from seawater.
Method Validation
The final method was then validated at two environmentally relevant concentrations: 20 ng L−1 and 150 ng L−1. Seawater samples (1 L) collected in the study area were spiked at the corresponding target concentrations with a mixture of native contaminants prepared in acetone (five replicates for each level, n = 5). Recoveries, the limits of quantification (LQs) are reported in Table 3. The LQs in pg injected were determined considering a signal/noise (S/N) ratio of >10 in the lowest calibration level, and the LQs in ng L−1 were derived from these values taking into account the corresponding SPE preconcentration factor. An acceptable sensitivity was reached working under the experimental conditions described above, with the LQs for the target contaminants ranging from 1 pg to 100 pg depending on the compound and the instrumental technique employed. The LQs in ng L−1 varied from 0.03 to 8 in seawater, with only five compounds having values ≥2 ng L−1. The method recoveries for the native target contaminants (abbreviations are detailed in Table 1) and surrogates ranged from 57 ± 9 (TEHP) to 131 ± 16 (TCEP) for OPEs, from 52 ± 3 (DnOP) to 163 ± 131 (DEHP) for PAEs, from 88 ± 10 (BPAP) to 118 ± 26 (BPAF) for BPs, from 63 ± 9 (PFOSF) to 124 ± 5 (PFOA) for PFCs, and 48 ± 5 (PCB-180) to 133 ± 7 (α-endosulfan) for OCs. These values are in agreement with existing studies focusing on one chemical family: Hu et al. (2014) had recoveries between 67 and 118% for OPEs, Paluselli et al. (2018a) recovered PAEs in the range 95–110%, Pojana et al. (2007) found BPs in the range 50–98%, Kaserzon et al. (2012) determined recoveries between 36 and 129% for PFCs, and Lammel et al. (2017) found OCs in the range 75–103%. Similar recoveries were found for most compounds at the two-environmental concentration tested. Therefore, most compounds showed acceptable recoveries. However, high relative standard deviations were found for DEHP and DiBP at the lower spiking level (i.e., 20 ng L−1). The high recovery end observed could be due to a specific contamination of the spiked samples even if the blanks run in parallel did not show any significant contamination. Indeed, we measured a higher concentration of DEHP and DiBP in one single replicate, which explained the high relative standard deviations and recoveries for both compounds. Although many precautions were taken for minimizing contamination, some interference could still be attributed, for example, to random contamination of the SPE cartridges by residual plastic fibers present in the air. Therefore, we recommend analyzing duplicates of real samples to avoid false positive results, and thus we applied this strategy as described in the following section “Application to seawater samples.” The recovery rates were not dependent on the compound polarity (e.g., nonpolar OCs showed a recovery range comparable to the one of more polar BPs), indicating that Oasis HLB is well adapted for our purpose.
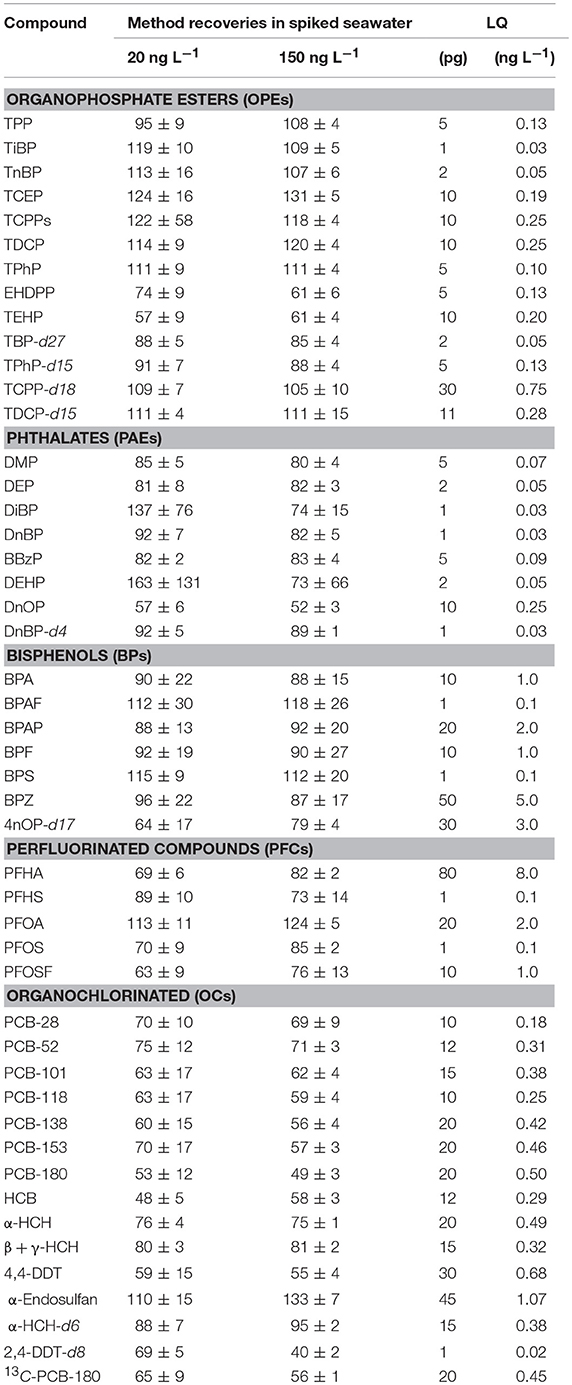
Table 3. Recoveries of the target contaminants (n = 5) with their associated standard deviation, LQs expressed as absolute amounts (pg) and ng L−1 in seawater.
Application to Seawater Samples
The method was applied to freshly collected marine samples from Marseille Bay at three sampling stations (Figure 1). The range of concentrations found at the three sites was between < LQ up to several hundreds of ng L−1. Otherwise, concentrations close to LQ have been quantified, and accuracy was not affected. The duplicate samples were analyzed at each location (except for OCs, which were analyzed on a single replicate), and acceptable reproducibility was obtained at all sites, except for DEHP at the Cortiou station (79 and 132 ng L−1). As DEHP LQ was substantially exceeded, the maximum analytical permissible error of 60% close to LQ (Lissalde et al., 2011) cannot explain fully the difference between both replicates. Therefore, this difference could also be attributed to laboratory contamination affecting one single sample from the duplicate. Among the 40 contaminants analyzed, 25 were found at least once (Figure 3). The three families of plastic organic additives exhibited the highest concentrations up to 462, 132, and 123 ng L−1 for the TCPP, DEHP, and BPS, respectively. Among the three sites, the highest concentrations of the targeted contaminants were found at Cortiou (150 m from Marseille WWTP outfall). The measured concentrations were generally in the range of those reported in previous studies in various marine environments (Pojana et al., 2007; Kaserzon et al., 2012; Hu et al., 2014; Chau et al., 2015; Net et al., 2015a; Brumovský et al., 2017; Lammel et al., 2017; Li et al., 2017; Paluselli et al., 2018a).
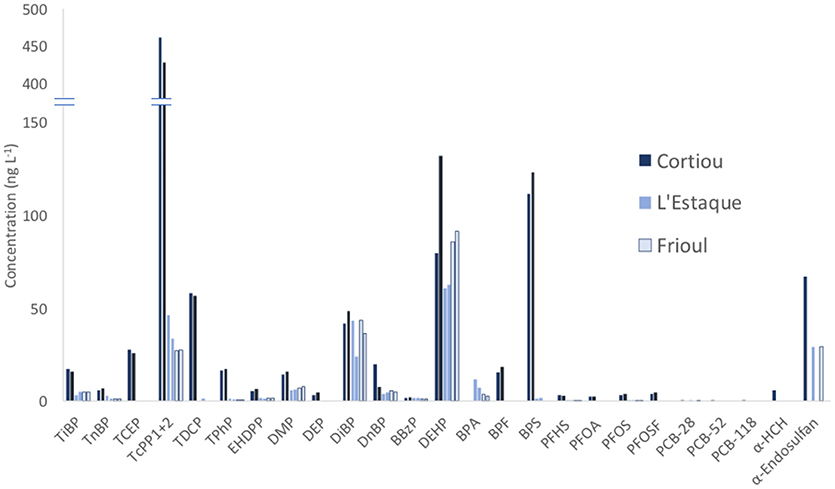
Figure 3. Concentrations of contaminants found at the three sampling sites (Cortiou, L'Estaque, and Frioul) in the Bay of Marseille in May 2017. The duplicate samples are shown as two consecutive bars. The y-axis breaks between 150 and 400 ng L−1. Not detected compounds are not shown. OCs were analyzed on one replicate at each site. The contaminant abbreviations are given in Table 1. Compounds are grouped by chemical family.
OPEs and PAEs represented from 78 to 85% of relative abundance of the five contaminant classes, whatever the site. OPEs were more abundant near the WWTP (~60% at the Cortiou site), whereas PAEs were the most abundant at the most remote site (68% at Frioul). TCPP was always the most abundant OPE, with a relative abundance among OPEs between 77 and 84%. The sum of DEHP and DiBP was always higher than 75% of the total PAE concentration. BPs represented from 1% (Frioul) to 14% (Cortiou) of the total target contaminant concentration. BPS was the most abundant BP near the WWTP at Cortiou (~90%), whereas BPA was the predominant BP in the other two sites (>80%). BPS was the most concentrated among all BPs (up to 123 ng L−1, and 88% of all BPs), ahead of BPA, which points out the need for monitoring several compounds from each chemical family, for which less data is available. PFCs were quantified at very low levels in all samples (<1% of the total target contaminant concentration), with individual compound concentrations always lower than 5 ng L−1, and only two OCs were found at concentrations clearly above the LQs (7–16% of the total target contaminant concentration depending on the site): α-endosulfan (30–70 ng L−1, representing 90–100% of the 13 OCs concentration) and α -HCH (~6 ng L−1, representing < 8% of OCs at all sites). PCBs-28,−52, and,−118 were found at very low concentration levels (0.4–0.6 ng L−1) (Supplementary Table 4). The concentrations of the rest of OCs were below the LQs, most probably owing to the low amounts entering the bay and their preferential partitioning in the water particle phase (not considered in this study).
The EQSs from the European Union Water Framework Directive (WFD) in seawater are only available for DEHP (annual average: 1300 ng L−1), PFOS/PFOA (annual average: 0.13 ng L−1), and several OCs (annual average: from 4 to 300 ng L−1). Although an appropriate risk assessment cannot be conducted with the present data due to the limited number of samples, our results pointed PFOS as the most potentially harmful substance from our target list, exceeding the current EQS in seawater.
Conclusions
A reliable analytical method for a rapid measurement of five classes (OPEs, PAEs, BPs, PFCs, and OCs) of organic contaminants in natural seawater at trace levels was developed and validated. The method proposed in this study allowed the quantification of 40 organic contaminants presenting a wide range of physicochemical properties and sources in the environment, including both legacy and emerging contaminants. The implementation of a single SPE protocol using a sorbent, including polar and nonpolar moieties, allowed reaching acceptable performances both in terms of analyte recoveries and LQs. We proposed a systematic strategy for catching most of the organic contaminants, using the polarity gradient during the SPE elution step. Only ionizable organic substances could be missed because of the intrinsic properties of the selected sorbent, which could however been overcome by the use of mixed-mode ion exchange sorbents. This study focused mainly on plastic organic additives, which were found to be the most abundant contaminants in Marseille Bay, far ahead of conventional PCBs or OCPs. Therefore, our method represents a useful tool for screening and quantification of widely diffused plastic organic additives and indirect assessment of the impact of plastic waste on the dissolved seawater fraction, generally considered bioavailable.
Authors Contributions
VF, JC-J, and RS experimental design. NS and BC sampling. NS, BC, VF, and JC-J performed the experiments and analyses. VF, JC-J, RS, NS, and CP wrote the paper.
Funding
This study was financially supported by the JPI Oceans PLASTOX and Agence de l'Eau-CAREMED and Blue-POLUT projects. This research was also partially funded by the Labex OT-Med (no ANR-11-LABX-0061)—MEDPOP, funded by the French Government Investissements d'Avenir (ANR) through the AMIDEX project (no ANR-11-IDEX-0001-02). The project leading to this publication has also received funding from European FEDER Fund under project 1166-39417.
Conflict of Interest Statement
The authors declare that the research was conducted in the absence of any commercial or financial relationships that could be construed as a potential conflict of interest.
The reviewer VL and handling editor declared their shared affiliation at the time of the review.
Acknowledgments
The authors are grateful to Dorian Guillemain, Nagib Bhairy, Christian Grenz, Michel Lafont, and Deny Malengros from SAM-M I O platform and the crew and captain of the R/V Antedon II for operation at sea.
Supplementary Material
The Supplementary Material for this article can be found online at: https://www.frontiersin.org/articles/10.3389/fmars.2018.00295/full#supplementary-material
References
Allan, I., Vrana, B., Greenwood, R., Mills, G., Knutsson, J., Holmberg, A., et al. (2006). Strategic monitoring for the European Water Framework Directive. TrAC Trends Anal. Chem. 25, 704–715. doi: 10.1016/j.trac.2006.05.009
Assoumani, A., Lissalde, S., Margoum, C., Mazzella, N., and Coquery, M. (2013). In situ application of stir bar sorptive extraction as a passive sampling technique for the monitoring of agricultural pesticides in surface waters. Sci. Total Environ. 463–464, 829–835. doi: 10.1016/j.scitotenv.2013.06.025
Barrios-Estrada, C., de Jesús Rostro-Alanis, M., Muñoz-Gutiérrez, B. D., Iqbal, H. M. N., Kannan, S., and Parra-Saldívar, R. (2018). Emergent contaminants: endocrine disruptors and their laccase-assisted degradation – a review. Sci. Total Environ. 612, 1516–1531. doi: 10.1016/j.scitotenv.2017.09.013
Brumovský, M., Bečanová, J., Kohoutek, J., Borghini, M., and Nizzetto, L. (2017). Contaminants of emerging concern in the open sea waters of the Western Mediterranean. Environ. Pollut. 229, 976–983. doi: 10.1016/j.envpol.2017.07.082
Chau, H. T. C., Kadokami, K., Duong, H. T., Kong, L., Nguyen, T. T., Nguyen, T. Q., et al. (2015). Occurrence of 1153 organic micropollutants in the aquatic environment of Vietnam. Environ. Sci. Pollut. Res. 25, 7147–7156. doi: 10.1007/s11356-015-5060-z
Fauvelle, V., Mazzella, N., Morin, S., Moreira, S., Delest, B., and Budzinski, H. (2015). Hydrophilic interaction liquid chromatography coupled with tandem mass spectrometry for acidic herbicides and metabolites analysis in fresh water. Environ. Sci. Pollut. Res. 22, 3988−3996. doi: 10.1007/s11356-014-2876-x
Hahladakis, J. N., Velis, C. A., Weber, R., Iacovidou, E., and Purnell, P. (2018). An overview of chemical additives present in plastics: migration, release, fate and environmental impact during their use, disposal and recycling. J. Hazard. Mater. 344, 179–199. doi: 10.1016/j.jhazmat.2017.10.014
Hermabessiere, L., Dehaut, A., Paul-Pont, I., Lacroix, C., Jezequel, R., Soudant, P., et al. (2017). Occurrence and effects of plastic additives on marine environments and organisms: a review. Chemosphere 182, 781–793. doi: 10.1016/j.chemosphere.2017.05.096
Holadová, K., Prokupková, G., Hajslová, J., and Poustka, J. (2007). Headspace solid-phase microextraction of phthalic acid esters from vegetable oil employing solvent based matrix modification. Anal. Chim. Acta 582, 24–33. doi: 10.1016/j.aca.2006.09.005
Hu, M., Li, J., Zhang, B., Cui, Q., Wei, S., and Yu, H. (2014). Regional distribution of halogenated organophosphate flame retardants in seawater samples from three coastal cities in China. Mar. Pollut. Bull. 86, 569–574. doi: 10.1016/j.marpolbul.2014.06.009
Kaserzon, S. L., Kennedy, K., Hawker, D. W., Thompson, J., Carter, S., Roach, A. C., et al. (2012). Development and calibration of a passive sampler for perfluorinated alkyl carboxylates and sulfonates in water. Environ. Sci. Technol. 46, 4985–4993. doi: 10.1021/es300593a
Kim-Tiam, S., Fauvelle, V., Morin, S., and Mazzella, N. (2016). Improving toxicity assessment of pesticide mixtures: the use of polar passive sampling devices extracts in microalgae toxicity tests. Front. Microbiol. 7:1388. doi: 10.3389/fmicb.2016.01388
Lammel, G., Spitzy, A., Audy, O., Beckmann, S., Codling, G. P., Kretzschmann, L., et al. (2017). Organochlorine pesticides and polychlorinated biphenyls along an east-to-west gradient in subtropical North Atlantic surface water. Environ. Sci. Pollut. Res. 24, 11045–11052. doi: 10.1007/s11356-016-7429-z
Li, J., Xie, Z., Mi, W., Lai, S., Tian, C., Emeis, K. C., et al. (2017). Organophosphate esters in air, snow, and seawater in the North Atlantic and the Arctic. Environ. Sci. Technol. 51, 6887–6896. doi: 10.1021/acs.est.7b01289
Lissalde, S., Mazzella, N., Fauvelle, V., Delmas, F., Mazellier, P., and Legube, B. (2011). Liquid chromatography coupled with tandem mass spectrometry method for thirty-three pesticides in natural water and comparison of performance between classical solid phase extraction and passive sampling approaches. J. Chromatogr. A 1218, 1492–1502. doi: 10.1016/j.chroma.2011.01.040
Messerlian, C., Martinez, R. M., Hauser, R., and Baccarelli, A. A. (2017). ‘Omics' and endocrine-disrupting chemicals — new paths forward. Nat. Rev. Endocrinol. 13, 740–748. doi: 10.1038/nrendo.2017.81.
Murphy, F., Ewins, C., Carbonnier, F., and Quinn, B. (2016). Wastewater Treatment Works (WwTW) as a source of microplastics in the aquatic environment. Environ. Sci. Technol. 50, 5800–5808. doi: 10.1021/acs.est.5b05416
Net, S., Delmont, A., Sempéré, R., Paluselli, A., and Ouddane, B. (2015a). Reliable quantification of phthalates in environmental matrices (air, water, sludge, sediment and soil): a review. Sci. Total Environ. 515–516, 162–180. doi: 10.1016/j.scitotenv.2015.02.013
Net, S., Sempéré, R., Delmont, A., Paluselli, A., and Ouddane, B. (2015b). Occurrence, fate, behavior and ecotoxicological state of phthalates in different environmental matrices. Environ. Sci. Technol. 49, 4019–4035. doi: 10.1021/es505233b
Paluselli, A., Aminot, Y., Galgani, F., Net, S., and Sempéré, R. (2018a). Occurrence of phthalate acid esters (PAEs) in the northwestern Mediterranean Sea and the Rhone River. Prog. Oceanogr. 163, 221–231. doi: 10.1016/j.pocean.2017.06.002
Paluselli, A., Fauvelle, V., Schmidt, N., Galgani, F., Net, S., and Sempéré, R. (2018b). Distribution of phthalates in Marseille Bay (NW Mediterranean Sea). Sci. Total Environ. 621, 578–587. doi: 10.1016/j.scitotenv.2017.11.306
Pojana, G., Gomiero, A., Jonkers, N., and Marcomini, A. (2007). Natural and synthetic endocrine disrupting compounds (EDCs) in water, sediment and biota of a coastal lagoon. Environ. Int. 33, 929–936. doi: 10.1016/j.envint.2007.05.003
Sousa, J. C. G., Ribeiro, A. R., Barbosa, M. O., Pereira, M. F. R., and Silva, A. M. T. (2017). A review on environmental monitoring of water organic pollutants identified by EU guidelines. J. Hazard. Mater. 344, 146–162. doi: 10.1016/j.jhazmat.2017.09.058
Suhrhoff, T. J., and Scholz-Böttcher, B. M. (2016). Qualitative impact of salinity, UV radiation and turbulence on leaching of organic plastic additives from four common plastics - a lab experiment. Mar. Pollut. Bull. 102, 84–94. doi: 10.1016/j.marpolbul.2015.11.054
Taylor, P. J. (2005). Matrix effects: the Achilles heel of quantitative high-performance liquid chromatography-electrospray-tandem mass spectrometry. Clin. Biochem. 38, 328–334. doi: 10.1016/j.clinbiochem.2004.11.007
Keywords: plastic additive, seawater, organic contaminants, legacy contaminants, Phtalates, bisphenol, organophosphate esters
Citation: Fauvelle V, Castro-Jiménez J, Schmidt N, Carlez B, Panagiotopoulos C and Sempéré R (2018) One-Single Extraction Procedure for the Simultaneous Determination of a Wide Range of Polar and Nonpolar Organic Contaminants in Seawater. Front. Mar. Sci. 5:295. doi: 10.3389/fmars.2018.00295
Received: 14 May 2018; Accepted: 31 July 2018;
Published: 31 August 2018.
Edited by:
Juan Bellas, Instituto Español de Oceanografía (IEO), SpainReviewed by:
Víctor M. León, Instituto Español de Oceanografía, Centro Oceanográfico de Murcia, SpainMonica F. Costa, Universidade Federal de Pernambuco, Brazil
Copyright © 2018 Fauvelle, Castro-Jiménez, Schmidt, Carlez, Panagiotopoulos and Sempéré. This is an open-access article distributed under the terms of the Creative Commons Attribution License (CC BY). The use, distribution or reproduction in other forums is permitted, provided the original author(s) and the copyright owner(s) are credited and that the original publication in this journal is cited, in accordance with accepted academic practice. No use, distribution or reproduction is permitted which does not comply with these terms.
*Correspondence: Vincent Fauvelle, vincent.fauvelle@mio.osupytheas.fr
Richard Sempéré, richard.sempere@mio.osupytheas.fr