Major Baltic Inflow Statistics – Revised
 Volker Mohrholz
- Department of Physical Oceanography and Instrumentation, Leibniz Institute for Baltic Sea Research Warnemünde, Warnemünde, Germany
Major Baltic inflow events (MBI) transport large amounts of saline water into the Baltic. They are the solely source for deep water ventilation in the central Baltic basins, and control to a large extent the environmental conditions below the permanent halocline. Available series of MBI frequency and intensity depict strong decrease of MBI frequency after the 1980s, followed by long lasting stagnation periods in the central Baltic basins. However, the expected decrease in mean salinity of the Baltic was not observed. Also the frequency of large volume changes of the Baltic has not changed, and recent model studies predict a slight increase of MBI frequency with warming climate. Using long term data series of sea level, river discharge, and salinity from the Belt Sea and the Sound a continuous series of barotropic inflows was reconstructed for the period from 1887 till present. A comparison with the MBI series of Fischer and Matthäus (1996) revealed significant differences in the period since the 1980s. The reasons for the deviations are mainly the lack of appropriate data between 1976 and 1991, and the change in observation methods afterward, which caused a bias in the inflow statistics. In contrast to earlier investigations the revised MBI series depicts no significant long term trend in MBI frequency and intensity, contradicting the hypothesis that climate change caused a decreasing MBI frequency. There exists a decadal variability of MBI with a main period of 25–30 years. Periods with reduced MBI frequency were identified. The revised MBI series was proved with observations of dissolved oxygen and salinity in the bottom layer of the Bornholm basin. Until today climate change has no obvious impact on the MBI related oxygen supply to the central Baltic Sea. The increased eutrophication during the last century is most probably the main driver for temporal and spatial spreading of suboxic and anoxic conditions in the deep layer of the Baltic Sea.
Introduction
Expanding oxygen minimum zones (OMZ) in coastal and marginal seas as well as in the tropical oceans are often discussed as indicators of ongoing climate change (Stramma et al., 2008; Kabel et al., 2012). Among the multiple drivers of OMZ advection and renewal of water below the mixed layer is crucial for the oxygen budget in the OMZ (Conley et al., 2009; Fischer et al., 2013; Neumann et al., 2017). In the Baltic Sea a strong reduction of so called Major Baltic Inflows (MBI) was observed in the early 1980s, leading to a decline of deep water renewal (Fischer and Matthäus, 1996). Concurrently the OMZ increased in the central Baltic (Carstensen et al., 2014; Feistel et al., 2016). The relation between climate change, alteration of barotropic water exchange with the North Sea, and expanding anoxic areas in the central Baltic has been studied intensively (e.g., Meier et al., 2011; BACC II Author Team, 2015; Lehmann et al., 2017). Still, there is no clear mechanism found that describes how climate driven changes in the atmospheric circulation may cause the observed reduction of MBI frequency.
Large fresh water surplus and a very limited water exchange with the North Sea maintain the brackish water conditions in the Baltic Sea (HELCOM, 1986). High river discharges in the eastern and northern part and the inflow of high saline water through the Danish Straits establish an estuarine like overturn circulation (Meier et al., 2006). The inflowing dense saline water spreads into the deep layers and causes a strong vertical salinity gradient in the central Baltic with a pronounced halocline at about 60–80 m depth. The inflow of saline water is balanced by upwelling, diapycnal mixing and the outflow of brackish water in the surface layer. Strong stratification at the halocline limits vertical ventilation from the surface to the top mixed layer. Thus, the solely source of deep water renewal and ventilation of the Baltic Sea is the lateral advection of oxygen rich, high saline water.
The water exchange with the North Sea is hampered by the shallow and narrow connections, the Belt Sea and the Sound. The limiting cross sections are the Darss Sill in the Belt Sea and the Drogden Sill in the Sound (Figure 1), with sill depth of 19 m and 8 m, and cross section areas of 612 500 m2 and 52 750 m2, respectively. The flow through these channels is driven by barotropic and baroclinic pressure gradients in the transition area of the Baltic and the North Sea (Lass et al., 1987; Lass, 1988; Feistel et al., 2006). Accordingly, inflow events are divided in barotropic and baroclinic inflows. The latter are driven by the salinity gradient between the Baltic and the North Sea, and occur mainly with calm summer conditions. During the rest of the year the barotropic forcing exceeds the baroclinic forcing considerably. Wind forcing and air pressure differences establish sea level differences between the Kattegat and the western Baltic, which drive barotropic inflow events. To have a significant impact on the deep water conditions in the central Baltic an inflow event must transport large amounts of saline and well oxygenated water into the western Baltic. These events are usually considered as Major Baltic Inflow.
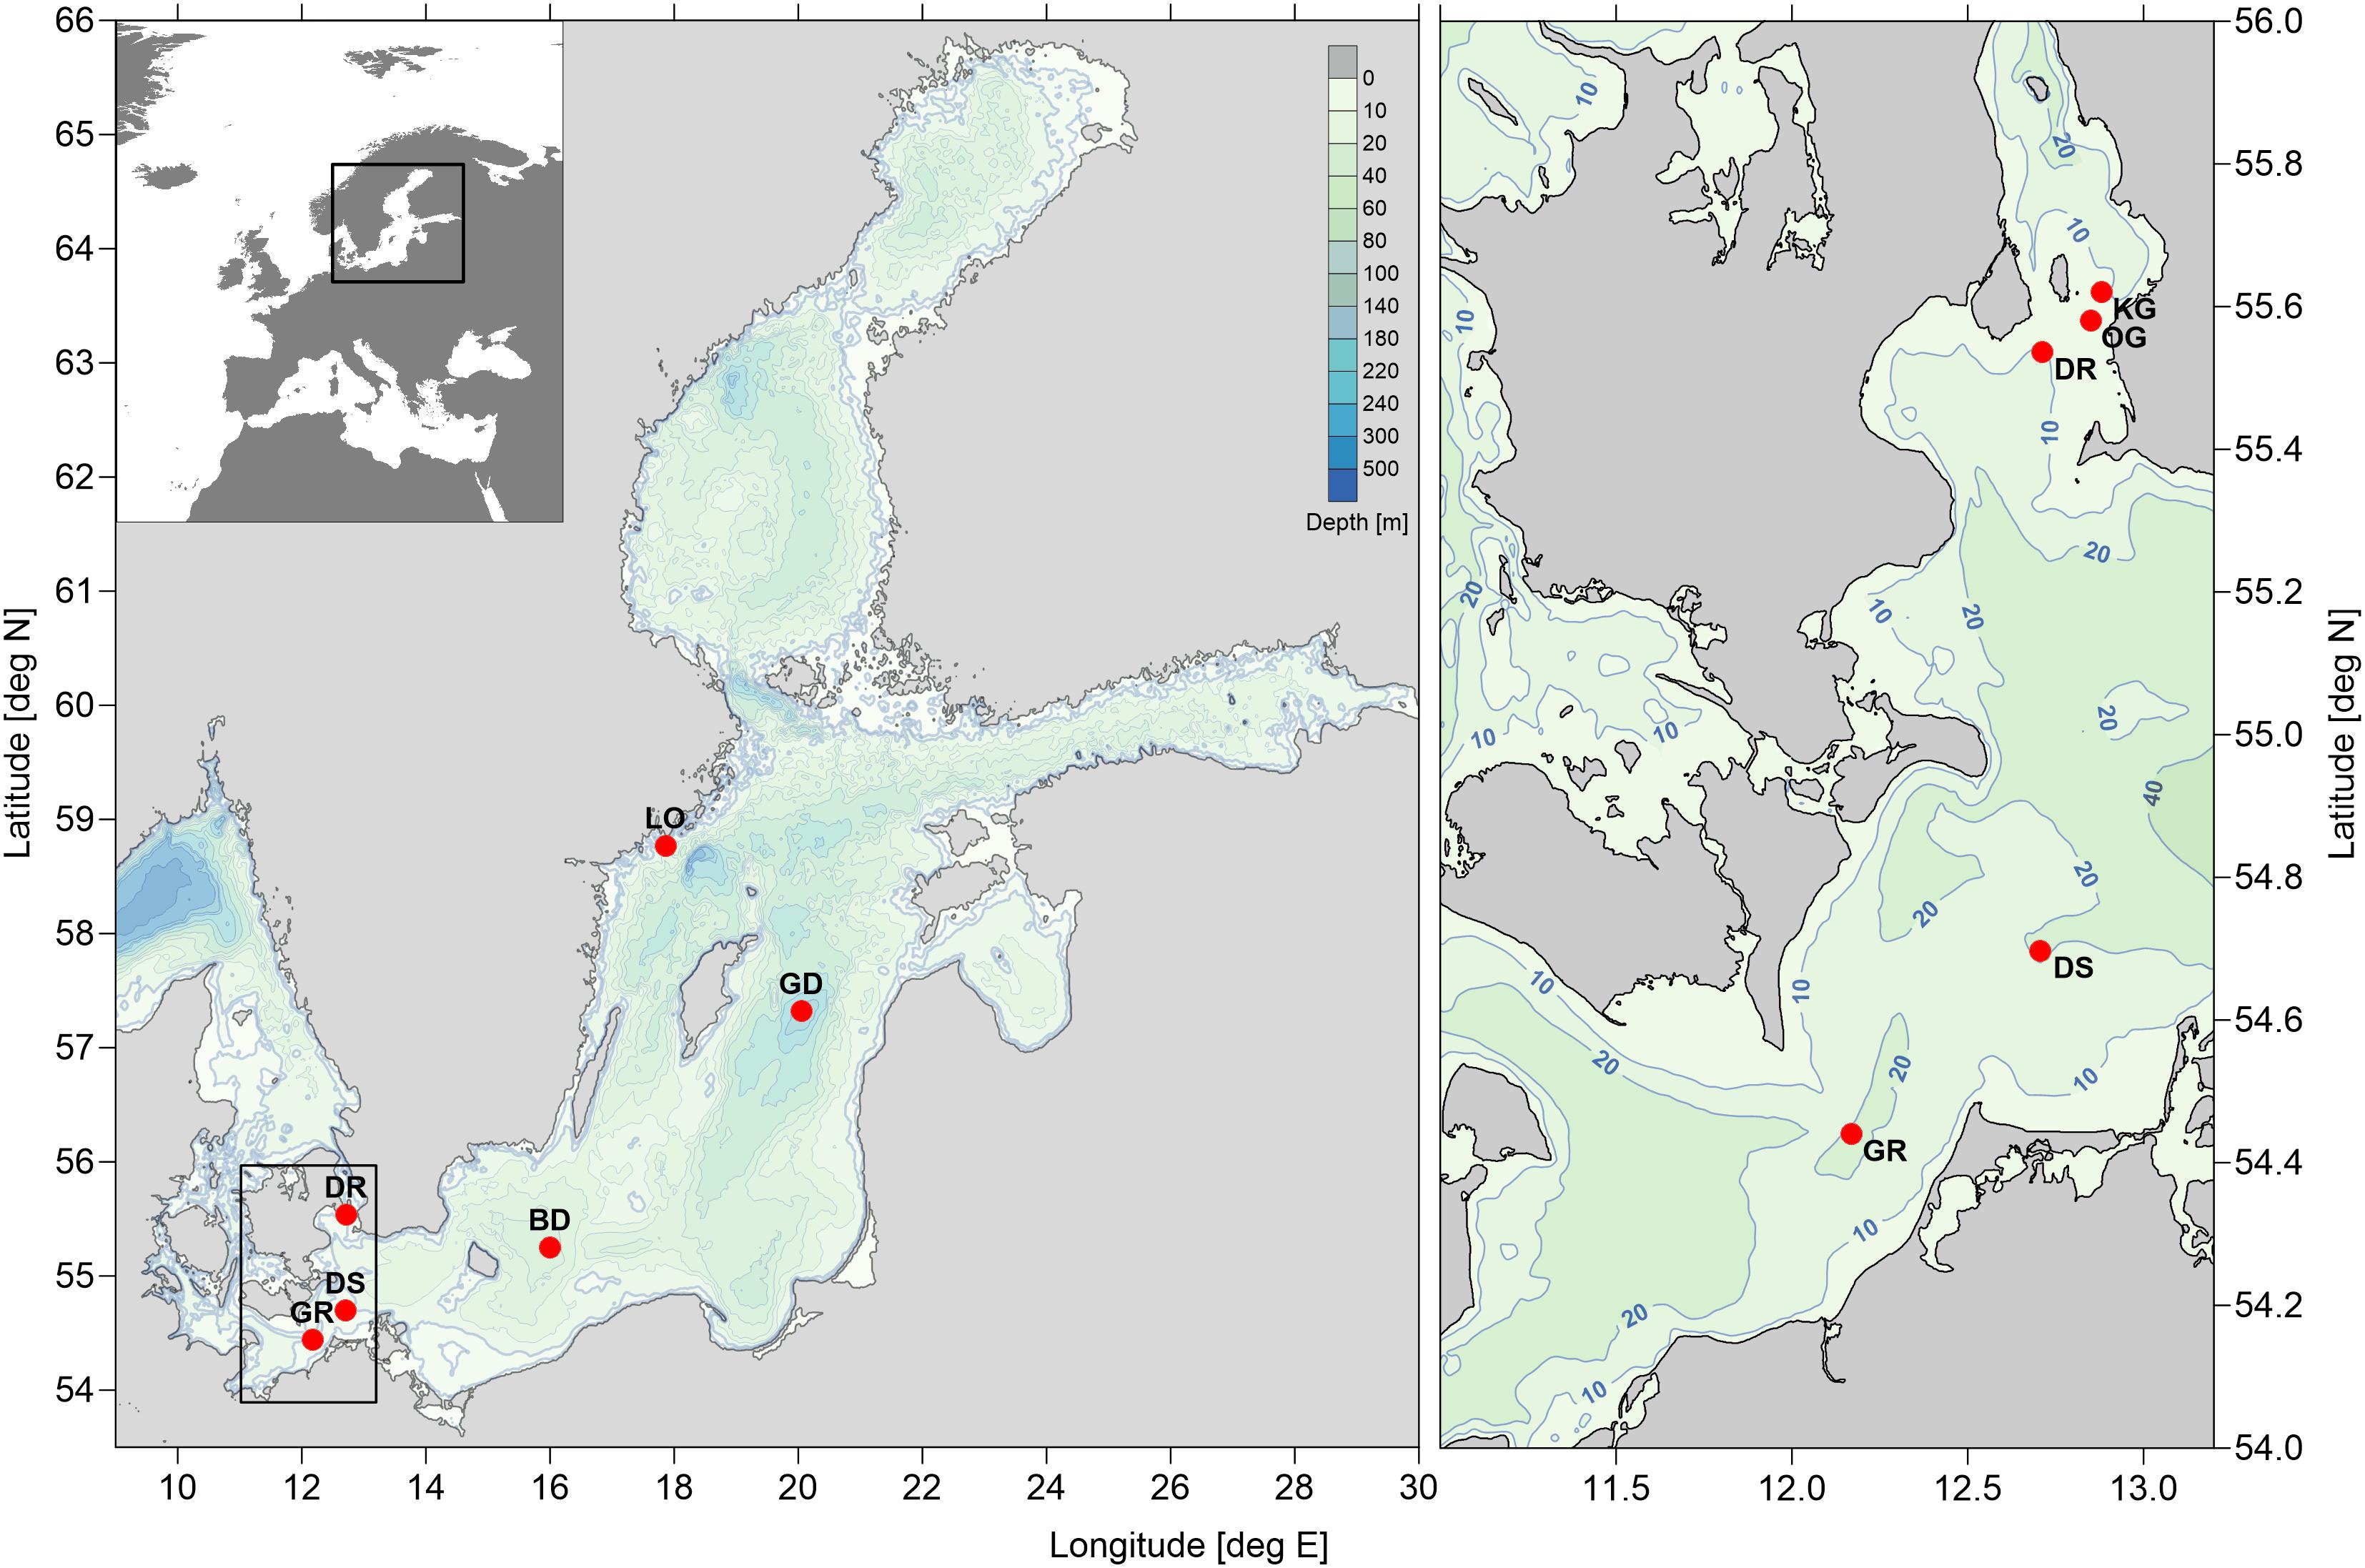
FIGURE 1. Topography of the Baltic Sea and the location of the time series stations used in this study. Gedser Rev (GR), Darss Sill (DS), Drogden Sill (DR), Oskarsgrundet (OG), Kalksgrundet (KG), Bornholm Deep (BD), Gotland Deep (GD), Landsort (LO).
After a long lasting stagnation period an extreme MBI was observed in December 2014 (Mohrholz et al., 2015). It was accompanied by a group of medium size inflows before and after the main inflow event (Naumann et al., 2016). The inflowing saline and oxygen rich water reached the central Baltic OMZ and turned the former anoxic deep water to oxic conditions. However, the ventilation effect was of shorter duration than expected, due to observations made after MBIs of recent decades (Neumann et al., 2017). This fact initiated a revision of the MBI contribution to the oxygen supply for the deep basins of the central Baltic. Surprisingly, the review of the existing time series of MBI frequency revealed strong evidence that the MBI time series established by Fischer and Matthäus (1996; referred to as FM96) is biased. There are four major issues contradicting a significant reduction of MBI frequency during the recent decades:
1. The mean salinity of the Baltic depicts no long term trend, although the number and intensity of MBI has strongly dropped since the early 1980s (Matthäus et al., 2006).
2. Since the early 1980s the FM96 MBI time series depict a significant lack of minor MBI’s, which should be the most frequent MBI group. This pointed to a bias in the MBI detection method.
3. There exists a mismatch between the MBI frequency in FM96 and the large volume change events (LVC) derived from mean sea level changes of the Baltic (Lehmann and Post, 2015; Lehmann et al., 2017).
4. And recent studies with “state of the art” numerical models predict a slightly increasing MBI frequency with warming climate and rising sea level in the transition zone between the Baltic and North Sea (Schimanke et al., 2014; Hordoir et al., 2015).
Definitions of MBI were provided by Wolf (1972); Franck et al. (1987), and most recently Fischer and Matthäus (1996). The detection of MBI based mainly on available long term salinity time series gathered in the Belt Sea and the Sound by Danish light ships. The barotropic inflow events were classified using a combination of empirical thresholds for the vertical salinity gradient, bottom salinity and duration time of inflow conditions (for details refer to the cited literature). The weak point of these definitions is the lack of a direct link to water transports, since current measurements were only occasionally available. Thus, Lehmann and Post (2015) invented the concept of “Large Volume Changes” to derive the intensity of inflow events from the related change in total water volume of the Baltic. They found a significant difference between MBI and LVC frequency, especially since the late 1980s, and attributed the decreasing MBI frequency to a negative trend in eastern types of atmospheric circulation with a concurrent increase in western circulation types (according Jenkinson and Collison, 1977). However, Rutgersson et al. (2014) did not found robust long term trends in wind forcing and precipitation in the Baltic Sea area, despite a pronounced interannual variability. Also Schimanke et al. (2014) have shown that the probability of typical meteorological forcing conditions for MBI has not changed. Only the period between 1983 and 1993 depict a lack of MBI favoring meteorological forcing conditions.
The exceptional MBI in December 2014 provided the possibility to compare different approaches for estimation of inflow volume and salt amount. Mohrholz et al. (2015) used direct salinity and current measurements at the Darss Sill, the total volume change of the Baltic and a hydrodynamic model for independent estimates of inflow intensity. Within their uncertainty limits all methods showed comparable results. Also the FM96 MBI definition was applied to two different time series in the Belt Sea (Gedser Rev and Darss Sill). The results revealed a high sensitivity of derived FM96 MBI intensity from the location of times series measurements, and provided the first hint for a reason of the supposed bias in the FM96 MBI series.
The overall objective of this study is to establish an improved continuous MBI time series for the period from 1887 till present, based on the available long term observations. The gaps of the FM96 time series for the World War I and II will be filled, and the long term trends in the frequency of barotropic inflows are investigated. The paper will supply also a critical review of the inflow frequency and strength during the recent 120 years, and deals with the problem of current MBI definition.
Materials and Methods
Volume Transport
Intense barotropic inflow events cause a rapid increase of the total water volume V of the Baltic. Thus, the water budget of the Baltic can be used to calculate the inflow volume of saline water from the North Sea. The temporal change of the total water volume V depends on river runoff R, evaporation E, precipitation P, and the volume flow through the Danish Straits Q.
Using the mean sea level η and the surface area A of the Baltic east of the Danish Straits the volume transport Q through the Danish Straits is:
Evaporation and precipitation approximately balance each other (HELCOM, 1986). The climatological value of mean precipitation minus evaporation surplus is considered with a constant value of 39.7 km3a-1, neglecting the small temporal variability of this fresh water flux.
Mean Sea Level
The calculation of volume transport through the Danish straits requires consistent time series of mean Baltic Sea level and river runoff to the Baltic. The time series for the mean sea level of the Baltic was derived from observations at Landsort and Landsort Norra, published by the SMHI Opendata server (SMHI, 2018b). The station Landsort is the best representation of the mean sea level of the Baltic, well proved by several studies (Lisitzin, 1974; Jacobsen, 1980; Franck and Matthäus, 1992; Feistel et al., 2008). The station is located in the central Baltic near the knot line of the first barotropic basin mode (Wübber and Krauss, 1979; Jönsson et al., 2008). Hourly sea level data are available from November 1886 to September 2006 for the station Landsort (17.87°E 58.74°N) and from October 2004 onward for the station Landsort Norra (17.86°E 58.77°N). Both time series were detrended to remove the long term signal of eustatic and isostatic land lift. The overlapping range from October 2004 to September 2006 was used to fit both data sets to each other. The standard deviation of remaining differences between both stations was 2.04 cm for the hourly data. In the overlapping range the constructed sea level time series consist- of hourly mean values of detrended sea level data combined from both stations.
Local wind forcing on time scales up to some days are accountable for occasional strong sea level changes in the low pass filtered time series. To remove this interfering signal a threshold filter was applied, which sets a limit for the maximum sea level change per day. The shallow and narrow Danish straits depict a limited transport capacity and act as a low pass filter for the total volume change per time (Lass, 1988). For a given sea level difference Δηs between the Kattegat and the western Baltic the transport Q can be estimated with a quadratic frictional law (Jacobsen, 1980; Omstedt, 1987).
Where Kf is the empirical friction coefficient for the Belt Sea or the Sound, and B is a correction offset for the sea level difference, due to the baroclinic pressure gradient along the channel. The value of B is typically in the order of some centimeters. The uncertainty of this transport estimate is about 10% (Mattsson, 1996). The bottom limits of Kf are 1.6 ⋅ 10-10 s2m-5 and 2 ⋅ 10-11 s2m-5 for the Sound and the Belt sea, respectively (Jakobsen et al., 1997, 2010). The sea level difference between the Kattegat and the western Baltic exceeds seldom 100 cm (Hela, 1944). The maximum observed sea level difference between the stations Gedser and Hornbaek since 1900 till present was 280 cm. Using the limits for Kf and a maximum sea level difference Δηs of 300 cm the top limit of transport through the Danish straits is about 45 km3d-1. This corresponds to a maximum mean sea level change of 12 cm d-1, and compares to estimates given by Hela (1944) and Lass (1988). Landsort sea level changes higher than this limit are not caused by water exchange with the North Sea and were removed from the time series.
Other pronounced short term fluctuations of sea level at Landsort, that not exceed the threshold of maximum sea level change, are caused by Seiches, inertial motions, tides and partially local wind forcing. These processes are not related to the transport in the Danish straits. The slowest of these signals is the first seiche of the Baltic proper with a period of 27 h. To eliminate the short term fluctuations of the processes, which are not contribute to the total volume change, the sea level time series was low pass filtered using a 4th order Butterworth filter of 0.0347 h-1 (1.2 days) cut off frequency. The filtered time series of Landsort sea level was used as mean Baltic Sea level for the calculation of total volume changes.
River Discharge
The second important component of the water budget is the fresh water surplus from rivers, draining into the Baltic. On average the mean river discharge of 436 km3 a-1 is nearly comparable to the total inflow of saline water from the North Sea, and about 10 times larger than the net fresh water flux from precipitation and evaporation at the sea surface. However, the river discharge depicts large seasonal and interannual variability, which is taken into account for the volume transport estimation. River discharge data were obtained from several sources. Unfortunately, they do not cover the entire time range from 1886 till today. Annual discharge data are available from 1950 till 2012 from the HELCOM fact sheets (Kronsell and Andersson, 2013). Estimates of annual river discharge from 1901 to 1949 were taken from Cyberski et al. (2000). For the period before 1901 reconstructed runoff data from Hansson et al. (2011) were used. Monthly runoff data are available from Mikulski (1982) for the years 1921–1975, and from Cyberski et al. (2000) for the years 1976–1990. From 1981 till 2017 daily discharge from HYPE model output (setup: E-HYPEv3.1.3_GFD; HYPE_version_4_10_9) is provided by SMHI (2018a). The model was calibrated with daily data from river discharge stations.
Using the data listed above, an annual discharge time series for the period 1887–2017 and a monthly time series for the period 1921–2017 were constructed. Additionally, monthly climatology of runoff for the period 1921–1940 was calculated from the Mikulski (1982) data set. The climatology and the annual discharge time series are used to calculate monthly discharge data for the period 1887–1920. This enabled a reconstruction of a monthly discharge time series for the entire period 1887–2017. Afterward, daily discharge data were interpolated from the monthly time series. A detailed statistical analysis of Baltic river discharge is beyond the scope of this study and can be found e.g., in Bergström and Carlsson (1994).
The derived time series of hourly sea level change and daily runoff are used to calculate a time series of total barotropic volume transport Q(t) into the Baltic according equation (2). The climatological value of mean precipitation minus evaporation surplus is considered with a constant daily surplus of 0.109 km3d-1.
Salinity Data
The calculation of salt mass imported during an inflow requires information on the salinity of inflowing water. For some periods salinity data in the Belt Sea and the Sound are available from lightship observations, fixed stations and buoys. The time scale of the inflow processes in the order of a few days requires at least daily observations to cover an inflow event in proper resolution. For the Belt Sea, namely the Darss Sill area, daily salinity data are available from the Danish light vessel “Gedser Rev” between 1897 and 1976. This data set has two major gaps due to the world wars I and II (Feistel et al., 2008). A second data set of daily salinity observations from the MARNET station Darss Sill is available for the period 1992 till present. Fischer and Matthäus (1996) used the same data set. Salinity at both locations has been measured at varying depth and slightly different positions in the subsequent measuring periods. To estimate a consistent daily time series of mean salinity for the entire period of investigation the data were interpolated vertically to an equidistant depth vector of 1m resolution. Since the vertical salinity gradient is weak during a barotropic inflow the interpolation causes only a minor uncertainty. The interpolated salinity profiles were averaged to obtain a daily time series of mean salinity at the eastern edge of the Belt sB(t).
A bias in the salinity time series is caused by the different observation positions. The MARNET station Darss Sill is located about 47 km east of the Gedser Rev light ship position. The cross section of the Belt Sea nearly doubles from 0.461 km2 at Gedser Rev to 0.844 km2 at the MARNET station (Mohrholz et al., 2015). Between both stations the inflowing saline water is diluted by entrainment of brackish surface water from the Arkona Basin. Unfortunately, there exists no overlapping period of time series observations at both positions which allows the estimation of salinity decrease. However, model results suggest a mean decrease of salinity of inflowing water of approximately 1.5 between both stations (Mohrholz et al., 2015). Thus, the mean salinity measured at the Darss Sill was increased by this offset to get a consistent time series for the entire study period.
The salinity data in the Belt Sea cover 68% of time period from 1887 to 2017. Major gaps in the time series of mean salinity exist before 1897, during both world wars (November 1915 – February 1920, and November 1939 – September 1945), and between April 1976 and November 1991. For these gaps the salinity of inflowing water has been prescribed with mean values of 18.2 and 21.7 for the Belt Sea and the Sound, respectively. Which are the mean values for 90 major inflow events between 1897 and 1976 (Fischer and Matthäus, 1996). The standard deviation of these mean values is 1.2 and 1.4. The application of constant inflow salinities causes an uncertainty of 7–8% in the total salt mass of inflow events, that occurred in periods with no salinity observations.
Salinity data for the Sound are available from light ship observations at Oskarsgrundet (55°35′N, 12°51′E) and Kalksgrundet (55°37′N, 12°53′E), published by the SMHI Opendata server (SMHI, 2018b). The data cover a period from January 1883 to December 1961 at Oskarsgrundet, and from January 1883 to December 1922 at Kalksgrundet, respectively. Both time series depict several gaps. The most comprehensive period with daily observations is from January 1883 to December 1922. Afterward the observation frequency was reduced to a 10 days interval. Another data set of salinity data in the Sound was obtained from the EMODNET data base. This time series cover the period from June 2001 to July 2010 for the station Drogden (55°32′N, 12°43′E). The station is located about 8km southeast of the historical Oskarsgrundet lightship position, but well inside the Sound (compare Figure 1).
Salt Transports
To calculate the transports of saline water into the Baltic the time series of total volume transport Q(t) was split with a fixed ratio into the volume transports trough Belt QB(t) and the Sound QS(t).
The ratio has been analyzed by several authors and ranged usually between 75 and 80% for the Belt Sea and 25 to 20% for the Sound (e.g., Jacobsen, 1980; Mattsson, 1996). The ratios 80/20%, 78/22%, and 75/25% were applied to test its impact on the total salt mass imported during an MBI. In the following the subscripts B and S are used to indicate the similar variables for the Belt and the Sound. If the used equations are the same for both channels only the equation for the Belt is given.
Usually, there exists a salinity front between brackish Baltic surface water and the saline surface water of the Kattegat. During outflow conditions this front is located at the northern edge of the Danish Straits. Before an inflow of high saline water into the western Baltic occurs the salinity front has to be shifted beyond the Darss Sill in the Belt and the Drogden Sill in the Sound. This inflow period, till the high saline water arrives the Darss Sill, was described as precursory period of a MBI (Matthäus and Franck, 1992), which lasts usually 5–25 days. During that time the Belt Sea and the Sound is flushed with saline Kattegat water. Due to the different volumes and transport capacities of both channels the salinity front reaches the Baltic first in the Sound and some days later in the Belt Sea. Since the salinity time series have large gaps it was not possible to derive the periods, when the salinity front is located at the Baltic side of the sills, for the entire study period from these data. Instead the transports in the Belt and the Sound, derived from volume change of the Baltic, were used to estimate the approximate positions pB(t) and pS(t) of the salinity front for each channel. During inflow conditions the simulated salinity front was shifted from the Kattegat [p(t) = 0] toward the Baltic until it reached the Baltic edge of the channel [p(t) = 1], and vice versa. The front positions were calculated stepwise for each time step t, using an effective buffer volume Vbuffer of 110 km3 for the Belt Sea and 10 km3 for the Sound, respectively:
The buffer volumes were derived from the topographic data from Seifert et al. (2001), excluding larger areas of the Kiel bight and Mecklenburg Bight in the Belt Sea. The buffer volumes compare to the brackish water inflow volumes of the precursory period of the recent MBI in December 2014 (Mohrholz et al., 2015), which were estimated with 103 and 110 km3 for the Belt Sea using two independent calculation methods.
Time series of inflowing water volume were derived from the time series of barotropic transport in both channels:
The transports of salt S(t) into the Baltic were calculated by multiplying the inflowing water volume V(t) with the mean salinity s for the Belt Sea and the Sound. Only transports at times when the salinity front p(t) is located at the Baltic side of the cannels [p(t) = 1] were counted as import of saline water into the Baltic.
Detection of MBI Events
Afterward the MBIs have to be detected in the time series of inflow volume and imported salt mass. The direct application of the MBI criteria developed by FM96 is not possible, since it is based on stratification and bottom salinity in the Belt and the Sound. This method is an indirect measure for the saline transport. The criteria that an inflow must at least last for five consecutive days at the Darss Sill to be counted as MBI can be applied to our transport time series. However, it is artificial in the sense that there is no natural drop in the frequency distribution of inflow event durations at this value.
From the time series of inflow volumes single barotropic inflow events were determined by identification of all periods with continuous inward directed volume transports [V(t) > 0]. This results in a high number of short term barotropic inflow events at both channels, since the high variability of transport in the straits causes frequent flow reversals. This often splits larger inflows into several minor events. Franck et al. (1987) counted two consecutive inflow events as a single one, if the interruption between both events was shorter than 2 days and bottom salinity and stratification coefficient fit to certain limits. This was not applicable for our approach of volume and salt transports. For the decision whether subsequent inflow events belongs to a single larger inflow event the time series of sea level at Landsort was used again. The response time of the Baltic Sea level to external barotropic forcing, e.g., sea level changes in the Kattegat, is about 10 days (Lass, 1988). This is applied to identify whether consecutive inflow events belongs to a single major inflow. The mean sea level time series was low pass filtered with a Butterworth filter of 10 days cut off period. In this low pass filtered time series short term fluctuations of the Baltic mean sea level, which cause short flow reversals in the Danish straits, are removed. Now subsequent inflow events which occure during the same period of monotonic increasing sea level, derived from the 10 days low pass filtered mean sea level time series, were combined to a single inflow event. This reduced the total number of barotropic inflow events from 2781 to 2022 during the period from 1887 to 2017.
Afterward for each inflow event the start and end time of the inflow, the begin of saline overflow, the total inflow volume, the volume of saline water and the imported salt mass were calculated for both transport channels. Nearly 70% (1415) of the barotropic inflow events were strong enough to carry high saline water into the Baltic. These events consist of two types: inflows that transport high saline water exclusively through the Sound into the Baltic and inflow events with saline water inflow through both channels. For the statistical analysis and the comparison with the MBI time series of Fischer and Matthäus (1996) three subsets of inflow events were extracted. The set DD1 covers all events with an inflow of saline water for at least 1 day at the Drogden Sill in the Sound. The set DS1 contains inflow events with saline inflow via the Sound and at least 0.5 day saline inflow at the Darss Sill. All events that last at least 5 days at the Darss Sill were summarized in the set DS5, most comparable to the FM96 time series. The DS5 is a subset of DS1, which is a subset of DD1 events.
Bottom Conditions in the Central Bornholm Basin and Eastern Gotland Basin
The revised time series of MBI events were proved with data of environmental conditions in the deep layer (85–90 m) of the Bornholm Basin and the eastern Gotland Basin (200 m). Data of deep water temperature, salinity and oxygen concentration were obtained from the ICES data base (International Council for the Exploration of the Sea [ICES], 2014) and from the IOW ODIN database. The data were gathered mainly in frame of the particular national monitoring activities of the Baltic neighboring countries and during numerous research projects. Although the observation and sampling methods for temperature, salinity and oxygen concentration changed with time, all available data were merged to a single time series for each parameter. Salinity data are given in the unit of practical salinity according to TEOS-10 (IOC et al., 2010). Oxygen concentrations are given in the old unit [ml l-1], since it is the original unit of the majority of the oxygen data. The time series of Bornholm basin deep water covers a period from 1960 till present, and consists of 2930 data points gathered in the vicinity of the station Bornholm deep (BY5, 55°15′N 15°59′E). The salinity time series for the eastern Gotland Basin contain data from 1877 till present. The majority of 924 data points were gathered after 1951 at or near the station Gotland deep (BY15, 57°19′N 20°03′E).
Results
The sequence of barotropic inflow events were calculated for three different ratios of transport between Belt Sea and the Sound (75/25, 78/22, and 80/20) and for varying prescribed salinity at times without salinity observations (salinity Sound/Belt: 17.2/20.7, 18.2/21.7, and 19.2/22.7). The results were averaged and the uncertainty of imported salt mass for each inflow event was calculated. The total number of inflow events in the particular subsets DS5, DS1 and DD1 during the period 1897–2017 was 132, 296, and 1415, respectively. The imported salt mass of inflow events of the DS5 subset is depicted in Figure 2 together with their uncertainty, and the salinity at 200 m in the eastern Gotland basin. The total salt mass of the strongest events ranges between 2 and 5 Gt. Extreme events with more than 4 Gt salt import were found in 1898, 1921, 1951, and 2014. The strongest event is the December inflow 1951 with 4.66 Gt salt import. The averaged properties of the inflow events of the DS5, DS1, and DD1 subsets are summarized in Table 1.
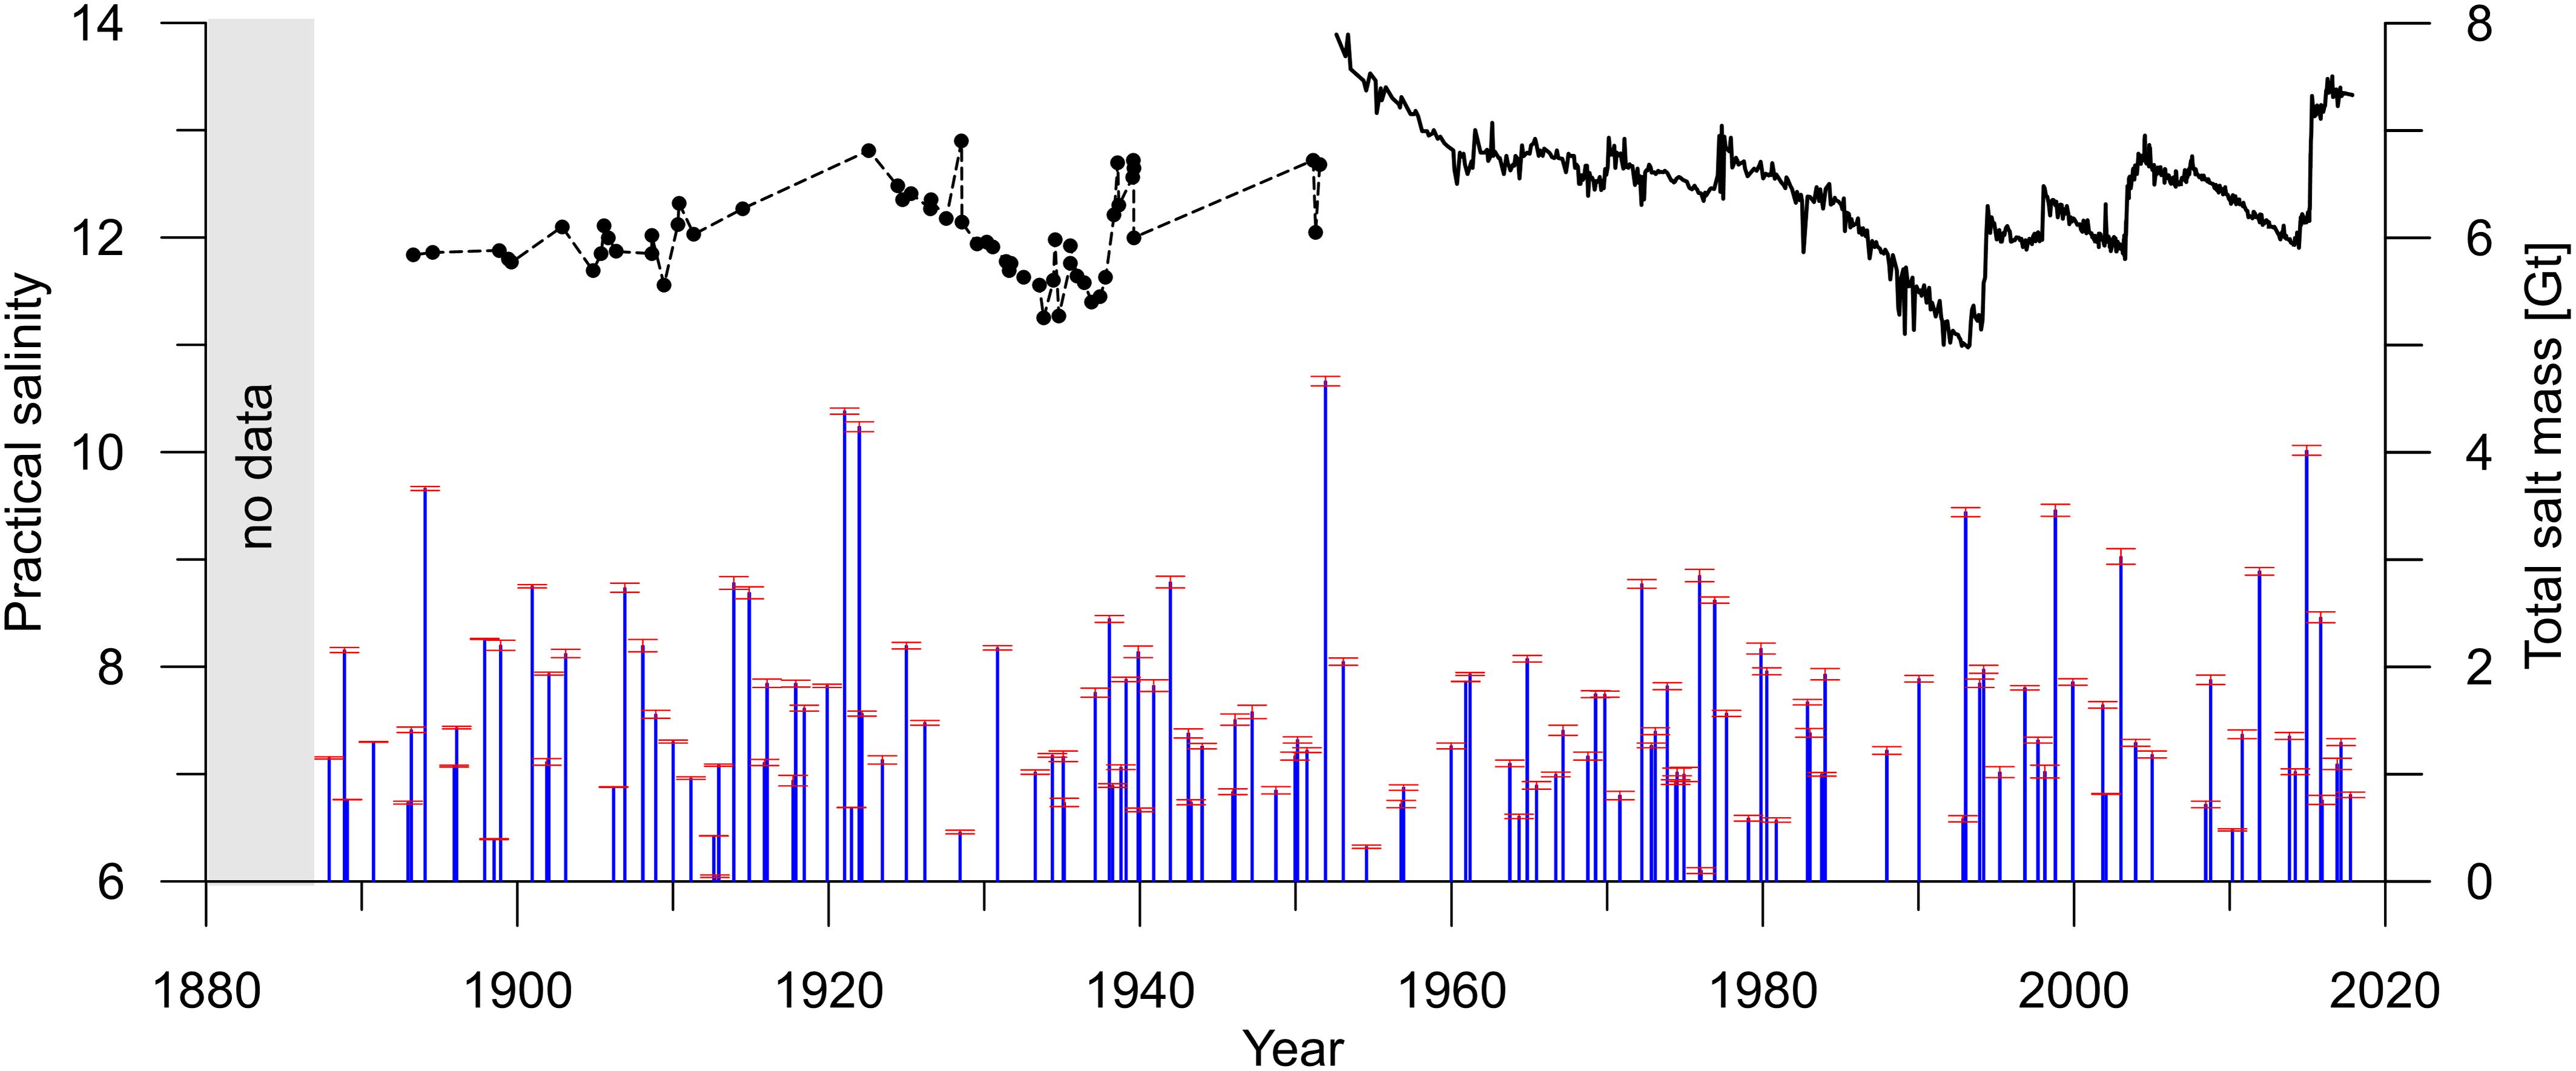
FIGURE 2. Timing and total salt mass of barotropic inflow events of inflow set DS5 (blue bars) and their uncertainty (red range), compared to the salinity time series at 200 m depth in the central eastern Gotland basin.
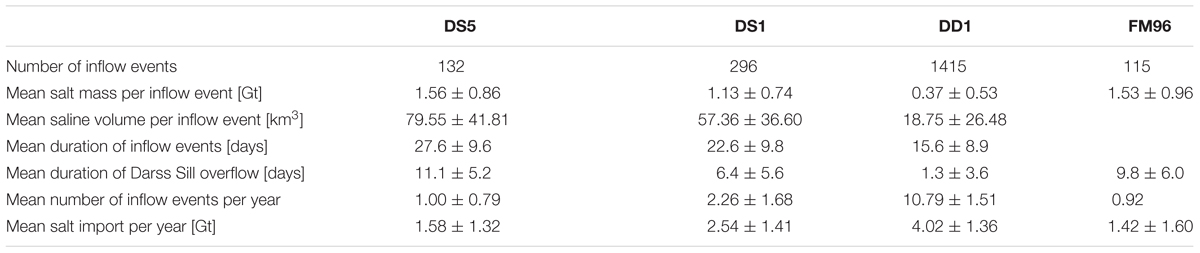
TABLE 1. Number of barotropic inflow events and averaged properties for the inflow subsets DS5, DS1, DD1, and the FM96 inflow sequence for the period 1887–2017.
To estimate long term trends the number of barotropic inflows per year and the related salt import per year were calculated for the three inflow subsets. Due to their stochastic nature the event frequency as well as the annual salt import depicts large year to year fluctuations especially for the DS5 subset. Thus, the number of inflow events were merged into subsequent 5 years sections, and the salt import time series were filtered with a smoothed running mean low pass filter of 11 years cut off period. The results are shown in Figure 3. The annual number of inflow events of the subsets DD1 and DS1 depict only minor year to year changes. The DS5 inflow set has a pronounced interannual variability, shown in the number of inflow events for the 5 years sections. Long term averages of the number of inflow events revealed 10, 23, and 108 events in per 10 years for the subsets DS5, DS1 and DD1, respectively. Also the annually imported salt mass increases from 1.58 to 2.54, and 4.02 Gt for the three time series. The barotropic inflow number and annual salt import of the subsets DS1 and DS5 depict inter decadal fluctuations with an estimated period of 20–30 years. Local minima in the number of larger inflow events (DS5) and in the annual salt import of all subsets were found in 1905, 1930, 1960, 1987, and 2007. Local maxima were observed in 1898, 1920, 1940, 1975, and 1996. Also the year 2017 seems to be close to a local maximum, although it might not reached jet. A statistical analysis revealed no significant long term trend in any of the data sets.
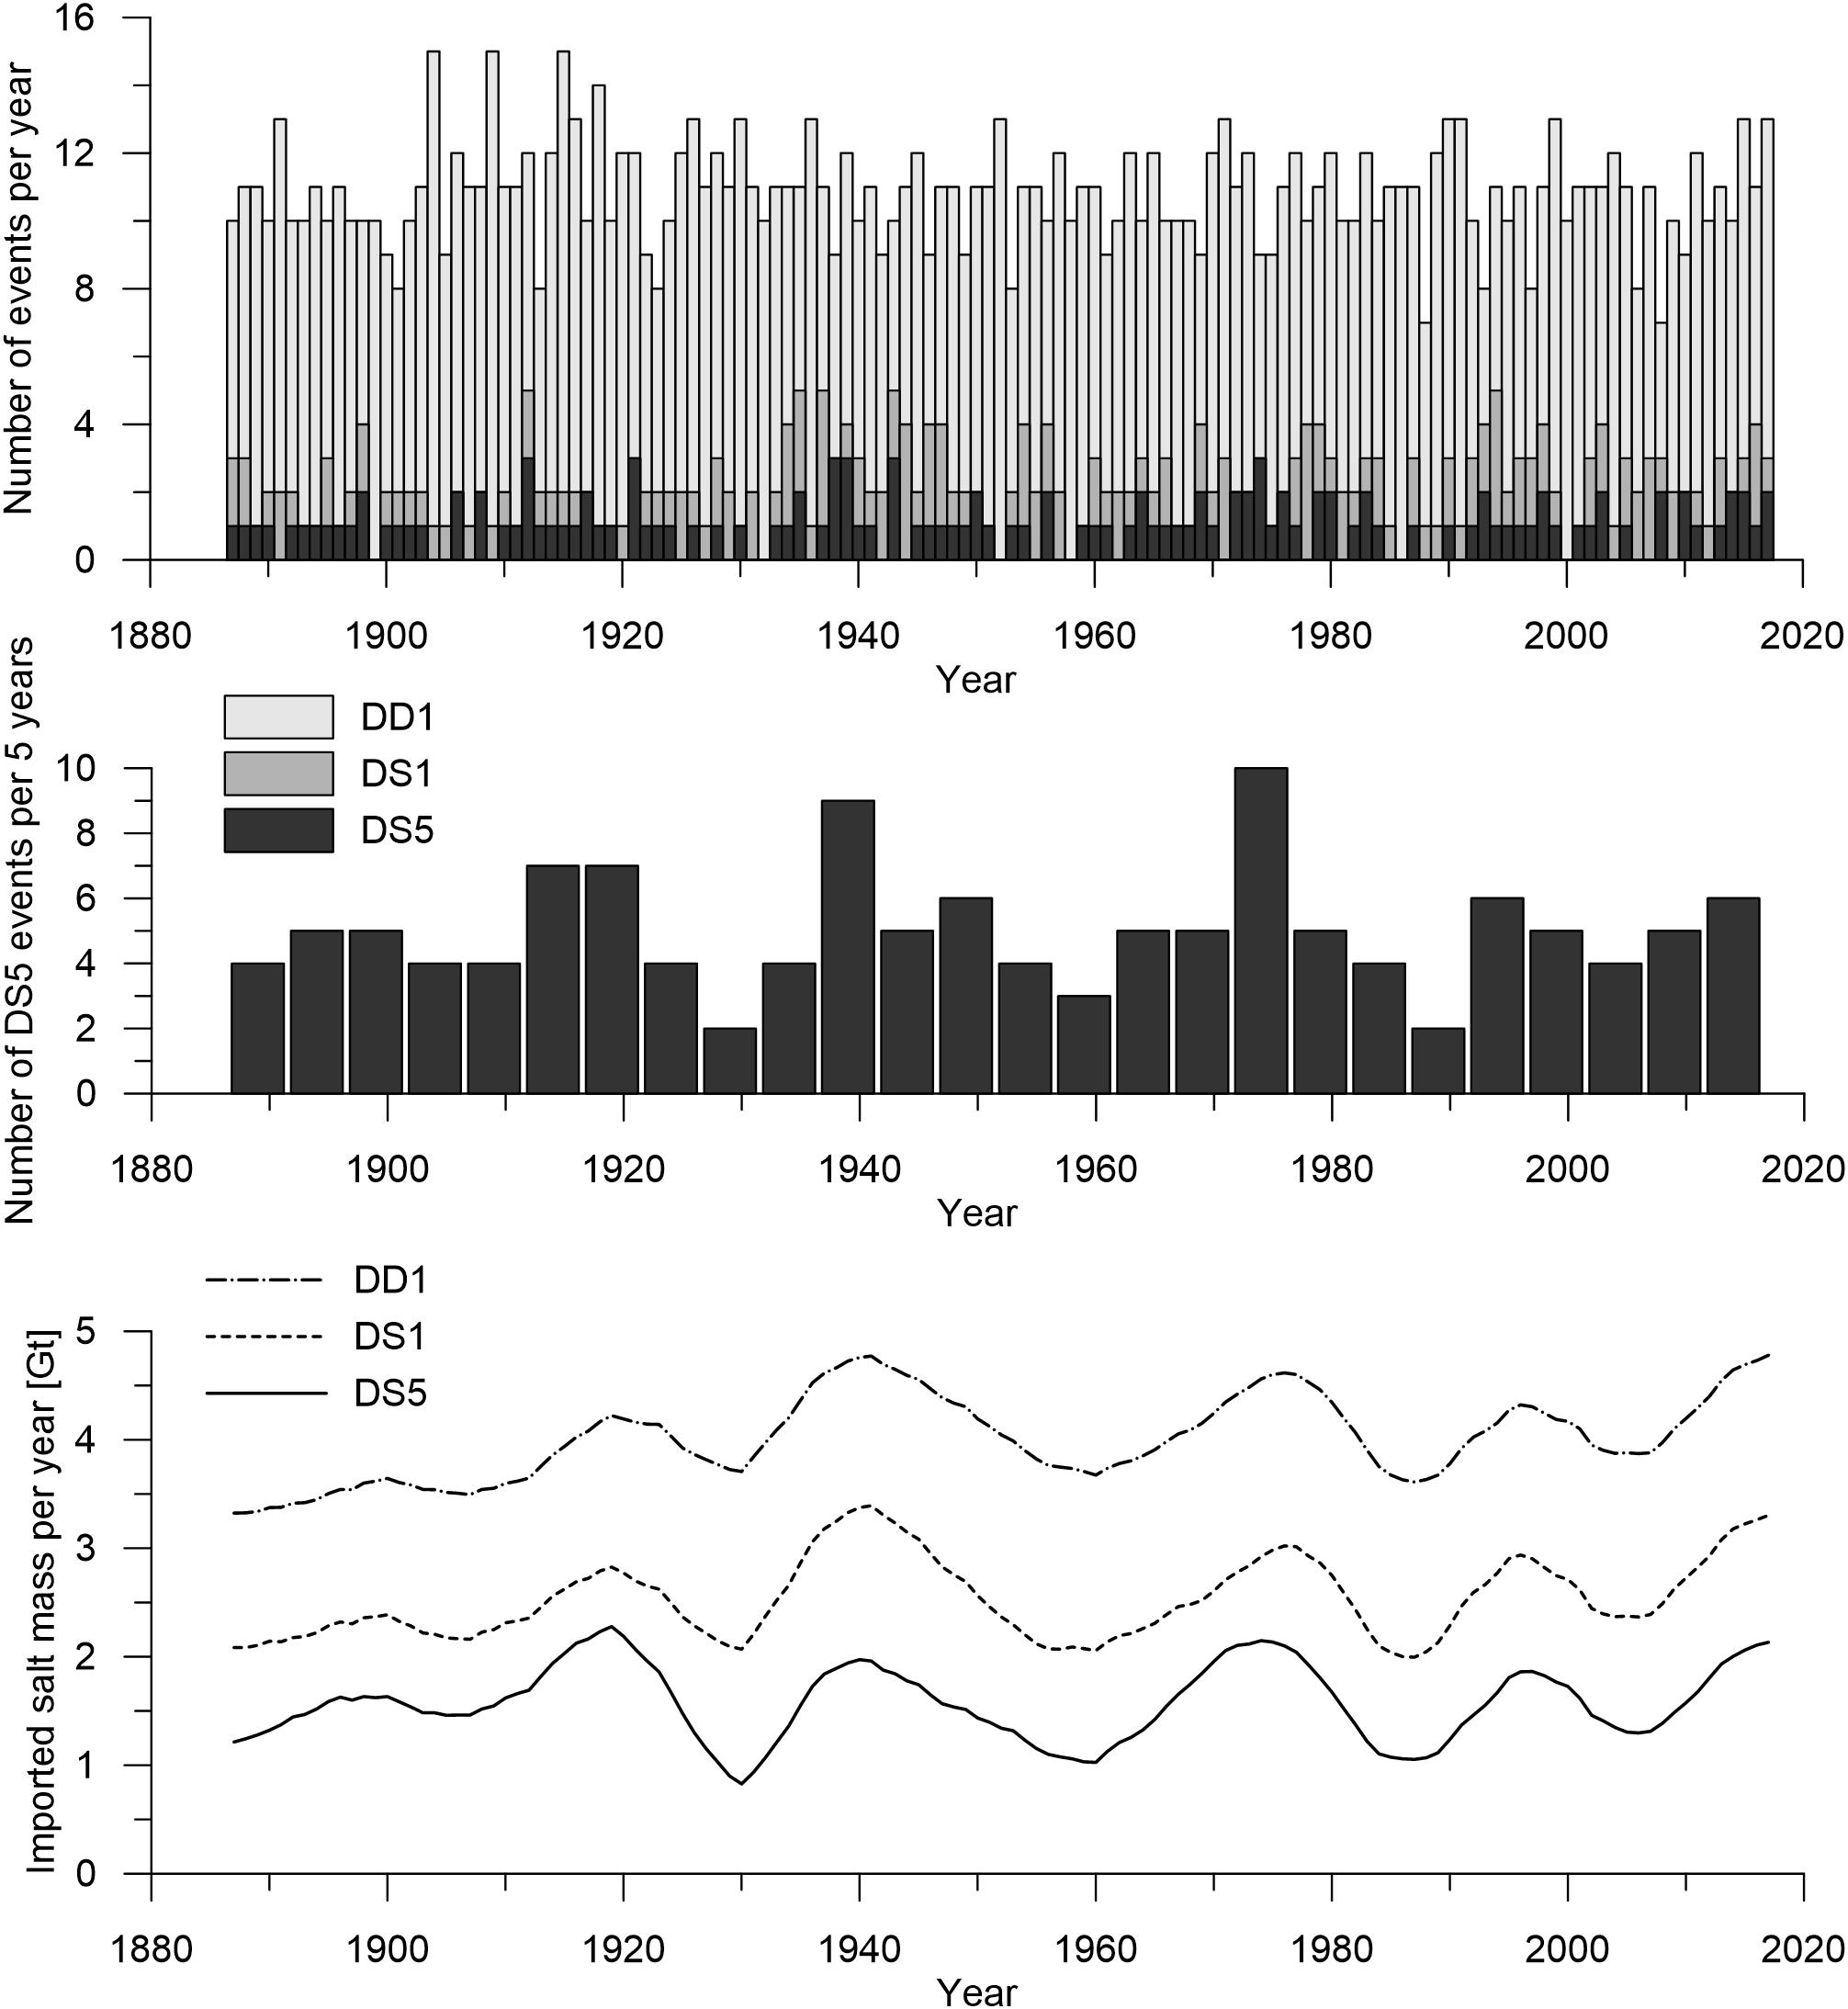
FIGURE 3. Number of barotropic inflow events per year in the subsets DD1, DS1, and DS5 (top). Number of barotropic inflow events per 5 year period in subset DS5 (middle) and the 11 year low pass filtered time series of salt mass annually imported by the inflow events of the subsets DD1, DS1, and DS5 (bottom).
The partition of saline inflow between the Belt Sea and the Sound varied between the particular inflow events (Figure 4). Generally, there is a shift of the contribution to imported salt mass from the Sound to the Belt Sea with increasing strength of the inflow events. For the majority of weak inflow events the ratio of salt mass passing through the Belt Sea to salt mass through the Sound is well below 1. However, there were also some weak events with a ratio exceeding 2. Events with a salt import of more than 2 Gt depicted always a ratio above 1, indicating the Belt as the main contributor to the salt import. As expected the amount of imported salt is directly correlated with the sea level change at Landsort during the active inflow, since the estimated transport in the Danish straits is derived from this sea level change. The majority of inflow events were related to a sea level change between 30 and 60 cm. Inflow events with sea level changes below 20 cm were exclusively minor events with less than 0.5Gt salt import in to the Baltic (Figure 4, right panel).
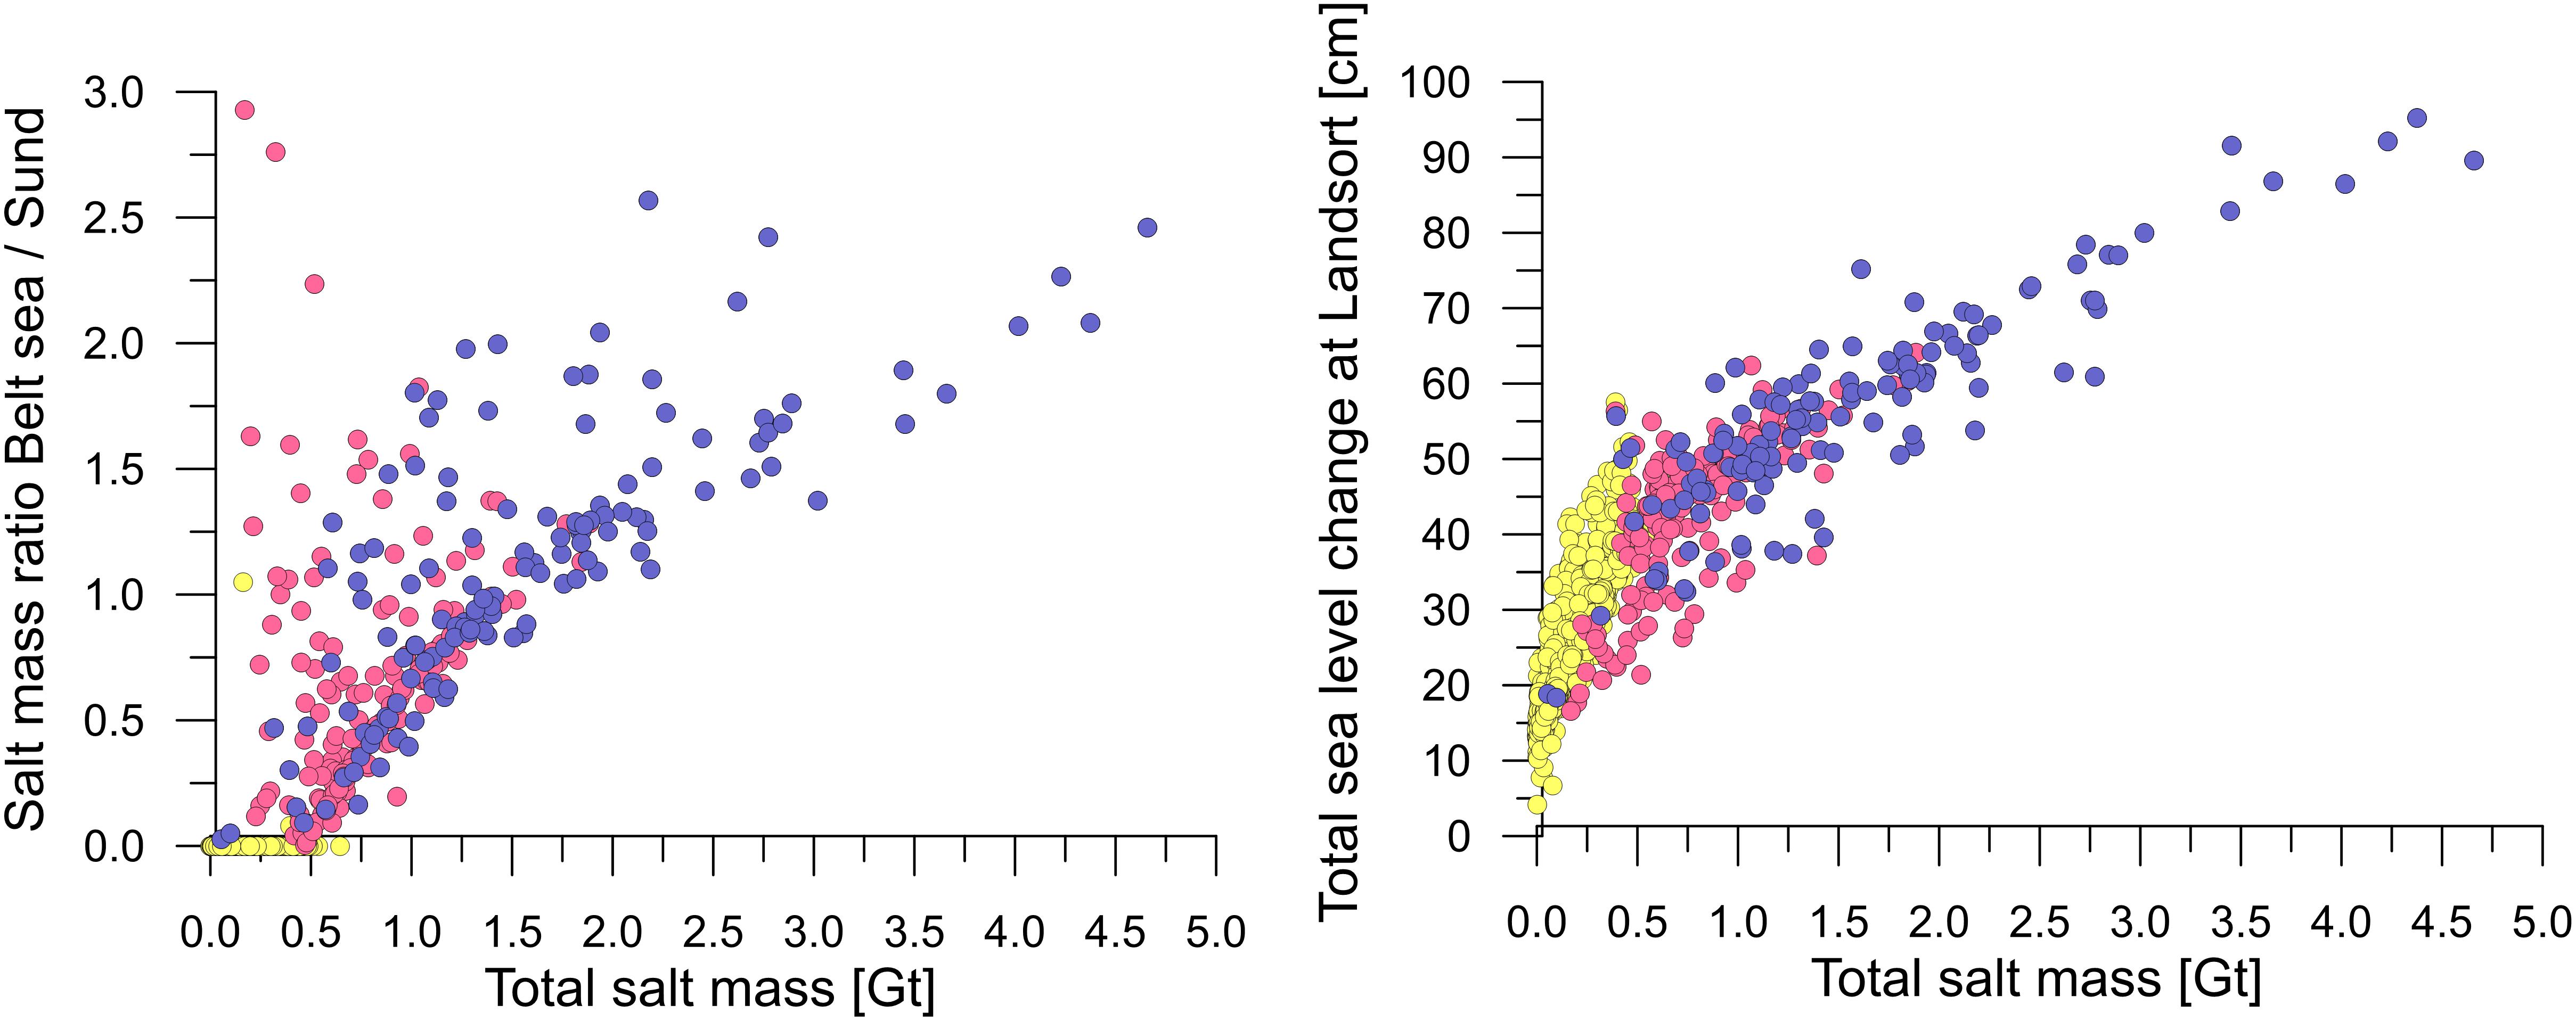
FIGURE 4. Partition of salt import between Belt Sea and Sound during barotropic inflow events (left), and relation of total sea level change at Landsort to the total salt import (right). Events of the subsets DS5 marked blue, DS1 red, and DD1 yellow.
For the further analysis the barotropic inflows were sorted into size classes according their imported salt mass. Two different size class sets were defined, one set with 0.5 Gt resolution for the entire period from 1887 to 2017, and a second one with 1 Gt resolution for the analysis of monthly distribution. For investigation of long term variation of inflow size class distribution the inflow series were split into three subsequent 40 year periods from 1896 to 1935, 1936 to 1975, and 1976 to 2015. The frequency of inflow events per size class follows roughly an exponential distribution if all barotropic inflow events were considered (DD1). For events with saline transport at the Darss Sill (DS1 and DS5) the number of small inflow events drop by one to two order of magnitudes, whereas the higher size classes remains unchanged (Figure 5). The monthly distribution of number of inflow events depends also on the inflow strength. Smaller inflows via the Sound (DS1) occurs nearly equal distributed throughout the year, with a 10–20% higher frequency in winter. Considering the entire period from 1887 to 2017 about one minor barotropic inflow per month is observed through the Sound. Barotropic events which also pass the Darss Sill are confined to the winter season with a maximum frequency in December.
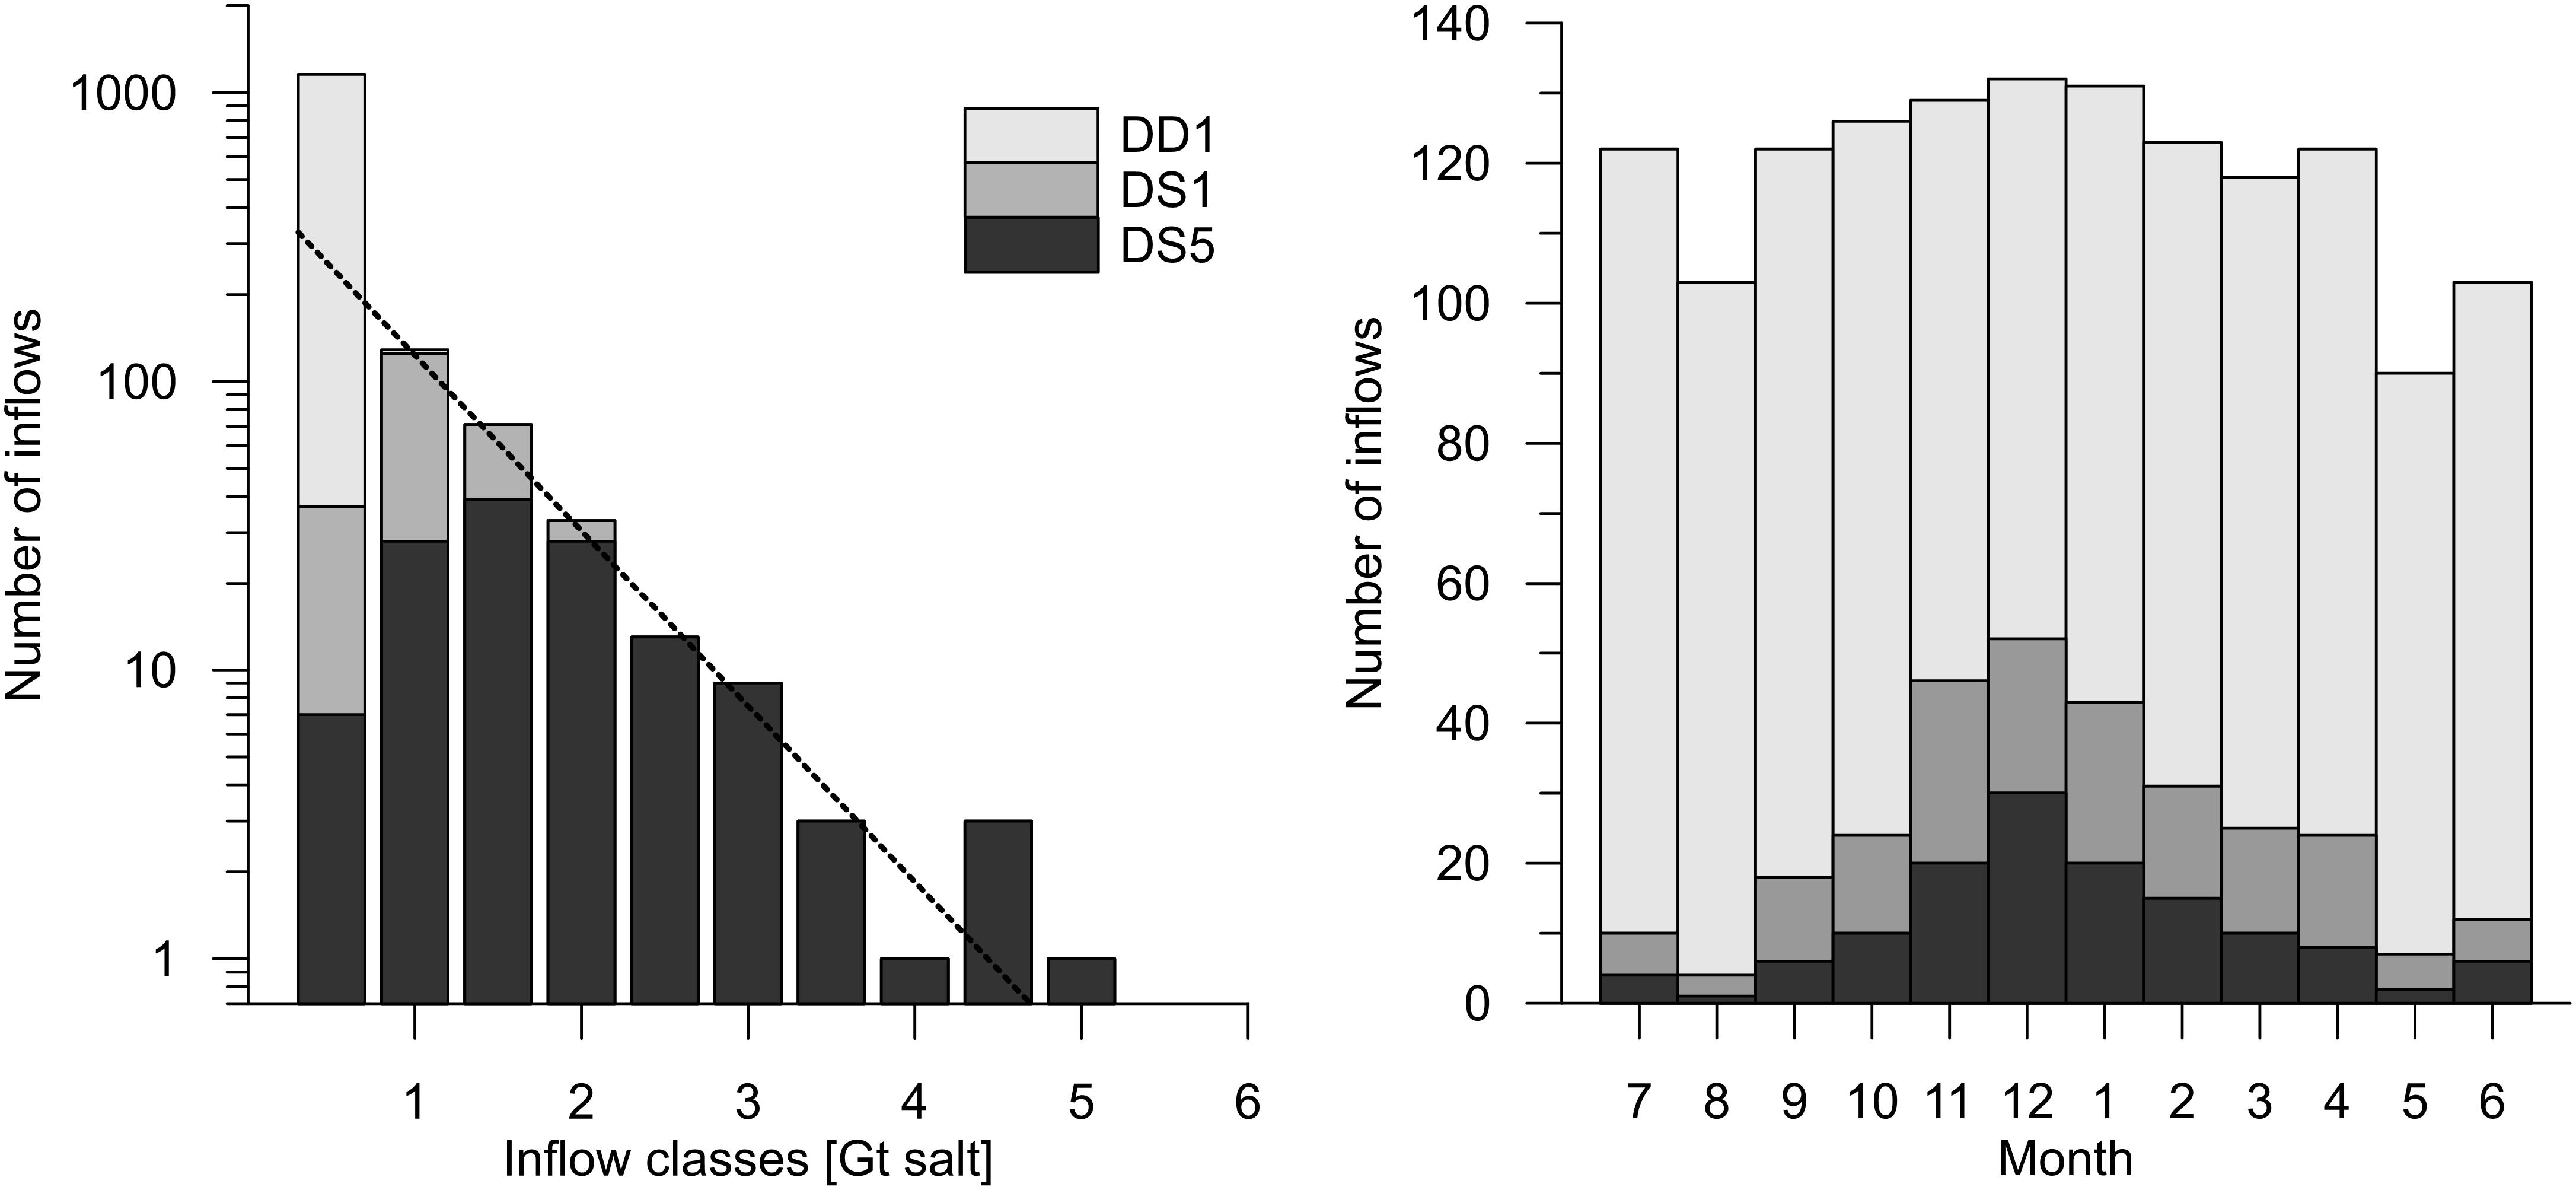
FIGURE 5. Frequency of inflow events, sorted according their size classes (left), and monthly distribution of all inflow events (right) of the inflow subsets DD1, DS1, and DS5.
The inflow subsets DS1 and DS5 were compared with the time series FM96 in the three 40 year periods (Figure 6). The FM96 contains in total 96 MBIs in this period, which are 20 events less than the DS5 set. However, FM96 has two gaps with no data during the World Wars I and II, in total 10.5 years. During 1896 to 1935 the number of event is comparable between the series FM96 and DS5 (Table 2). Also the size class distribution is nearly similar, taken into account the uncertainty due to different estimation methods and the low number of inflows. The monthly distribution of inflows depicts some differences for the smaller inflows. As expected the data set DS1 contains a larger number of minor inflows than FM96 and DS5 since these events do not meet the 5 days duration criteria at the Darss Sill, and thus they are not classified as an MBI. However, the number of medium and large inflows compares to FM96 and DS5. For the period 1936 to 1975 the inflow distributions match the shape of the previous period. Again FM96 and DS5 depict nearly the same number of inflow events in all size classes. Also during this period the number of small inflow events in data set DS1 is higher than in FM96 and DS5. The monthly distribution of medium and large events is comparable between the three inflow series. A significant difference of FM96 and DS5 was observed for the 40 years period from 1976 to 2015. The number of inflow events in FM96 dropped from 40 and 45 events in the previous periods to only 11 for the last 40 years. This was caused mainly by a lack of minor and medium size inflow events. The time series DS5 and DS1 did not depict a similar behavior. There the number of inflows remains at the level of the preceding periods. Also their monthly distribution did not change for the third 40 year period.
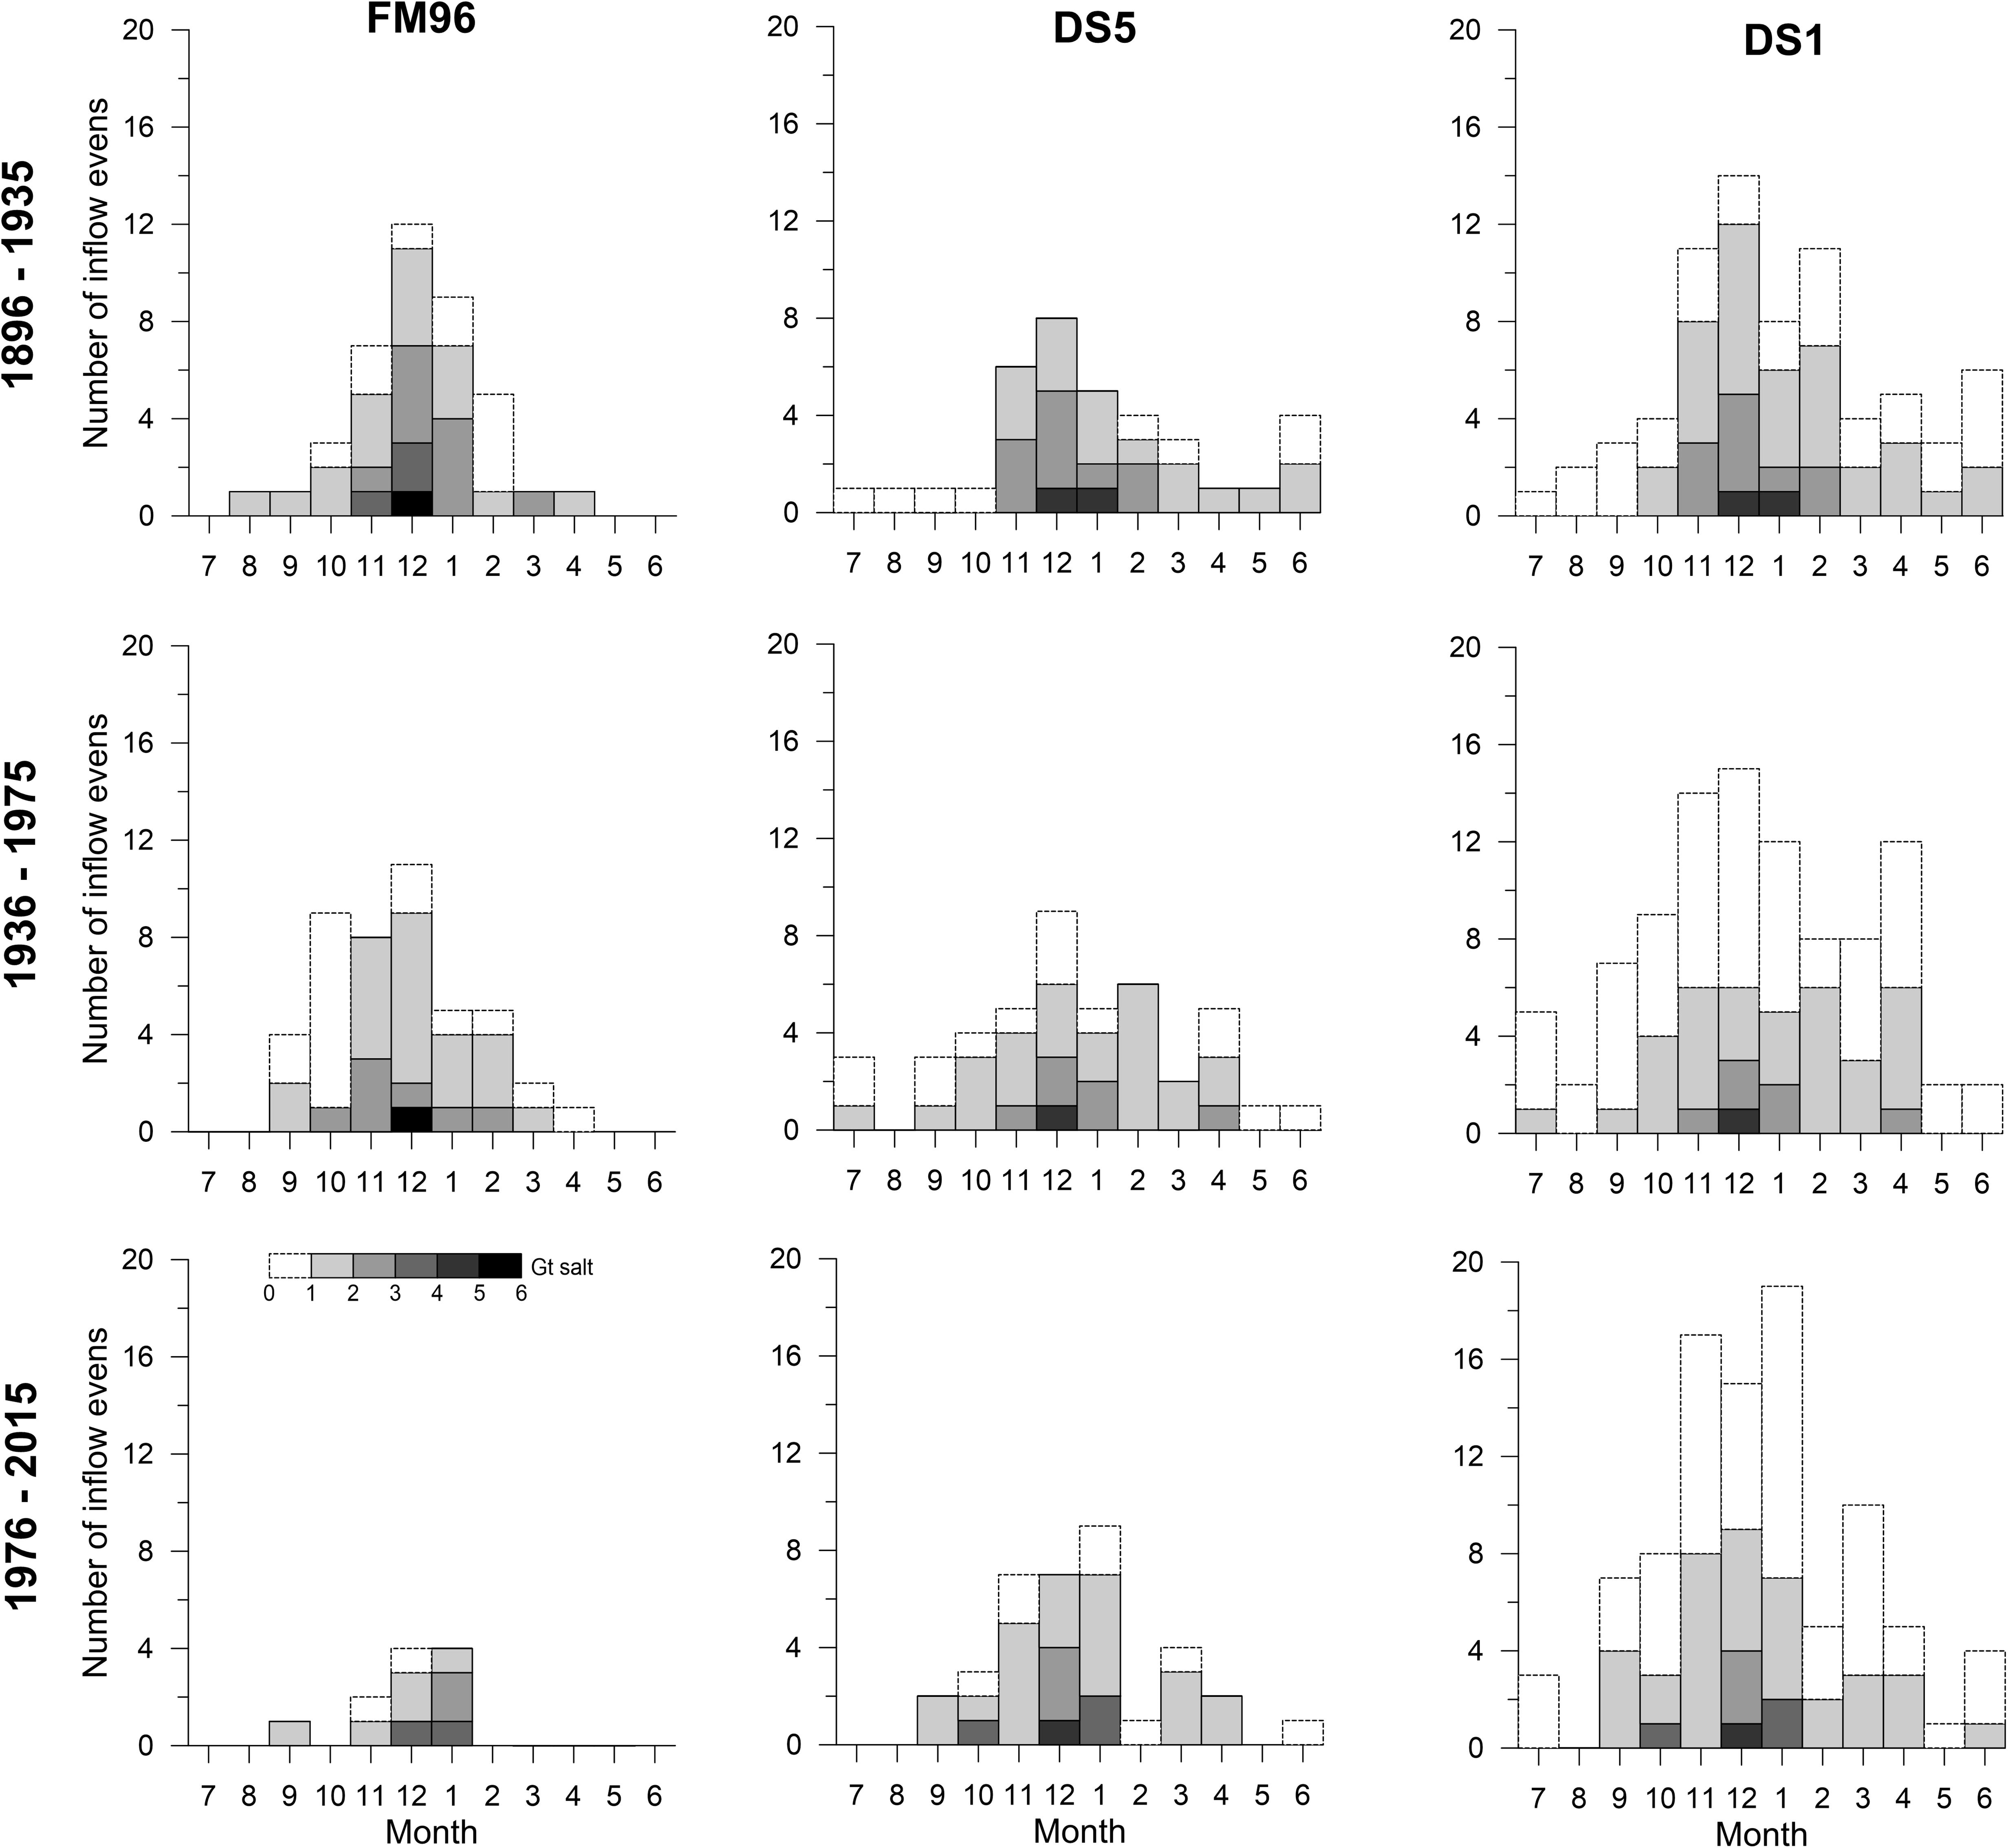
FIGURE 6. Monthly frequency of inflow classes during the three subsequent 40-year periods of 1896–1935 (top), 1936–1975 (middle), and 1976–2015 (bottom) for the inflow series FM96, DS5, and DS1.
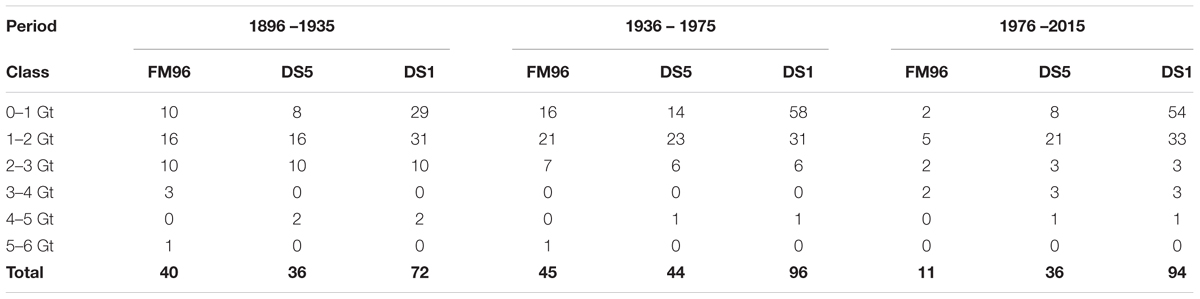
TABLE 2. Number of barotropic inflow events of inflow series FM96, DS5, and DS1 for three 40 year periods and different size classes.
To analyze the correlation between the FM96 events and the new time series the events from the subsets DS5, DS1, and DD1 were related to concurrent FM96 events. All 108 FM96 events that occurred after 1887 are present in the DD1 subset. A number of 93 and 61 of the FM96 events were found in the DS1 and DS5 subsets, respectively. The imported salt mass of inflow events from the FM96 series were correlated to the DS5 subset events. A linear fit through origin revealed a correlation coefficient R2 of 0.8 (Figure 7). The FM96 events that were not contained in the DS5 subset belongs to size classes below 2 Gt. All strong and extreme events were found in both data sets.
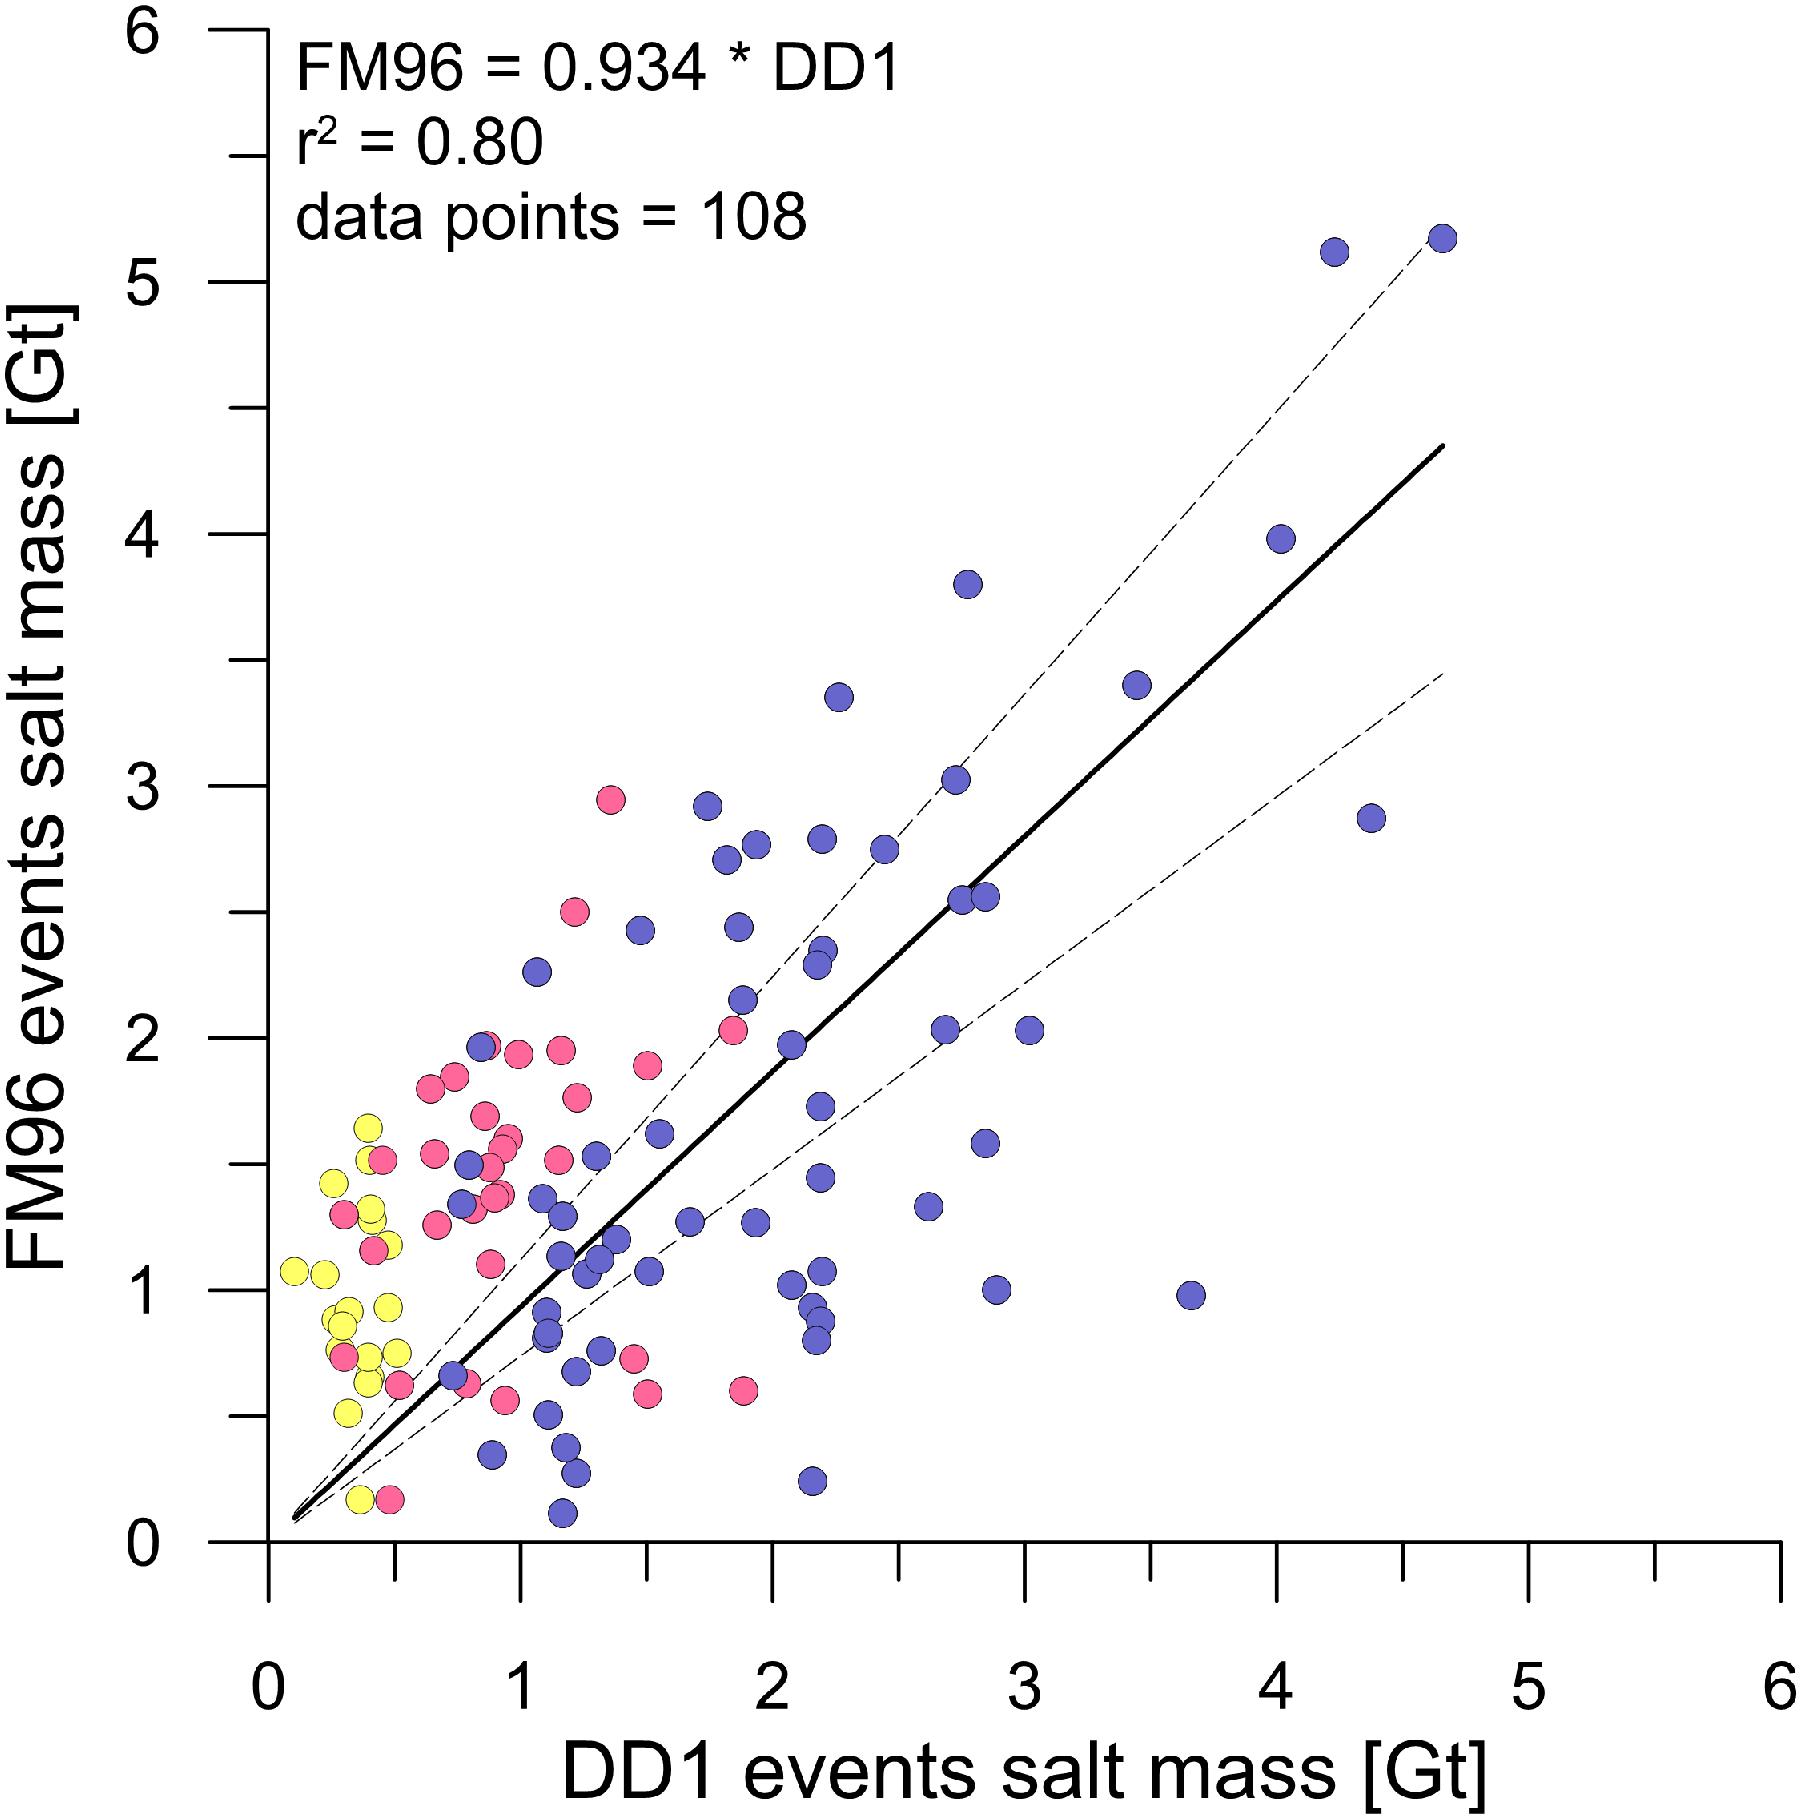
FIGURE 7. Correlation of FM96 events and related inflow events of the subsets DS5 (blue), DS1 (red) and DD1 (yellow). A fit through origin and its 99% confidence interval is indicated by the black solid and dashed lines.
The timing and strength of time series DS5 and DS1 inflow events were compared with the temporal behavior of salinity and oxygen concentration in the deep water layer (85–90 m) of the Bornholm basin for the period from 1960 till present. MBIs are potentially strong enough to change the environmental conditions at least in the western Baltic. Thus, the inflow events should leave their footprint in the Bornholm basin deep water properties. The salinity time series depict a saw tooth like pattern (Figure 8). The steep increases in deep water salinity occurred about 20–30 days after the inflow events. The jumps are followed by a phase of slowly decreasing salinity, due to diapycnal mixing and entrainment of low saline water from the overlaying top layer. The larger jumps in salinity with a change larger than 2 gkg-1 are related to the medium to strong inflow events of 1969, 1972, 1975, 1982/83, 1993, 2003, and 2014. However, also a number of smaller events cause jumps in the salinity. There are some medium size inflows that have almost no impact on deep water salinity in the Bornholm basin, e.g., 1964, 1973, 1984, or 1994. These events occurred during periods with high deep water salinity, established by a preceding inflow. Not every salinity jump can be related to a DS5 inflow event. Also some of the DS1 events were strong enough to change the deep water salinity considerably (e.g., 1986, 1989, 1992, 2006, and 2010). This was confined to periods with bottom salinity.
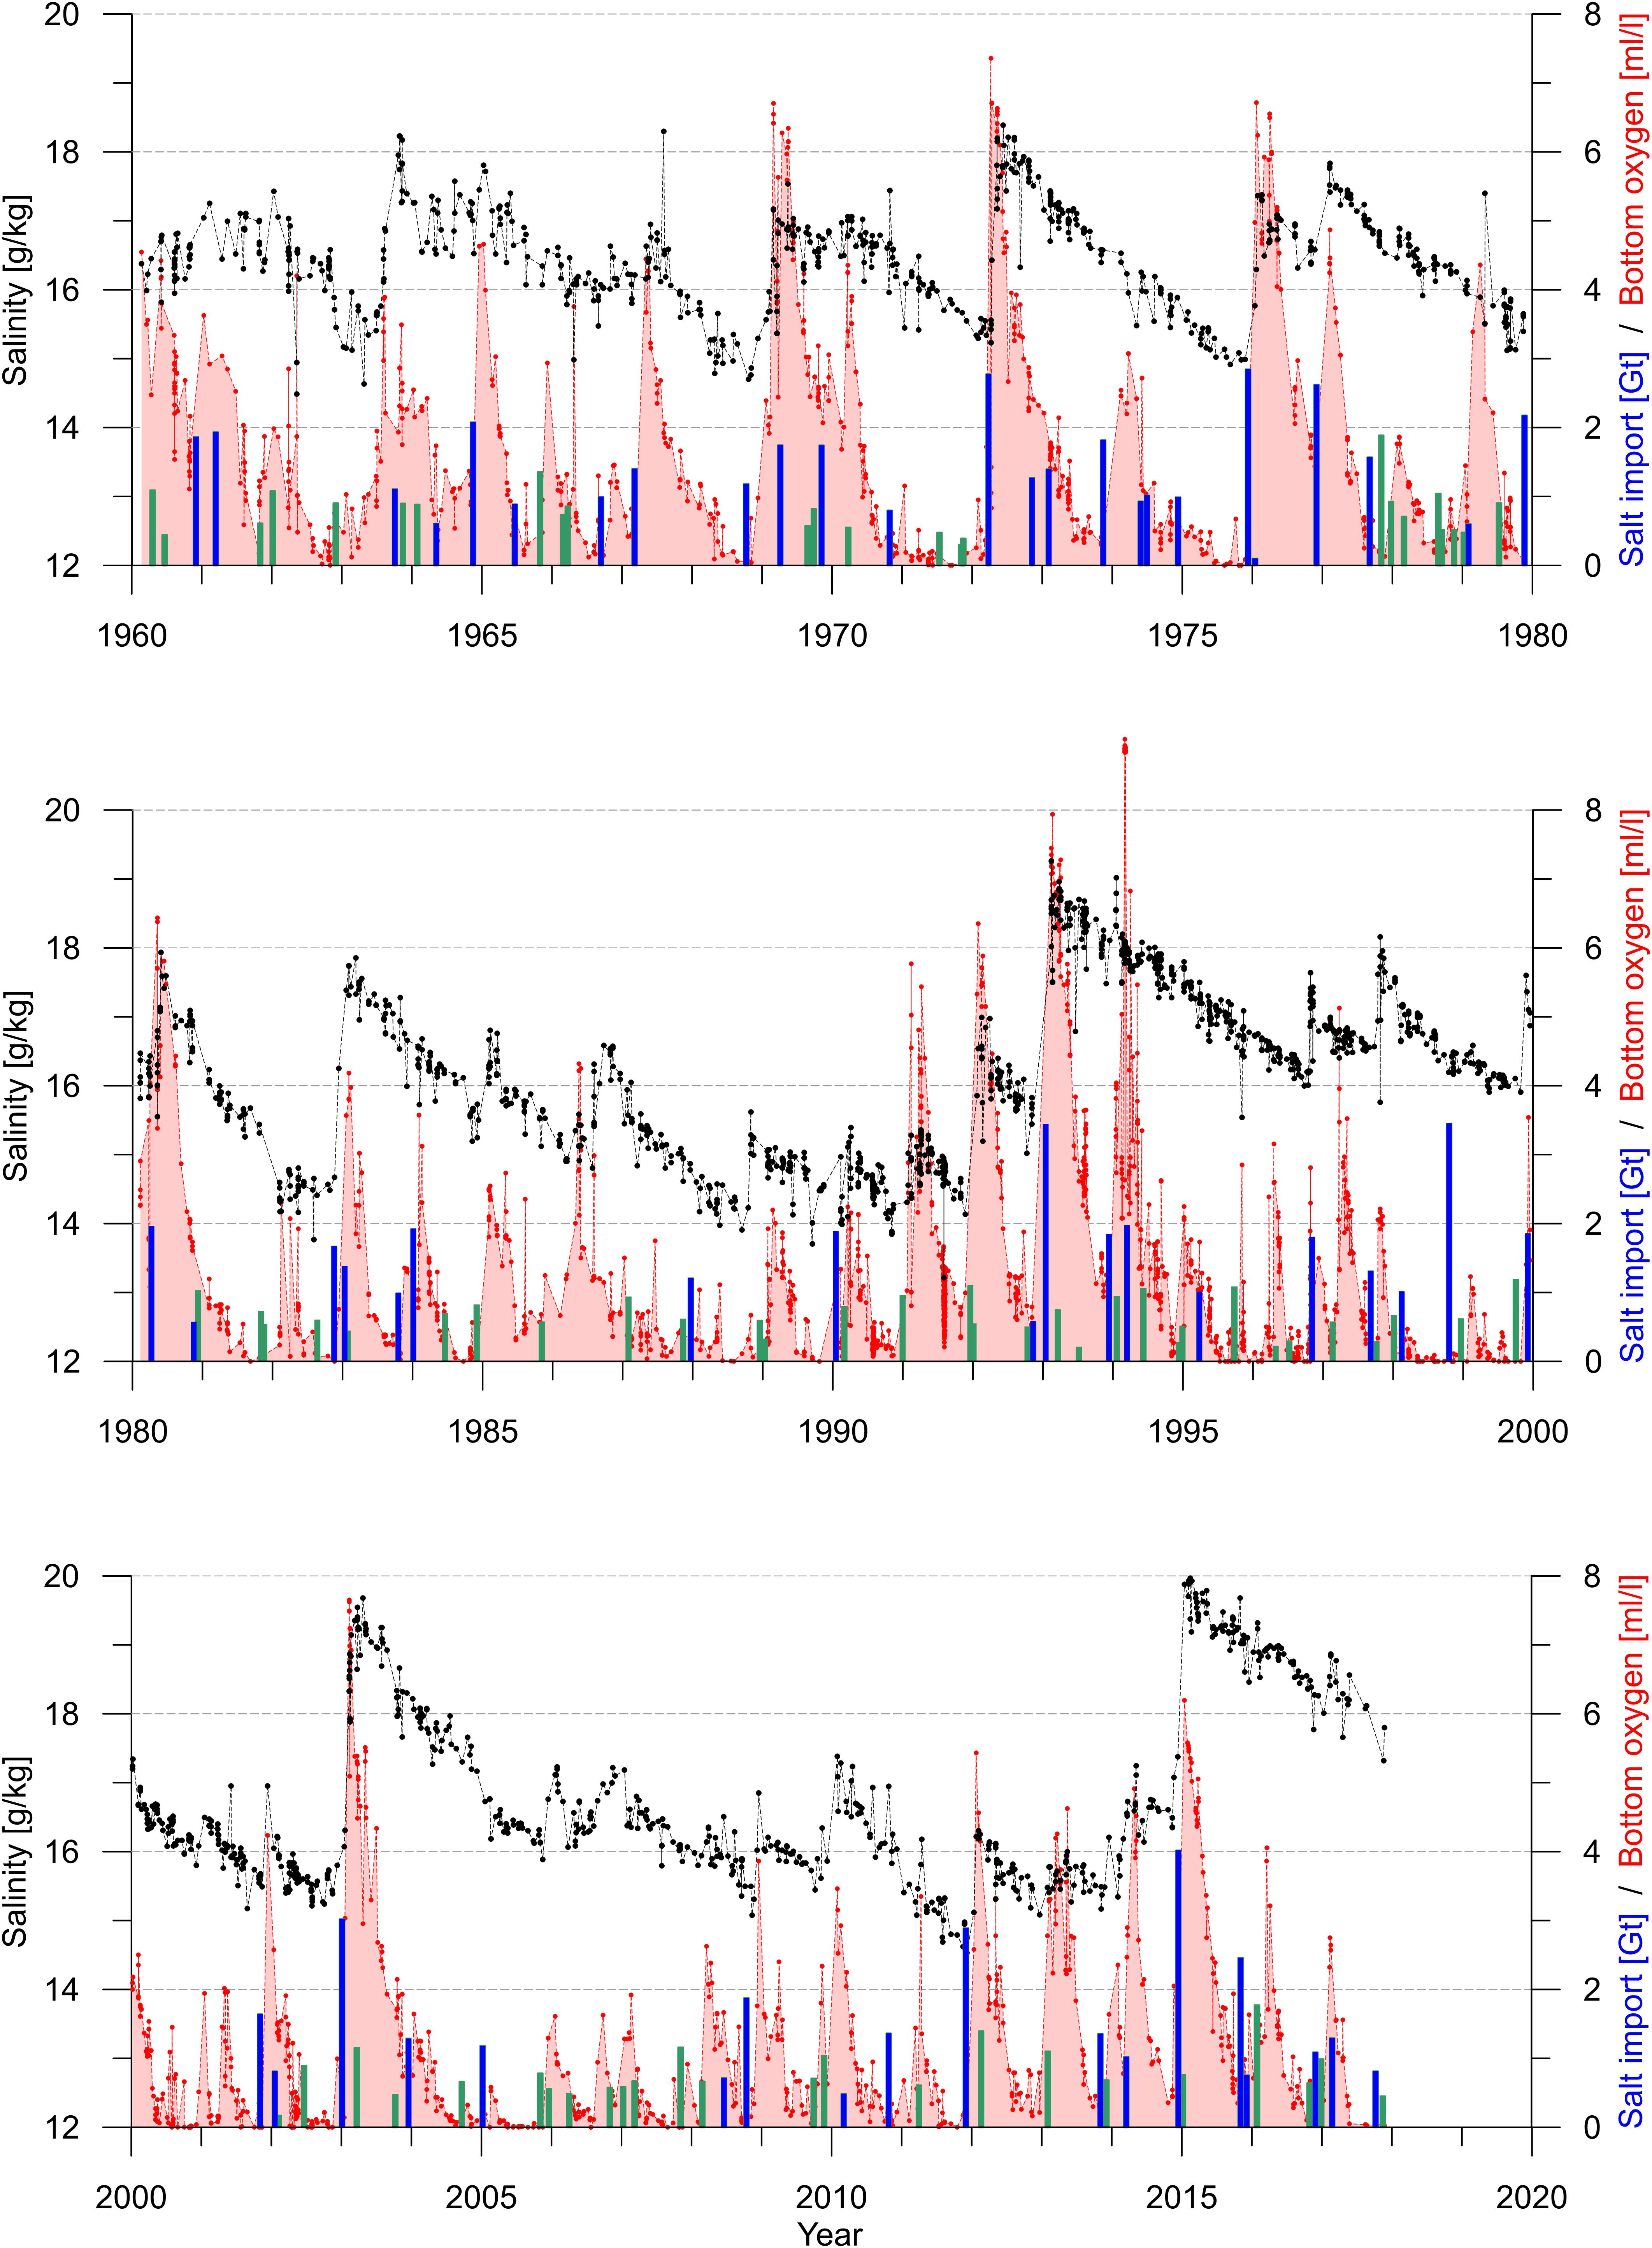
FIGURE 8. Time series of near bottom salinity (black) and oxygen concentration (red) in the Bornholm Deep (85–90 m), overlaid with barotropic inflow events of the subsets DS5 (blue bars) and DS1 (green bars).
A more sensitive parameter to trace the inflow events in the Bornholm Basin is the deep water oxygen concentration. Although the sampling frequency was lower than for salinity. Nearly each inflow event of the time series DS5 and DS1 can be detected in the deep water oxygen concentration, since the biogeochemical driven oxygen decay is much faster than the diapycnal entrainment of low saline water into the deep water body. Good examples are periods with high salinity after strong inflow events like 1972, 1993 or after 2014. Then the deep water salinity was still on a high level, whereas the oxygen concentration was low enough to trace the next inflow.
Discussion
Using independent and consistent time series of Baltic Sea sea level, river runoff and salinity the barotropic inflow activity of the recent 120 years was reconstructed and former gaps in the MBI series FM96 were filled. The revised inflow series contains any barotropic inflow at the Sound and the Belt Sea that lasts at least 1 day at the Drogden Sill (inflow set DD1). This is not consistent with the MBI definition of Fischer and Matthäus (1996). To compare the results of this study with the FM96 series all inflow events with at least 5 days saline inflow at the Darss Sill were selected. This group of barotropic inflows (DS5) is most similar to the classical MBI.
As expected the DS5 inflows occur mainly during the autumn and winter season from September to April with a maximum frequency between November and January, similar to the classical MBI (Matthäus and Schinke, 1994). Till 1983 both algorithms for identifying large barotropic inflows revealed nearly every MBI event, although the estimated strength differs particularly between the DS5 and the FM96 inflow series (Figure 9). This confirmed the applicability of the new algorithm, which uses the Landsort sea level. Since no changes in the observation methods of sea level occurs till 2006 the method should also reveal reliable data for the period after 1983. In contrast to the present knowledge from the FM96 inflow series, which assumes a strong decrease of Major Baltic Inflow frequency since the 1980s, this study shows that the frequency of Major Baltic Inflows depict no long term trend, during the last century. However, there exists a pronounced interannual variability with a time scale of 25–30 years.
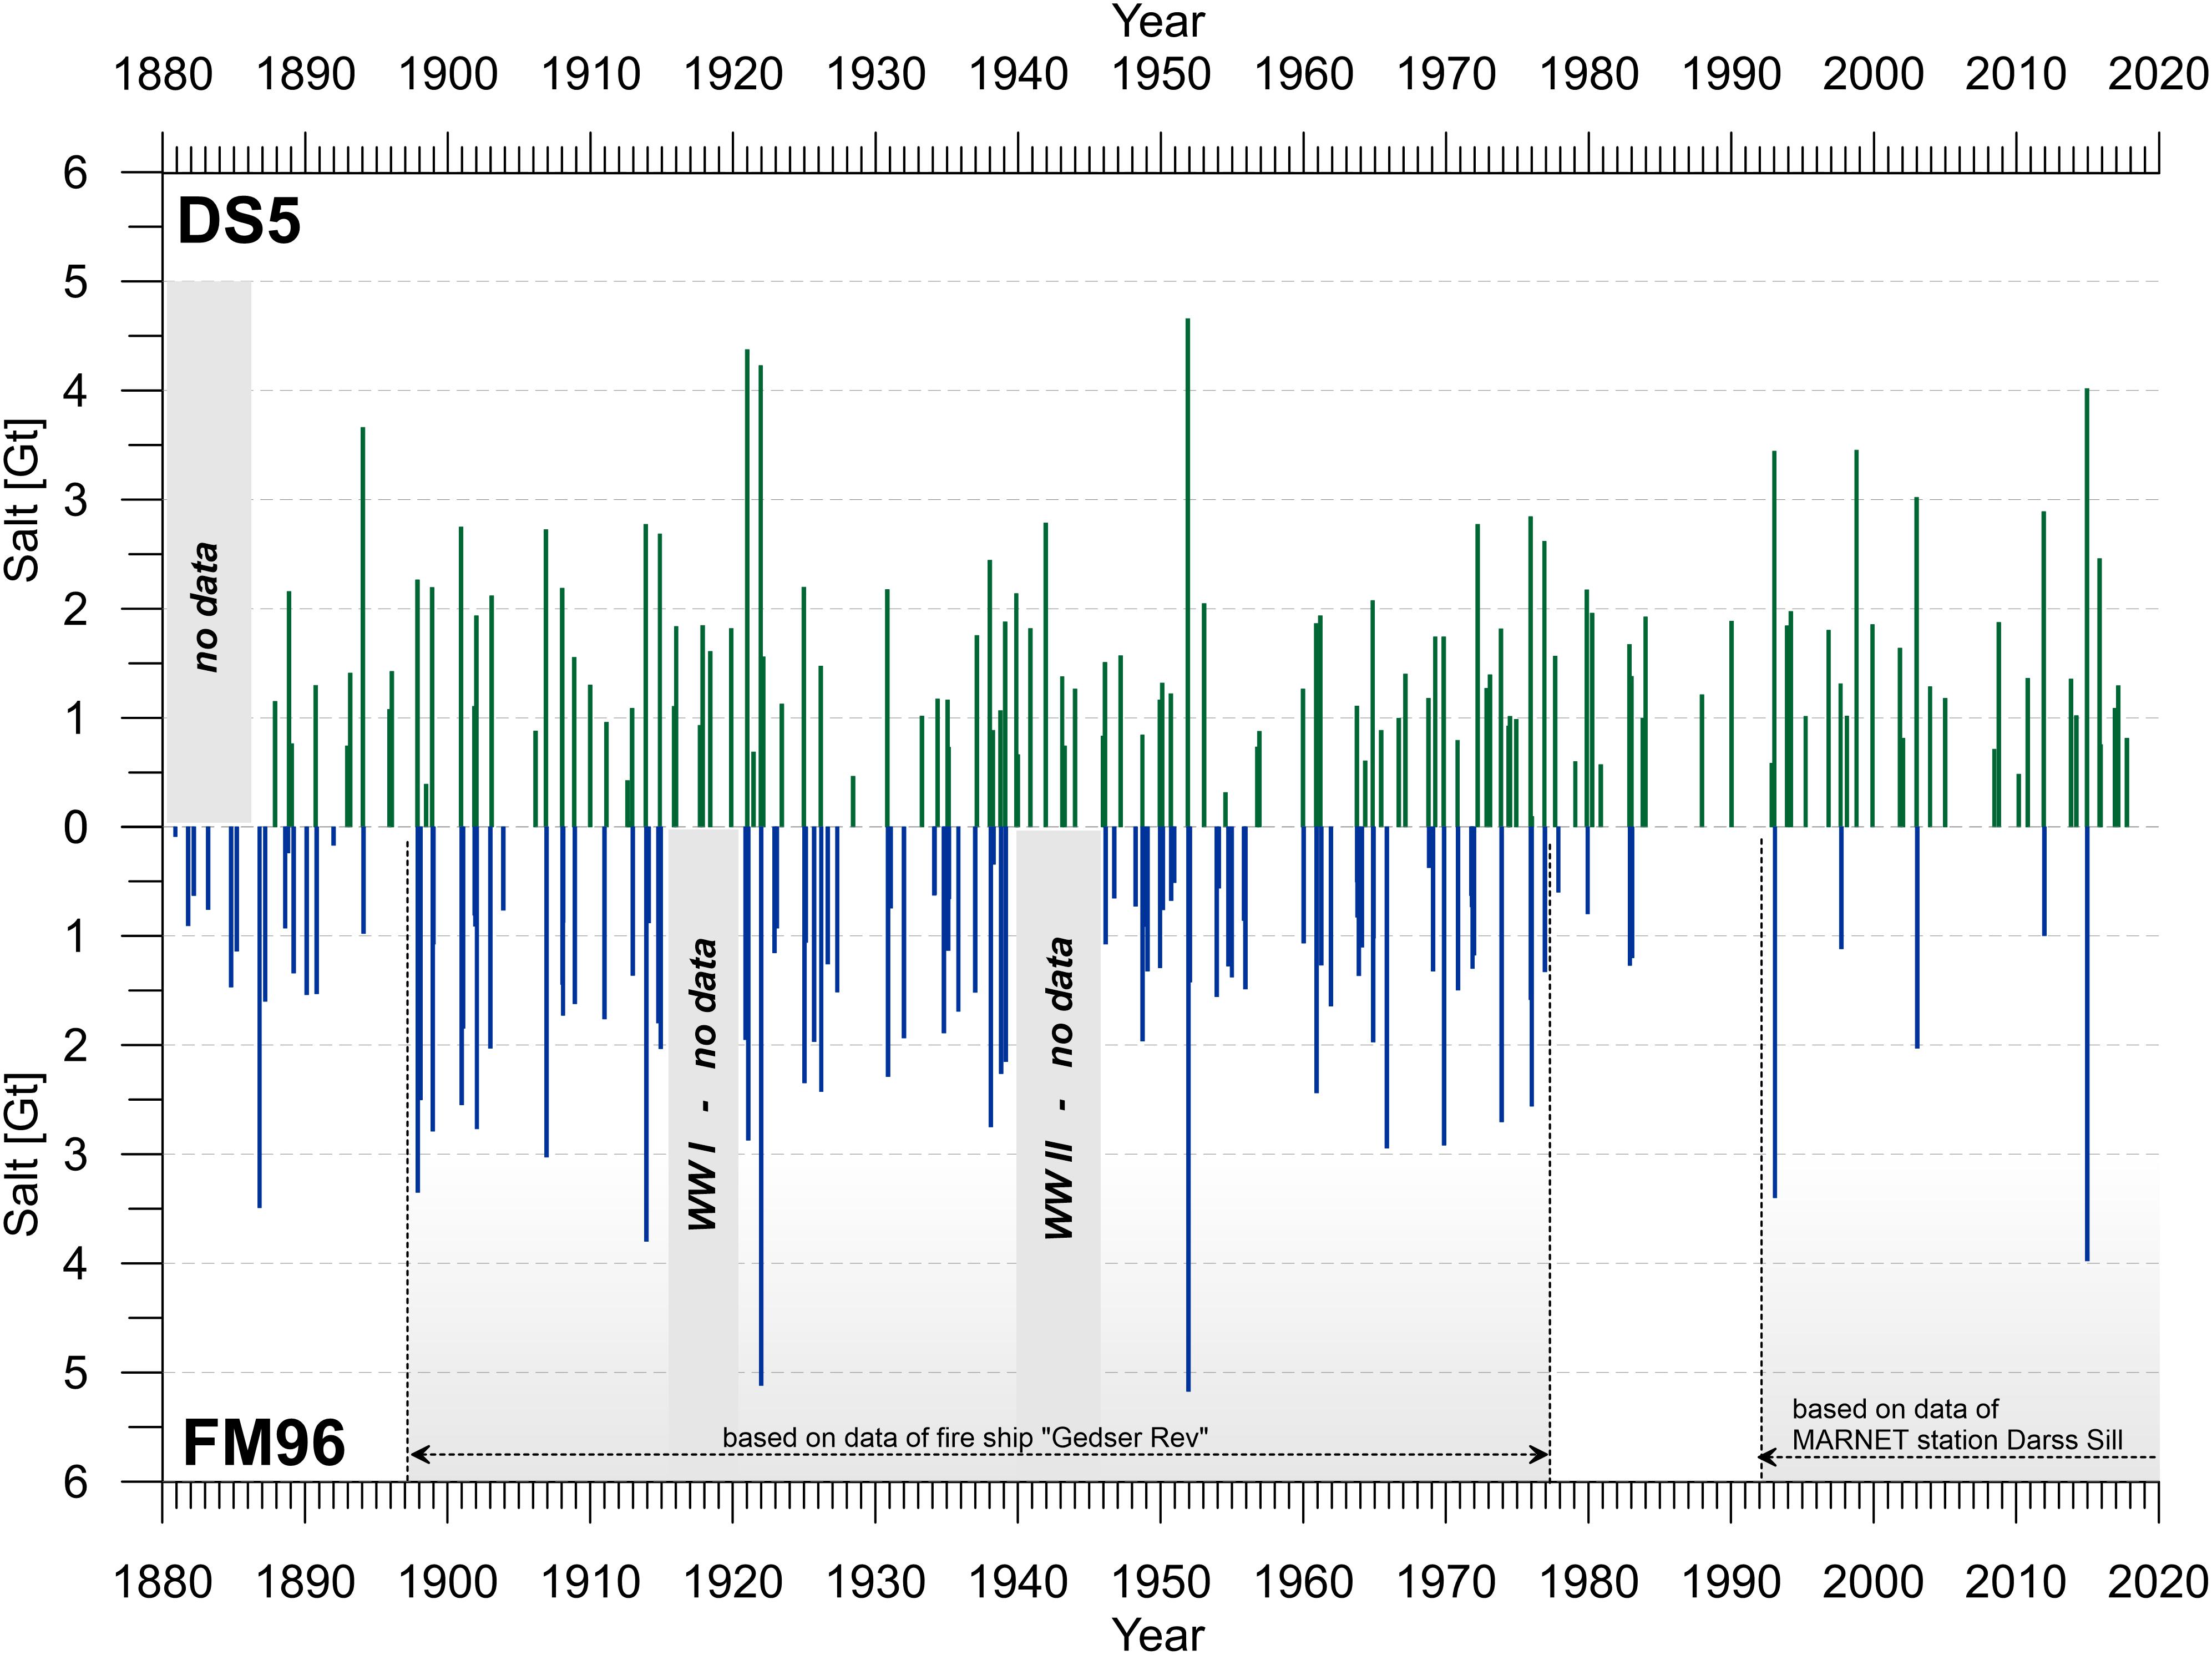
FIGURE 9. Comparison of MBI sequence DS5 (top) with FM96 (bottom). Gray areas indicate periods with no data. At the bottom the availability of time series observation at Gedser Rev and Darss Sill is depicted.
The detection algorithms of large barotropic inflow events used by Fischer and Matthäus (1996) and this study based on different approaches. The classical approach used vertical salinity profiles at the Darss Sill and the Sound assuming that barotropic inflow conditions are characterized by high salinity and weak vertical stratification. Short term flow reversals during inflows are not detected by this method. The MBI detection algorithm of FM96 has two major limitations. First the MBIs were not derived directly from water transport through the Danish Straits. And secondly, the application of fixed empirical thresholds of minimum salinity and vertical stratification depends crucial on the location of measurements at the sills. However, the FM96 algorithm reveals reliable results if continuous observations of salinity and stratification in the Danish Straits are available.
The transport estimation based on the sea level change Landsort supply more direct estimations of the water exchange with the North Sea, although short term fluctuations at time scales of hours to 1.5 days were filtered out. This may lead to higher uncertainties for short inflow events, but MBI scale barotropic inflow events, with duration of at least 5 days overflow at the Darss Sill, are less affected. The calculation of imported salt mass is simple at times when salinity measurements in the Danish straits are available. The introduction of artificial salinity fronts and mean inflow salinities at the Darss Sill and Drogden Sill enables the estimation of salt import also for periods without salinity observations, although the uncertainty of salt import increases. This allowed the reconstruction of a continuous and consistent series of barotropic inflow events. The variation of transport ratio between the Belt Sea and the Sound in the observed limits has only minor impact on the strength of inflow events.
Mohrholz et al. (2015) hypothesized, that the present MBI statistic is biased since the end of the lightship observations at Gedser Rev in 1976. Especially the lack of weak and medium size inflows after 1980 contradicts the usual frequency-intensity distribution of MBIs given by Fischer and Matthäus (1996) for the period 1897 – 1976 (compare Figure 6). The barotropic inflow events depict an exponential frequency distribution. The smallest events have the highest frequency. The larger the events the less frequent they occur. There is no significant change in the atmospheric forcing that may explain a shift of the frequency distribution to larger inflow events.
Concurrent with the decreasing inflow activity in the FM96 inflow series around 1980 also the DS5 inflow set depicts a pronounced drop in inflow event frequency, which is attributed to the interannual variability of the inflow frequency. Unfortunately, this minimum of frequency of large inflows occurred at the same time when the continuous salinity observations at Gedser Rev were stopped. For the next decade the MBI detection was carried out using observations of the size of saline deep water body in the Arkona Basin. The data were gathered by the regular monitoring cruises and occasional project related observations of the IOW. The observation frequency was about bimonthly. Thus, minor inflow events of short duration were filtered out by the coarse spatial resolution and low sampling frequency of the observations. The low frequency of MBI in the FM96 series between 1976 and 1991 can be explained by both, the temporally drop in MBI frequency due to interannual variability and the end of continuous salinity observations at Gedser Rev.
In 1991 a new observation platform was established at the Darss Sill, which since then is used for continuous monitoring of the water exchange through the Belt Sea. This station is part of the German MARNET network, and is located 47 km east of the historic position of lightship Gedser Rev. The cross section area of the Belt Sea increases between both positions from 0.46 km2 to 0.84 km2. The MARNET station Darss Sill is located at the rim of the Arkona Basin approximately 20 km east of the topographic Darss Sill. On the pathway of saline water from Gedser Rev to Darss Sill and further to the MARNET Station Darss Sill entrainment of ambient brackish water reduces the salinity of the inflowing water by 1–1.5, and even the stratification changes. Due to the increasing water depth east of the topographic Darss Sill the inflowing saline water body is subducted below the brackish surface water. At the MARNET station Darss Sill the surface layer consists in the most cases of Arkona Basin surface water even during inflow conditions. Only strong inflow events as in December 2014 cover also the surface layer at the MARNET station. The bias in the FM96 inflow series after 1991 is caused mainly by the shift of continuous salinity observations to the rim of the Arkona Basin without an adjustment of the MBI identification criteria. Both the bottom mean salinity of the inflowing water at the MARNET station and the stronger stratification resulted in a strong reduction of detected inflow events. This affected especially the identification of minor inflow events, which were no longer recognized as MBI. However, also some larger barotropic inflow events failed the MBI criteria. A good example is the inflow in November 1996 which transported about 80 km3 high saline water into the Baltic, but did not meet the MBI criteria at the Darss Sill (Matthäus et al., 1996). According to the imported salt mass of 1.5 to 1.7 Gt this inflow should be classified as a medium size MBI.
An additional indication that the salt transport into the Baltic has not changed is its stable mean salinity during the recent decades. Using well established long term averages of volume and mean salinity of the inflowing saline water of about 480 km3 with a salinity of 17, the total salt import per year can be estimated with 8.2 Gt. The barotropic inflow events contribute approximately half of this amount with 4Gt (Table 3), which was confirmed also by the results of Stigebrandt (1983). The larger DS5 events which compares to the classical MBI contribute only 1.6 Gt per year with large interannual fluctuations. This is only 20% of the annual salt import to the Baltic. However, they are crucial for the deep water renewal and ventilation. The smaller barotropic inflow events (DD1 – DS5) supply on average 2.44 Gt salt to the Baltic, with a much lower annual variability of ±0.8 Gt, and a nearly constant number of about 10 events per year. The salt import of the smaller events is on average 30% of the total salt import to the Baltic. The long term variability of salt import of barotropic inflow events is mainly caused by the variability of the DS5 events (compare Figure 3).
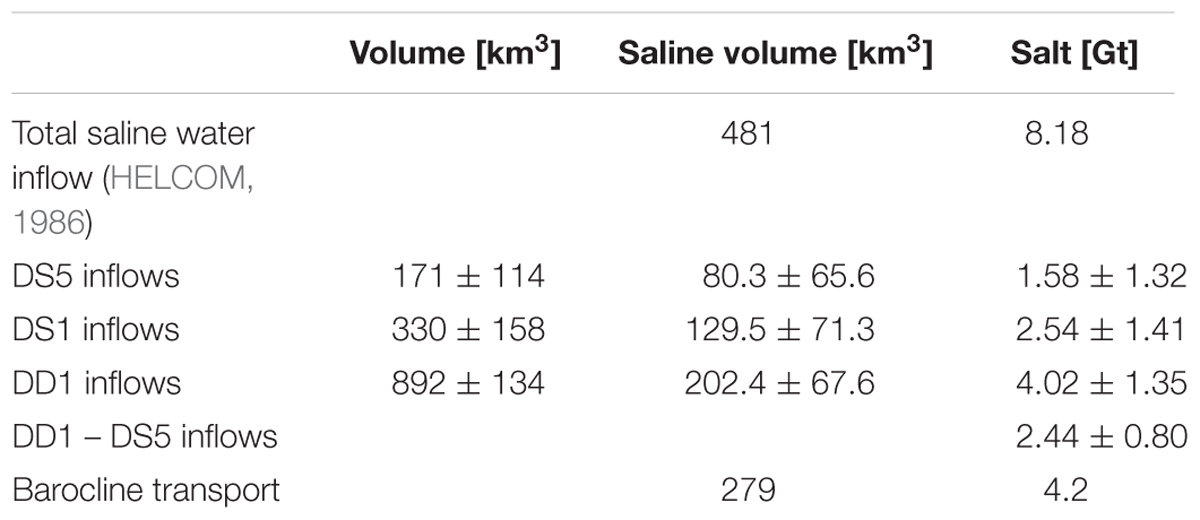
TABLE 3. Contribution of barotropic inflows to the total annual salt import of the Baltic.
The contribution of the Belt Sea and the Sound to the total barotropic salt import depends on the size of the inflow events. If all barotropic events are recognized the Sound account for 2.79 Gt salt import per year compared to 1.23 Gt salt passing the Darss sill, which is a ratio of 69 to 31%. Lintrup and Jakobsen (1999) estimated an annual salt import through the Sound of 2.3–4 Gt, based on current and salinity observations in the years 1994 to 1997. The flow through the Sound is mainly barotropic throughout the year. Thus, the estimated salt import of 2.79 Gt per year fits to their results. The transport ratio between the Sound and the Belt Sea for only the DS5 events was 45 to 55%, with annual averages of 0.71 Gt and 0.87 Gt salt import respectively. As expected the salt transport in the Belt Sea exceeds the Sound transport for the large barotropic events.
The classification of barotropic inflow events as MBI remains an open issue. The size class distribution of barotropic inflow events depicts a nearly exponential shape. There is no local minimum in the distribution that provides a proper reasoning for the separation between MBIs and minor barotropic events. The rule, that an MBI should last at least 5 consecutive days at the Darss sill, is also in some way artificial. As shown in Figure 5 there were DS1 events, usually not classified as an MBI, which transports up to 2Gt salt into the Baltic. Whereas a considerable number of DS5 events are confined to size classes of 0.5 and 1.0 Gt. Lehmann and Post (2015) introduced the term “Large Volume Changes” (LVC) which are barotropic inflow events with a total volume change for the Baltic of more than 100 km3 over a period of 40 days, regardless of the amount of salt import. This definition included the river runoff and has been revised by Lehmann et al. (2017). According to their revised definition an LVC requires a minimum net inflow of 60 km3 from the North Sea. These LVC events have a higher frequency than the FM96 MBIs. Mohrholz et al. (2015) calculated an effective buffer volume of about 110 km3 for the Belt Sea that must usually be replaced by saline water before the saline inflow at the Darss Sill starts. Thus, the current LVC approach seems not appropriate to replace the classical MBI definition, and it was in fact not intended by Lehmann et al. (2017). The most useful approach was already indicated by Fischer and Matthäus (1996) by using the total amount of salt import for their modified MBI classification. Although a classification of barotropic inflow events into MBI and smaller inflows might be outdated from the current point of view, one can apply the FM96 size classification without using the term MBI. Then the barotropic inflows are simply classified as weak, moderate (or medium), strong and very strong (or extreme) events using the limits of 1, 2, and 3 Gt salt import respectively. However, this is just a suggestion and has to be discussed in the scientific community. A classification like this has no relation to the ecological impact of a particular barotropic inflow. Certainly increases the probability that the saline waters of an inflow reach the deep layers of the central Baltic with its size, but also the saline stratification of the Baltic prior to the inflow has a crucial impact on the renewal and ventilation of deep water. An inclusion of ecological aspects into the MBI classification, as the oxygen supply to the deep layers of the central Baltic, appears possible and useful from the ecosystem perspective. However, it complicates the classification of inflow events to a large extent, since the required data are not available for the time before 1950. And even today the temporal and spatial resolution of the gathered data is not sufficient to trace the ecological impact of each particular inflow event.
Conclusion
The main results of this study are summarized as follows:
1. A continuous series of barotropic transport of saline water into the Baltic Sea was reconstructed for the period from 1887 till present, that allow a statistical analysis of the distribution of barotropic inflow events.
2. In contrast to the inflow series FM 96 the reviewed series of barotropic inflow events depict no long term trend in event frequency and the related annual salt transport during the recent 130 years.
3. The frequency of large barotropic inflows (DS5 events) has pronounced long term variability with a main period of about 25–30 years.
4. Smaller barotropic inflow events occur throughout the year with low interannual variability and supply on average 30% of the total salt transport into the Baltic.
5. The decreasing inflow frequency in the FM96 series after the 1980s can be attributed to a systematic bias caused by a lack of daily salinity observations between 1976 and 1991 and an eastward shift of observation position afterward, without an adjustment of the MBI identification criteria.
6. The observed temporal variability of barotropic inflows of saline water does not explain the increasing stagnation periods in the Baltic deep water and the spread of anoxic bottom conditions in the central Baltic. This highlights the impact of increased eutrophication as main driving factor as stated by Zillén et al. (2008); Conley et al. (2009), and several other studies.
Further research is needed to attribute the long term variability of inflow frequency to the regional climate variability and established climate indices, e.g., the NAO. Also the method for estimation of barotropic salt transport used in this study can be further improved with additional in situ data from the Danish straits, and independent transport calculations derived from local sea level differences between the Kattegat and the western Baltic. However, this will not alter the main conclusions given above.
Data Availability Statement
The daily time series of total transport through the Danish Straits, derived from sea level change Landsort/Landsort Norra, and the reconstructed sequence of saline inflow events are stored in the IOW ODIN data base (https://odin2.io-warnemuende.de). These time series are provided with Creative Commons (CC) data license of type CC BY 4.0 (https://creativecommons.org/licenses/by/4.0/).
Author Contributions
The author declares that the presented study is his own original research.
Funding
This work has been funded by institutional funds of the Leibniz Institute for Baltic Sea Research Warnemünde in frame of its research focus 3 “Changing ecosystems” and the Baltic Sea long term observation program of the institute.
Conflict of Interest Statement
The author declares that the research was conducted in the absence of any commercial or financial relationships that could be construed as a potential conflict of interest.
Acknowledgments
This study would have been impossible without the public availability of in situ observations provided by several institutions of the Baltic Sea neighboring countries. These data are based on the daily work of a countless number of people. Their work is greatly acknowledged. The sea level data of Landsort and Landsort Norra, the light ship observations of salinity in the Sound, and the runoff data from the HYPE model were made available by the OpenData server of the SMHI. The lightship data at Gedser Rev were published by the DMI. Additional hydrographic data from the Danish Straits, the central Bornholm basin and the eastern Gotland basin were provided by the ICES, the HELCOM, and the EMODNET data bases. The data from the MARNET station Darss Sill are gathered in frame of the German marine monitoring program, funded by the BSH and carried out by IOW.
References
BACC II Author Team (2015). Second Assessment of Climate Change for the Baltic Sea Basin. Berlin: Springer International Publishing.
Bergström, S., and Carlsson, B. (1994). River runoff to the Baltic Sea: 1950-1990. Ambio 23, 280–287.
Carstensen, J., Andersen, J. H., Gustafsson, B. G., and Conley, D. J. (2014). Deoxygenation of the Baltic Sea during the last century. Proc. Natl. Acad. Sci. U.S.A. 111, 5628–5633. doi: 10.1073/pnas.1323156111
Conley, D. J., Björck, S., Bonsdorff, E., Carstensen, J., Destouni, G., Gustafsson, B. G., et al. (2009). Hypoxia-related processes in the Baltic Sea. Environ. Sci. Technol. 43, 3412–3420. doi: 10.1021/es802762a
Cyberski, J., Wróblewski, A., and Stewart, J. (2000). Riverine water inflows and the Baltic Sea water volume 1901-1990. Hydrol. Earth Syst. Sci. Discuss. 4, 1–11. doi: 10.5194/hess-4-1-2000
Feistel, R., Nausch, G., and Hagen, E. (2006). Unusual Baltic inflow activity in 2002–2003 and varying deep-water properties. Oceanologia 48, 21–35.
Feistel, R., Seifert, T., Feistel, S., Nausch, G., Bogdanska, B., Hansen, L., et al. (2008). “Digital supplement,” in State and Evolution of the Baltic Sea, eds R. Feistel, G. Nausch, and N. Wasmund (Hoboken, NJ: Wiley), 625–667.
Feistel, S., Feistel, R., Nehring, D., Matthäus, W., Nausch, G., and Naumann, M. (2016). Hypoxic and anoxic regions in the Baltic Sea, 1969 - 2015. Meereswiss Ber Warnemünde 100:2016. doi: 10.12754/msr-2016-0100
Fischer, H., and Matthäus, W. (1996). The importance of the drogden Sill in the sound for major Baltic inflows. J. Mar. Syst. 9, 137–157. doi: 10.1016/S0924-7963(96)00046-2
Fischer, T., Banyte, D., Brandt, P., Dengler, M., Krahmann, G., Tanhua, T., et al. (2013). Diapycnal oxygen supply to the tropical North Atlantic oxygen minimum zone. Biogeosciences 10, 5079–5093. doi: 10.5194/bg-10-5079-2013
Franck, H. and Matthäus, W. (1992). Sea level conditions associated with major Baltic inflows. Beitr. Meereskunde 63, 65–90.
Franck, H., Matthäus, W., and Sammler, R. (1987). Major inflows of saline water into the Baltic Sea during the present century. Gerlands Beitr. Geophys. Leipzig 96, 517–531.
Hansson, D., Eriksson, C., Omstedt, A., and Chen, D. (2011). Reconstruction of river runoff to the Baltic Sea, AD 1500–1995. Intern. J. Climatol. 31, 696–703. doi: 10.1002/joc.2097
Hela, I. (1944). Über die schwankungen des wasserstandes in der ostsee mit besonderer berücksichtigung des wasseraustausches durch die dänischen gewässer. Ann. Acad. Sci. Fenn. 134, 1–108.
HELCOM (1986). Water Balance of the Baltic Sea. Baltic Sea Environment Proceedings. Helsinki: HELCOM.
Hordoir, R., Axell, L., Löptien, U., Dietze, H., and Kuznetsov, I. (2015). Influence of sea level rise on the dynamics of salt inflows in the Baltic Sea. J. Geophys. Res. Oceans 120, 6653–6668. doi: 10.1002/2014JC010642
International Council for the Exploration of the Sea [ICES] (2014). The International Council for the Exploration of the Sea, Copenhagen. Available at: http://www.ices.dk/marine-data
IOC, SCOR, IAPSO (2010). The International Thermodynamic Equation of Seawater – 2010: Calculation and Use of Thermodynamic Properties. Paris: UNESCO.
Jacobsen, T. S. (1980). The Belt Project. Sea Water Exchange of the Baltic–Measurements and Methods. Denmark: The National Agency for Environmental Protection.
Jakobsen, F., Hansen, I. S., Ottesen Hansen, N.-E., and Ostrup-Rasmussen, F. (2010). Flow resistance in the Great Belt, the biggest strait between the North Sea and The Baltic Sea. Estuar. Coast. Shelf Sci. 87, 325–332. doi: 10.1016/j.ecss.2010.01.014
Jakobsen, F., Lintrup, M., and Møller, J. S. (1997). Observation of the specific resistance in the Øresound. Hydrol. Res. 28, 217–232. doi: 10.2166/nh.1997.0013
Jenkinson, A. F., and Collison, F. P. (1977). An Initial Climatology of Gales Over the North Sea, Synoptic Climatology Branch Memorandum, Vol. 62. Bracknell: Meteorological Office.
Jönsson, B., Döös, K., Nycander, J., and Lundberg, P. (2008). Standing waves in the gulf of finland and their relationship to the basin-wide Baltic seiches. J. Geophys. Res. 113:C03004. doi: 10.1029/2006JC003862
Kabel, K., Moros, M., Porsche, C. H., Neumann, T., Adolphi, F., Andersen, T. J., et al. (2012). Impact of climate change on the Baltic Sea ecosystem over the past 1,000 years. Nat. Clim. Change 2, 871–874. doi: 10.1038/nclimate1595
Kronsell, J., and Andersson, P. (2013). Total and Regional Runoff to the Baltic Sea. HELCOM Baltic Sea Environment Fact Sheets. Available at: http://www.helcom.fi/baltic-sea-trends/environment-fact-sheets/
Lass, H. U. (1988). A theoretical study of the barotropic water exchange between the North Sea and the Baltic and the sea level variations of the Baltic. Beitr. Meereskunde 58, 19–33.
Lass, H. U., Schwabe, R., Matthäus, W., and Francke, E. (1987). On the dynamics of water exchange between Baltic and North Sea. Beitr. Meereskunde 56, 27–49.
Lehmann, A., Höflich, K., Post, P., and Myrberg, K. (2017). Pathways of deep cyclones associated with large volume changes (LVCs) and major Baltic inflows (MBIs). J. Mar. Syst. 167, 11–18. doi: 10.1016/j.jmarsys.2016.10.014
Lehmann, A., and Post, P. (2015). Variability of atmospheric circulation patterns associated with large volume changes of the Baltic Sea. Adv. Sci. Res. 12, 219–225. doi: 10.5194/asr-12-219-2015
Lintrup, M. J., and Jakobsen, F. (1999). The importance of oresund and the drogden sill for Baltic inflow. J. Mar. Syst. 18, 345–354. doi: 10.1016/S0924-7963(98)00018-9
Matthäus, W., and Franck, H. (1992). Characteristics of major Baltic inflows - a statistical analysis. Cont. Shelf Res. 12, 1375–1400. doi: 10.1016/0278-4343(92)90060-W
Matthäus, W., Nehring, D., Feistel, R., Nausch, G., Mohrholz, and Lass, H. U. (2006). “The inflow of high saline water into the Baltic Sea,” in State and Evolution of the Baltic Sea, 1952–2005, eds R. Feistel, G. Nausch, and N. Wasmund (Hoboken, NJ: Wiley), 265–309.
Matthäus, W., Nehring, D., Lass, H. U., Nausch, G., Nagel, N., and Siegel, H. (1996). The Baltic Sea in 1996 — continuation of stagnation and decreasing phosphate concentrations. Deutsche Hydrogr. Z. 48, 161–174.
Matthäus, W. and Schinke, H. (1994). Mean atmospheric circulation patterns associated with major Baltic inflows. Deutsche Hydrogr. Z. 46, 321–339. doi: 10.1007/BF02226309
Mattsson, J. (1996). Some comments on the barotropic flow through the Danish straits and the division of the flow between the Belt Sea and the Öresund. Tellus 48A, 456–464. doi: 10.3402/tellusa.v48i3.12071
Meier, H. E. M., Andersson, H. C., Eilola, K., Gustafsson, B. G., Kuznetsov, I., Müller-Karulis, B., et al. (2011). Hypoxia in future climates: a model ensemble study for the Baltic Sea. Geophys. Res. Lett. 38:L24608. doi: 10.1029/2011GL049929
Meier, H. E. M., Feistel, R., Piechura, J., Arneborg, L., Burchard, H., Fiekas, V., et al. (2006). Ventilation of the Baltic Sea deep water: a brief review of present knowledge from observations and models. Oceanologia 48, 133–164.
Mohrholz, V., Naumann, M., Nausch, G., Krüger, S., and Gräwe, U. (2015). Fresh oxygen for the Baltic Sea—An exceptional saline inflow after a decade of stagnation. J. Mar. Syst. 148, 152–166. doi: 10.1016/j.jmarsys.2015.03.005
Naumann, M., Nausch, G., and Mohrholz, V. (2016). “A succession of four Major Baltic Inflows in the period 2014–2016 – an overview of propagation and environmental change”, in Proceedings of the 1st International Baltic Earth Secretariat Publication on Multiple drivers for Earth system changes in the Baltic Sea region Nida, Curonian Spit, Lithuania. 9, 13–17.
Neumann, T., Radtke, H., and Seifert, T. (2017). On the importance of Major Baltic Inflows for oxygenation of the central Baltic Sea. J. Geophys. Res. Oceans 122, 1090–1101. doi: 10.1002/2016JC012525
Omstedt, A. (1987). Water cooling in the entrance of the Baltic Sea. Tellus 39A, 254–265. doi: 10.3402/tellusa.v39i3.11758
Rutgersson, A., Jaagus, J., Schenk, F., and Stendel, M. (2014). Observed changes and variability of atmospheric parameters in the Baltic Sea region during the last 200 years. Clim. Res. 61, 177–190. doi: 10.3354/cr01244
Schimanke, S., Dieterich, C., and Meier, H. E. M. (2014). An algorithm based on sea-level pressure fluctuations to identify major Baltic inflow events. Tellus 66A:23452. doi: 10.3402/tellusa.v66.23452
Seifert, T., Tauber, F., and Kayser, B. (2001). A High Resolution Spherical Grid Topography of the Baltic Sea, 2nd Edn, Stockholm: Baltic Sea Science Congress, 25–29.
SMHI (2018a). Hydrological Predictions for the Environment. HYPE model setup 3-1-1. Norrköping: SMHI.
SMHI (2018b). Tide-Gauge Data of the Stations Landsort and Landsort Norra in Hourly Means, Reference Level RH2000. Available at: http://opendata-download-ocobs.smhi.se
Stigebrandt, A. (1983). A Model for the exchange of water and salt between the Baltic and the Skagerrak. J. Phys. Oceanogr. 13, 411–427. doi: 10.1175/1520-0485(1983)013<0411:AMFTEO>2.0.CO;2
Stramma, L., Gregory, C., Johnson, G. C., Sprintall, J., and Mohrholz, V. (2008). Expanding oxygen-minimum zones in the tropical oceans. Science 320, 655–658. doi: 10.1126/science.1153847
Wübber, C., and Krauss, W. (1979). The two-dimensional seiches of the Baltic Sea. Oceanol. Acta 2, 435–446.
Keywords: Baltic Sea, water exchange, Major Baltic inflow, estuarine circulation, climate variability, oxygen minimum zone
Citation: Mohrholz V (2018) Major Baltic Inflow Statistics – Revised. Front. Mar. Sci. 5:384. doi: 10.3389/fmars.2018.00384
Received: 22 April 2018; Accepted: 28 September 2018;
Published: 22 October 2018.
Edited by:
Laura Tuomi, Finnish Meteorological Institute, FinlandReviewed by:
Jüri Elken, Tallinn University of Technology, EstoniaAndreas Lehmann, Helmholtz-Gemeinschaft Deutscher Forschungszentren (HZ), Germany
Copyright © 2018 Mohrholz. This is an open-access article distributed under the terms of the Creative Commons Attribution License (CC BY). The use, distribution or reproduction in other forums is permitted, provided the original author(s) and the copyright owner(s) are credited and that the original publication in this journal is cited, in accordance with accepted academic practice. No use, distribution or reproduction is permitted which does not comply with these terms.
*Correspondence: Volker Mohrholz, volker.mohrholz@io-warnemuende.de