Energy-Rich Mesopelagic Fishes Revealed as a Critical Prey Resource for a Deep-Diving Predator Using Quantitative Fatty Acid Signature Analysis
 Chandra Goetsch1*
  Melinda G. Conners2,3
  Suzanne M. Budge4
  Yoko Mitani5
  William A. Walker6
  Jeffrey F. Bromaghin7
  Samantha E. Simmons8
  Colleen Reichmuth9
  Daniel P. Costa1
- 1Department of Ecology and Evolutionary Biology, University of California, Santa Cruz, Santa Cruz, CA, United States
- 2Department of Biological Sciences, Old Dominion University, Norfolk, VA, United States
- 3Department of Ocean Sciences, University of California, Santa Cruz, Santa Cruz, CA, United States
- 4Department of Process Engineering and Applied Science, Dalhousie University, Halifax, NS, Canada
- 5Field Science Center for Northern Biosphere, Hokkaido University, Hakodate, Japan
- 6Marine Mammal Laboratory, Alaska Fisheries Science Center, National Marine Fisheries Service, National Oceanic Atmospheric Administration, Seattle, WA, United States
- 7U.S. Geological Survey, Alaska Science Center, Marine Ecosystems, Anchorage, AK, United States
- 8Marine Mammal Commission, Bethesda, MD, United States
- 9Institute of Marine Sciences, University of California, Santa Cruz, Santa Cruz, CA, United States
Understanding the diet of deep-diving predators can provide essential insight to the trophic structure of the mesopelagic ecosystem. Comprehensive population-level diet estimates are exceptionally difficult to obtain for elusive marine predators due to the logistical challenges involved in observing their feeding behavior and collecting samples for traditional stomach content or fecal analyses. We used quantitative fatty acid signature analysis (QFASA) to estimate the diet composition of a wide-ranging mesopelagic predator, the northern elephant seal (Mirounga angustirostris), across five years. To implement QFASA, we first compiled a library of prey fatty acid (FA) profiles from the mesopelagic eastern North Pacific. Given the scarcity of a priori diet data for northern elephant seals, our prey library was necessarily large to encompass the range of potential prey in their foraging habitat. However, statistical constraints limit the number of prey species that can be included in the prey library to the number of dietary FAs in the analysis. Exceeding that limit could produce non-unique diet estimates (i.e., multiple diet estimates fit the data equally well). Consequently, we developed a novel ad-hoc method to identify which prey were unlikely to contribute to diet and could, therefore, be excluded from the final QFASA model. The model results suggest that seals predominantly consumed small mesopelagic fishes, including myctophids (lanternfishes) and bathylagids (deep sea smelts), while non-migrating mesopelagic squids comprised a third of their diet, substantially less than suggested by previous studies. Our results revealed that mesopelagic fishes, particularly energy-rich myctophids, were a critical prey resource, refuting the long-held view that elephant seals are squid specialists.
Introduction
The deep sea ecosystem is the largest on the planet with an estimated biomass between 7 and 10 billion metric tons (Kaartvedt et al., 2012; Irigoien et al., 2014). The main contributor to this biomass is found in the deep scattering layers of the mesopelagic (200–1,000 m) and the bathypelagic (1,000–4,000 m) depth zones (Sutton, 2013; Davison et al., 2015). The deep scattering layers are composed of dense aggregations of fishes, squids, and other micronekton (organisms 2–20 cm) that provide an abundant prey resource to those deep-diving predators able to access them (MacLeod et al., 2003; Harvey et al., 2013; Howey et al., 2016). Despite the ecological significance of the deep ocean, it has been understudied, with scant information for many species, communities, and life histories, as well as limited understanding of the complex trophic interactions occurring therein (Webb et al., 2010; St John et al., 2016). In many cases, the only information available for deep-sea species are reports of their existence (e.g., Stemonosudis rothschildi, a deep sea barracudina) with little to no description of their biology, let alone their position or importance in the food web (Drazen and Sutton, 2017; Priede, 2017).
Understanding the diet of mesopelagic predators like the northern elephant seal (Mirounga angustirostris) can provide valuable insights into the deep ocean food web (Benoit-Bird and Lawson, 2016; Benoit-Bird et al., 2016). Yet, obtaining dietary information on these elusive predators is notoriously difficult, limiting our knowledge to that gained from stomach contents (from dead seals or stomach lavage) and fecal studies (from enemas or scat) (Antonelis et al., 1987; Staniland et al., 2003). Further, samples obtained from elephant seals on shore are biased toward hard parts that resist digestion and toward their last meal, as these animals may have been fasting for days or weeks since leaving their primary foraging areas. Improved technology in the form of animal-borne biologging cameras have provided tantalizing glimpses of feeding behavior and diet of marine predators, but are limited to a few individuals over short timescales (Davis et al., 1999; Naito et al., 2013; Krause et al., 2015; Volpov et al., 2015). Diet studies on other mesopelagic predators, such as sperm whales (Physeter macrocephalus) and beaked whales (F. Ziphiidae), have been limited to a few stranded individuals or those taken either in commercial whaling or as fishery by-catch (Walker et al., 2002; Ohizumi et al., 2003; Harvey et al., 2013).
Northern elephant seals utilize the entire eastern North Pacific Ocean, foraging for 9–10 months of the year and diving continuously into the mesopelagic zone (LeBoeuf et al., 2000; Robinson et al., 2012), where they feed almost exclusively below 400 m (Naito et al., 2013). Stomach content analyses have suggested that adult elephant seal diet is dominated by pelagic squids (Huey, 1930; Condit and Le Boeuf, 1984; Antonelis et al., 1987, 1994). In contrast, juvenile elephant seals appear to have a more diverse diet, mostly feeding over the continental shelf on a range of intertidal and neritic organisms (Sinclair, 1994). Recent studies using jaw motion analysis and videography suggest that small mesopelagic nekton, such as lanternfishes (F. Myctophidae), could be an important component of adult seal diet (Naito et al., 2013, 2017), but such studies are either indirect (i.e., jaw motion event frequency as a proxy for prey size) or subject to the same biases as stomach content analyses. Though mesopelagic fishes have not been confirmed in the diet of northern elephant seals, multiple lines of evidence indicate that their Southern Ocean congeners, southern elephant seals (Mirounga leonina), feed predominately on deep ocean fishes (Bradshaw et al., 2003; Cherel et al., 2008; Banks et al., 2014). Since northern and southern elephant seals display similar morphology, life histories, foraging dive behavior, and migration strategies, it is reasonable to hypothesize that northern elephant seals may also consume more fishes than indicated by stomach contents studies.
Biomolecular techniques, such as fatty acid (FA) analysis, stable isotope analysis, and DNA barcoding, have become standard in determining the diet of cryptic marine predators (Boecklen et al., 2011; Bowen and Iverson, 2012; Ramos and González-Solís, 2012). These techniques complement traditional methods of diet determination (i.e., stomach content and fecal analyses) by overcoming the well-known biases of those methods toward prey with indigestible hard parts and against small, soft-bodied prey (Harvey and Antonelis, 1994; Bowen, 2011). However, biochemical methods also have constraints. Stable isotope analysis is excellent for determining the trophic position of both prey and predators, but obtaining species-level estimates of trophic level and diet composition has been problematic due to difficulties with prey signature resolution, baseline isotopic values, and trophic discrimination factors (Hobson et al., 1996; Newsome et al., 2010). Conversely, DNA barcoding provides diet estimates that are highly resolved to species level since it is not dependent on undigested remains; yet, it is limited by what is in the digestive tract at the time of sample collection (Tollit et al., 2009; Bowen and Iverson, 2012). FA analysis is able to provide diet information that is resolved to species level and is integrated over longer timescales of weeks to months (Budge et al., 2004, 2006; Iverson et al., 2004; Bowen and Iverson, 2012).
Quantitative fatty acid signature analysis (QFASA) has become a widespread method of diet determination for diverse marine predators, such as sea birds, seals, sea lions, fish, and polar bears (Thiemann et al., 2008; Tucker et al., 2009; Meynier et al., 2010; Budge et al., 2012; Conners et al., 2018). The basic concept of FA analysis is that, molecularly speaking, “you are what you eat,” albeit with some predictable metabolic processing. Reliable species-specific calibration coefficients that quantify the metabolic changes in FAs from ingestion to tissue deposition are crucial for accurate QFASA diet estimates (Rosen and Tollit, 2012; Bromaghin et al., 2016a). Using calibration coefficients and a subset of dietary FAs common to both predator and prey, the QFASA model finds which combination of prey minimizes the distance between prey and predator FA signatures (Iverson et al., 2004; Budge et al., 2006). Typically, studies utilizing QFASA have used small to moderate prey libraries (<30 prey species); however, QFASA can effectively differentiate among larger numbers (~30–50) of potential prey species (Piché et al., 2010; Conners et al., 2018). This capability is important for determining the diets of mesopelagic predators, because the deep scattering layer is a highly interconnected food web where many prey species exploit similar resources.
Our study evaluated the efficacy of QFASA to quantify the diet of free-ranging northern elephant seals. Limited knowledge of elephant seal diet necessitated the use of a large library of potential prey species. However, having more prey species in the library than FAs in the analysis produces non-unique diet estimates, so we developed a novel method to reduce our prey library. We estimated the diets of adult female northern elephant seals resolved to prey species and functional groups, using the QFASA model and the reduced prey library. Furthermore, we used a combination of diagnostic analyses to evaluate QFASA model performance and quantify model error. Ultimately, we used our diet results to examine the hypothesis that mesopelagic fishes contribute significantly to northern elephant seal diet at the population-level, based on inferences from their diving behavior during their foraging migrations and recent video data.
Materials and Methods
Ethics Statement
The protocol for animal use was approved by the Institutional Animal Care and Use Committee (IACUC) of the University of California Santa Cruz and the Japan Ministry of Agriculture, Forestry and Fisheries. Elephant seal sampling was authorized by National Marine Fisheries Service permits 14636 and 14535 and conducted in accordance with the guidelines set forth by the ethics committee of the Society of Marine Mammalogy and the Canadian Council for Animal Care. Prey sampling on the vessel T/S Oshoro-maru was conducted under the United States Department of State, Bureau of Oceans and International Environmental and Scientific Affairs permit U2012-013.
Field Methods
Elephant Seal Sampling
Adult female northern elephant seals (n = 155) were instrumented with Argos or GPS satellite transmitters (Wildlife Computers, Redmond, WA; SPOT4, SPOT5, MK10-AF) at Año Nuevo State Reserve, San Mateo, CA, USA (37°59′N, 122°169′W) during January–March for the short (post-breeding) and May–June for the long (post-molt) foraging trips in 2005–2006 and 2009–2012. Seals were sedated for instrument attachment and recovery using established protocols (see Robinson et al., 2012). During handling, we collected a full depth blubber biopsy (5–7 days after the seal's return) from the seal's lateral side, ~13 cm anterior of the hip, using a 6 mm biopsy punch. Female seals typically lose up to 40% of their body mass, mainly fat stores, when they fast on land during breeding and molting (Crocker et al., 2014). When they return to sea for their foraging migrations, they gain mass consistently and rapidly to replenish fat stores in the blubber, so blubber sampled upon their return should be reflective of diet. The blubber samples were divided into inner and outer halves with each half placed into a glass vial with a Teflon-lined cap with 3 ml of 2:1 chloroform:methanol (v/v) and 0.01% BHT. Previous studies have shown that elephant seal blubber is stratified with the outer layer being more structural in nature for streamlining and thermoregulation, whereas the inner layer is more metabolically active and, thus, a better indicator of diet (Best et al., 2003; Strandberg et al., 2008; Crocker et al., 2014). Vials were kept frozen at −20°C until analysis.
Collecting the Prey Library
We collected mesopelagic fishes and squids from onboard the research vessel T/S Oshoro-maru (Hokkaido University) along a north-south transect through the Subarctic Pacific and North Central Pacific (also called the Transition Zone) mesopelagic biogeographic regions (Sutton et al., 2017). This transect was determined at sea by the real-time Argos locations of 16 concurrently tracked female elephant seals (Figure 1), and sampling was conducted at depths where elephant seals routinely forage (Robinson et al., 2012). Potential prey samples were collected during four midwater trawls (10 mm mesh at the cod end, 314 m2 net mouth, and tow speed of 3.5–4 knots; Saijo et al., 2017), two during the day (maximum depths of 730 and 720 m), and two at night (both at 650 m). Automatic squid jigs (surface to 650 m, Towa-denki Seisakusho Co., Ltd.) were also used to collect samples of active, vertically migrating squid. Additionally, one Stigmatoteuthis dofleini, a mesopelagic squid, was sampled opportunistically (May 22, 2014) from a commercial fishery vessel off the coast of Oregon-Washington. All samples were identified to the lowest possible taxonomic level (Food Habits Lab, National Marine Mammal Laboratory, Seattle, WA) and measurements of mass and length (standard length for fishes, dorsal mantle length for squids) were recorded (Tables 1, 2). In total, we collected 865 samples, representing 62 mesopelagic genera (50 fish and 12 squid species). Prey samples were kept whole at −20°C until analysis.
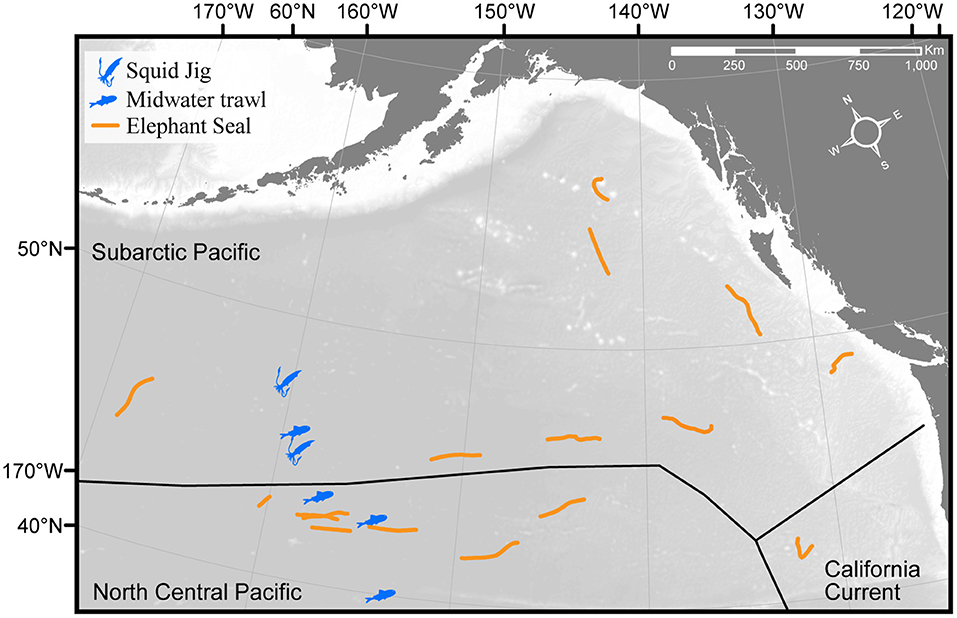
Figure 1. Locations of the midwater trawls (4) and squid jigs (2) where samples were collected to establish the prey library during July 7–9, 2012. Sampling locations span the boundary between the Subarctic Pacific and North Central Pacific mesopelagic biogeographic provinces and overlap with the concurrent foraging paths (orange lines) of 16 satellite-tagged, free-ranging female northern elephant seals (tracks shown are a subset of the 155 total seals analyzed for diet composition).
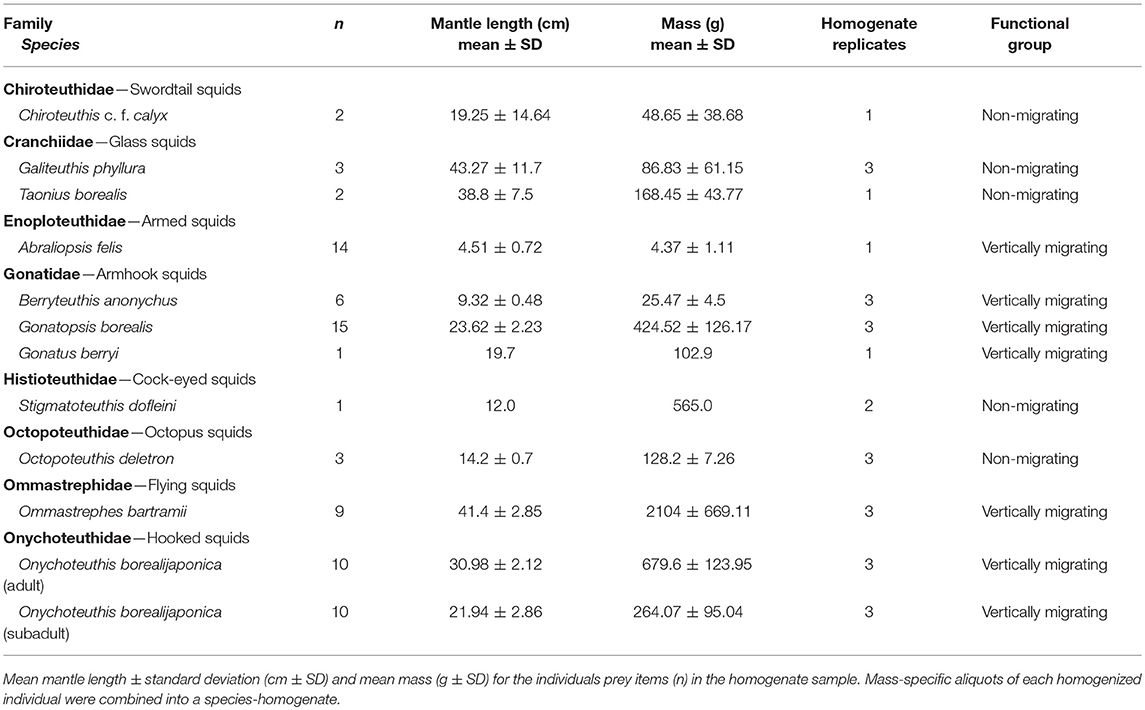
Table 1. Squid species (n = 11; one species has two age classes) in complete prey library.
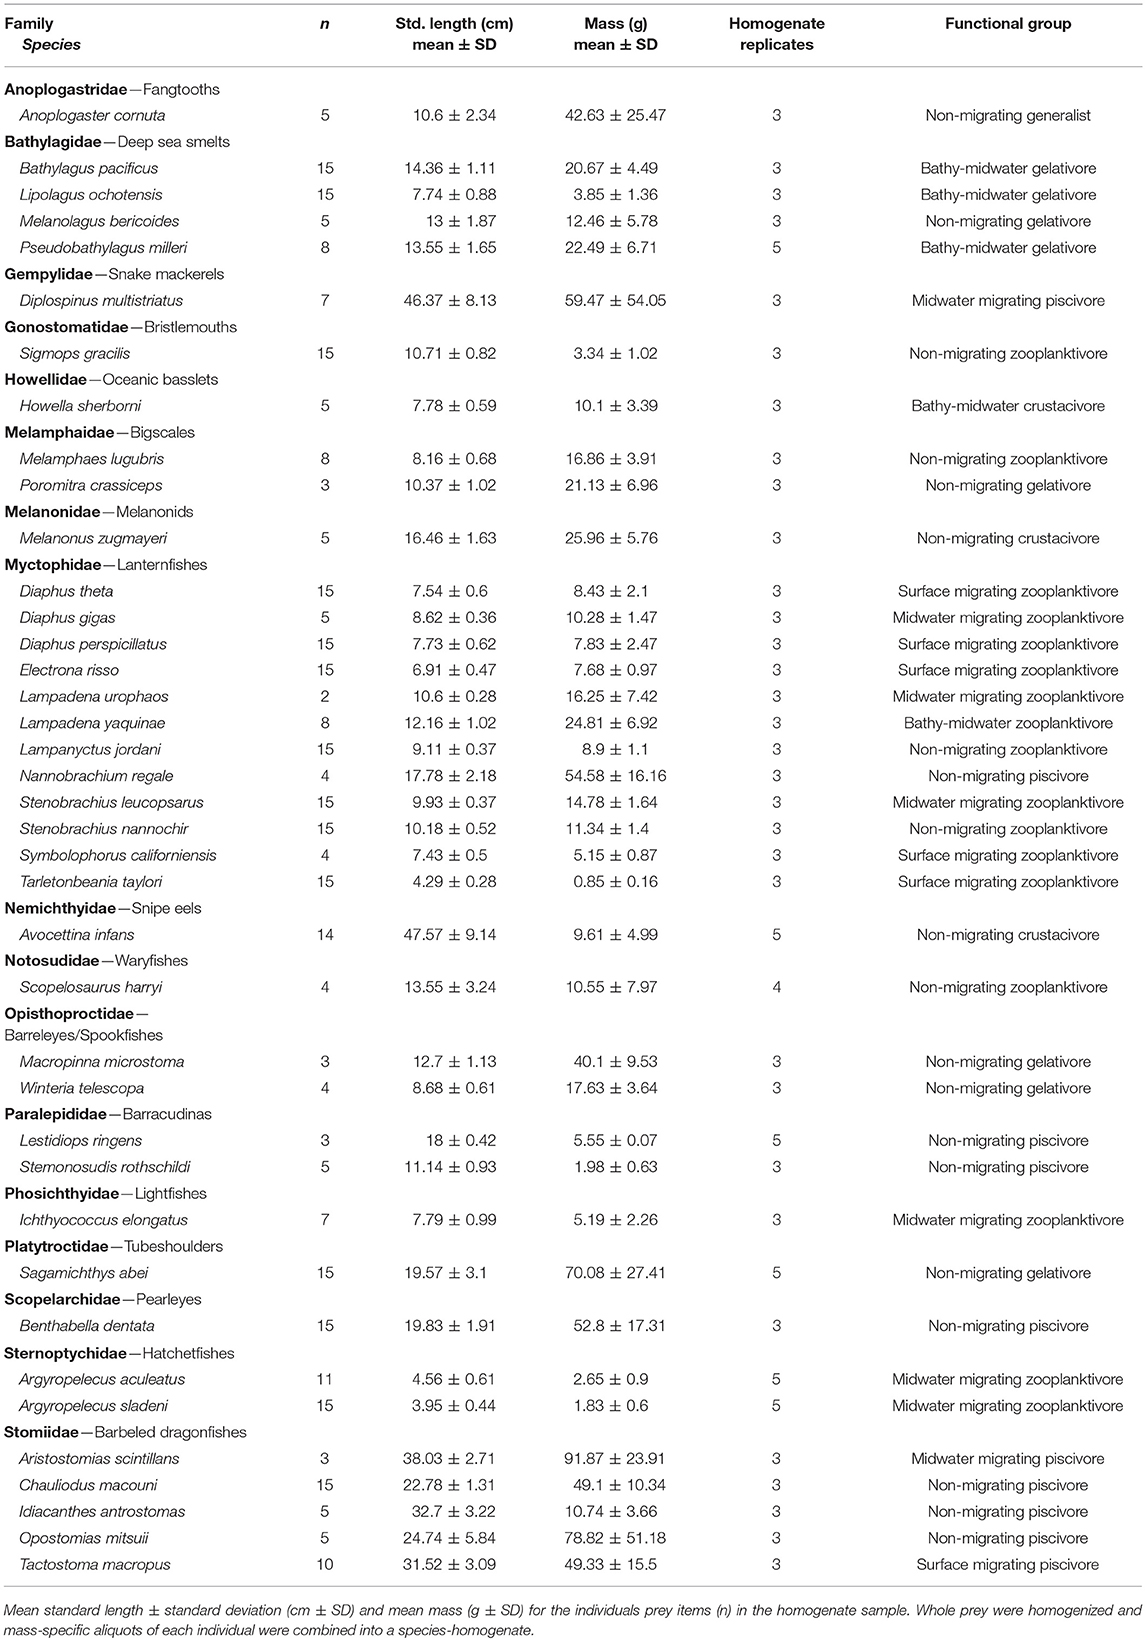
Table 2. Fish species (n = 39) in complete prey library.
Prey Classification
We compiled information on distribution, behavior, and physiology from existing literature (Table S1), and, subsequently, classified prey by taxonomic group, behavioral and ecological traits, and primary distribution. We defined 11 functional groups (2 squid groups and 9 fish groups, Tables 1, 2, and Table S1).
The two squid functional groups were classified by diel migration behavior, body composition, and hunting strategy: (1) vertically migrating, muscular squids (hereafter migrating squids) and (2) meso-bathypelagic, neutrally buoyant squids (hereafter non-migrating squids). The migrating squids show strong diel migration from the mesopelagic or bathypelagic zone during the day into the epipelagic at night in pursuit of prey. They are active hunters with a thick, muscular mantle and include commercially important species, such as Ommastrephes bartramii, Onychoteuthis borealijaponica, and Gonatopsis borealis. Other species in this functional group are Gonatus berryi, Abraliopsis felis, and Berryteuthis anonychus; the latter two form dense schools in the upper epipelagic zone at night. The non-migrating squids are neutrally buoyant, sit-and-wait hunters with no mantle musculature (Chiroteuthis c.f. calyx, Galiteuthis phyllura, Taonius borealis) to weak mantle musculature (S. dofleini and Octopoteuthis deletron). They remain in the meso- and bathypelagic depths and are rarely, if ever, found in the epipelagic zone. A possible exception to this is C. calyx which has been classified in some studies as a midwater migrator (Roper and Young, 1975), since it undergoes ontogenic migration (i.e., depth distribution becomes deeper with age). However, adult C. calyx typically do not migrate into the epipelagic zone (Burford et al., 2014).
The largest component of our prey library consisted of fishes from the mesopelagic deep scattering layers. We grouped fishes based on diel migratory strategy and diet guild (Table S1). Vertical migrator categories included surface migrators (species that migrate within 20 m of the surface at night), midwater migrators (migrate at night to the epipelagic, but remain below 20 m), bathy-midwater migrators (migrate from the bathypelagic into the mesopelagic at night), and non-migrators (no diel pattern, but can be vertically mobile, and typically remain in the same depth zone). Diet guilds included zooplanktivores, gelativores, piscivorous micronektivores (hereafter piscivores), macrocrustacean micronektivores (hereafter crustacivores), and generalists (Drazen and Sutton, 2017). The zooplanktivore guild consumes mainly tiny crustaceans like nauplii, copepods, ostracods, and euphausids, and includes the families Myctophidae (lanternfishes), Sternoptychidae (hatchet fishes), Melamphidae (bigscales), and Notosudidae (wary fishes). The gelativore guild feeds primarily on medusae, ctenophores, salps, and other gelatinous species. Gelativores include the Bathylagidae (deep sea smelts), Opisthoproctidae (barreleyes and spookfishes), and Platytroctidae (tubeshoulders) families. The piscivore guild includes the Paralepididae (barracudinas), Stomiidae (dragonfishes), Gempylidae (snake mackerels), and Scopelarchidae (pearleyes). Crustacivores mainly feed on midwater shrimps and larger mysids and are represented by the Howellidae (oceanic basslets), Melanonidae, and Nemichthyidae (snipe eels). Our final reduced prey library (see Prey Library Reduction section) had fish species representing nine functional groups: (1) surface migrating zooplanktivores, (2) surface migrating piscivores, (3) midwater migrating zooplanktivores, (4) midwater migrating piscivores, (5) bathy-midwater migrating gelativores, (6) non-migrating zooplanktivores, (7) non-migrating gelativores, (8) non-migrating piscivores, and (9) non-migrating generalists.
Lipid Analysis
Lipid Extraction
Given that small, fragile otoliths from mesopelagic fish species would not be preserved in elephant seal digestive tracts, we had limited a priori evidence to determine which fish species to retain in our final prey library. Analyzing all our collected fish samples for lipids was not possible; thus, we limited our analysis to species with three or more intact individuals (n = 39, Table 2). In contrast, squid beaks, being indigestible, are well-preserved in elephant seal stomachs (Harvey and Antonelis, 1994). Since mesopelagic squid are notoriously difficult to obtain (Hoving et al., 2014), all intact squids (n = 11, Table 1) reported in previous stomach content studies were retained, regardless of sample size. Elephant seals use suction feeding to consume prey whole, so we homogenized each whole prey item separately, then combined mass-specific aliquots from each individual into a species-homogenate (n = 3–15 individuals/homogenate). Three to five 1.5 g subsamples (replicates) were taken from each prey-homogenate, except when there was a single representative individual (Conners et al., 2018). Using a prey-homogenate gives an average prey FA profile but eliminates data on within-species variation between individuals in FA composition; however, within-species variability is likely small compared to between-species variation (Budge et al., 2002). Following a modified Folch extraction method, we isolated lipids from the prey-homogenates and blubber (n = 155 seals), using 2:1 chloroform:methanol (v/v, Folch et al., 1957; Budge et al., 2006).
Gas Chromatography and FA Profiles
We used an acidic methanol (H2SO4/MeOH) transesterification process (Hilditch method) to transform lipids to fatty acid methyl esters (FAME), increasing their volatility for gas chromatography (details in Budge et al., 2006). FAME composition was quantified using a Scion 436 gas chromatograph (GC) on a split injection setting with a silica column coated with 50% cyanopropyl polysiloxane (0.25 μm film thickness; J&W DB-23, Agilent Technologies, Folsom, CA, USA, operational setting details in Budge et al., 2006). Peaks in the output chromatographs were identified using standard FA mixtures (Nu-Check Prep, Elysian, MN, USA) and integration software (Varian Galaxie Workstation). When necessary, we used gas chromatography mass spectrometry (GC-MS) with electron ionization and identical GC conditions to determine FA structures. To account for small shifts in retention time, each chromatograph was manually adjusted for accuracy in peak identification and integration of peak areas. To generate a FA profile, peak areas of constituent FAs (n = 76) were reported as mass percent of total FAs and a mean was taken of replicate injections (two per sample). We eliminated extremely low FAs (< 0.2%), unless that FA was at least partially sourced from diet (i.e., minimally biosynthesized, Budge et al., 2006), giving a FA profile of 55 FAs.
Fatty Acid Subset
We defined the dietary FA subset to only include FAs that are sourced from diet (n = 46). In addition, we excluded three FAs that have been included as dietary FAs in previous QFASA studies for other species. FA 16:4n-3 was excluded because its calibration coefficient was zero, meaning it was not present in the captive seal. FAs 18:1n-11 and 20:1n-11 had calibration coefficients indicating likely in vivo short-chaining of 22:1n-11, making them unreliable as dietary tracers in this study (Cooper et al., 2006). This provided a final dietary subset of 43 FAs (Table 3). The 43 FA proportions in each profile were then rescaled (i.e., normalized) to sum to one (Iverson et al., 2004; Budge et al., 2006).
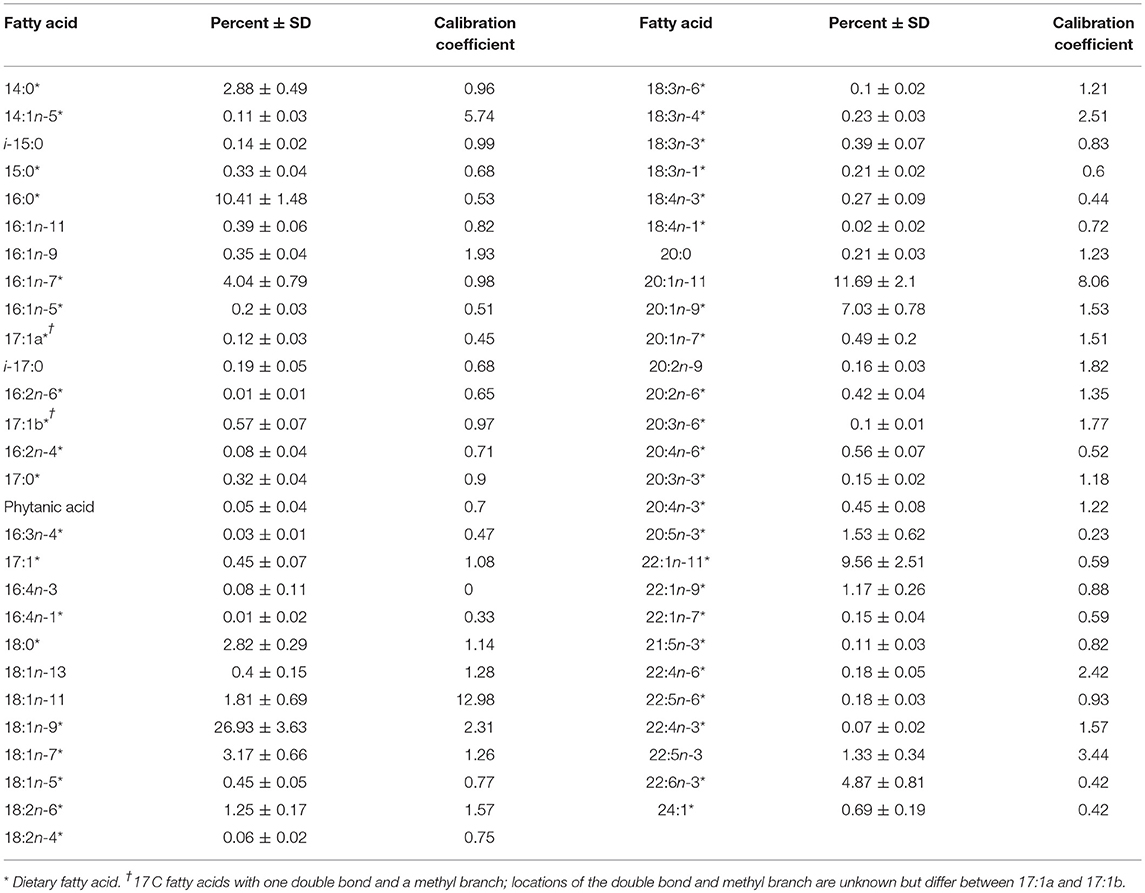
Table 3. Mean fatty acid values ± standard deviation (% ± SD) and calibration coefficients for female northern elephant seals (n = 155).
QFASA Diagnostics
Unless otherwise stated, all analyses were conducted in R v.3.4.1 (R Core Team, www.R-project.org1). All QFASA modeling and diagnostics were done with the QFASAR package v.1.2.0 (Bromaghin, 2017). For all model runs, we converted prey FA values to the predator optimization space (Bromaghin et al., 2015), and used the Aitchison distance measure (Bromaghin et al., 2015, 2016b).
Calculation of Calibration Coefficients
We calculated calibration coefficients to account for in vivo FA modification due to predator metabolism (Iverson et al., 2004; Budge et al., 2006), using data from a captive adult female elephant seal and her known diet. We collected a blubber sample and a random selection of prey from her long-term diet, 18 individuals each of capelin and herring. The captive seal's diet proportions of ~70% herring and 30% capelin for the year prior to sampling were used as weights to calculate combined diet FA values. For each FA, k = 1, . . ., 55, we calculated every possible combination of herring FA proportion (Hi), i = 1, . . ., 18, and capelin FA proportion (Cj), j = 1, . . ., 18, resulting in 324 combinations. The ratio of the FA proportion from the captive seal blubber to the corresponding FA proportion from each of the 324 diet combinations was calculated, and the 10% trimmed mean of those ratios was taken as the estimated calibration coefficient for that FA (Table 3):
We compared our elephant seal calibration coefficients to those reported from formal captive feeding trials of four other phocids: monk seals (Neomonachus schauinslandi), gray seals (Halichoerus grypus), harbor seals (Phoca vitulina), and harp seals (Pagophilus groenlandicus).
Predator FA Values Outside the Range of the Prey
If seal FA values fall outside the range of prey FA values after converting the prey values to the predator optimization space, this may indicate incorrect calibration coefficients and/or an incomplete prey library (Bromaghin et al., 2016b). We explored our data for indications of these problems using the function pred_beyond_prey (R package QFASAR) to find the proportion of seal FA values that were outside the range of the prey values (Bromaghin, 2017).
Prey Library Reduction
QFASA requires that the number of FAs in the analysis equal or exceed the number of potential prey in the prey library. Including more prey than FAs generates diet estimates that are non-unique (i.e., multiple diet estimates provide an equally good fit to the predator profile data, Bromaghin et al., 2013; Phillips et al., 2014). Most previous studies have dealt with this problem by pooling prey species with similar FA profiles into a common prey type prior to QFASA, reducing the number of prey types in the model to below the number of dietary FAs (Piché et al., 2010; Iverson et al., 2011; Bromaghin et al., 2013; Haynes et al., 2015). Conversely, Meynier et al. (2010) took a post-hoc approach, estimating diet using each individual prey animal as a distinct prey type and subsequently pooling those prey type estimates into their respective species groups. Neither approach is ideal: the a priori approach could potentially result in pooled prey types with mean FA profiles that do not resemble actual prey, while the post-hoc approach does not guarantee that the pooled diet estimates will be unique. Since we had more prey in the library (n = 51) than dietary FAs (n = 43), we needed either to select one of these approaches or find an alternate method to decrease the number of prey types prior to modeling.
All the squids in our library, except for B. anonychus, were previously documented in seal stomach contents (Condit and Le Boeuf, 1984; Antonelis et al., 1987, 1994) and were retained in the prey library, but we had no previous elephant seal diet data to justify excluding any mesopelagic fish species. The a priori pooling approach was a viable option, since it would avoid the problem of non-unique diet estimates. However, we only considered the Meynier et al. (2010) post-hoc approach as a last resort because there does not appear to be an accepted method of testing the uniqueness of the pooled diets. To assess whether we could justifiably use the a priori approach, we analyzed the prey FA profiles with non-metric dimensional scaling (NMDS) and leave-one-prey-out (LOPO) analysis.
Non-metric Dimensional Scaling
To visualize the similarity/dissimilarity among the FA profiles of prey species, we used a three-dimensional NMDS with the Aitchison distance measure for compositional data (Aitchison, 1986). We looked for the presence of natural clusters that would allow us to combine fish species into a smaller number of prey types. We found a clear separation between fish and squid FA profiles (Figure 2). However, since we lacked data on within-species variation in prey FA profiles, we were unable to assess the degree of overlap among species or ecological groups (i.e., migrator type, diet guild, and mesopelagic biogeographic region). Although there were some species that were close to each other within ecological groups, there were no distinct, clearly defined clusters based on ecological characteristics (Figure S1). Thus, we were not confident that the degree of similarity within ecological groups was enough to justify pooling those species.
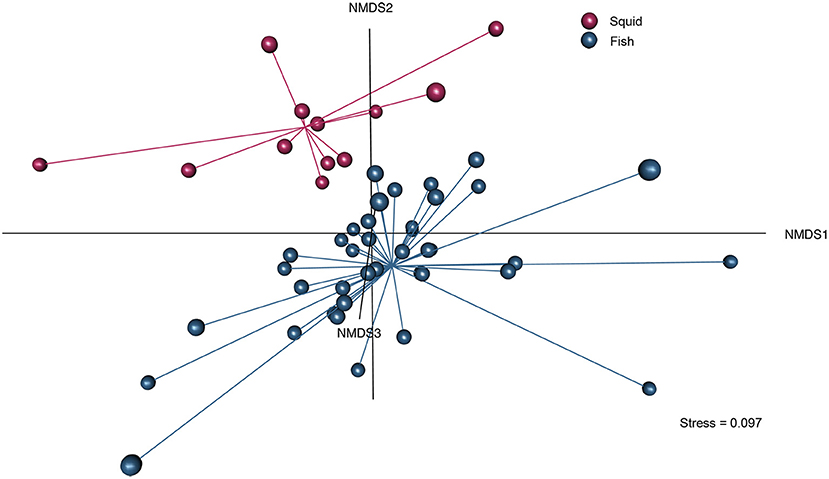
Figure 2. Three-dimensional NMDS analysis of prey dietary fatty acid profiles using the complete prey library (n = 51 prey types). Red spheres are squids (n = 12), while blue spheres are fishes (n = 39). Squid fatty acid profiles cluster distinctly from fish fatty acid profiles. Size of the sphere indicates position on the z-axis (NMDS3), larger spheres are closer and smaller spheres are farther away.
LOPO Analysis
Leave-one-prey-out (LOPO) analysis is a cross-validation technique used to assess the ability of the QFASA model to distinguish between prey profiles (i.e., degree of “prey confounding”). When prey FA profiles are highly similar (high prey confounding), model performance is decreased and there is less certainty in the diet estimates (Bromaghin et al., 2015, 2016b). Also, high prey confounding may indicate potential clusters of prey that could be grouped, allowing us to reduce the prey library. In our study, the LOPO results may be somewhat biased toward the removed prey profile, since, by design, there is low variation between the homogenate FA profiles. However, any consequential misidentifications would still be evident and informative. While two prey species (subadult O. borealijaponica and Winteria telescopa) showed some degree of confounding, no other prey species did (Figure S2). Thus, based on both the NMDS and LOPO analyses we determined that pooling species into a smaller number of prey types prior to QFASA was not justified.
Drop Core Prey (DCP) Analysis
To solve our “more prey than FAs” problem, we developed a novel method to exclude non-contributing prey species and create a reduced prey library. We could not simply exclude prey species that were not present in the original diet estimates generated with the complete prey library (51 species), because those prey might have had larger contributions to diet in other equally viable estimates. Hence, excluding them could have resulted in removing prey from the library that actually were present in elephant seal diet. We reasoned that if we dropped apparently important core prey from the library (DCP) and forced the model to generate new diet estimates, any prey that were never present in any of the DCP diet estimates would (1) truly be absent from the diet and (2) be isolated from the non-uniqueness problem and, therefore, could justifiably be excluded permanently.
We identified 36 core prey (present in at least one seal's diet at proportions > 0.001) in the original diet estimates. Each core prey was then iteratively removed from the library (50 prey) and the QFASA model was rerun. We compared the objective functions, or the values of the minimized Aitchison distance, between the new DCP diet estimates and the original diet estimates, and we considered the DCP estimates equally valid if the objective functions were less than or equal to those from the complete prey library. The majority of the DCP diet estimates fit the data as well as or better than the original diet estimates, confirming that the results using the full prey library were not unique. Finally, we identified 10 prey species that were never present in the diet across all the DCP diet estimates (36 core prey × 155 seals = 5,580 diet estimates): A. felis, Abraliopsis infans, Howella sherborni, Ichthyococcus elongatus, Lampadena yaquinae, Melanonus zugmayeri, Nannobrachium regale, O. deletron, Pseudobathylagus milleri, and Sigmops gracilis. We excluded these prey from the library, resulting in a final reduced prey library of 41 prey, which numbers less than the 43 dietary FAs.
Quantitative Fatty Acid Signature Analysis
Final Diet Estimation
Final diets were estimated for each elephant seal (n = 155) with the dietary FA subset and the reduced prey library. The raw diet output (% lipid mass from each prey type) was then adjusted for the lipid content of the prey (Table S2) to give the final diet estimates (% biomass of each prey species). To quantify generalized elephant seal diet and the relative importance of specific prey, we calculated three traditional diet metrics: (1) mean occurrence (%) of prey i in the population-level diet with standard deviation, (2) maximum occurrence (%) that prey i occurred in any individual seal's diet, and (3) frequency of occurrence (%) of prey i across all seal diets (number of diets with prey i > 0.01% divided by the total number of seal diets).
Quantifying QFASA Model Error: Diet Simulations
To further assess QFASA model performance, we employed a strategy utilizing simulated diets. We used a semi-random, partially supervised method to construct 550 simulated diets per prey species, pi (n = 41), using the Dirichlet distribution, the multivariate case of the beta distribution (0–1) for compositional data. To ensure that we had a sample of simulated diets representing the range of all possible seal diets, we assigned prey i a vector of proportional values with the sequence pi(1-11) (0.01, 0.1, 0.2, 0.3, 0.4, 0.5, 0.6, 0.7, 0.8, 0.9, and 0.99). The composition of the remainder of each simulated diet (1 – p) was randomly generated from the Dirichlet distribution (α = 0.25). The simulated diets (n = 22,550) were used to generate pseudo-predator FA profiles (Bromaghin, 2015), which were then evaluated by the QFASA model to determine an estimated diet for each simulated diet. For each prey species, we plotted the prey proportion in the known simulated diet against the proportion in the model-generated estimated diet (Figure S3). We also calculated the difference between the simulated diet proportion of prey i and its corresponding estimated diet proportion as a measure of model error. Due to the lack of variation in the homogenized diet replicates for each species, we had no basis on which to simulate variance in the pseudo-predator FA profiles. Consequently, our simulations likely underestimated the model error, giving results for a best case scenario. Regardless, the simulations provided a comparison of how well the model estimates the presence of each prey item in the diet relative to the others.
Results
We report the mean FA profile (mass percent of total FAs) from 155 female elephant seals (± SD) with respective calibration coefficients in Table 3. The mean FA profiles of the complete prey library (51 species) with prey lipid content (percent of wet weight) is provided in Table S2.
QFASA Diagnostics
Reliability of the Calibration Coefficients
The elephant seal calibration coefficients fell within the range reported for other phocids (Figure 3). The FA 20:1n-11 had a calibration coefficient (8.06) that was higher than other phocids (gray seal: 3.42, harbor seal: 1.87, harp seal: 2.83, and monk seal: 3.36). Also, the calibration coefficient of FA 18:1n-11 (12.98) was higher for the elephant seal than all other phocids except for gray seals (15.04). Our captive elephant seal was likely chain shortening FA 22:1n-11, resulting in elevated levels of 18:1n-11 and 20:1n-11 which were not attributed to diet alone (Cooper et al., 2006). However, we could not be certain if our calibration coefficients accurately reflected chain shortening. For this reason, we did not use these FAs as dietary tracers and excluded them from the dietary FA set. Overall, only 1.5% of seals had any FA values beyond the range of prey FA values (Figure 4). For most of the dietary FAs, we found only a low number of seals had FA values outside the range of the prey values (Figure 4). Only four dietary FAs (16:0:10.8%, 17:1a:21.2%, 16:3n-4:13.5%, and 18:1n-7:8.3%) resulted in more than 5% of all seals having FA proportions that fell outside the range of the prey.
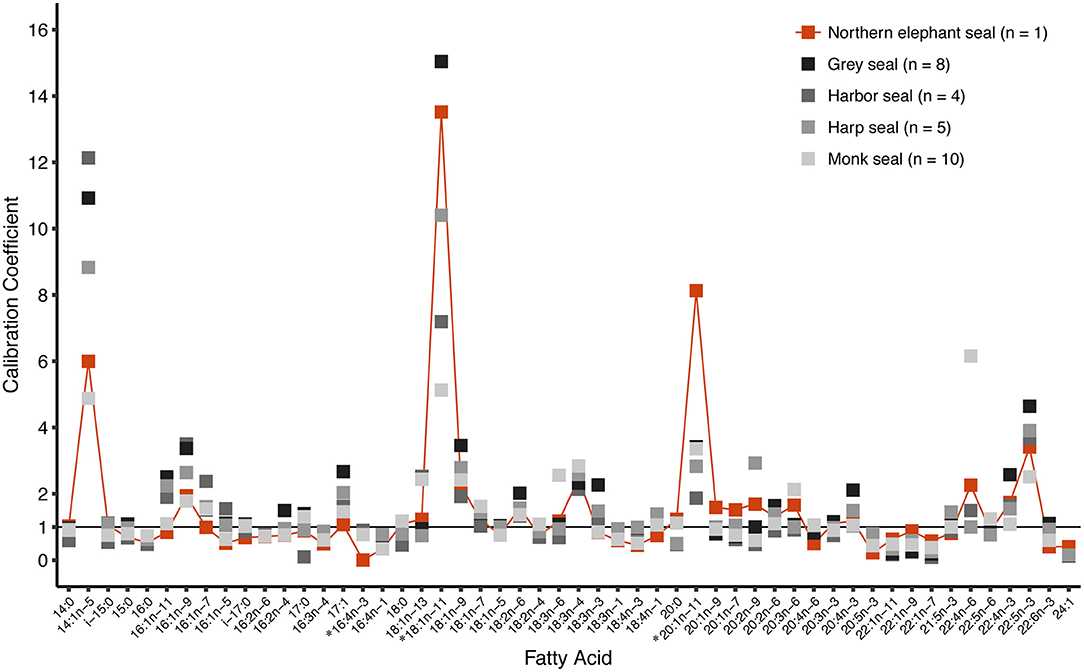
Figure 3. Calibration coefficients for an adult female northern elephant seal (n = 1, this study) compared with those reported for four other phocid seals. FAs 16:4n-3, 18:1n-11, and 20:1n-11 (*) were not designated as dietary fatty acids in this study. Values for 16:4n-3 were only available for northern elephant seals, harbor seals, and monk seals. Values for 24:1 were only available for northern elephant seals, gray seals, and harp seals. Data for gray seals and harbor seals taken from Rosen and Tollit (2012). Data for harp seals taken from Iverson et al. (2004). Data for monk seals provided by S. Iverson and first reported in Iverson et al. (2011). Figure modified with permission from Iverson et al. (2004, 2011).
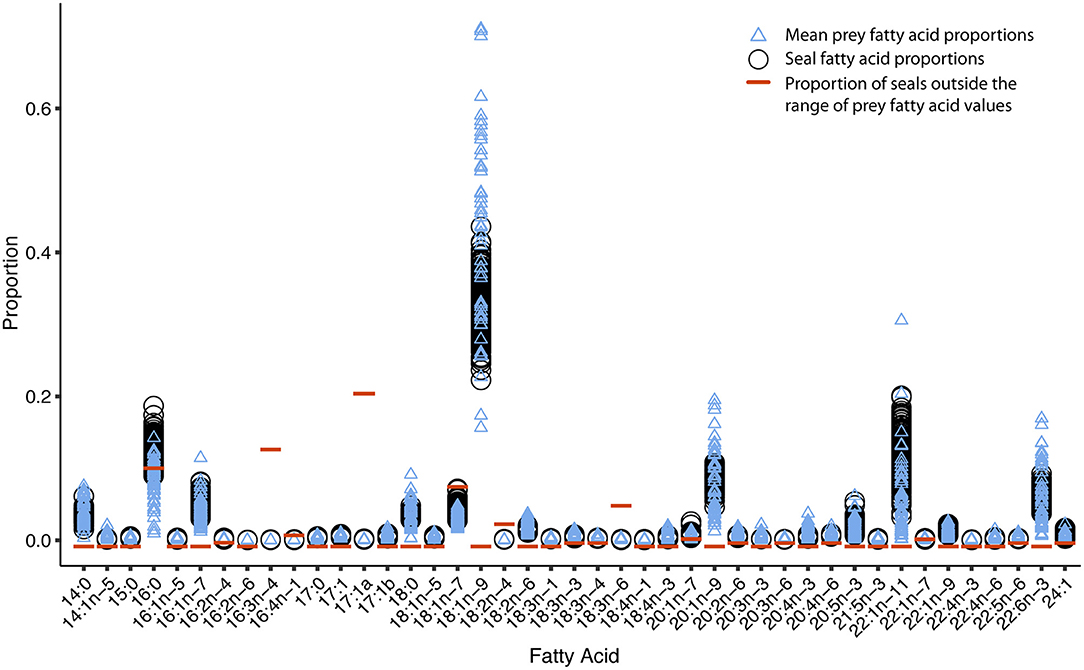
Figure 4. Overlap of elephant seal fatty acid (FA) values with the range of mean prey FA values indicates that the calibration coefficients are consistent with the prey library. Blue triangles indicate dietary FA proportions for prey (one mean value per species, n = 51 for each FA). Prey values have been transformed to predator FA optimization space with the calibration coefficients. Black circles indicate FA proportions for individual elephant seals (one value per individual, n = 155 for each FA). Orange lines indicate the proportion of individual seals that fall outside the range of prey values for each FA. Less than five percent of seals (proportion < 0.05) have FA values outside the range of the prey.
Degree of Prey Confounding
The LOPO analysis showed good discrimination among prey FA profiles by the QFASA model (i.e., a low degree of prey confounding). Most species that were eventually dropped from the model (A. felis, A. infans, H. sherborni, I. elongatus, L. yaquinae, M. zugmayeri, P. milleri, and S. gracilis) were almost never misidentified as other species, with nearly 100% of their diet estimate attributed to themselves (Figure S2). The remaining two dropped prey, N. regale and O. deletron, still had high proportions correctly attributed: 77% and 84%, respectively. The myctophid, N. regale, was most often misattributed to A. infans (7%), which was also dropped from the model, and M. lugubris (5%). O. deletron was most often misassigned to other squids (gonatid squid species: B. anonychus, G. berryi, and G. borealis, and the mesopelagic squid S. dofleini), all < 3%. Only two species besides N. regale were self-attributed < 80%: subadult O. borealijaponica (54%) and W. telescopa (77%). Subadult O. borealijaponica was most often misidentified as the squid species O. bartramii (27%), T. borealis (7%), O. deletron (5%), and adult O. borealijaponica (3%). The spookfish W. telescopa was most often misidentified as the gelativore, M. bericoides (6%), or the two barracudinas, S. rothschildi (4%) and L. ringens (4%).
Simulations and Prey-Specific Error
Diet simulations confirmed that the QFASA model reliably estimated the simulated diets (Figure 5A and Figure S3). The highest underestimation error was found in the piscivorous fishes Benthalbella dentata (0.8%) and Diplospinus multistriatus (0.6%) across the range of possible proportions in the diet (0–100%). The highest overestimation error was for the squid B. anonychus and S. dofleini (both 0.5%). The variation in error for all species was also low (range: −0.27 to 2.6%) with the aforementioned species having the highest variation in error (B. dentata: −2.6 to 0.9%, D. multistriatus: −2.1 to 0.8%, B. anonychus and S. dofleini: −0.8 to 1.7%) Several species were estimated nearly perfectly with error close to 0% (G. borealis, C. c.f. calyx, T. borealis, and T. macropus). C. c.f. calyx and G. borealis also had the lowest variation in error (both −0.3%). The two functional groups with the highest average simulation error were the non-migrating piscivore group (underestimated by 1.4%) and the migrating squid group (overestimated by 1%). The functional group with the lowest simulation error was the bathy-midwater migrating gelativore group (underestimated by 0.08%). The other functional groups were over- or underestimated by < 0.9%.
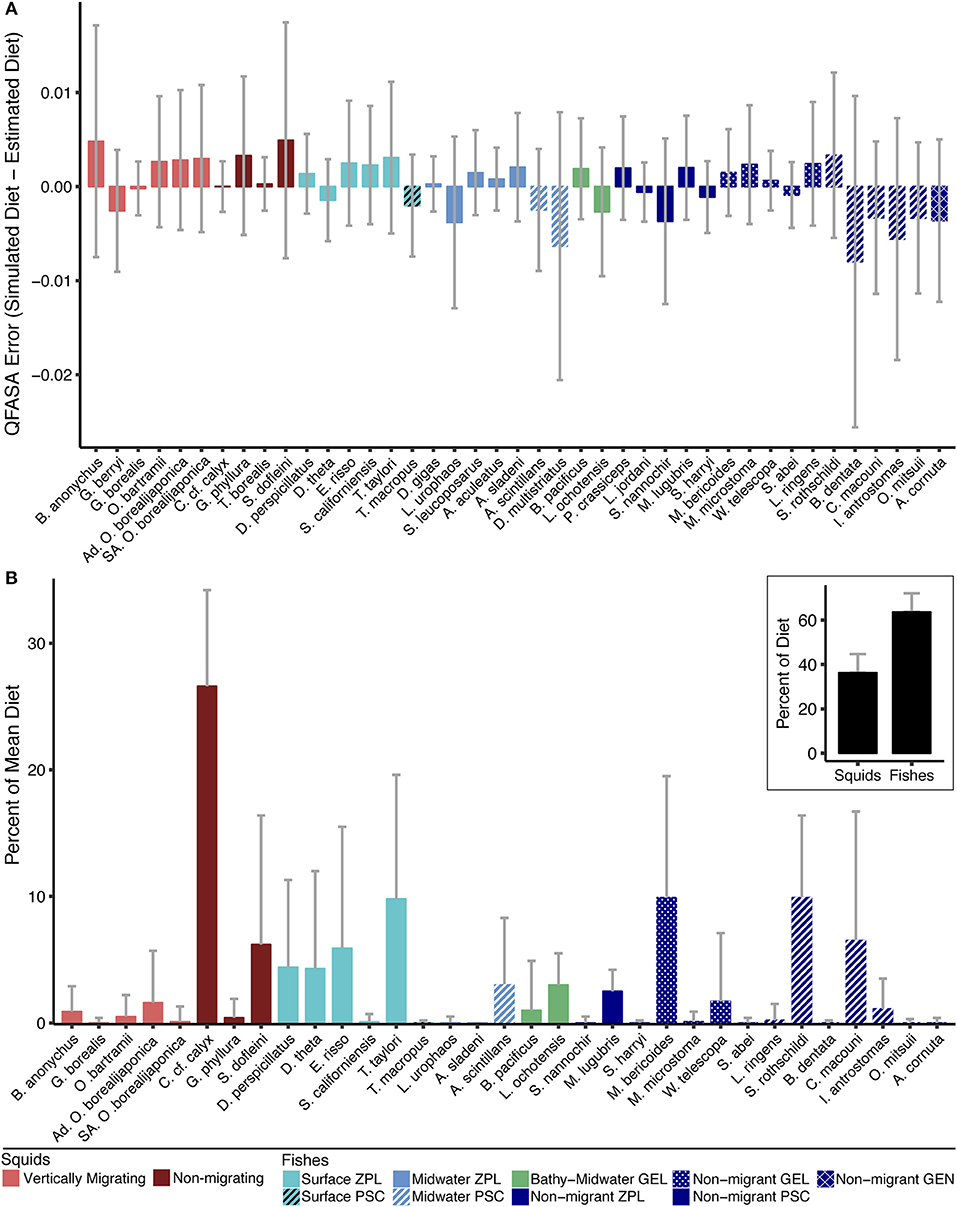
Figure 5. (A) Mean error and standard deviation (SD) of QFASA model, calculated as the difference between the proportion of each prey species in the simulated diets (i.e., truth) and the respective proportion in the QFASA estimated diets. Prey with model error > 0 were overestimated by the QFASA model while prey with model error < 0 were underestimated. (B) Average diet for female northern elephant seals (n = 155) determined by QFASA. Thirty-three prey from 11 functional groups are represented in the overall diet. The prey represented are a subset of the reduced prey library that were present in at least one seal's diet. The inset highlights the finding that fishes (63.7%), rather than squids (36.3%), dominate the mean population-level diet of elephant seals. Refer to Table 4 for exact percentages and absent species. Gray bars indicate SD. ZPL, zooplanktivore; GEL, gelativore; PSC, piscivore; GEN, generalist.
Diet Characterization
Of the 41 species in our reduced prey library, 33 (25 fishes and 8 squids, Figure 5B) were present in the diet of at least one seal. Combined mesopelagic fishes dominated the population-level diet of elephant seals at 63.7%; although the average diet had a high proportion of non-migrating squids, total squids only had a mean occurrence of 36.3% (Figure 5B, Table 4). Surface migrating zooplanktivores were the most common fish group (24.5% mean occurrence and 98.7% of diets), followed by the non-migrating piscivore group (17.8% mean occurrence and 93.5% of diets), and the non-migrating gelativore group (11.7% mean occurrence and 82.6% of diets). Within the surface migrating fish group, Tarletonbeania taylori and Electrona risso, both myctophids, were the most common species (9.8% and 5.9% mean occurrence), but E. risso was present in more seal diets than T. taylori (83.2% vs. 70.3%). Nearly all the species of myctophids represented in the average diet were in the surface migrating zooplanktivore group. The non-migrating zooplanktivore and bathy-midwater migrating gelativore groups had low mean occurrences (2.5% and 4%, respectively), but they were both present in a large proportion of seal diets (91.6% and 86.5%).
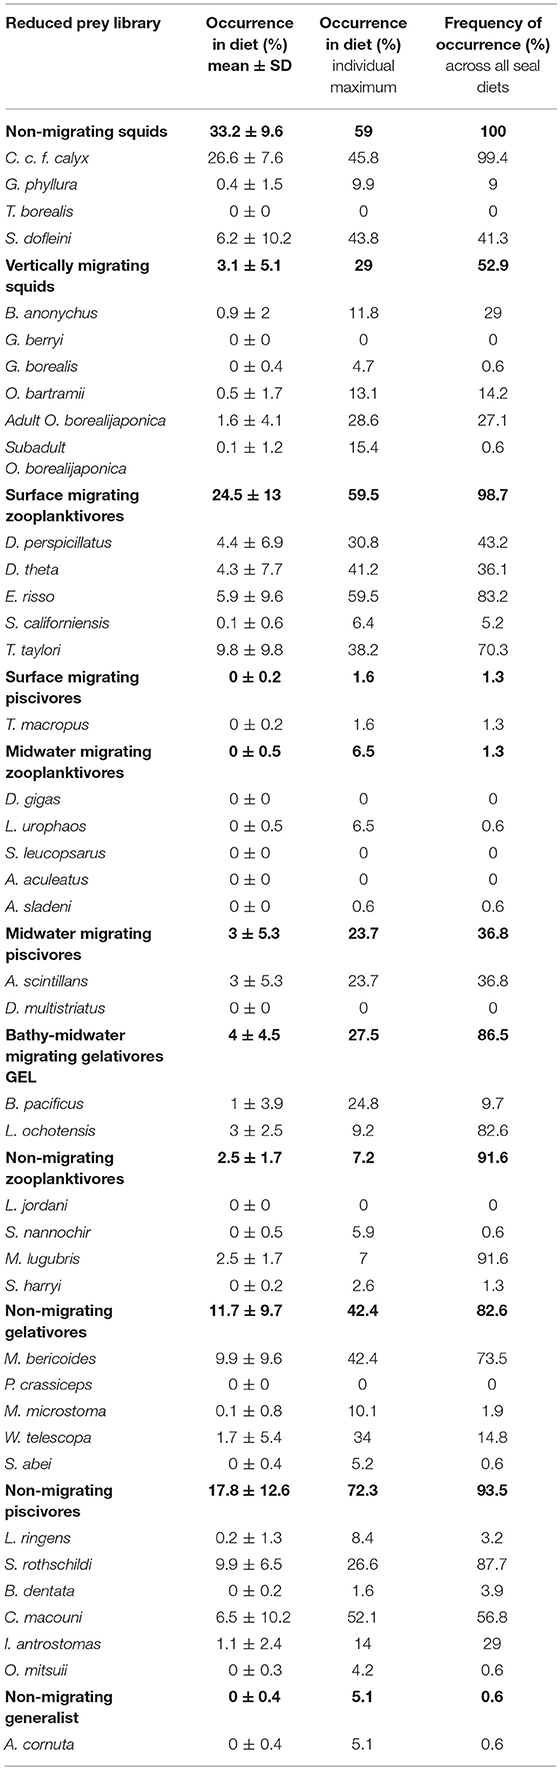
Table 4. Mean dietary composition for northern elephant seals as determined by QFASA using the reduced prey library (n = 41 prey types): occurrence (% ± SD) in the population-level elephant seal diet, maximum occurrence (%) in any individual seal's diet, and frequency of occurrence (%) across all seal diets (n = 155).
The most common species from the non-migrating piscivore group were S. rothschildi and Chauliodus macouni (9.9% and 6.5% occurrence, respectively). S. rothschildi was present in 87.7% of all diets and C. macouni in 56.8% of diets. Gelativores, both migrating and non-migrating, were important prey (15.7% combined mean occurrence). Of these, the bathylagids, M. bericoides, L. ochotensis, and B. pacificus (combined mean occurrence 13.9%) was the most common family. In the non-migrating gelativore group, M. bericoides was the most common species (9.9% occurrence in 73.5% of diets). Lipolagus ochotensis (bathy-midwater gelativore) and Melamphaes lugubris (non-migrating zooplanktivore) only occurred in low mean proportions (3% and 2.5% occurrence, respectively), but were present a high number of diets (82.6% and 91.6% of diets, respectively). Some species were only important in a few seals' diets: W. telescopa (non-migrating gelativore), adult O. borealijaponica (migrating squid), and B. pacificus (midwater migrating gelativore) had maximum occurrences of 34%, 28.6%, and 24.8% respectively.
Meso-bathypelagic non-migrating squid was the most represented functional group (33.2%) in mean population-level diet, occurring in 100% of seal diets (Figure 5B, Table 4). The maximum occurrence of this group in a single diet was 59%. C. c. f. calyx was the dominant representative of the non-migrating squid group and was also the most frequently occurring species in the population-level diet (26.6% mean occurrence in 99.4% of diets). S. dofleini was the next most common non-migrating squid species (6.2% mean occurrence and 41.3% of diets). The maximum occurrences of C. c. f. calyx and S. dofleini were 45.8% and 43.8%, respectively. Vertically migrating squids only occurred in small proportions (3.1%) but were present in over half of the seals' diets and one seal had just under 30% of its diet as this functional group.
Discussion
Diet of Female Northern Elephant Seals
Female northern elephant seals overwhelmingly consumed energy-dense, meso- and bathypelagic fishes contrary to previous stomach content studies which determined squids to be the dominant prey (Antonelis et al., 1987, 1994). Moreover, these fishes comprised a substantial proportion of their diet over long time periods of months to years. Further, our findings are consistent with recent observations from head-mounted cameras showing that northern elephant seals more frequently feed on fishes than squids (Naito et al., 2017). In addition, our diet estimates for northern elephant seals now align with similar results from multiple studies showing the importance of mesopelagic fishes in the diets of their Antarctic congener, the southern elephant seal (Bradshaw et al., 2003; Cherel et al., 2008; Banks et al., 2014). Our study highlights the importance of using complementary methods of diet determination like QFASA to reveal critical “hidden” prey species that cannot be adequately detected by traditional stomach contents analysis alone.
The two fish groups which dominated the diet were surface migrating zooplanktivores and non-migrating piscivores. Surface migrating zooplanktivores were the largest fish component accounting for a quarter of the average diet for elephant seals, and were represented by five species from the family Myctophidae (Diaphus perspicillatus, Diaphus theta, E. risso, Symbolophorus californiensis, T. taylori), the most abundant family in the deep scattering layers (Catul et al., 2011; Irigoien et al., 2014). These myctophids have high lipid content, making them one of the most energetically-rich prey resources (i.e., E. risso ~12,100 kJ kg−1) available to elephant seals (Sinclair et al., 2015). Within the non-migrating piscivores, the viperfish C. macouni and the barracudina S. rothschildi were the most commonly consumed. The family Stomiidae is the most abundant group of fish predators in the mesopelagic (Choy et al., 2013), with C. macouni being the most abundant species of this group caught in our trawls (Saijo et al., 2017). C. macouni is energy-rich (~4,500 kJ kg−1), but still only has around half as much energy as most myctophids (Sinclair et al., 2015). C. macouni employs a sit-and-wait hunting strategy (Drazen and Sutton, 2017), which may make them easier to capture. In contrast, barracudinas are small, fast-moving hunters, with a lower gross energy content than Stomiidae due to their smaller size (Spitz et al., 2010). This suggests they would be an unfavorable prey item for elephant seals, since chasing and capturing a single barracudina would be energetically expensive. However, it is hypothesized that barracudinas form large, dense schools (Harry, 1953; Fukui and Ozawa, 2004). Given that elephant seals employ suction feeding and rapid jaw movements, they can likely capture many barracudinas at a time, increasing net energy gain compared to capturing one alone.
Gelativores of the family Bathylagidae (deep-sea smelts), both in the bathy-midwater migrating and the non-migrating gelativore groups, were also important prey species for elephant seals. This was especially true for some individuals, for whom bathylagids represented over a third of their total diet. In addition, bathylagids were identified in recent video footage from free-ranging feeding female elephant seals (Naito et al., 2013, 2017). Despite being less energy-dense than myctophids (Sinclair et al., 2015), bathylagids are the second most abundant group of mesopelagic fishes in the eastern North Pacific (Brodeur and Yamamura, 2005), which supports their prevalence in elephant seal diet. The non-migrating gelativore, Icosteus aenigmaticus, has been identified in video footage as a species consumed on particularly deep dives (>900 m, Naito et al., 2017). However, this species was not included in our prey library, so we cannot comment on the hypothesis of Naito et al. (2017) that it may be an important dietary item for larger, deeper diving females.
Although female northern elephant seals predominately consumed fishes, non-migrating squids were still a key component in the diet of nearly all seals. Non-migrating squid are less energy dense (~2,000 and 4,000 kJ kg−1) than the other functional groups in our study (Sinclair et al., 2015); however, they are generally slow moving, sit-and-wait hunters which may make them easy targets for seals. In contrast to previous studies, we found that C. c.f. calyx was the most dominant species followed by S. dofleini. Antonelis et al. (1987, 1994) found that O. deletron was the most common squid in the diet of adult females, followed by two histioteuthid squids, Histioteuthis heteropsis and S. dofleini. The discrepancies between our results and those of Antonelis et al. (1987, 1994) may be due to seals foraging in the California Current as they return to the rookery, since O. deletron is more associated with the California Current than C. calyx, and squid beak retention in the stomach is biased toward more recently consumed squids. Another possibility could be interannual differences in the distribution and abundance of squid species between their study period and ours.
Vertically migrating squids, while highly abundant in the eastern North Pacific, were not a major contributor to the diet of elephant seals, similar to the findings of Antonelis et al. (1987, 1994). Chasing and capturing these fast-moving, agile squids would increase energy expenditure of foraging seals, considerably reducing the net energy gain from this prey type. Since vertically migrating squids are less energy-dense (~3,000–6,000 kJ kg−1) than many mesopelagic fishes (~10,000–15,000 kJ kg−1, Sinclair et al., 2015), they may be less favorable prey despite their larger size, explaining their relative infrequency in elephant seal diet. However, there were a few individual seals that consumed higher proportions of migrating squids (e.g. ~30%), suggesting some individuals may specialize on this prey type.
According to optimal foraging theory, predators should prefer prey items that maximize their net energy gain (Charnov, 1976; Pyke, 1984; Stephens and Krebs, 1986), accounting for both prey energy content as well as the energy and time expended while foraging. Mesopelagic fishes have an average energy content (gram/wet weight) up to an order of magnitude higher than that of squids (Sinclair et al., 2015), so there may be an energetic advantage to this prey type, if seals can capture them efficiently. In addition, mesopelagic squids can be distributed more sparsely compared to fishes (Hoving et al., 2011), potentially making them difficult to catch frequently or in large numbers. Jaw motion analysis provides additional evidence that elephant seals often feed on many, small prey rather than single, large prey, despite the differences in gross energy content (Naito et al., 2013, Y. Naito and H. Louis, unpublished data).
The estimated diets in this study, with seals consuming both migrating and non-migrating fishes, are also consistent with the documented foraging behavior of female northern elephant seals observed with time depth recorders. Female seals display a marked day/night pattern in their foraging dives (mean day: ~620 m, mean night: ~450 m), as well as a diurnal bimodal dive distribution (modes: 385 m and 641 m, Robinson et al., 2012; Naito et al., 2017), which mirrors the vertical distribution of the deep scattering layers elephant seals forage upon (Frost and McCrone, 1979; Klevjer et al., 2016; Proud et al., 2018). Migrating mesopelagic fishes, like myctophids, rise from depths of ~300–700 m during the day to < 20 m at night (Watanabe et al., 1999; Brodeur and Yamamura, 2005). Since adult northern elephant seals typically do not feed at depths shallower than 400 m (Naito et al., 2013), it is likely that they are consuming these myctophids at deeper depths during the day and during twilight as they move upward in the water column. Yet, even at night many seals exhibit deep foraging dives that range from 650 to > 1,000 m (Naito et al., 2013, 2017), which is consistent with the presence of non-migrating species in their diets.
As a large endothermic predator with high prey requirements, northern elephant seals may exert top-down effects on the mesopelagic ecosystem. Thus, determining the diet of this top predator is a critical first step to unraveling complex food web interactions in the mesopelagic community of the North Pacific. Recent energetic studies using doubly-labeled water have shown that, on average, an adult female ingests ~64–141 MJ per day (Maresh et al., 2015). Based on the energetic content of a mesopelagic squid (Octopoteuthis deletron, 3.08 MJ kg−1) and myctophid fish (Myctophidae, 0.02 kg, 11.88 MJ kg−1) and assuming a simple monophagus diet, Maresh (2014) calculated that a single female elephant seal would need to consume ~5,600 kg of squid or 1,600 kg of fish per year from the North Pacific mesopelagic ecosystem. The current population estimate for northern elephant seals is ~240,000 (Lowry et al., 2014), with adult females representing around 22% of the population or ~53,000 individuals (Lowry et al., 2014). Scaled up to the population level, female seals are likely extracting ~286 million kg (286 thousand metric tons) of squid or 82 million kg (82 thousand metric tons) of fish per year, and that may be a conservative estimate. However, the paucity of data on the standing biomass of mesopelagic fauna makes it difficult to assess whether this level of prey extraction by elephant seals would result in any appreciable top-down effects on the North Pacific mesopelagic ecosystem.
Our prey library did not include two species, Pacific hake (Merluccius productus or Pacific whiting) and pelagic red crab (Pleuroncodes planipes), that have previously been reported as important prey items for elephant seals (Antonelis et al., 1987). Pacific hake is most likely not a significant component of diet of most female seals, as its distribution is confined largely to the demersal regions of the continental shelf and slope (Agostini et al., 2006). Female seals do not spend a significant portion of their foraging trips utilizing the continental shelf and slope regions (Robinson et al., 2012; Naito et al., 2013), so it is more likely that they opportunistically feed on hake near shore as they return to the rookery for breeding or molting (Sinclair, 1994). Pelagic red crab was only observed in the diet of seals during the 1984 El Niño (Antonelis et al., 1987, 1994) and was likely a unique event. Future diet analyses could focus on expanding the prey library to include species from the California Current biogeographic province and from the coastal shelf regions, which would facilitate diet estimation for seals that exclusively forage in those areas.
Evaluating QFASA
We developed a novel method, the drop core prey (DCP) analysis, to exclude prey species from the library based on quantitative criteria in order to resolve the problem of non-unique diet estimates. A non-arbitrary method of decreasing the number of prey was critical, as we lacked a priori information on which mesopelagic fishes were likely to be in the elephant seal diet. Our method iteratively eliminated core prey species from the complete prey library, and subsequently identified whether QFASA could estimate equally valid diets with the reduced prey library. From this, we inferred that any prey species that failed to appear in any of DCP diets, was truly absent from the diet. We permanently removed those absent prey species to obtain a final reduced prey library. The DCP analysis extends the applicability of QFASA to predators with access to many potential prey, where available data are insufficient to narrow those options.
NMDS ordination allowed us to see the relations of prey species in FA space, and, importantly, showed distinct separation between fish and squid FA profiles. Squids can be problematic in QFASA models (Conners et al., 2018), because most of their lipids are found in the large digestive gland, rather than other tissues like the mantle (Phillips et al., 2002). This results in a FA profile that may strongly resemble that of recently consumed prey present in the digestive gland. Since squids consume deep scattering layer fishes and other squids, they are more prone to be misidentified as their own prey. This problem is not limited to QFASA, but also occurs in stomach contents analyses, where it cannot be verified whether some prey remains were eaten by the predator of interest or if they were in the stomach of a prey item (Harvey and Antonelis, 1994; Bowen and Iverson, 2012). However, the separation between fishes and squids in the NMDS analysis combined with low error in the diet simulations suggests that this may not be a major source of error in our model.
The LOPO analysis and the diet simulations provided complementary information, which, when used together, allowed us to evaluate the ability of QFASA to distinguish among the species in our prey library. Several species (e.g., G. borealis and T. macropus) that had nearly zero estimated error in the simulations were occasionally misidentified as other species in the LOPO analysis. G. borealis was misidentified, though rarely, as C. calyx and O. deletron, whereas T. macropus was occasionally misidentified as B. dentata and M. lugubris. Consequently, we are confident that while the QFASA error for these species is likely not zero, it is still very low. Furthermore, the two species that had the highest rates of misidentification in the LOPO analysis (subadult O. borealijaponica and W. telescopa) had low error in the simulations, increasing our confidence in their estimates. No species with extremely low error in the simulations was self-attributed at < 87% in the LOPO analysis. When examined separately these methods were both likely to underestimate model error; however, interpreting them together allowed us to more accurately assess model performance in the absence of within-species variation in FA profiles.
Care must be taken in the selection of calibration coefficients because they represent the highest source of error and bias in QFASA modeling (Rosen and Tollit, 2012; Bromaghin et al., 2016b). Fortunately, we had access to a single captive adult female elephant seal and were able to compare her known diet to her FA profile. This provided a non-traditional method of calculating the elephant seal calibration coefficients. We found that our calibration coefficients were comparable to those of other phocids in formal captive feeding studies (Iverson et al., 2004, 2011; Rosen and Tollit, 2012). Therefore, while not a substitute for the traditional method, ours is a reasonable alternative for obtaining species-specific calibration coefficients when conducting a full captive feeding trial is not an option.
Conclusions
Using QFASA, we obtained the first quantitative estimates of the population-level diet of adult northern elephant seals, one of the top predators in the eastern North Pacific. Our findings change the prevalent view of northern elephant seals as specializing on squids, and, instead, confirm a broad diet dominated by deep-sea fishes. Myctophids and bathylagids are both critical prey groups that elephant seals exploit on their deep foraging dives into the deep scattering layers of the mesopelagic zone. Additionally, though still undeniably an important prey type, non-migrating mesopelagic squids only account for about a third of the population-level diet, far less than previously thought. Since non-migrating squids are also common prey items for sperm whales, fur seals, and beaked whales feeding in the eastern North Pacific (MacLeod et al., 2003; Gallo-Reynoso and Esperón-Rodríguez, 2013; Harvey et al., 2013), our study provides further evidence that these squids play an important role in the mesopelagic food web. Given the magnitude of mesopelagic biomass consumed by northern elephant seals, this study provides essential information on food web structure and function for the difficult to observe deep-ocean ecosystem of the North Pacific.
Author Contributions
CG, MC, SB, and DC conceived and designed the study. CG and SS collected blubber biopsies from elephant seals. CG, MC, and YM designed prey collection methods and conducted fieldwork on the T/S Oshoro-maru. WW identified prey species and contributed his considerable expertise on the ecology and behavior of mesopelagic fauna. CR provided a blubber biopsy from a captive female elephant seal at UCSC and samples of her diet. CG and MC conducted laboratory work for lipid analyses. SB provided all equipment, supplies, and methods for the lipid analyses, and contributed to the interpretation of lipid results. CG conducted QFASA modeling with consultative contributions from JB and SB. CG, JB, and SB developed the drop core prey analysis. CG conducted all other statistical analyses, and CG, MC, WW, and DC interpreted diet results. CG wrote the manuscript and all authors contributed to revisions. All authors gave final approval of the version to be published and agree to be accountable for all aspects of the work. The research presented in the manuscript was conducted as part of CG's doctoral work at UCSC.
Funding
This research was supported by grants to DC from the Office of Naval Research (N00014-13-1-0134 and N00014-10-1-0356), the OAGP Joint Industry Program, and the Tagging of Pacific Predators program funded by the Sloan, Packard and Moore Foundations. Research on the Oshoro-maru was supported by a grant to YM from the Japan Society for the Promotion of Science KAKENHI (23255001, 15H05709). CG was supported by a NSF Predoctoral Fellowship, a UC Regents Fellowship, the UCSC EEB Department, the Earl and Ethel Myers Oceanographic and Marine Biology Trust, the University of California Mildred E. Mathias UC Natural Reserves Graduate Student Research Grant, and the NSF GK-12 Program—SCWIBLES.
Conflict of Interest Statement
The authors declare that the research was conducted in the absence of any commercial or financial relationships that could be construed as a potential conflict of interest.
Acknowledgments
Many volunteers, technicians, post-docs, and graduate students contributed to this study, in particular P. Robinson, L. Hückstädt, M. Fowler, S. Peterson, L. Schwartz, R. Holser, K. Goetz, E. McHuron, S. Kienle, P. Morris, and R. Condit. We thank the crew, researchers, and students of the T/S Oshoro-Maru of Hokkaido University for their support during the cruise in 2012 and A. Fox and D. Mizuguchi for their assistance sorting, weighing, measuring, and homogenizing prey. C. Greene and C. Barry provided vital support in the processing and analysis of the blubber and prey samples. P. Raimondi, T. Tinker, E. Hazen, and S. Bograd provided invaluable input on study design and statistical analysis. We would like to thank Shiway Wang, the internal reviewer for USGS, and the three journal reviewers whose insightful comments and suggestions strengthened this manuscript. Any use of trade, firm, or product names is for descriptive purposes only and does not constitute endorsement by the U.S. Government.
Supplementary Material
The Supplementary Material for this article can be found online at: https://www.frontiersin.org/articles/10.3389/fmars.2018.00430/full#supplementary-material
Footnotes
1. ^R Core Team. R: A Language and Environment for Statistical Computing. Available online at: https://www.R-project.org.
References
Agostini, V. N., Francis, R. C. C., Hollowed, A. B., Pierce, S. D., Wilson, C., and Hendrix, A. N. (2006). The relationship between Pacific hake (Merluccius productus) distribution and poleward subsurface flow in the California Current System. Can. J. Fish. Aquat. Sci. 63, 2648–2659. doi: 10.1139/f06-139
Aitchison, J. (1986). The Statistical Analysis of Compositional Data. London, UK: Chapman and Hall, Ltd.
Antonelis, G. A., Fiscus, C. H., Stewart, B. S., and Delong, R. L. (1994). “Diet of the northern elephant seal,” in Elephant Seals: Population Ecology, Behavior, and Physiology, eds B. J. Le Beouf and R. M. Laws (Berkeley, CA: University of California Press), 211–223.
Antonelis, G. A., Lowry, M. S., DeMaster, D. P., and Fiscus, C. H. (1987). Assessing northern elephant seal feeding habits by stomach lavage. Mar. Mamm. Sci. 3, 308–322. doi: 10.1111/j.1748-7692.1987.tb00318.x
Banks, J., Lea, M. A., Wall, S., McMahon, C. R., and Hindell, M. A. (2014). Combining bio-logging and fatty acid signature analysis indicates spatio-temporal variation in the diet of the southern elephant seal, Mirounga leonina. J. Exp. Mar. Biol. Ecol. 450, 79–90. doi: 10.1016/j.jembe.2013.10.024
Benoit-Bird, K. J., and Lawson, G. L. (2016). Ecological insights from pelagic habitats acquired using active acoustic techniques. Annu. Rev. Mar. Sci. 8, 463–490. doi: 10.1146/annurev-marine-122414-034001
Benoit-Bird, K. J., Southall, B. L., and Moline, M. A. (2016). Predator-guided sampling reveals biotic structure in the bathypelagic. Proc. R. Soc. B 283:20152457. doi: 10.1098/rspb.2015.2457
Best, N. J., Bradshaw, C. J. A., Hindell, M. A., and Nichols, P. D. (2003). Vertical stratification of fatty acids in the blubber of southern elephant seals (Mirounga leonina): implications for diet analysis. Comp. Biochem. Physiol. B Biochem. Mol. Biol. 134, 253–263. doi: 10.1016/S1096-4959(02)00252-X
Boecklen, W. J., Yarnes, C. T., Cook, B. A., and James, A. C. (2011). On the use of stable isotopes in trophic ecology. Annu. Rev. Ecol. Evol. System. 42, 411–440. doi: 10.1146/annurev-ecolsys-102209-144726
Bowen, W. D. (2011). Reconstruction of pinniped diets: accounting for complete digestion of otoliths and cephalopod beaks. Can. J. Fish. Aquat. Sci. 57, 898–905. doi: 10.1139/f00-032
Bowen, W. D., and Iverson, S. J. (2012). Methods of estimating marine mammal diets: a review of validation experiments and sources of bias and uncertainty. Mar. Mamm. Sci. 29, 719–754. doi: 10.1111/j.1748-7692.2012.00604.x
Bradshaw, C. J. A., Hindell, M. A., Best, N. J., Phillips, K. L., Nichols, P. D., and Wilson, G. (2003). You are what you eat: describing the foraging ecology of southern elephant seals (Mirounga leonina) using blubber fatty acids. Proc. R. Soc. B 270, 1283–1292. doi: 10.1098/rspb.2003.2371
Brodeur, R. D., and Yamamura, O. (2005). Micronekton of the North Pacific: PICES Working Group 14 Final Report. North Pacific Marine Science Organization.
Bromaghin, J. F. (2015). Simulating realistic predator signatures in quantitative fatty acid signature analysis. Ecol. Inform. 30, 68–71. doi: 10.1016/j.ecoinf.2015.09.011
Bromaghin, J. F. (2017). qfasar: quantitative fatty acid signature analysis with R. Methods Ecol. Evol. 6, 1158–1162. doi: 10.1111/2041-210X.12740
Bromaghin, J. F., Budge, S. M., and Thiemann, G. W. (2016a). Should fatty acid signature proportions sum to 1 for diet estimation? Ecol. Res. 31, 597–606. doi: 10.1007/s11284-016-1357-8
Bromaghin, J. F., Budge, S. M., Thiemann, G. W., and Rode, K. D. (2016b). Assessing the robustness of quantitative fatty acid signature analysis to assumption violations. Methods Ecol. Evol. 7, 51–59. doi: 10.1111/2041-210X.12456
Bromaghin, J. F., Lance, M. M., Elliott, E. W., Jeffries, S. J., Acevedo-Gutierrez, A., and Kennish, J. M. (2013). New insights into the diets of harbor seals (Phoca vitulina) in the Salish Sea revealed by analysis of fatty acid signatures. Fish. Bull. 111, 13–26. doi: 10.7755/FB.111.1.2
Bromaghin, J. F., Rode, K. D., Budge, S. M., and Thiemann, G. W. (2015). Distance measures and optimization spaces in quantitative fatty acid signature analysis. Ecol. Evol. 5, 1249–1262. doi: 10.1002/ece3.1429
Budge, S. M., Cooper, M. H., and Iverson, S. J. (2004). Demonstration of the deposition and modification of dietary fatty acids in pinniped blubber using radiolabelled precursors. Physiol. Biochem. Zool. 77, 682–687. doi: 10.1086/420945
Budge, S. M., Iverson, S. J., Bowen, W. D., and Ackman, R. G. (2002). Among- and within-species variability in fatty acid signatures of marine fish and invertebrates on the Scotian Shelf, Georges Bank, and southern Gulf of St. Lawrence. Can. J. Fish. Aquat. Sci. 59, 886–898. doi: 10.1139/f02-062
Budge, S. M., Iverson, S. J., and Koopman, H. N. (2006). Studying trophic ecology in marine ecosystems using fatty acids: a primer on analysis and interpretation. Mar. Mamm. Sci. 22, 759–801. doi: 10.1111/j.1748-7692.2006.00079.x
Budge, S. M., Penney, S. N., Lall, S. P., and Trudel, M. (2012). Estimating diets of Atlantic salmon (Salmo salar) using fatty acid signature analyses; validation with controlled feeding studies. Can. J. Fish. Aquat. Sci. 69, 1033–1046. doi: 10.1139/f2012-039
Burford, B. P., Robison, B. H., and Sherlock, R. E. (2014). Behaviour and mimicry in the juvenile and subadult life stages of the mesopelagic squid Chiroteuthis calyx. J. Mar. Biol. Assoc. UK 95, 1221–1235. doi: 10.1017/S0025315414001763
Catul, V., Gauns, M., and Karuppasamy, P. K. (2011). A review on mesopelagic fishes belonging to family Myctophidae. Rev. Fish Biol. Fish. 21, 339–354. doi: 10.1007/s11160-010-9176-4
Charnov, E. L. (1976). Optimal foraging, the marginal value theorem. Theor. Popul. Biol. 9, 129–136.
Cherel, Y., Ducatez, S., Fontaine, C., Richard, P. R., and Guinet, C. (2008). Stable isotopes reveal the trophic position and mesopelagic fish diet of female southern elephant seals breeding on the Kerguelen Islands. Mar. Ecol. Prog. Ser. 370, 239–247. doi: 10.3354/meps07673
Choy, C. A., Portner, E., Iwane, M., and Drazen, J. C. (2013). Diets of five important predatory mesopelagic fishes of the central North Pacific. Mar. Ecol. Prog. Ser. 492, 169–184. doi: 10.3354/meps10518
Condit, R., and Le Boeuf, B. J. (1984). Feeding habits and feeding grounds of the northern elephant seal. J. Mammal. 65, 281–290. doi: 10.2307/1381167
Conners, M. G., Goetsch, C., Budge, S. M., Walker, W. A., Mitani, Y., Costa, D. P., et al. (2018). Fisheries exploitation by albatross quantified with lipid analysis. Front. Mar. Sci. 5:113. doi: 10.3389/fmars.2018.00113
Cooper, M. H., Iverson, S. J., and Rouvinen Watt, K. (2006). Metabolism of dietary cetoleic acid (22:1n-11) in mink (Mustela vison) and gray seals (Halichoerus grypus) studied using radiolabeled fatty acids. Physiol. Biochem. Zool. 79, 820–829. doi: 10.1086/505513
Crocker, D. E., Champagne, C. D., Fowler, M. A., and Houser, D. S. (2014). Adiposity and fat metabolism in lactating and fasting northern elephant seals. Adv. Nutr. 5, 57–64. doi: 10.3945/an.113.004663
Davis, R. W., Fuiman, L. A., Williams, T. M., Collier, S. O., Hagey, W. P., Kanatous, S. B., et al. (1999). Hunting behavior of a marine mammal beneath the antarctic fast ice. Science 283, 993–996. doi: 10.1126/science.283.5404.993
Davison, P., Lara-Lopez, A., and Koslow, A. J. (2015). Mesopelagic fish biomass in the southern California current ecosystem. Deep Sea Res. II Top. Stud. Oceanogr. 112, 129–142. doi: 10.1016/j.dsr2.2014.10.007
Drazen, J. C., and Sutton, T. T. (2017). Dining in the deep: the feeding ecology of deep-sea fishes. Annu. Rev. Mar. Sci. 9, 337–366. doi: 10.1146/annurev-marine-010816-060543
Folch, J., Lees, M., and Stanley, G. H. S. (1957). A simple method for the isolation and purification of total lipids from animal tissues. J. Biol. Chem. 226, 497–509.
Frost, B. W., and McCrone, L. E. (1979). Vertical distribution, diel vertical migration, and abundance of some mesopelagic fishes in the eastern Sub-arctic Pacific Ocean in summer. Fish. Bull. 76, 751–770.
Fukui, A., and Ozawa, T. (2004). Uncisudis posteropelvis, a new species of barracudina (Aulopiformes: Paralepididae) from the western North Pacific Ocean. Ichthyol. Res. 51, 289–294. doi: 10.1007/s10228-004-0229-3
Gallo-Reynoso, J. P., and Esperón-Rodríguez, M. (2013). Diet composition of the Guadalupe fur seal (Arctocephalus townsendi). Where and what do they eat? Mar. Freshw. Behav. Physiol. 46, 455–467. doi: 10.1080/10236244.2013.849400
Harry, R. R. (1953). Studies on the bathypelagic fishes of the Family Paralepididae (Order Iniomi). 2. A revision of the North Pacific species. Proc. Acad. Nat. Sci. Philad. 105, 169–230. doi: 10.2307/4064473
Harvey, J. T., and Antonelis, G. A. Jr. (1994). Biases associated with non-lethal methods of determining the diet of northern elephant seals. Mar. Mamm. Sci. 10, 178–187. doi: 10.1111/j.1748-7692.1994.tb00259.x
Harvey, J. T., Friend, T., and McHuron, E. A. (2013). Cephalopod remains from stomachs of sperm whales (Physeter macrocephalus) that mass-stranded along the Oregon coast. Mar. Mamm. Sci. 30, 609–625. doi: 10.1111/mms.12063
Haynes, T. B., Schmutz, J. A., Bromaghin, J. F., Iverson, S. J., Padula, V. M., and Rosenberger, A. E. (2015). Diet of yellow-billed loons (Gavia adamsii) in Arctic lakes during the nesting season inferred from fatty acid analysis. Polar Biol. 38, 1239–1247. doi: 10.1007/s00300-015-1690-3
Hobson, K. A., Schell, D. M., Renouf, D., and Noseworthy, E. (1996). Stable carbon and nitrogen isotopic fractionation between diet and tissues of captive seals: implications for dietary reconstructions involving marine mammals. Can. J. Fish. Aquat. Sci. 53, 528–533.
Hoving, H. J., Perez, J. A., Bolstad, K. S., Braid, H. E., Evans, A. B., Fuchs, D., et al. (2014). The study of deep-sea cephalopods. Adv. Mar. Biol. 67, 235–359. doi: 10.1016/B978-0-12-800287-2.00003-2
Hoving, H. J. T., Bush, S. L., and Robison, B. H. (2011). A shot in the dark: same-sex sexual behaviour in a deep-sea squid. Biol. Lett. 8, 287–290. doi: 10.1098/rsbl.2011.0680
Howey, L. A., Tolentino, E. R., Papastamatiou, Y. P., Brooks, E. J., Abercrombie, D. L., Watanabe, Y. Y., et al. (2016). Into the deep: the functionality of mesopelagic excursions by an oceanic apex predator. Ecol. Evol. 6, 5290–5304. doi: 10.1002/ece3.2260
Huey, L. M. (1930). Capture of an elephant seal off San Diego, California, with notes on stomach contents. J. Mammal. 11, 229–231. doi: 10.1093/jmammal/11.2.229-a
Irigoien, X., Klevjer, T. A., Røstad, A., Martinez, U., Boyra, G., Acuña, J. L., et al. (2014). Large mesopelagic fishes biomass and trophic efficiency in the open ocean. Nat. Commun. 5:3271. doi: 10.1038/ncomms4271
Iverson, S., Piché, J., and Blanchard, W. (2011). Hawaiian monk seals and their prey: Assessing characteristics of prey species fatty acid signatures and consequences for estimating monk seal diets using quantitative fatty acid signature analysis. U.S. Department of Commerce, NOAA Technical Memorandum, NOAA-TM-NMFS-PIFSC-23, 114 p. + Appendices.
Iverson, S. J., Field, C., Bowen, W. D., and Blanchard, W. (2004). Quantitative fatty acid signature analysis: a new method of estimating predator diets. Ecol. Monogr. 74, 211–235. doi: 10.1890/02-4105
Kaartvedt, S., Staby, A., and Aksnes, D. L. (2012). Efficient trawl avoidance by mesopelagic fishes causes large underestimation of their biomass. Mar. Ecol. Prog. Ser. 456, 1–6. doi: 10.3354/meps09785
Klevjer, T. A., Irigoien, X., Røstad, A., Fraile-Nuez, E., Benítez-Barrios, V. M., and Kaartvedt, S. (2016). Large scale patterns in vertical distribution and behaviour of mesopelagic scattering layers. Sci. Rep. 6:srep19873. doi: 10.1038/srep19873
Krause, D. J., Goebel, M. E., Marshall, G. J., and Abernathy, K. (2015). Novel foraging strategies observed in a growing leopard seal (Hydrurga leptonyx) population at Livingston Island, Antarctic Peninsula. Anim. Biotelemetry 3:24. doi: 10.1186/s40317-015-0059-2
LeBoeuf, B. J., Crocker, D. E., Costa, D. P., Blackwell, S. B., Webb, P. M., and Houser, D. S. (2000). Foraging ecology of northern elephant seals. Ecol. Monogr. 70, 353–382. doi: 10.2307/2657207
Lowry, M. S., Condit, R., Hatfield, B., Allen, S. G., Berger, R., Morris, P. A., et al. (2014). Abundance, distribution, and population growth of the northern elephant seal (Mirounga angustirostris) in the United States from 1991 to 2010. Aquat. Mamm. 40, 20–31. doi: 10.1046/j.1365-2656.2003.00685.x/full
MacLeod, C. D., Santos, M. B., and Pierce, G. J. (2003). Review of data on diets of beaked whales: evidence of niche separation and geographic segregation. J. Mar. Biol. Assoc. UK 83, 651–665. doi: 10.1017/S0025315403007616h
Maresh, J. L. (2014). Bioenergetics of Marine Mammals: The Influence of Body Size, Reproductive Status, Locomotion, and Phylogeny on Metabolism. Dissertations, University of California, Santa Cruz.
Maresh, J. L., Adachi, T., Takahashi, A., Naito, Y., Crocker, D. E., Horning, M., et al. (2015). Summing the strokes: energy economy in northern elephant seals during large-scale foraging migrations. Mov. Ecol. 2015 3:22. doi: 10.1186/s40462-015-0049-2
Meynier, L., Morel, P. C. H., Chilvers, B. L., Mackenzie, D. D. S., and Duignan, P. J. (2010). Quantitative fatty acid signature analysis on New Zealand sea lions: model sensitivity and diet estimates. J. Mammal. 91, 1484–1495. doi: 10.1644/09-MAMM-A-299.1
Naito, Y., Costa, D. P., Adachi, T., Robinson, P. W., Fowler, M., and Takahashi, A. (2013). Unravelling the mysteries of a mesopelagic diet: a large apex predator specializes on small prey. Funct. Ecol. 27, 710–717. doi: 10.1111/1365-2435.12083
Naito, Y., Costa, D. P., Adachi, T., Robinson, P. W., Peterson, S. H., Mitani, Y., et al. (2017). Oxygen minimum zone: an important oceanographic habitat for deep-diving northern elephant seals, Mirounga angustirostris. Ecol. Evol. 132, 6259–6270. doi: 10.1002/ece3.3202
Newsome, S. D., Clementz, M. T., and Koch, P. L. (2010). Using stable isotope biogeochemistry to study marine mammal ecology. Mar. Mamm. Sci. 26, 509–572. doi: 10.1111/j.1748-7692.2009.00354.x
Ohizumi, H., Isoda, T., Kishiro, T., and Kato, H. (2003). Feeding habits of Baird's beaked whale Berardius bairdii, in the western North Pacific and Sea of Okhotsk off Japan. Fish. Sci. 69, 11–20. doi: 10.1046/j.1444-2906.2003.00582.x
Phillips, D. L., Inger, R., Bearhop, S., Jackson, A. L., Moore, J. W., Parnell, A. C., et al. (2014). Best practices for use of stable isotope mixing models in food-web studies. Can. J. Zool. Rev. Can. Zool. 92, 823–835. doi: 10.1139/cjz-2014-0127
Phillips, K. L., Nichols, P. D., and Jackson, G. D. (2002). Lipid and fatty acid composition of the mantle and digestive gland of four Southern Ocean squid species: implications for food-web studies. Antarct. Sci. 14, 212–220. doi: 10.1017/s0954102002000044
Piché, J., Iverson, S. J., Parrish, F., and Dollar, R. (2010). Characterization of forage fish and invertebrates in the Northwestern Hawaiian Islands using fatty acid signatures: species and ecological groups. Mar. Ecol. Prog. Ser. 418, 1–15. doi: 10.3354/meps08814
Priede, I. G. (2017). Deep-Sea Fishes: Biology, Diversity, Ecology and Fisheries. Cambridge, UK: Cambridge University Press.
Proud, R., Cox, M. J., Le Guen, C., and Brierley, A. S. (2018). Fine-scale depth structure of pelagic communities throughout the global ocean based on acoustic sound scattering layers. Mar. Ecol. Progr. Ser. 598, 35–48. doi: 10.3354/meps12612
Ramos, R., and González-Solís, J. (2012). Trace me if you can: the use of intrinsic biogeochemical markers in marine top predators. Front. Ecol. Environ. 10, 258–266. doi: 10.1890/110140
Robinson, P. W., Costa, D. P., Crocker, D. E., Gallo-Reynoso, J. P., Champagne, C. D., Fowler, M. A., et al. (2012). Foraging behavior and success of a mesopelagic predator in the northeast pacific ocean: insights from a data-rich species, the Northern Elephant seal. PLoS ONE 7:e36728. doi: 10.1371/journal.pone.0036728
Roper, C. F. E., and Young, R. E. (1975). Vertical Distribution of Pelagic Cephalopods. Washington, DC: Smithsonian Institution Press.
Rosen, D. A. S., and Tollit, D. J. (2012). Effects of phylogeny and prey type on fatty acid calibration coefficients in three pinniped species: implications for the QFASA dietary quantification technique. Mar. Ecol. Prog. Ser. 467, 263–276. doi: 10.3354/meps09934
Saijo, D., Mitani, Y., Abe, T., Sasaki, H., Goetsch, C., Costa, D. P., et al. (2017). Linking mesopelagic prey abundance and distribution to the foraging behavior of a deep-diving predator, the northern elephant seal. Deep Sea Res. II Top. Stud. Oceanogr. 140, 163–170. doi: 10.1016/j.dsr2.2016.11.007
Sinclair, E. H. (1994). Prey of juvenile northern elephant seals (Mirounga angustirostris) in the Southern California Bight. Mar. Mamm. Sci. 10, 230–239. doi: 10.1111/j.1748-7692.1994.tb00267.x
Sinclair, E. H., Walker, W. A., and Thomason, J. R. (2015). Body size regression formulae, proximate composition and energy density of eastern bering sea mesopelagic fish and squid. PLoS ONE 10:e0132289. doi: 10.1371/journal.pone.0132289
Spitz, J., Mourocq, E., Schoen, V., and Ridoux, V. (2010). Proximate composition and energy content of forage species from the Bay of Biscay: high- or low-quality food? ICES J. Mar. Sci. 67, 909–915. doi: 10.1093/icesjms/fsq008
St John, M. A., Borja, A., Chust, G., Heath, M., Grigorov, I., Mariani, P., et al. (2016). A dark hole in our understanding of marine ecosystems and their services: perspectives from the mesopelagic community. Front. Mar. Sci. 3:31. doi: 10.3389/fmars.2016.00031
Staniland, I. J., Taylor, R. I., and Boyd, I. L. (2003). An enema method for obtaining fecal material from known individual seals on land. Mar. Mamm. Sci. 19, 363–370. doi: 10.1111/j.1748-7692.2003.tb01114.x
Strandberg, U., Kakela, A., Lydersen, C., Kovacs, K. M., Grahl-Nielsen, O., Hyvärinen, H., et al. (2008). Stratification, composition, and function of marine mammal blubber: the ecology of fatty acids in marine mammals. Physiol. Biochem. Zool. 81, 473–485. doi: 10.1086/589108
Sutton, T. T. (2013). Vertical ecology of the pelagic ocean: classical patterns and new perspectives. J. Fish Biol. 83, 1508–1527. doi: 10.1111/jfb.12263
Sutton, T. T., Clark, M. R., Dunn, D. C., Halpin, P. N., Rogers, A. D., Guinotte, J., et al. (2017). A global biogeographic classification of the mesopelagic zone. Deep Sea Res. I Oceanogr. Res. Papers 126, 85–102. doi: 10.1016/j.dsr.2017.05.006
Thiemann, G. W., Iverson, S. J., and Stirling, I. (2008). Polar bear diets and arctic marine food webs: insights from fatty acid analysis. Ecol. Monogr. 78, 591–613. doi: 10.1890/07-1050.1
Tollit, D. J., Schulze, A. D., Trites, A. W., Olesiuk, P. F., Crockford, S. J., Gelatt, T. S., et al. (2009). Development and application of DNA techniques for validating and improving pinniped diet estimates. Ecol. Appl. 19, 889–905. doi: 10.1890/07-1701.1
Tucker, S., Bowen, W. D., Iverson, S. J., Blanchard, W., and Stenson, G. B. (2009). Sources of variation in diets of harp and hooded seals estimated from quantitative fatty acid signature analysis (QFASA). Mar. Ecol. Prog. Ser. 384, 287–302. doi: 10.3354/meps08000
Volpov, B. L., Hoskins, A. J., Battaile, B. C., Viviant, M., Wheatley, K. E., Marshall, G., et al. (2015). Identification of prey captures in australian fur seals (Arctocephalus pusillus doriferus) using head-mounted accelerometers: field validation with animal-borne video cameras. PLoS ONE 10, 1–19. doi: 10.1371/journal.pone.0128789
Walker, W. A., Mead, J. G., and Brownell, R. L. (2002). Diets of Baird's beaked whales, Berardius bairdii, in the southern Sea of Okhotsk and off the Pacific coast of Honshu, Japan. Mar. Mamm. Sci. 18, 902–919. doi: 10.1111/j.1748-7692.2002.tb01081.x
Watanabe, H., Moku, M., Kawaguchi, K., Ishimaru, K., and Ohno, A. (1999). Diel vertical migration of myctophid fishes (Family Myctophidae) in the transitional waters of the western North Pacific. Fish. Oceanogr. 8, 115–127. doi: 10.1046/j.1365-2419.1999.00103.x
Keywords: lipid, biochemical diet analysis, QFASA, Mirounga angustirostris, northern elephant seal, mesopelagic food web, food habits, deep scattering layer
Citation: Goetsch C, Conners MG, Budge SM, Mitani Y, Walker WA, Bromaghin JF, Simmons SE, Reichmuth C and Costa DP (2018) Energy-Rich Mesopelagic Fishes Revealed as a Critical Prey Resource for a Deep-Diving Predator Using Quantitative Fatty Acid Signature Analysis. Front. Mar. Sci. 5:430. doi: 10.3389/fmars.2018.00430
Received: 11 June 2018; Accepted: 29 October 2018;
Published: 20 November 2018.
Edited by:
Mark Meekan, Australian Institute of Marine Science (AIMS), AustraliaReviewed by:
Rowan Trebilco, Antarctic Climate and Ecosystems Cooperative Research Centre, AustraliaAndrea Walters, University of Tasmania, Australia
Clive Reginald McMahon, Sydney Institute of Marine Science, Australia
Copyright © 2018 Goetsch, Conners, Budge, Mitani, Walker, Bromaghin, Simmons, Reichmuth and Costa. This is an open-access article distributed under the terms of the Creative Commons Attribution License (CC BY). The use, distribution or reproduction in other forums is permitted, provided the original author(s) and the copyright owner(s) are credited and that the original publication in this journal is cited, in accordance with accepted academic practice. No use, distribution or reproduction is permitted which does not comply with these terms.
*Correspondence: Chandra Goetsch, chandra.goetsch@gmail.com