Assessing the Effects of WFD Nutrient Reductions Within an OSPAR Frame Using Trans-boundary Nutrient Modeling
 Hermann-Josef Lenhart
 Fabian Große
- 1Scientific Computing, Department of Informatics, Universität Hamburg, Hamburg, Germany
- 2Department of Oceanography, Dalhousie University, Halifax, NS, Canada
The reduction of riverine nutrients inputs is considered the means of choice to improve the eutrophication status of the southern North Sea. With the European Union's Water Framework Directive (WFD) reduction measures presently under debate, two questions arise: (1) What changes in eutrophication indicators can be expected? (2) How do the reductions by the individual member states contribute to these? We combine an element tracing method (TBNT) with a biogeochemical model to analyze the effects of WFD-compliant nitrogen reductions proposed by OSPAR's North Sea member states. We first analyze changes in selected OSPAR assessment parameters relative to a reference simulation. Second, we quantify the source-specific contributions to total nitrogen (TN) in different regions. An overall nitrogen load reduction of 14 % is achieved. However, the response shows significant spatial variations due to strong differences between the countries' load reductions. TN and dissolved inorganic nitrogen reductions up to 60 % and 35 % are simulated near the Bay of Seine (France) and in the German Bight, respectively. Along the Dutch coast, reductions are below 10 %, and no changes occur along the British coast. Reductions in chlorophyll-a are generally lower. The TBNT analysis for the German Exclusive Economic Zone shows a TN reduction in the coastal region comparable to the N reductions in the German rivers (~25 %). In the offshore region, TN is reduced by only 6 % due to the strong influence of riverine sources with only low reductions and non-riverine sources. Our analysis reveals that non-linear responses in the biogeochemistry cause a faster removal of N from rivers with strong reductions by benthic denitrification, which enhances indirectly the removal of N from less reduced sources. Consequently, reductions in remote sources in non-problem areas can have a relevant positive effect on problem areas. This demonstrates that the TBNT method is an ideal tool to put in practice the “source-oriented approach” advocated by OSPAR, and to inform stakeholders about the effects of defined reduction strategies. However, an assessment framework is required to efficiently use it in management and for decision making, either by OSPAR, or in the context of WFD or Marine Strategy Framework Directive.
1. Introduction
Eutrophication, i.e., the “increase in the rate of supply of organic matter to an ecosystem” (Nixon, 1995), has been and still is an ongoing problem in the North Sea ecosystem, primarily driven by excess riverine nutrient loads. Its negative impact on the marine environment was first observed in the 1980s in the form of low oxygen conditions (Rachor and Albrecht, 1983; von Westernhagen and Dethlefsen, 1983), and later linked to high riverine nutrients (Brockmann and Eberlein, 1986; Brockmann et al., 1988; Peeters et al., 1995). As a result of this period of severe eutrophication, the ministers of environment decided on the 2nd International Conference on the Protection of the North Sea (ICNS-2) in 1987 to “reduce the river nutrient loads of phosphorus and nitrogen by 50 %” between 1985 and 1995 to mitigate the negative effects of eutrophication (ICNS-2, 1988). However, this goal has only been reached for phosphorus (P), but not for nitrogen (N) (Claussen et al., 2009; Lenhart et al., 2010), and several recent studies on oxygen in the North Sea provide evidence that eutrophication still is an important issue (Greenwood et al., 2010; Topcu and Brockmann, 2015; Große et al., 2016, 2017; Queste et al., 2016).
Since then, OSPAR, as the regional sea convention for the North-East Atlantic (www.ospar.org), has regularly assessed the eutrophication status of the North Sea applying its Common Procedure (COMP; OSPAR, 2003, 2005, 2013). The COMP assessment distinguishes between different categories of eutrophication indicators that describe (I) the “degree of nutrient enrichment,” (II) “direct effects” (e.g., algal blooms) and (III) “indirect effects of nutrient enrichment” (e.g., oxygen deficiency), and (IV) “other effects of nutrient enrichment” (e.g., algal toxins). In practice, the COMP is based on thresholds defined for different key parameters, such as winter concentrations of dissolved inorganic N (DIN; category I indicator) or summer surface chlorophyll-a (Chl-a; category II) (Claussen et al., 2009; OSPAR, 2017). Unfortunately, even the latest COMP report shows only limited improvement over the years (OSPAR, 2017). It identifies large parts of the southern North Sea between the Belgian and Danish coasts as so-called “problem areas” or “potential problem areas,” while only small regions along the French and British coasts are characterized as such.
With the aim to better understand what improvements in the eutrophication status could be achieved and in what timeframe, the OSPAR “Intersessional Correspondence Group for Ecosystem Modeling” (ICG-EMO) was established in 2005. Its assigned task is the application of marine ecosystem models to foster the understanding of the North Sea ecosystem dynamics and to assess the measures that are required to improve the eutrophication status of the North Sea.
Following different objectives defined by OSPAR, ICG-EMO conducted a series of model intercomparisons on nutrient reduction targets (Lenhart et al., 2010; OSPAR, 2010, 2013). This approach proved to be very beneficial for both scientists and OSPAR. On the one hand, it led to the first application of the OSPAR assessment parameters to model results of both a present state simulation and a reduction scenario to provide insight in potential future changes under nutrient reductions (Almroth and Skogen, 2010; Lenhart et al., 2010; OSPAR, 2013). On the other hand, the modeling community could identify and report inconsistencies within the nationally oriented OSPAR thresholds for the different assessment parameters (OSPAR, 2013), and it provided quantitative information on the nutrient reductions required to reach a North Sea free of problem areas (Los et al., 2014).
In 2000, the European Commission put into practice the Water Framework Directive (WFD; EU, 2000) with the goal to reach a “Good Ecological Status” (GES) in all water bodies of the member states. Since this directive was mainly focused on catchments, with only small assessment areas along the coast, it was extended toward the marine environment by the Marine Strategy Framework Directive (MSFD) in 2008 (EU, 2008). Hence, the WFD and the MSFD constitute legislative frameworks to combat eutrophication in European seas, including the North Sea, which is in line with the objective of OSPAR.
The latest assignment of OSPAR to ICG-EMO was to assess the impact of the different nutrient reduction measures defined in the individual national WFD programs. It was based on the fact, that most Contracting Parties had management plans in relation to their WFD programs available. However, these management plans are designed to combat eutrophication in the different countries' own Exclusive Economic Zones (EEZ). In order to address these management plans, Contracting Parties were asked to submit their WFD programs of measures to the OSPAR Hazardous Substances and Eutrophication Committee (HASEC). From these national WFD programs the reduction levels for nitrogen loads were extracted for the individual rivers entering the North Sea (OSPAR, 2016), which constitute the basis for the ICG-EMO modeling study. At the current stage, these programs only consider reductions in riverine N loads.
In this study, we aim to fulfill the “source-oriented approach” advocated by OSPAR (1999) in the context of these N reductions. For this purpose, we (1) quantify the changes in selected OSPAR assessment parameters in response to the WFD-compliant N reductions; (2) link these changes to the individual national measures and quantify their impact; and (3) identify changes in the N cycle induced by these measures.
In order to address these objectives, we conduct a WFD-compliant reduction scenario using a physical-biogeochemical model of the North Sea and compare the results to a reference simulation. In addition, we apply an active element tracing method (Ménesguen and Hoch, 1997) to the N dynamics of both simulations. This method—often referred to as “Trans-Boundary Nutrient Transports” (TBNT; Blauw et al., 2006; OSPAR, 2010)–allows for the tracing of elements from individual sources through all physical and biogeochemical processes, and thus provides quantitative information on the influence of these sources on the N dynamics in the different North Sea regions. A comparative analysis of the TBNT results of the WFD reduction scenario vs. the reference simulation allows us to quantify the changes induced by the different N reductions on both OSPAR key parameters and the N cycle in the North Sea.
2. Materials and Methods
In this section, we first provide a brief description of the physical-biogeochemical model HAMSOM-ECOHAM, followed by a brief theoretical background of the TBNT method applied to the model. Finally, we provide a detailed description of the model and TBNT setup including the WFD reduction scenario.
2.1. The HAMSOM-ECOHAM Model
Our study is based on a three-dimensional (3D) model consisting of the physical model HAMSOM (HAMburg Shelf Ocean Model; Backhaus, 1985; Pohlmann, 1991, 1996) and the biogeochemical model ECOHAM (ECOsystem model, HAMburg; Pätsch and Kühn, 2008; Kühn et al., 2010; Lorkowski et al., 2012; Große et al., 2016).
The physical model HAMSOM (Backhaus, 1985) is a baroclinic, primitive equation model using the hydrostatic and Boussinesq approximation (Pohlmann, 1991). The current velocities are calculated using the component-upstream scheme. The horizontal dimensions are discretized on a staggered Arakawa C-grid (Arakawa and Lamb, 1977) and z-coordinates are applied to the vertical. HAMSOM calculates the 3D fields of advective flow, vertical turbulent mixing, temperature and salinity, which are used as forcing for ECOHAM. A detailed description of HAMSOM is provided by Pohlmann (1991, 2006), Chen et al. (2013), and Mathis and Pohlmann (2014).
The biogeochemical model ECOHAM (Pätsch and Kühn, 2008; Lorkowski et al., 2012; Große et al., 2016) represents the pelagic and benthic cycles of carbon (C), nitrogen (N), phosphorus (P), silicon (Si), and oxygen (O2). The model includes all parameter groups of an NPZD-type model (nutrients-phytoplankton-zooplankton-detritus) that cover the lower trophic level dynamics. It describes four inorganic nutrients (nitrate, ammonium, phosphate, and silicate), dissolved inorganic C, two phytoplankton (diatoms and flagellates) and two zooplankton groups (micro- and mesozooplankton), and slowly and fast sinking detritus. The “microbial loop” (Azam et al., 1983) is represented by further including labile and semi-labile dissolved organic matter (DOM) and bacteria. For phytoplankton, zooplankton and bacteria individual but fixed C:N:P ratios are applied. For detritus and labile DOM, the C:N:P ratios can evolve freely. In ECOHAM, Chl-a concentrations are derived from C bound in phytoplankton according to the empirical relationship of Cloern et al. (1995). The self-shading effect of phytoplankton on the light climate is implemented and depends on the Chl-a concentration using an attenuation coefficient of 0.02 m2 (mg Chl-a)−1.
The sediment is described by a simple zero-dimensional module (Pätsch and Kühn, 2008). Benthic remineralization follows a first-order approach inhibiting year-to-year accumulation of organic matter (Große et al., 2016). The released dissolved inorganic matter is returned directly into the deepest pelagic layer. Different remineralization rates are applied to organic C, N, P, and Si (opal), resulting in different delays for the release into the pelagic. Benthic denitrification is linked to benthic O2 consumption following Seitzinger and Giblin (1996), and reducing the O2 concentration in the deepest pelagic layer. Explicit benthic nitrification and benthic anammox are not implemented (Pätsch and Kühn, 2008). The ECOHAM version applied for this study is identical to that used by Große et al. (2016, 2017). Lorkowski et al. (2012) provide a full description of the ECOHAM model equations and parameter settings.
2.2. The TBNT Method
The element tracing method applied in this study is based on the work by Ménesguen and Hoch (1997), who describe that any selected property (e.g., the source of a N element brought into an ecosystem) can be traced throughout all physical and biogeochemical processes represented by the applied model. Since then, several modeling studies made use of this method with various research objectives (e.g., Wijsman et al., 2004; Blauw et al., 2006; Ménesguen et al., 2006; Lacroix et al., 2007; Neumann, 2007; Timmermann et al., 2010; Troost et al., 2013; Radtke and Maar, 2016), demonstrating the versatility of this method. In the meantime, the term “Trans-Boundary Nutrient Transports” (TBNT) was established (Blauw et al., 2006; OSPAR, 2010) and is used in particular within the OSPAR frame.
Conceptually, the TBNT method labels all matter, which contains a selected chemical element (e.g., N), according to its source when it enters the ecosystem under consideration. Technically, this implies the introduction of an additional set of model state variables and related processes, as all state variables containing the selected element need to be labeled. The physical and biochemical processes working on the labeled state variables are the same as for the overall state variables, i.e., the total amount of labeled and unlabeled material, however, proportional to their relative contribution to this overall amount. Following Große et al. (2017), the temporal evolution of the concentration of a labeled state variable Xi can be calculated as:
Here, and CX represent the concentrations of the fraction of state variable X originating from the i-th input source and that of the corresponding bulk state variable, respectively. The diffusive transport is calculated according to Fick's first law, with the second-order diffusion tensor . In the advective transport term, represents the 3D velocity vector. RCX represents the change in concentration of X due to the sources and sinks (i.e., biogeochemical processes, input from external sources). The index Xcon in the fraction of this term indicates that the relative contribution of the state variable that is consumed by a biogeochemical process is used.
For n individually labeled input sources (i.e., i = 1, 2, …, n−1, n), the concentration of each bulk state variable X at each location and point in time equals the sum of the concentrations of its n contributing fractions:
2.3. Study Setup
2.3.1. Model Setup and Nitrogen Reduction Scenario
The model and TBNT setup for this study is identical to that used by Große et al. (2017), hence, we only describe its main aspects. The HAMSOM-ECOHAM model is set up for a domain encompassing the entire North Sea, large parts of the northwestern European continental shelf and parts of the adjacent Northeast Atlantic (Figure 1). The horizontal resolution is 1/5° with 82 grid points in latitudinal direction and 1/3° with 88 grid points in longitudinal direction. The vertical dimension with a maximum depth of 4,000 m is resolved by 31 z-layers with a surface layer of 10 m thickness. Between 10 and 50 m depth, the vertical resolution is 5 m. Below 50 m, the layer thicknesses successively increase with depth.
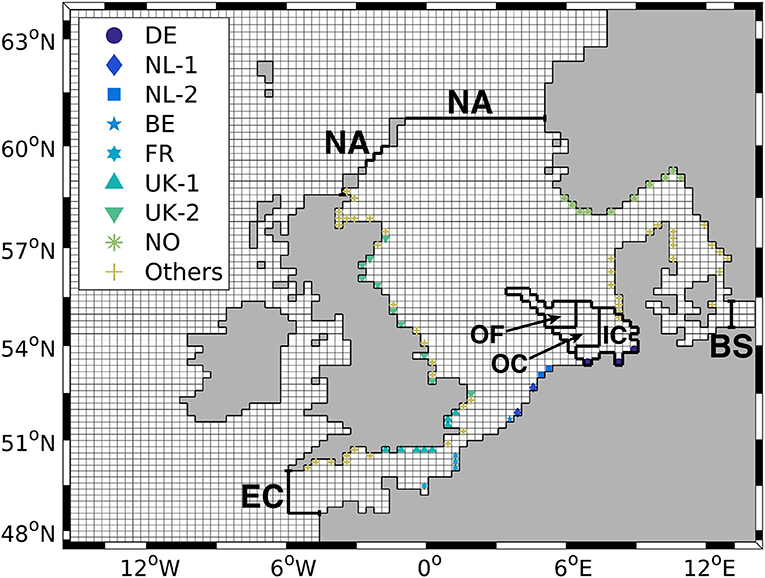
Figure 1. ECOHAM model grid and TBNT sub-domain defined by the three outer boundaries: North Atlantic (NA), English Channel (EC), and Baltic Sea (BS). The different markers indicate the different river groups: German (DE), Dutch (NL-1/NL-2), Belgian (BE), French (FR), British (UK-1/UK-2), Norwegian (NO) and other rivers (“Others”). The sub-regions of the German EEZ used for analysis are: “Inner Coastal (IC),” “Outer Coastal (OC),” and “Offshore (OF).” Adapted from Große et al. (2017), with permission of the copyright holders.
We first run the HAMSOM model for the period 1977–2014 using 6-hourly information for air temperature, cloud coverage, relative humidity, wind speed and direction derived from NCEP/NCAR reanalysis data (Kalnay et al., 1996; Kistler et al., 2001). Daily freshwater run-off data for 254 rivers are provided by Sonja van Leeuwen (pers. comm.) and represent an updated dataset of that used by Lenhart et al. (2010) covering the entire simulation period. Monthly climatologies of sea temperature and salinity based on the World Ocean Atlas 2001 (Conkright et al., 2002) are used for initialization and at the open boundaries. The HAMSOM simulation is carried out with a 10 min time step, and output is stored on a daily interval.
In order to analyze the effects of the WFD-compliant riverine N reductions on the North Sea, we run two different ECOHAM simulations using the same physical forcing produced by HAMSOM. The first simulation runs for the period 1977–2014 using realistic forcing (hereafter “reference”). We provide daily nutrient loads based on the same dataset as the freshwater discharge (see Große et al. (2017) for details). Annual average rates of atmospheric deposition of NOx and NH3 are derived from data from the EMEP (Cooperative program for monitoring and evaluation of the long-range transmissions of air pollutants in Europe) model and long-term trends (Schöpp et al., 2003) as described in Große et al. (2016). A daily climatology of suspended particulate matter (Heath et al., 2002) is used to include its influence on the light climate.
For the second simulation [hereafter “WFD (reduction) scenario”], we apply the same forcing as described above, except for the riverine N loads. For the latter, reduction levels are derived based on the responses to a questionnaire sent off to the OSPAR contracting parties and asking how they want to fulfill the WFD requirement described within their national management plans. Some contracting parties reported reduction targets for both N and P, like France stating that “a strong nitrate reduction (about 50 %) should be necessary in many rivers, whereas phosphate should be significantly reduced (about 40 %) only in the Seine River”. However, the current OSPAR assignment–as a first step–focuses on N reductions alone in order to allow for a stepwise approach, including feedback between the modeling community and OSPAR based on the first model results. This approach is supported by Emeis et al. (2015), who found that the N:P ratio in the Rhine River loads had increased from 23 to 62 between 1980 and 1992 due to the significant reductions in P but not in N (Claussen et al., 2009). This implies that future reduction measures should focus on N. Similarly, Lenhart et al. (2010) found that additional reductions in P are required only in the British rivers in order to achieve a 50 % reduction of P relative to the 1985 river loads (ICNS-2, 1988) by 2002. Therefore, further P reductions are considered a secondary objective within OSPAR. Consequently, this study focuses on the implementation of WFD-compliant riverine N load reductions. For the implementation of these reductions into the ECOHAM model, reductions for all affected N state variables need to be defined.
In its response to the questionnaire, Germany did not provide a percentage reduction but a target concentration of total nitrogen (TN), which implies reductions in both DIN and particulate organic N (PON). For the sake of consistency, this implies that PON reductions need to be applied to the rivers of the other contracting parties as well. Based on the assumption that reductions in DIN in the river basin will also result in reductions in PON, we use the same reduction as for DIN in these cases.
France and Belgium referred to the model results of the EMoSEM project (Desmit et al., 2015a, 2018), which combined hydrological and marine ecosystem models, and adopted DIN reductions of 50 % and 37 %, respectively. The Netherlands adopted a DIN reduction of 5 % based on a report from the Rhine Commission (ICBR, 2015), which takes into account the entire catchment and different types of N sources (e.g., agriculture or waste water) in the Rhine's neighboring countries. The United Kingdom did not adopt any N reduction, as they have only small localized “problem areas” in a few harbors and estuaries (OSPAR, 2017), and the effect of potential targeted reductions that address these sites could not be quantified.
The German “Bund–Länder Messprogramm” (BLMP, 2011) provided a target concentration for TN of 2.8 mg N L−1 at the limnic-marine boundary for all German rivers entering the North Sea. In order to calculate the individual reductions in DIN and PON, we calculate the average DIN:PON ratios for the individual German rivers during the period 2006–2012, as agreed on with stakeholders from the German Federal Environmental Agency, using the above described daily river dataset. With that, we translate the TN target concentration into target concentrations for DIN and PON and calculate the reduction levels based on their 2006–2012 average concentrations, following Kerimoglu et al. (2018). As DIN:PON ratios vary between the different German rivers and throughout the seasonal cycle, we obtain different reductions levels for these rivers as well as for DIN and PON. The combined N reduction in the German rivers results in 28.5 %.
The resulting DIN and PON reductions for all contracting parties are provided in Table 1. It should be noted that these DIN reduction levels were presented on the HASEC meeting 2016 in Cork/Ireland and found the approval to be used as the basis for the ICG-EMO modeling activities related to the WFD measures. The PON reduction levels were presented on the HASEC meeting 2017, without approval nor rejection. For consistency among the different contracting parties we use both the DIN and the PON reductions in our scenario.
Table 1. DIN and PON reduction levels for the WFD reduction scenario.
For the WFD reduction scenario, we only simulate the period 2000–2014, initialized with the results for January 1st, 2000, of the reference simulation. Both simulations run with a time step of 30 min and output is stored on a daily basis.
2.3.2. TBNT Setup
In this study, we use the same TBNT post-processing software and setup as in Große et al. (2017), which showed good agreement with other TBNT studies (OSPAR, 2010; Painting et al., 2013; Troost et al., 2013). The full ECOHAM model domain is shown in Figure 1. The N tracing is conducted inside a sub-domain, which is limited by the North Atlantic (NA) in the North, the English Channel (EC) in the Southwest and the Baltic Sea (BS) in the East (hereafter referred to as “TBNT domain”). Any N state variable that enters the TBNT domain across one of these boundaries is labeled accordingly during the calculation. This implies that N from rivers outside of the TBNT domain, which subsequently enters this domain, is attributed to the corresponding boundary. For the rivers inside the TBNT domain, we define 8 different source groups according to the standard adopted by the ICG-EMO community (ICG-EMO, 2009). All remaining rivers not included in these river groups are collected in a group of “other rivers”. The input locations of the different river groups are indicated by the different markers in Figure 1. A detailed list of the individual rivers in each group is provided in Table 1 in Große et al. (2017). In addition, we trace the N inputs by atmospheric deposition into the TBNT domain.
The TBNT analysis is conducted for both the reference simulation and the WFD reduction scenario, using the daily ECOHAM output for the N cycle. For the analysis of the reference simulation, we apply a 7-year spin-up by re-running the year 1999. For each iteration, we use the ECOHAM output for the N cycle in 1999. The first iteration starts from an initial distribution with all mass attributed to the “other” rivers, while the following iterations start from the final distributions of the source-specific relative contributions of the previous iteration. With this procedure we achieve a quasi-steady state representing realistic distributions of the source-specific state variables within the TBNT domain at the beginning of the year 2000 (Große et al., 2017). Since the results at the end of the 7th iteration are qualitatively the same as those at the end of the 6th iteration, it can be concluded that a 6-year spin-up is sufficient to reach a quasi-steady state, independent of the the initial distribution. The resulting final distributions of the reference simulation are also used as initialization for the TBNT analysis of the WFD reduction scenario. For both simulations, we run the TBNT software for the years 2000–2014 and use the years 2006–2014 for our analysis. This guarantees sufficient time for the model system to reach a new quasi-steady state under the reduced riverine N loads. In addition, this analysis period corresponds to the latest OSPAR assessment period (OSPAR, 2017; Brockmann et al., 2018).
3. Results
In the following, we first provide an overview of the effects of the WFD-compliant reductions on the actual riverine N loads, and second, how these reduced N loads effect the marine environment with respect to key parameters used within the OSPAR assessment of the eutrophication status. Thereafter, we present the results of the TBNT analyses of the two simulations with a special focus on the changes in the German EEZ, and on how the individual N reductions affect the N dynamics in the North Sea in general.
3.1. Changes in Riverine Nitrogen Loads Under a WFD-Compliant Riverine N Reduction
As a result of the strong N reductions in some of the North Sea tributaries (see Table 1) a significant overall reduction in riverine N loads into the North Sea can be expected. However, the strong differences between the reductions in the individual countries likely also result in changes in their relative contributions. In order to analyze both, Figure 2A presents the time series of annual riverine TN input into the model domain inside (solid lines) and outside of the TBNT domain (dotted line). In addition, we show the relative contributions of the individual river groups to the TN input into the TBNT domain for both the reference simulation and the WFD reduction scenario (Figures 2B,C, respectively).
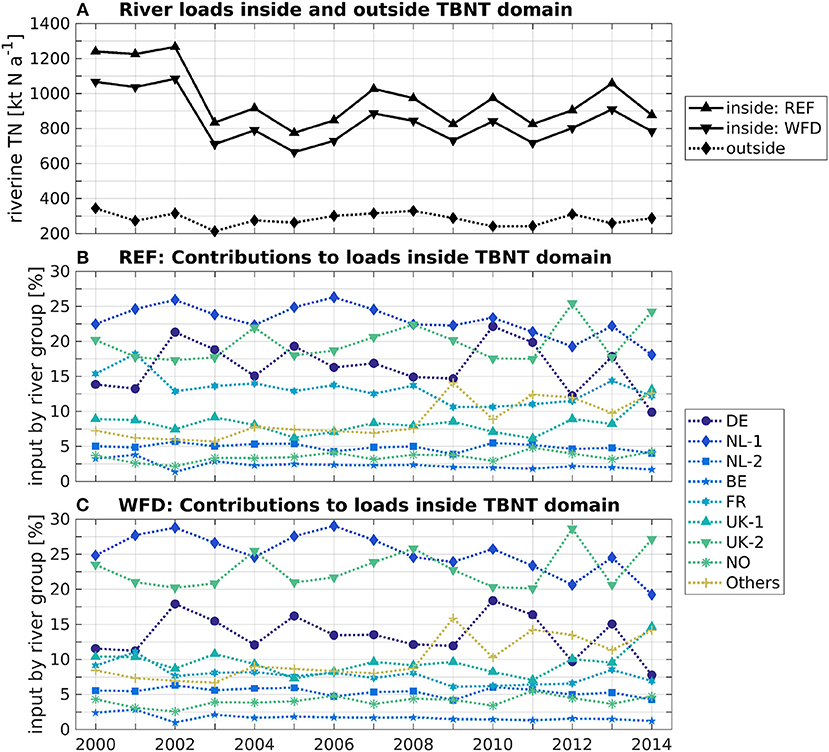
Figure 2. Time series of (A) overall riverine TN input into the model domain inside (solid lines; for reference (“REF”) and WFD scenario) and outside the TBNT domain (dotted line), and the relative contributions from the different sources to the loads inside the TBNT domain for (B) the reference simulation and (C) the WFD reduction scenario.
In the reference run, the riverine TN input into the TBNT domain shows values of about 1,200–1,300 kt TN a−1 from 2000 to 2002, before it drops to values of about 800–1,000 kt TN a−1 during the period after 2002 (see Figure 2). In the WFD reduction scenario, the overall river input into the TBNT domain ranges between 700 and 900 kt TN a−1 after 2002, which corresponds to an overall reduction of 14 % (excl. loads outside the TBNT domain).
The riverine N input into the region outside the TBNT domain does not change between the two simulations as the corresponding N loads (from UK, Ireland and Norway) are not reduced. The loads outside the TBNT domain range between 20 % and 25 % of the total loads (i.e., sum of loads inside and outside of the TBNT domain). Most of these loads originate from Irish rivers and rivers along the British west coast. Due to the generally northeastward circulation west of the British mainland (e.g., Otto and van Aken, 1996; Xing and Davies, 2001), it can be assumed that most of these N inputs are transported toward the northern boundary of the TBNT domain (NA; see Figure 1). Consequently, most of their N is lost via benthic denitrification before reaching this boundary, and thus only small amounts of N from these sources will actually enter the TBNT domain. In addition, this amount is unlikely to change between the reference simulation and the WFD scenario, as they are far away from any riverine sources with strong N reductions. Hence, the effect of their implicit inclusion in the open boundary sources (see section 2.3.2) on the study results is negligible.
In the reference simulation, the relative contributions of the individual sources are quite stable throughout the entire period and show only some variations (see Figure 2B), e.g., for the German (DE) and large Dutch rivers (NL-1; incl. Rhine and Meuse Rivers), and the rivers at the British east coast (UK-2). The highest contributions range between 20 % and 25 % with only the above named groups reaching these values. For the DE rivers, the flood events of 2002 (Ulbrich et al., 2003) and 2010 (Kienzler et al., 2015; Philipp et al., 2015) are clearly visible in high relative contributions. Usually, the NL-1 rivers account for the highest contribution, followed by the UK-2, DE and French rivers (FR).
The year-to-year variability in the relative contributions of the individual sources basically does not change under WFD reductions (see Figure 2C). However, the overall relative importance has increased for the British and Dutch rivers, due to their zero, respectively, low N reductions, now consistently constituting the highest contributions (NL-1 and UK-2). In other words, the relative contributions of those countries with only small N load reductions are amplified under a WFD reduction.
Although the overall decrease in riverine TN loads is likely to reduce N concentrations, and thus that of phytoplankton and Chl-a in the North Sea, the very different national reduction measures will likely result in regionally different responses to these reductions. Therefore, we now provide an overview of the reductions in TN, DIN, and Chl-a in the North Sea.
3.2. Reductions in OSPAR Assessment Parameters in Response to Riverine N Load Reductions
Since the riverine N reductions have the most direct effect on TN in the North Sea, Figure 3A shows the simulated TN concentration (i.e., sum of all pelagic N state variables) averaged over 2006–2014 and over the water column for the reference conditions. We choose this period as it corresponds to the latest OSPAR assessment period (OSPAR, 2017; Brockmann et al., 2018). The change in TN concentration simulated by WFD reduction scenario (“WFD”) relative to the reference simulation is shown in Figure 3B and calculated as the difference between the result of the WFD scenario and that of the reference, divided by the latter. Accordingly, a negative change implies a reduction in the TN concentration. TN is only a voluntary assessment parameter within the OSPAR Common Procedure (OSPAR, 2017). Hence, we also show the analogous results for winter (January–February), water column averaged DIN (Figures 3C,D) and growing season averaged (“summer”; March–September), surface Chl-a (Figures 3E,F), which are mandatory assessment parameters (OSPAR, 2017). For Chl-a, the term “surface” refers to the uppermost model layer.
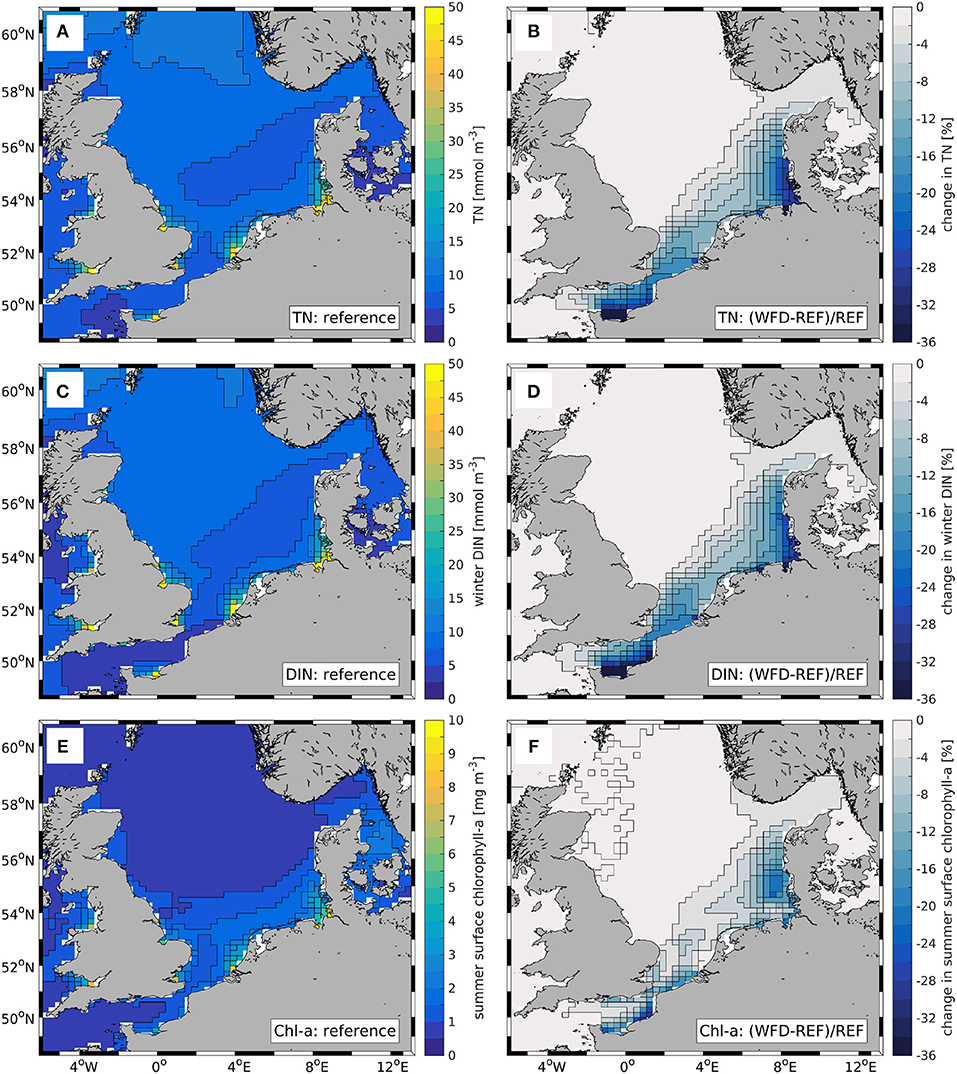
Figure 3. Maps of (left) concentrations of selected OSPAR assessment parameters simulated by reference simulation (“REF”) and (right) relative change between reference simulation and WFD reduction scenario (“WFD”) during 2006–2014: (A,B) annually and water column averaged TN, (C,D) winter (January/February) water column averaged DIN, and (E,F) growing season (March–September) surface chlorophyll-a. Relative change is calculated as (“WFD”−“REF”)/“REF” using the average values of “REF” and “WFD”.
The TN distribution for the reference simulation (Figure 3A) shows that TN concentrations in major parts of the central and northern North Sea, and in the English Channel are less than 10 mmol N m−3. Only in the vicinity of major rivers, like the Rhine and Elbe Rivers, concentrations are significantly elevated and exceed 50 mmol N m−3 (color scale limited to 50 mmol N m−3) with maximum values of 105 mmol N m−3 at the Elbe mouth. The high-TN signal of these riverine sources shows a gradual decrease toward the offshore regions of the North Sea, and it follows the general cyclonic circulation. In the Bay of Seine, values up to 45 mmol N m−3 are simulated which do not extend far into the offshore English Channel, probably due to the strong tidal mixing in that region, which diminishes the signal.
The spatial patterns for winter DIN in the reference simulation (Figure 3C) are very similar to those in TN, with the only difference that concentrations in the open North Sea are slightly lower, and that they exceed the TN concentrations near the major rivers (e.g., 54 mmol N m−3 in the Bay of Seine, 127 mmol N m−3 at the Elbe River inlet), which relates to the different averaging periods. For the summer, surface Chl-a in the reference simulation (Figure 3E), values of above 1 mg Chl-a m−3 are only simulated in the southern North Sea and along the British coast. Near the major rivers, values can reach or even exceed 10 mg Chl-a m−3. In the entire central and northern North Sea, and in most parts of the English Channel, Chl-a concentrations are less than 1 mg Chl-a m−3.
The relative changes between the reference simulation and the WFD reduction scenario exhibit qualitatively the same patterns for all three parameters (Figures 3B,D,F). The strongest reductions occur in the vicinity of the major rivers, to which significant N reductions were applied, namely the Belgian, French and German rivers. In their plume regions downstream the cyclonic circulation, further reductions are simulated. In contrast, no reductions occur in the entire western North Sea, due to the zero reductions in the British rivers.
The strongest TN reductions of up to 58 % are simulated in the Bay of Seine, while reductions near the Belgian and German rivers are on the order of 36 % (Figure 3B). The winter DIN reductions show a very similar response to the N load reductions with highest values of up to 64 % in the Bay of Seine and up to 35 % near the Belgian and German rivers (Figure 3D). For both TN and DIN clear reductions of up to 10 % can be seen in the plume regions of the French and German rivers, covering the entire eastern English Channel and wide parts of the southeastern North Sea.
For Chl-a, the reductions are generally lower (up to 29 % in the Bay of Seine) and locally confined to the French/Belgian and German/Danish coasts (Figure 3F), in response to the strong riverine N reductions in these regions. The two regions are separated by a region with very small reductions (< 4 %) off the Dutch coast, which is different to the reductions in TN and DIN. This implies that the N reductions in this region, which is strongly affected by the Rhine and Meuse Rivers, are too low to cause N limitation to surpass other limiting factors such as light or P limitation (Billen et al., 2011; Desmit et al., 2015b). Along the British south coast smaller changes do occur despite no reductions in the British rivers, which likely is a result of the strong French reductions.
An interesting feature occurs in the inner German Bight, where a region of only small changes in Chl-a extends northwestward from the Elbe River inlet, although changes in TN and winter DIN are significant. This could relate to the high turbidity in the Elbe River plume, causing light limitation to be the main controlling factor of primary productivity (Kerimoglu et al., 2018). Additionally, the negligence of riverine P load reductions in the WFD scenario could play a role here, as P limitation likely limits spring primary production in the coastal North Sea (Billen et al., 2011; Emeis et al., 2015).
The simulated changes in TN, DIN and Chl-a concentrations provide an overview of the potential changes in the North Sea in response to WFD reductions in riverine N loads. They further indicate that only small or no reductions in some North Sea regions likely result from zero or only small load reductions, e.g., in the Dutch rivers. In other regions (e.g., British south coast), reductions occur despite no reductions in the closest riverine sources, suggesting that N inputs from other rivers, to which reductions were applied, affect these regions. In the following, we therefore present spatial distributions of the relative contributions of selected riverine N sources to TN in the North Sea.
3.3. Relative Contributions to TN in the North Sea
In order to provide an overview of individual riverine contributions to TN in the North Sea, and their potential changes under WFD reductions, Figure 4 shows the mass-weighted average relative contributions to TN of four selected river groups during 2006–2014: (Figures 4A,B) the German rivers (DE), (Figures 4C,D) the French rivers (FR), (Figures 4E,F) the large Dutch Rivers (NL-1; incl. Rhine and Meuse Rivers), and (Figures 4G,H) the rivers on the British east coast (UK-2). The panels on the left show the results for the reference simulation, while the right side shows those for the WFD reduction scenario.
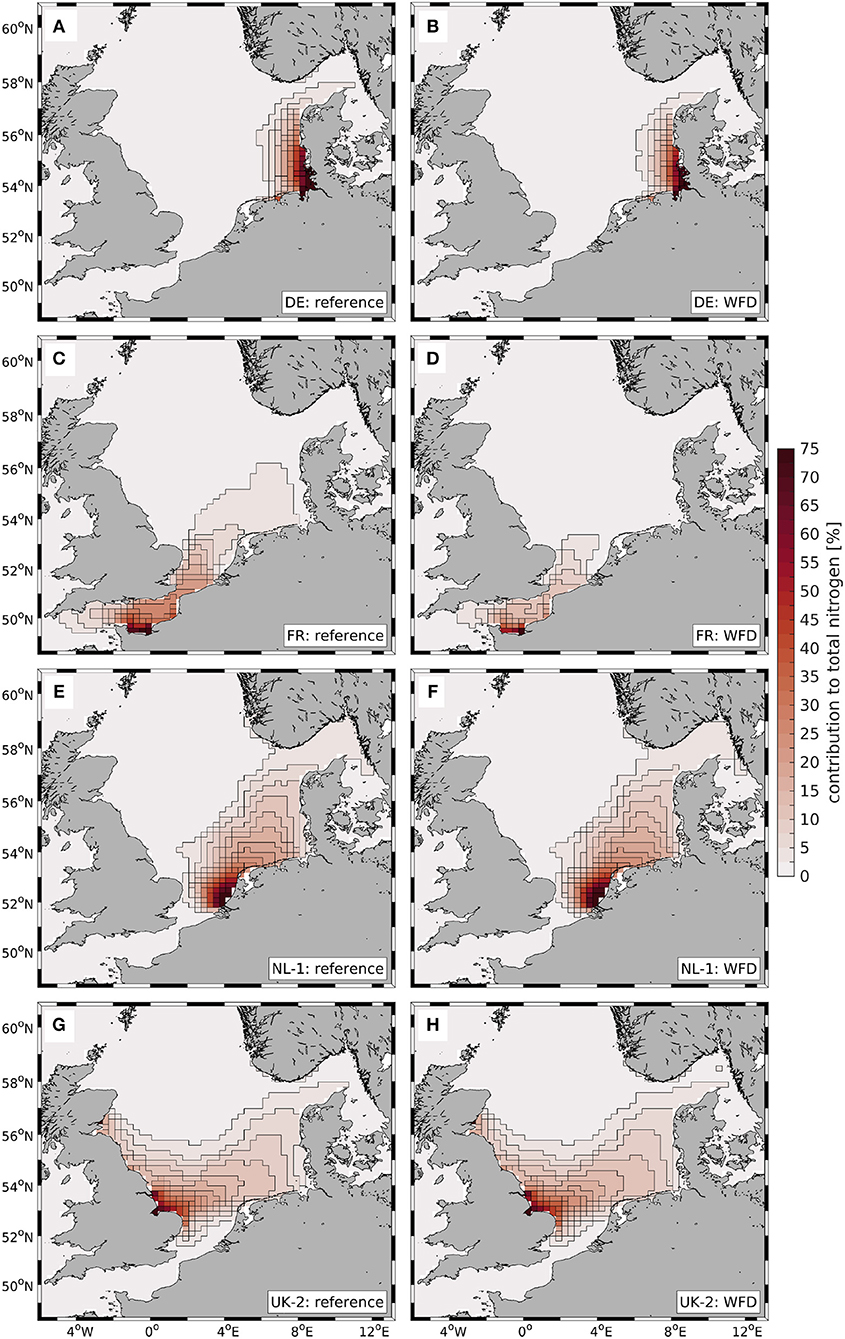
Figure 4. Maps of average relative contributions to TN by selected river source groups for (left) the reference simulation and (right) the WFD reduction scenario during 2006–2014: (A,B) German Rivers (DE), (C,D) French rivers (FR), (E,F) first group of Dutch rivers (incl. Rhine and Meuse; NL-1), and (G,H) rivers on British east coast (UK-2). Same color scale for all panels.
For both simulations, the distribution maps show a typical point source characteristic, with very high values up to 100 % at the inlet and a strong decrease within the surrounding regions. The relative TN contributions can drop to 40–60 % within a distance of only about 100 km from the inlet. However, there is a far-field effect on TN concentrations in remote regions, e.g., along the Danish west coast in case of the NL-1 rivers.
The DE contribution is highest along the German and Danish coasts with contributions of more than 60 % up to 55°N in the reference simulation (Figure 4A). In the WFD scenario (Figure 4B), the DE plume extends slightly less far north and west as a result of the comparably strong N reductions (see Table 1).
A very strong difference between the reference run and the WFD scenario can be seen for the FR contribution. In the former, it shows values of above 40 % in the entire eastern English Channel, and remains above 2.5 % almost until the northwestern tip of Denmark (see Figure 4C). In the WFD scenario, this signal is not visible and the contribution decreases from 10 % in the Strait of Dover to 2.5 % in the Southern Bight. In the English Channel, the FR contribution also dropped below 15 % in most regions, except near the inlets of the French rivers. This strong decrease in the FR contribution in the eastern English Channel explains the previously shown decrease in TN, DIN, and Chl-a along the British south coast.
Different to the DE and FR contributions, the changes in the NL-1 and UK-2 contributions between the reference simulation and the WFD scenario are very subtle, which relates to the 5% and zero reductions in their riverine N loads, respectively. In both simulations, the NL-1 contribution influences wide parts of the southeastern North Sea with values of above 5 % up to the northwestern tip of Denmark (see Figures 4E,F). The strong influence of the NL-1 rivers on TN also explains the weaker response in TN, DIN, and especially Chl-a directly off the Dutch coast. A slight increase in the NL-1 contribution occurs in the southeastern North Sea in response to the strong decrease in the DE contribution. Minor increases in the NL-1 contribution can further be seen in the Southern Bight and north of the Rhine and Meuse Rivers' inlets, which are induced by the reduction in the French and Belgian Rivers. The UK-2 contribution also extends far into the offshore regions of the North Sea in both simulations due to the cyclonic circulation (see Figures 4G,H). Highest values (> 75 %) occur near the inlets of Humber and Wash and the contributions stay above 5 % until the Danish northwest coast. As for the NL-1 rivers, minor increases in contribution relative to the reference simulation can be seen in the southeastern North Sea and in the Southern Bight.
The comparison of the spatial distributions of the relative contributions of the selected riverine sources provides a qualitative overview of the effects of WFD reductions on the individual sources in different North Sea regions. However, it does not allow for a detailed analysis of the simulated changes in the different North Sea regions. Therefore, we now present a quantitative analysis of the source-specific changes in the German EEZ to elucidate how the quite different N reductions levels (see Table 1) affect the TN concentrations in this region.
3.4. Source-Specific Contributions to TN in the German EEZ
For the quantitative analysis of the changes in TN and its source-specific contributions in the German EEZ, we consider three sub-regions according to the OSPAR COMP assessment (see Figure 1), based on observed salinity (S) gradients (OSPAR, 2017; Brockmann et al., 2018). The “Inner Coastal (IC)” region is characterized by S < 33, while the “Outer Coastal (OC)” region is defined by 33 ≤ S < 34.5. The “Offshore (OF)” region is the region with S≥34.5. The results for the three regions are given in Table 2 and are calculated as averages over the entire period 2006–2014 in order to provide a general picture of the changes imposed by the WFD reductions. In addition, we show the results for 2010, the year of a summer flood event in the Elbe River (Kienzler et al., 2015; Philipp et al., 2015), which also exhibited a record low in the winter NAO index (Osborn, 2010), reducing the Atlantic inflow into the North Sea (Winther and Johannessen, 2006). This is done to provide insight into the importance of natural variability compared to the changes induced by riverine N reductions. For a better overview, we combined the individual Dutch and British river groups into one group each and grouped together the very minor sources, namely the Norwegian (NO) and “other” rivers, and the Baltic Sea (BS). In addition to the relative contributions of the different source groups, we also show the TN concentrations (in mmol N m−3) in each region. In the following, we first describe the changes over 2006–2014, and subsequently highlight some differences to 2010.
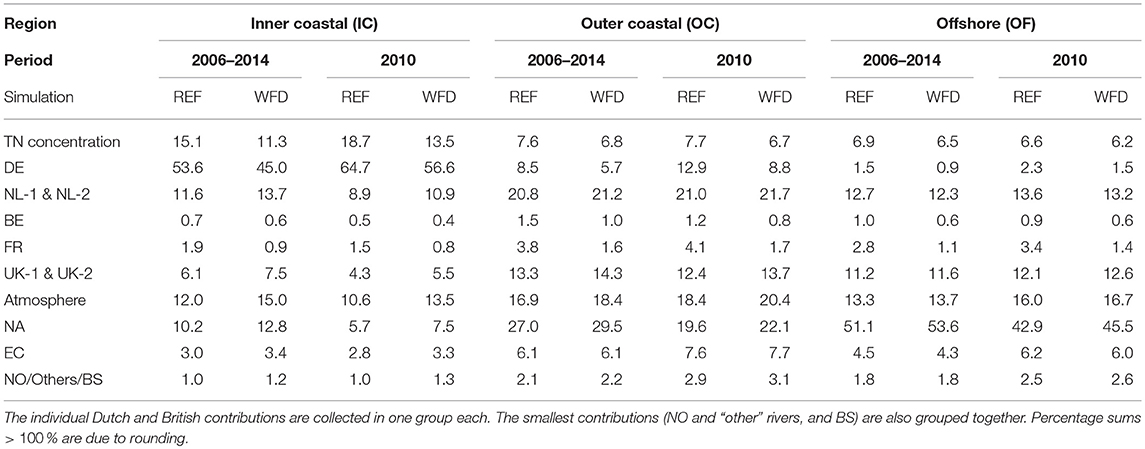
Table 2. TN concentrations (in mmol N m−3) and source-specific relative contributions (in %) in the different subregions of the German EEZ for the reference simulation (“REF”) and the WFD reduction scenario (“WFD”), averaged over the entire period 2006–2014 and over 2010, respectively.
In the reference simulation (“REF”), the average TN concentration exhibits a steady decrease from 15.1 mmol N m−3 in the IC region to 7.6 mmol N m−3 in the OC region, and to 6.9 mmol N m−3 in the OF region. This decline reflects the decreasing riverine influence toward the offshore regions of the North Sea. This is also illustrated by the decrease in the relative contributions from the German rivers from the IC (53.6 %) to the OC (8.5 %) and further to the OF region (1.5 %), as well as the increase in the North Atlantic contribution (from 10.2 % in IC to 51.1 % in OF). This implies that the German rivers dominate the dynamics in the IC region, while the North Atlantic is the main control in the OF region.
All other sources exhibit their highest contributions in the OC region, which means that this region is affected by the widest range of different sources. The Dutch rivers constitute the second largest riverine contribution in all subregions, with a maximum of 20.8 %. British rivers show a maximum contribution of 13.3 %. The Belgian and French rivers have the smallest contributions, with highest values of 1.5 % and 3.8 %, respectively. The atmospheric contribution reveals a comparably stable contribution of 12–16.9 % across the regions, while the English Channel contributes only 3–6.1 %.
The comparison of the results of the WFD scenario with those of the reference simulation shows that the TN concentration is reduced by 24.8 % in the IC region. In the OC and OF regions, the reductions only result in 11.3 % and 4.7 %, respectively, as a result of the generally lower influence of riverine sources. The strong reduction in the IC region is mostly due to the comparably strong reductions in the TN loads in the German rivers (see Table 1). The relative contribution of the German rivers to TN decreases from 53.6 % to 45 %, due to the only low or zero reductions in the Dutch and British rivers and the non-riverine N sources. This corresponds to a decrease in the absolute contribution (calculated as the product of the TN concentration and the relative contribution) from the German rivers by 36.8 % (not shown). This decrease in the absolute contribution clearly exceeds the actual combined N load reduction of 28.5 % in the German rivers, indicating additional N loss inside or west of the IC region due to changes in the N cycle. In the OC and OF regions, the reduction in the relative contributions from the German rivers is much weaker than in the IC region, due to their generally lower influence. However, their absolute contributions in both regions decrease by even 40 %. This suggests that changes in the biogeochemical cycling of N from the German rivers in the IC region (i.e., upstream with respect to the North Sea's cyclonic general circulation) have an additional indirect reduction effect on the German contribution in these regions.
The strong reductions in the Belgian and French rivers are also reflected in lower relative contributions to TN. Both contributions show their strongest decreases in the OC region (down to 1.0 % and to 1.6 %, respectively), where their contributions are highest in the reference simulation. Similar to the German rivers, the reductions in both groups' absolute contributions (Belgium: 40.6 % to 43 %, France: 61.8 % to 63.7 %) exceed the applied reductions in N loads notably (Belgium: 37 %, France: 50 %; see Table 1), especially for the French rivers.
In contrast, the relative contributions from the Dutch and British rivers consistently show a slight increase in the IC and OC regions due to their 5 % and zero N load reductions, respectively. For both groups, the strongest increases occur in the IC region, with a Dutch contribution of 13.7 % and a British one of 7.5 % in the WFD scenario. In the OF region, the British contribution also slightly increases by 0.4 %, while the Dutch one shows a minor decrease of 0.4 %. Interestingly, the absolute contributions of the Dutch rivers exceed 5 % in all subregions, ranging between 7.8 % in the OC and 11.3 % in the IC regions. The same holds for the British rivers, whose absolute contributions are reduced by up to 7 % in the IC region, despite no actual riverine N load reduction.
Regarding the non-riverine sources, which also did not change between the reference simulation and the WFD scenario, the atmospheric and North Atlantic contributions show consistently higher relative contributions in the WFD scenario. For the IC region, the same effect can be seen for the EC contribution. However, in the OC and OF regions, its relative contributions remain the same or decrease slightly. Similar to the riverine sources, the absolute contributions of these sources decreased in the WFD scenario (except for the North Atlantic in the OF region), with the strongest changes in the IC region (atmosphere and North Atlantic: 5.9 %, English Channel: 14.3 %). This shows that reductions in riverine N loads can have an indirect reduction effect even on non-manageable sources like adjacent seas.
The comparison of the 2010 values with those for 2006–2014 shows that the flood event in the Elbe river caused a dramatic increase in the TN concentration in the IC region (23.8 % higher than the 2006-2014 average). This is also reflected in the much higher relative contribution of the German Rivers of 64.7 %. In the OC and OF regions, the TN concentration in 2010 is similar or even slightly lower than average. This can be attributed to the reduced North Atlantic contribution in all subregions as a result of the very low winter NAO, which resulted in significantly reduced inflow into the North Sea across its northern boundary. Accordingly, the contributions of most other N sources are higher in the OC and OF regions in 2010. Despite these significant differences in the relative contributions of the individual sources, the overall pattern in the changes of the relative contributions between the reference run and the WFD scenario remains the same as for 2006–2014. In addition, the changes in the absolute contributions of the individual sources between the two simulations (not shown) are almost the same as on average. This emphasizes the high potential of riverine N reductions to reduce TN levels in the German EEZ, independent of inter-annual variations in river load.
The excess reduction in the absolute contributions to TN in all subregions and for all–riverine and non-riverine–sources demonstrates that riverine N reductions cause an additional indirect reduction effect, which could play an important role for the long-term removal of N from the system. In the following we want to further elucidate what causes this excess N removal in the different North Sea regions, and how it affects the downstream regions.
3.5. Changes in Source-Specific Benthic Denitrification
The consistent excess reduction in the source-specific absolute contributions to TN under reduced N loads compared to the reference conditions must result from a disproportionally higher loss of N from the North Sea system relative to the overall N inputs. Since both simulations use the same physical forcing, changes in lateral transport are proportional to the actual N load reductions and cannot explain this excess. As benthic denitrification (DNF) constitutes the only N loss term in the ECOHAM model, only changes in source-specific DNF in response to changes in the riverine N inputs can explain these excess N reductions. In order to analyze these changes, we calculated the 2006–2014 average ratios of source-specific DNF per unit of source-specific N river load (into the TBNT domain; DNF/RL) in different North Sea regions for both simulations and calculated the relative change in DNF/RL between the two. An increase in source-specific DNF/RL in a region implies a faster loss of one unit of N load from that source in that region or in other words a relatively higher loss of N under WFD reductions. As the river loads are lower under WFD reductions (or remained the same for the UK) and DNF itself decreases due to less organic matter availability (indicated by the reductions in Chl-a; see Figure 3F), such increase can only result from a weaker reduction in DNF relative to the N load reduction. The decreases in riverine N loads further imply that a decrease in source-specific DNF/RL in a region is caused by disproportionally less N from that source reaching that region, and thus a decrease in source-specific DNF.
Figure 5A shows the five selected North Sea subregions. As most of the riverine sources (except for a few British rivers) are located south of 57°N, we only considered this part of the TBNT domain and subdivided the region in relation to the main circulation patterns illustrated by the spatial distributions of the relative contributions in Figure 4. The resulting changes in DNF/RL for the individual regions are shown in Figures 5B–F. We only display the changes for river groups with DNF/RL≥0.01 (i.e., removal of at least 1 % of the overall riverine N load from that source) in the reference simulation, and black-framed bars indicate DNF/RL≥0.1 (i.e., removal of at least 10 %) in the reference simulation.
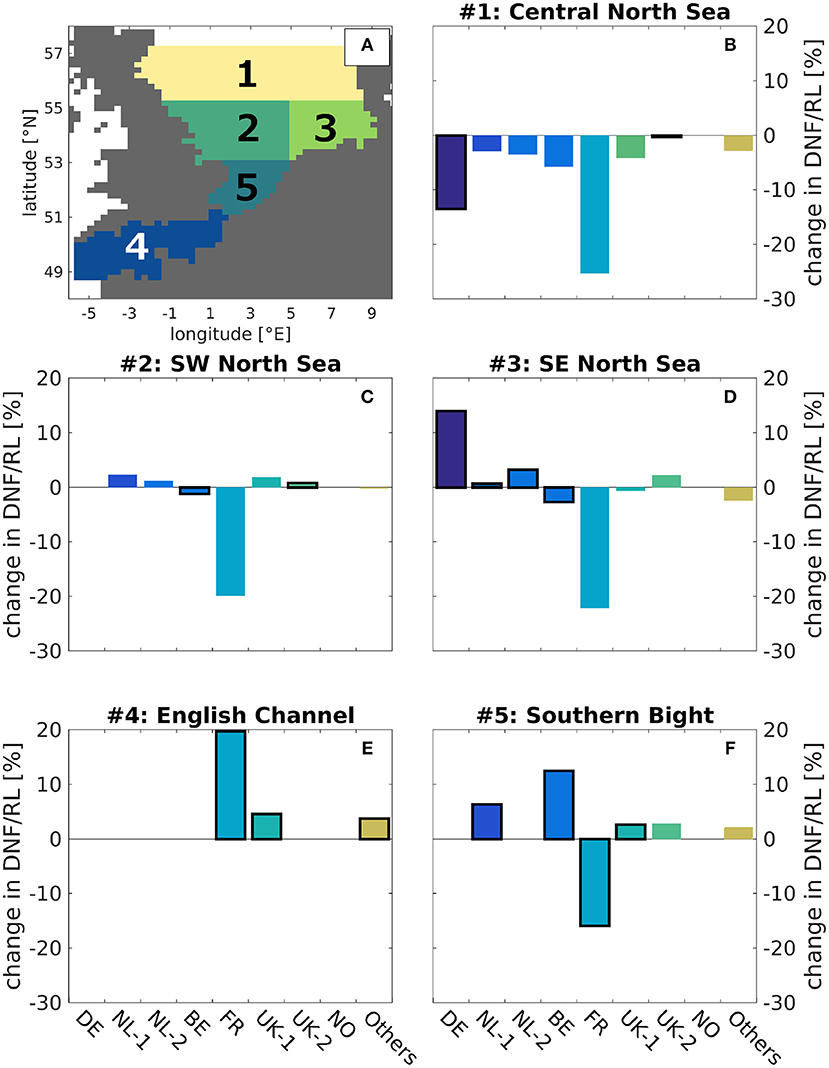
Figure 5. Relative change in source-specific benthic denitrification per source-specific TN river load (“DNF/RL”) between reference simulation (“REF”) and WFD reduction scenario (“WFD”) in different sub-regions of the North Sea. (A) Selected North Sea sub-regions, (B–F) relative changes in the individual sub-regions calculated as (“WFD”−“REF”)/“REF” based on the 2006–2014 average DNF/RL of the two simulations. Values with DNF/RL < 0.01 in the reference simulation are not shown. Black-framed bars indicate DNF/RL≥0.1 in the reference simulation.
In the central North Sea (region 1; Figure 5B) all river groups, except the rivers along the British east coast (UK-2), show a clear decrease in DNF/RL, i.e., relatively less N reaches this region in the WFD scenario. The strongest decreases occur for the German (DE; 13.5 %) and French rivers (FR; 25.3 %). For the UK-2 rivers, DNF/RL remains the same as in the reference simulation, as they are the only source group draining large amounts of N directly into that region and are not changed between the two simulations.
In the southwestern (SW) North Sea (region 2; Figure 5C), both the Dutch (NL-1/-2) and the British rivers (UK-1/-2) show slight increases in DNF/RL due to their very low and zero reductions, respectively. Hence, the amount of N from these sources is increased relative to the other riverine N sources in the WFD scenario, resulting in enhanced cycling of N and leading to increased N loss by DNF for these river groups. Similar to region 1, the French rivers exhibit a strong reduction in DNF/RL, due to less N from these rivers reaching the region.
In the southeastern (SE) North Sea (region 3; Figure 5D), DNF/RL is also clearly reduced for the French rivers, while the German rivers reveal a 14 % increase. The latter implies that under WFD reductions the N from German rivers is removed faster in this region, which explains the excess reductions in the German absolute contributions to TN in the German EEZ. It further explains the strong decrease in DNF/RL for the German rivers in region 1, as less N from these rivers reaches that region. The minor increases for the Dutch rivers relate to the 5 % reduction in their N loads in the WFD scenario and their vicinity to the region.
An interesting change in DNF/RL occurs in the English Channel (region 4; Figure 5E). Here, only the French rivers, the rivers along the British south coast (UK-1) and the “other” rivers exhibit ratios of DNF/RL>0.01 as they are the only rivers draining directly into the region and all other rivers are located downstream with respect to the cyclonic circulation. For the French rivers, DNF/RL increases by 19.7 % as a result of the strong N load reduction and the non-linear response in primary production indicated by the smaller changes in Chl-a relative to TN (see Figure 3). Surprisingly, the UK-1 and “other” rivers' DNF/RL also increase by 4.6 % and 3.7 %, respectively. As their N loads have not changed, this must be caused by the strong French reduction and it implies that relatively more N from these sources is removed in that region in the WFD scenario.
The enhanced removal of N from the French rivers in the English Channel explains the reductions in DNF/RL for these rivers in all other regions, including the Southern Bight (region 5; Figure 5F), where their DNF/RL is 0.1 in the WFD scenario. Here, DNF/RL increases for all other relevant river groups, either as a result of direct N load reductions for the Belgian (BE) and NL-1 rivers, or as an indirect effect of reductions in these two groups and in the French rivers upstream.
In summary, for all river groups with strong N load reductions, relatively more N is removed by benthic denitrification in the regions, where they drain into the North Sea. This results from the non-linear response in phytoplankton growth to the N reductions near the inlets, e.g., due to additional P limitation (Billen et al., 2011; Emeis et al., 2015) or light limitation (Loebl et al., 2009). Consequently, the reduction in organic matter production is weaker than the actual N load reduction, which leads to a relatively higher N loss by benthic denitrification. As a result, relatively less N from these rivers reaches the downstream regions, which causes a relatively higher removal of N from other sources with higher N availability. This suggests that reductions in riverine N sources can significantly reduce the overall N availability even in remote regions due to a relative increase in N loss through benthic denitrification during the transit from the source to the region of assessment (e.g., reductions in UK-2 rivers would indirectly increase N removal of N from the North Atlantic).
4. Discussion
4.1. Changes in Nitrogen and Chlorophyll-a in the North Sea in Response to WFD-Compliant Nitrogen Reductions
This study provides the first consistent approach to assess the potential impact of the combined national N reduction measures adopted by the OSPAR Contracting Parties to achieve the GES described under the WFD legislation. To our knowledge, it is also the first application of the TBNT method to a nutrient reduction scenario in order to analyze the impact of the individual reductions on the North Sea.
Although the overall riverine N input into the North Sea is reduced by 14 % under WFD reductions relative to the reference state, the different hydrographical regimes of the North Sea in combination with the wide range of national reduction measures (see Table 1) result in regionally very different responses to the riverine N reductions. It should be noted that the large range in the countries' N reductions might be amplified by our approach to apply identical reductions to PON and to DIN for countries that did not provide PON reduction targets (all except Germany). As primary production in river basins is usually P limited (e.g., Hecky and Kilham, 1988), reductions in PON loads are likely overestimated in our study. However, the average PON:TN ratios in the loads of the major rivers included in the model are below 0.15 during the simulation period, and only reach values up to 0.4 during summer when TN loads are generally low (not shown). Consequently, the amplifying effect on annually averaged TN and winter DIN can be considered small. With respect to Chl-a this effect might be stronger as PON accounts for a significant portion of TN loads during parts of the growing season. Though, a better estimation of actual PON reductions in response to reduced DIN would require the application of a catchment model, which represents the cycles of N and P, to the individual river basins. Analogously, such catchment model would be needed to estimate potential indirect reductions in the riverine P loads in response to N reductions in the river basin. However, both is beyond the scope of this study.
Compared to other North Sea modeling studies, which applied identical reductions to all riverine sources (Skogen et al., 2004; Lacroix et al., 2007; Lenhart et al., 2010; Wakelin et al., 2015), the strong differences between the individual N reductions of the member states result in a different model response. These studies predicted a general reduction of Chl-a concentrations or primary production along the continental and British coasts, in the southern and central North Sea, and in the eastern English Channel. In our study, significant reductions in TN, DIN, and Chl-a only occur in the southeastern North Sea, the Southern Bight and the eastern English Channel (see Figure 3) in response to strong N reductions in the German, Belgian and French rivers, respectively.
Due to the zero reductions in the British rivers under WFD, no reductions in TN, DIN and Chl-a concentrations are simulated along the British coast and wide parts of the western North Sea, where these rivers constitute the only major riverine source of N (see Figure 4; Große et al., 2017). In the Dutch coastal zone, the applied WFD reductions also cause only small reductions in TN and DIN and almost no reductions in Chl-a, due to the high Dutch contribution to N and a Dutch N load reduction of only 5 %, which prevents N limitation from exceeding P limitation (Billen et al., 2011; Desmit et al., 2015b) or light limitation (Loebl et al., 2009). This is supported by other TBNT studies (OSPAR, 2010; Painting et al., 2013), which found similarly high contributions of the British and Dutch tivers in these regions, respectively.
Our model also simulated only small reductions in Chl-a in a region extending northwestward from the Elbe River inlet, despite significant N reductions in the German rivers (28.5 % in annual TN load) and their dominant influence in that region. This suggests that light or P limitation surpass N limitation even under TN and winter DIN concentrations being about 25 % lower in that region in the WFD scenario. This is in agreement with Kerimoglu et al. (2018), who used a high-resolution model of the southern North Sea and also found light limitation to play a major role in this region. Other studies also identified P as the main limiting nutrient in the inner German Bight (Lenhart et al., 2010; Emeis et al., 2015; Wakelin et al., 2015), which suggests that additional P reductions might be required to achieve the “good environmental status” in the German Bight. The same might apply for the Dutch coastal waters, however, it cannot be concluded from this study, due to the only small TN and DIN reductions along the Dutch coast.
Despite the differences between the individual N reductions in this study and in previous studies, and the described regional differences, the ranges of the reduction levels simulated for DIN and Chl-a are comparable to other nutrient reduction studies (Skogen et al., 2004; Lacroix et al., 2007; Wakelin et al., 2015). Hence, we can consider carefully designed WFD reduction measures as a potent means to improve the eutrophication status of the southern North Sea.
In this context, it needs to be pointed out that the assessment of the effect of riverine nutrient load reductions adopted by the member states is only one step toward a comprehensive assessment according to the WFD. This is due to the fact that the success of reduction measures is assessed against so-called “pristine conditions,” which describe a North Sea undisturbed by anthropogenic influences like elevated river nutrient loads. For the North Sea, these pristine conditions can be defined differently depending on the sources of information used and definition of the term “pristine”. Pre-industrial conditions are often considered pristine due to the comparably small anthropogenic impact. They are usually defined as the status of the mid- or late 19th century (e.g., Serna et al., 2010; Kerimoglu et al., 2018), as reliable external nutrient inputs can only be dated back until then (Schöpp et al., 2003; Hirt et al., 2014). However, Desmit et al. (2018) derived “truly pristine” conditions before any anthropogenic disturbance using a catchment model for western Europe. The representation of the status of the marine environment under such historic conditions is usually achieved by combining these information obtained, e.g., from hydrological models (e.g., Gadegast and Venohr, 2015) with marine biogeochemical models (Desmit et al., 2018; Kerimoglu et al., 2018). Alternatively, N isotopes and sediment cores can be used to estimate nutrient inputs under undisturbed conditions, as demonstrated by Serna et al. (2010) for the German Bight.
However, assessing the effect of the WFD reductions against such a historic state is beyond the scope of this study, as our analyses focus on the assessment of the impact of individual N reductions from the different countries on the North Sea.
4.2. TBNT Analysis for the German EEZ and Implications for Eutrophication Management
The regionally very different responses in TN, DIN and Chl-a together with the relative contributions of individual riverine N sources and their changes under WFD reductions illustrate the importance of well-defined N (and possibly P) reductions for the improvement of the eutrophication status in the different North Sea regions. For the OSPAR assessment, the North Sea is subdivided into the different national EEZs, which are further subdivided, e.g., in relation to salinity gradients in the case of the German EEZ, taking into account the different regimes (coastal vs. offshore) in the different subregions.
Although the TBNT method was first published two decades ago (Ménesguen and Hoch, 1997), followed by a series of TBNT studies on the North Sea (e.g., Blauw et al., 2006; Lacroix et al., 2007; Painting et al., 2013; Troost et al., 2013; Dulière et al., 2017; Ménesguen et al., 2018), only few analyzed the contributions of the different N sources in the OSPAR assessment regions (OSPAR, 2010). Brockmann et al. (2018) state that the German Bight is affected by trans-boundary input of inorganic and organic nutrients, however, without quantifying these contributions. By analyzing in detail the individual contributions from the different riverine and non-riverine sources to TN in the German EEZ for the reference simulation, we address this topic and pursue the “source oriented approach” advocated by OSPAR (OSPAR, 1999). The additional analysis of the changes under WFD reductions further expands the work carried out by ICG-EMO (OSPAR, 2010), which was published recently in summarized form (OSPAR, 2017). Große et al. (2017) showed that the here applied setup consisting of the HAMSOM-ECOHAM model and the TBNT post-processing software is in good agreement with other TBNT studies (OSPAR, 2010; Painting et al., 2013; Troost et al., 2013) with respect to both riverine and non-riverine N sources. Hence, we consider the results of both the reference simulation and the WFD reductions as realistic representations of the recent and a potential future state.
Our results suggest that only the coastal zone of the German EEZ is dominated by the German rivers (53.6 % averaged over 2006–2014), while the regions farther offshore are strongly affected by the Dutch rivers, the rivers along the British east coast, and the North Atlantic (see Table 2). The French and Belgian rivers are only of minor importance in the entire EEZ. However, in the ICG-EMO study (OSPAR, 2010, 2017), which analyzed only the year 2002, the contribution of the French rivers (8 %) exceeds that of the British rivers (5 %), which questions the usefulness of TBNT analyses based on single years for management purposes. Our results for 2010, the year of a flood event in the Elbe River (Kienzler et al., 2015; Philipp et al., 2015), also show very different relative contributions than for 2006–2014 (e.g., 64.7 % for the German rivers in the coastal zone). Dulière et al. (2017) also demonstrated a similarly high year-to-year variability in the atmospheric contribution in the eastern English Channel and Southern Bight. This emphasizes the importance of considering long-term averages when assessing the impact of the individual N sources in a management context.
Due to the low reductions in the Dutch and British rivers, and the high German contribution to TN only in the coastal region, significant reductions in overall TN concentration (25 %) only occur in this region. For 2010, the reduction was only slightly higher (27 %), which suggests that these reductions in TN in the inner German Bight under WFD reductions are a robust estimate, despite the high year-to-year variability in the relative contributions. The discrepancy between the N load reductions of the individual OSPAR member states further results in a shift to higher relative contributions by the Dutch and British rivers in all subregions of the German EEZ, while those of the German, French and Belgian Rivers are significantly reduced. Accordingly, the contributions of the North Atlantic and the atmosphere increase.
Surprisingly, the absolute contributions to TN of all N sources-riverine and non-riverine-are reduced in the WFD scenario relative to the reference simulation. Moreover, the reductions in the absolute contributions of all riverine sources even exceed the actual N load reductions. Our analysis of the changes in benthic denitrification per riverine N load of the different sources (see Figure 5) show that under WFD reductions and relative to the total riverine N, benthic denitrification removes N from rivers with strong N reductions faster from the system than under recent conditions. This causes excess reductions in TN, which can be explained by non-linear responses in primary production to the N load reductions, e.g., due to the generally high light limitation in the river plumes of the coastal North Sea (Loebl et al., 2009) and possibly additional P limitation (Billen et al., 2011; Emeis et al., 2015).
Consequently, much less N from sources with strong riverine N load reductions reaches the downstream regions (with respect to the cyclonic circulation), which implies a relatively higher uptake of N from less reduced sources during primary production in these regions. This in turn enhances the loss of N from these sources via benthic denitrification. As a result even the contributions of N from the North Atlantic and the English Channel to TN are reduced by 5.9 % and 14.3 % in the coastal zone of the German EEZ in the WFD scenario. It should be noted that Große et al. (2017) found that benthic denitrification rates simulated by ECOHAM are up to 4 times higher than those reported by Marchant et al. (2016) in a few near shore locations of the German Bight, due to the simple sediment model used in this study. Consequently, the effect in the very near-shore regions might be overestimated. In addition, the release of legacy N stored in the North Sea sediments, e.g., in the German Bight (Serna et al., 2010), may partly balance the effect of N load reductions on benthic denitrification. Both would also reduce the indirect downstream effect, resulting in lower excess reductions. Therefore, we recommend a study on this effect using a more complex sediment model.
Nevertheless, these results clearly indicate that riverine N load reductions can have both a direct near-field and an indirect far-field effect on the reduction of the TN concentration in the North Sea. This suggests that N load reductions even in rivers distant from eutrophication problem areas can have a significant positive impact on the long-term removal of N from the North Sea and should be discussed in the context of WFD reduction measures.
4.3. The TBNT Analysis Within an OSPAR Context
The finding that reductions in riverine N sources could significantly reduce the overall N availability even in remote regions is important also within the OSPAR context, as it indicates that even small changes can have an effect on the entire North Sea system. Consequently, this should lead to a change in the treatment of the so-called “non-problem areas” defined within the OSPAR assessment (OSPAR, 2017).
As a result of the severe North Sea eutrophication in the 1980s, the 2nd International Conference on the Protection of the North Sea (ICNS-2) postulated in 1987 to “take effective national steps in order to reduce nutrient inputs into areas where these inputs are likely, directly or indirectly, to cause pollution” and to “aim to achieve a sustainable reduction (of the order of 50 %) in inputs of phosphorus and nitrogen to these areas between 1985 and 1995” (ICNS-2, 1988). In this statement, the term “these areas” was related to problem areas only, implying that only countries with problem areas had to take measures.
With the report on the “Distance to Target” assessment (OSPAR, 2013), which also includes TBNT components, the ICG-EMO group managed to bring forward a new perspective such that contributions from non-problem areas into problem areas should also be taken into account. In the executive summary, they stated “with respect to Eutrophication Problem Areas, all contributing Transboundary Nutrient Transport (TBNT) areas should be included in future modeling and assessment.” However, the basic logic is that each member state still has to prove that these contributions are inspected.
In this context, we can claim that our TBNT study for the German EEZ has quantified the contribution from areas also with non-problem area status, like the United Kingdom. Here, it is worthwhile to note that our analysis revealed a multi-year average relative contribution to TN from the United Kingdom on the order of 6–13 % in comparison to only 5 % from the ICG-EMO study (OSPAR, 2010). Our results suggest that this contribution will further increase under the adopted WFD reduction measures. Hence, future reductions might be required in the British rivers if the “good environmental status” in the German EEZ and other parts of the southern North Sea cannot be reached under these measures. The same might apply to the Dutch rivers, which are the most important riverine N source for large parts of the southeastern North Sea.
5. Conclusions
This is the first representation of a WFD-compliant riverine N reduction scenario for the North Sea, which provides a consistent approach based on the combined national measures from OSPAR Contracting Parties under WFD. It furthermore constitutes the first detailed analysis on how changes in the individual riverine source groups affect the response in N and Chl-a to these reductions in the different North Sea regions.
By quantifying the relative contributions of different N sources to TN in the German EEZ under recent conditions and under WFD reductions, our study demonstrates that the TBNT method is a quantitative tool to put into practice the “source-oriented approach” advocated by OSPAR (OSPAR, 1999). Though, our study shows that in a management context, sufficiently long assessment periods need to be evaluated due to the high natural year-to-year variability in riverine N loads strongly affecting the relative contributions of the different N sources. In addition, multi-model studies are required in order to obtain an even more reliable assessment. Here, the good news is that the TBNT method is available for a number of North Sea ecosystem models. However, for the application in management and decision making an assessment framework is needed, either within OSPAR, or in the context of WFD or MSFD.
Our study also suggests that riverine N reductions have a direct near-field and an indirect far-field effect, caused by non-linear responses in NPP and thus N loss via benthic denitrification, which both result in excess reductions of TN in the marine environment. This indicates that riverine N reductions could be a potent means for the long-term removal of N from the North Sea system, and should be considered not only in countries with eutrophication problem areas. However, further studies with a more complex sediment model are recommended to better estimate these effects.
Besides this, there is still need for a better understanding of the balance between the different sources in the North Sea, e.g., under different environmental conditions. It could be worthwhile to conduct a TBNT analysis of the North Sea under pristine conditions. Such study should be based on a combination of hydrological and marine ecosystem models in order to also account for trans-boundary effects in the watersheds (i.e., across national borders). This would provide detailed insight in the natural balance between the different riverine and non-riverine nutrient sources in the North Sea and could provide a baseline for a future distribution of the relative contributions of the different North Sea tributaries and the natural sources like the North Atlantic. This could provide a valuable expansion of the description of the North Sea state under pristine conditions.
Author Contributions
H-JL and FG contributed equally to the conception of the manuscript and the interpretation of the results. H-JL took the lead in writing the manuscript. FG developed the TBNT software, conducted all analyses and assisted in the writing.
Funding
This study received funding from the German Environmental Protection Agency (UBA), in the frame of the project Implementation of Descriptor 5 Eutrophication to the MSFD, SN: 3713225221.
Conflict of Interest Statement
The authors declare that the research was conducted in the absence of any commercial or financial relationships that could be construed as a potential conflict of interest.
Acknowledgments
We thank Markus Kreus (Federal Waterways Engineering and Research Institute) and Johannes Pätsch (Universität Hamburg) for technical support with the model simulations. We would like to thank Sonja van Leeuwen (Royal Netherlands Institute for Sea Research) for providing freshwater discharge and nutrient load data for the major rivers across Europe. We further thank Jerzy Bartnicki (EMEP) for providing atmospheric N deposition data. We also thank Onur Kerimoglu (Helmholtz-Zentrum Geesthacht) for intensive discussions on the derivation and application of the river load reductions. We thank two reviewers for their constructive criticism, which helped improving the manuscript. We would like to thank Joel Graef and Sebastian Glaschke for technical support with the compilation of the figures. The model simulations and TBNT analyses were conducted as part of the dissertation by FG (Große, 2017) and were run on Mistral, the Atos bullx DLC B700 mainframe at the German Climate Computing Center (DKRZ) in Hamburg. This study benefited from the cmocean toolbox of Thyng et al. (2016). All figures were generated with Matlab (MathWorks Inc., USA).
References
Almroth, E., and Skogen, M. D. (2010). A North Sea and Baltic Sea model ensemble eutrophication assessment. Ambio 39, 59–69. doi: 10.1007/s13280-009-0006-7
Arakawa, A., and Lamb, V. (1977). “Computational design of the basic dynamical processes of the UCLA general circulation model,” in General Circulation Models of the Atmosphere, Vol. 17, Methods in Computational Physics: Advances in Research and Applications, ed J. Chang (Amsterdam: Elsevier), 173–265.
Azam, F., Fenchel, T., Field, J. G., Gray, J. S., Meyer-Reil, L. A., and Thingstad, F. (1983). The ecological role of water-column microbes in the sea. Mar. Ecol. Prog. Ser. 10, 257–263. doi: 10.3354/meps010257
Backhaus, J. O. (1985). A three-dimensional model for the simulation of shelf sea dynamics. Ocean Dyn. 38, 165–187. doi: 10.1007/BF02328975
Billen, G., Silvestre, M., Grizzetti, B., Leip, A., Garnier, J., Voss, M., et al. (2011). “Nitrogen flows from European watersheds to coastal marine waters,” in The European Nitrogen Assessment, eds M. A. Sutton, C. M. Howard, J. W. Erisman, G. Billen, A. Bleeker, P. Grennfelt, H. van Grinsven, and B. Grizzetti (Cambridge: Cambridge University Press), 271–297.
Blauw, A. N., van de Wolfshaar, K., and Meuwese, H. (2006). Transboundary nutrient transports in the North Sea. WL|Delft Hydraulics Reports, Z4188.
BLMP (2011). Konzept zur Ableitung von Nährstoffreduzierungszielen in den Flussgebieten Ems, Weser, Elbe und Eider aufgrund von Anforderungen an den ökologischen Zustand der Küstengewässer gemäßWasserrahmenrichtlinie. ARGE Bund Länder Messprogramm.
Brockmann, U., Billen, G., and Gieskes, W. W. C. (1988). “North Sea nutrients and eutrophication,” in Pollution of the North Sea: An Assessment, eds W. Salomons, B. L. Bayne, E. K. Duursma, and U. Förstner (Berlin; Heidelberg: Springer), 348–389.
Brockmann, U., Topcu, D., Schütt, M., and Leujak, W. (2018). Eutrophication assessment in the transit area German Bight (North Sea) 2006–2014 – Stagnation and limitations. Mar. Pollut. Bull. 136, 68–78. doi: 10.1016/j.marpolbul.2018.08.060
Brockmann, U. H., and Eberlein, K. (1986). “River input of nutrients into the German Bight,” in The Role of Freshwater Outflow in Coastal Marine Ecosystems (Berlin; Heidelberg: Springer), 231–240.
Chen, X., Liu, C., O'Driscoll, K., Mayer, B., Su, J., and Pohlmann, T. (2013). On the nudging terms at open boundaries in regional ocean models. Ocean Model. 66, 14–25. doi: 10.1016/j.ocemod.2013.02.006
Claussen, U., Zevenboom, W., Brockmann, U., Topcu, D., and Bot, P. (2009). Assessment of the eutrophication status of transitional, coastal and marine waters within OSPAR. Hydrobiologia 629, 49–58. doi: 10.1007/s10750-009-9763-3
Cloern, J. E., Grenz, C., and Vidergar-Lucas, L. (1995). An empirical model of the phytoplankton chlorophyll : carbon ratio-the conversion factor between productivity and growth rate. Limnol. Oceanogr. 40, 1313–1321. doi: 10.4319/lo.1995.40.7.1313
Conkright, M. E., Locarnini, R. A., Garcia, H. E., O'Brien, T. D., Boyer, T. P., Stephens, C., et al. (2002). World Ocean Atlas 2001: Objective Analyses, Data Statistics, and Figures: CD-ROM Documentation. Technical report. National Oceanographic Data Center, Silver Spring, MD.
Desmit, X., Lacroix, G., Dulière, V., Lancelot, C., Gypens, N., Ménesguen, A., et al. (2015a). Ecosystem Models as Support to Eutrophication Management in the North Atlantic Ocean (EMoSEM): Final Report. Royal Belgian Institute for Natural Sciences.
Desmit, X., Ruddick, K., and Lacroix, G. (2015b). Salinity predicts the distribution of chlorophyll a spring peak in the southern North Sea continental waters. J. Sea Res. 103, 59–74. doi: 10.1016/j.seares.2015.02.007
Desmit, X., Thieu, V., Billen, G., Campuzano, F., Dulière, V., Garnier, J., et al. (2018). Reducing marine eutrophication may require a paradigmatic change. Sci. Total Environ. 635, 1444–1466. doi: 10.1016/j.scitotenv.2018.04.181
Dulière, V., Gypens, N., Lancelot, C., Luyten, P., and Lacroix, G. (2017). Origin of nitrogen in the English Channel and Southern Bight of the North Sea ecosystems. Hydrobiologia 196–206. doi: 10.1007/s10750-017-3419-5
Emeis, K.-C., van Beusekom, J., Callies, U., Ebinghaus, R., Kannen, A., Kraus, G., et al. (2015). The North Sea – A shelf sea in the Anthropocene. J. Marine Syst. 141, 18–33. doi: 10.1016/j.jmarsys.2014.03.012
EU (2000). Directive 2000/60/EC of the European Parliament and of the Council of 23 October 2000 Establishing a Framework for Community Action in the Field of Water Policy.
EU (2008). Directive 2008/56/EC of the European Parliament and of the Council of 17 June 2008 Establishing a Framework for Community Action in the Field of Marine Environmental Policy (Marine Strategy Fram ework Directive).
Gadegast, M., and Venohr, M. (2015). Modellierung Historischer Nährstoffeinträge und-frachten zur Ableitung von Nährstoffreferenz-und Orientierungswerten für mitteleuropäische Flussgebiete. Technical report.
Greenwood, N., Parker, E. R., Fernand, L., Sivyer, D. B., Weston, K., Painting, S. J., et al. (2010). Detection of low bottom water oxygen concentrations in the North Sea; implications for monitoring and assessment of ecosystem health. Biogeosciences 7, 1357–1373. doi: 10.5194/bg-7-1357-2010
Große, F. (2017). The Influence of Nitrogen Inputs on the Oxygen Dynamics of the North Sea. Ph.D. thesis, Universität Hamburg, Hamburg.
Große, F., Greenwood, N., Kreus, M., Lenhart, H.-J., Machoczek, D., Pätsch, J., et al. (2016). Looking beyond stratification: a model-based analysis of the biological drivers of oxygen deficiency in the North Sea. Biogeosciences 13, 2511–2535. doi: 10.5194/bg-13-2511-2016
Große, F., Kreus, M., Lenhart, H.-J., Pätsch, J., and Pohlmann, T. (2017). A novel modeling approach to quantify the influence of nitrogen inputs on the oxygen dynamics of the North Sea. Front. Mar. Sci. 4:383. doi: 10.3389/fmars.2017.00383
Heath, M. R., Edwards, A. C., Pätsch, J., and Turrell, W. R. (2002). Modelling the Behaviour of Nutrients in the Coastal Waters of Scotland. Fisheries Research Services Marine Laboratory, Aberdeen.
Hecky, R. E., and Kilham, P. (1988). Nutrient limitation of phytoplankton in freshwater and marine environments: a review of recent evidence on the effects of enrichment. Limnol. Oceanogr. 33, 796–822. doi: 10.4319/lo.1988.33.4part2.0796
Hirt, U., Mahnkopf, J., Gadegast, M., Czudowski, L., Mischke, U., Heidecke, C., et al. (2014). Reference conditions for rivers of the German Baltic Sea catchment: reconstructing nutrient regimes using the model MONERIS. Reg. Environ. Change 14, 1123–1138. doi: 10.1007/s10113-013-0559-7
ICBR (2015). Internationaal Gecoördineerd Stroomgebiedsbeheersplan 2015 Van Het Internationaal Stroomgebied District Rijn (deel A = Overkoepelend Deel). Internationale Commissie ter Bescherming van de Rijn (ICBR).
ICG-EMO (2009). ICG-EMO 3rd OSPAR Workshop User Guide. Technical report. Intersessional Correspondence Group on Eutrophication Modelling.
ICNS-2 (1988). Second International Conference on the Protection of the North Sea: ministerial declaration calling for reduction of pollution. Int. Legal Mater. 27, 835–848.
Kalnay, E., Kanamitsu, M., Kistler, R., Collins, W., Deaven, D., Gandin, L., et al. (1996). The NCEP/NCAR 40-year reanalysis project. B. Am. Meteorol. Soc. 77, 437–471. doi: 10.1175/1520-0477(1996)077<0437:TNYRP>2.0.CO;2
Kerimoglu, O., Große, F., Kreus, M., Lenhart, H.-J., and van Beusekom, J. E. E. (2018). A model-based projection of historical state of a coastal ecosystem: relevance of phytoplankton stoichiometry. Sci. Total Environ. 639, 1311–1323. doi: 10.1016/j.scitotenv.2018.05.215
Kienzler, S., Pech, I., Kreibich, H., Müller, M., and Thieken, A. H. (2015). After the extreme flood in 2002: changes in preparedness, response and recovery of flood-affected residents in Germany between 2005 and 2011. Nat. Hazard. Earth Syst. 15, 505–526. doi: 10.5194/nhess-15-505-2015
Kistler, R., Collins, W., Saha, S., White, G., Woollen, J., Kalnay, E., et al. (2001). The NCEP-NCAR 50-year reanalysis: monthly means CD-ROM and documentation. B. Am. Meteorol. Soc. 82, 247–267. doi: 10.1175/1520-0477(2001)082<0247:TNNYRM>2.3.CO;2
Kühn, W., Pätsch, J., Thomas, H., Borges, A. V., Schiettecatte, L.-S., Bozec, Y., et al. (2010). Nitrogen and carbon cycling in the North Sea and exchange with the North Atlantic–A model study, Part II: Carbon budget and fluxes. Cont. Shelf Res. 30, 1701–1716. doi: 10.1016/j.csr.2010.07.001
Lacroix, G., Ruddick, K., Gypens, N., and Lancelot, C. (2007). Modelling the relative impact of rivers (Scheldt/Rhine/Seine) and Western Channel waters on the nutrient and diatoms/Phaeocystis distributions in Belgian waters (Southern North Sea). Cont. Shelf Res. 27, 1422–1446. doi: 10.1016/j.csr.2007.01.013
Lenhart, H.-J., Mills, D. K., Baretta-Bekker, H., van Leeuwen, S. M., van der Molen, J., Baretta, J. W., et al. (2010). Predicting the consequences of nutrient reduction on the eutrophication status of the North Sea. J. Mar. Syst. 81, 148–170. doi: 10.1016/j.jmarsys.2009.12.014
Loebl, M., Colijn, F., van Beusekom, J. E., Baretta-Bekker, J. G., Lancelot, C., Philippart, C. J. M., et al. (2009). Recent patterns in potential phytoplankton limitation along the Northwest European continental coast. J. Sea Res. 61, 34–43. doi: 10.1016/j.seares.2008.10.002
Lorkowski, I., Pätsch, J., Moll, A., and Kühn, W. (2012). Interannual variability of carbon fluxes in the North Sea from 1970 to 2006 – Competing effects of abiotic and biotic drivers on the gas-exchange of CO2. Estuar. Coast. Shelf S. 100, 38–57. doi: 10.1016/j.ecss.2011.11.037
Los, F. J., Troost, T. A., and van Beek, J. K. L. (2014). Finding the optimal reduction to meet all targets – applying linear programming with a nutrient tracer model of the North Sea. J. Mar. Syst. 131, 91–101. doi: 10.1016/j.jmarsys.2013.12.001
Marchant, H. K., Holtappels, M., Lavik, G., Ahmerkamp, S., Winter, C., and Kuypers, M. M. M. (2016). Coupled nitrification–denitrification leads to extensive N loss in subtidal permeable sediments. Limnol. Oceanogr. 61, 1033–1048. doi: 10.1002/lno.10271
Mathis, M., and Pohlmann, T. (2014). Projection of physical conditions in the North Sea for the 21st century. Clim. Res. 61, 1–17. doi: 10.3354/cr01232
Ménesguen, A., Cugier, P., and Leblond, I. (2006). A new numerical technique for tracking chemical species in a multi-source, coastal ecosystem, applied to nitrogen causing Ulva blooms in the Bay of Brest (France). Limnol. Oceanogr. 51, 591–601. doi: 10.4319/lo.2006.51.1_part_2.0591
Ménesguen, A., Desmit, X., Dulière, V., Lacroix, G., Thouvenin, B., Thieu, V., et al. (2018). How to avoid eutrophication in coastal seas? A new approach to derive river-specific combined nitrate and phosphate maximum concentrations. Sci. Total Environ. 628-629, 400–414. doi: 10.1016/j.scitotenv.2018.02.025
Ménesguen, A., and Hoch, T. (1997). Modelling the biogeochemical cycles of elements limiting primary production in the English Channel. I. Role of thermohaline stratification. Mar. Ecol. Prog. Ser. 146, 173–188. doi: 10.3354/meps146173
Neumann, T. (2007). The fate of river-borne nitrogen in the Baltic Sea–An example for the River Oder. Estuar. Coast. Shelf S. 73, 1–7. doi: 10.1016/j.ecss.2006.12.005
Nixon, S. W. (1995). Coastal marine eutrophication: a definition, social causes, and future concerns. Ophelia 41, 199–219. doi: 10.1080/00785236.1995.10422044
Osborn, T. J. (2010). Winter 2009/2010 temperatures and a record-breaking North Atlantic Oscillation index. Weather 66, 19–21. doi: 10.1002/wea.660
OSPAR (1999). Strategy to Combat Eutrophication, Reference number: 1998–18. London: OSPAR Commission.
OSPAR (2003). OSPAR Integrated Report 2003 on the Eutrophication Status of the OSPAR Maritime Area Based Upon the First Application of the Comprehensive Procedure. London: OSPAR Commission.
OSPAR (2005). Revised Common Procedure for the identification of the Eutrophication status of the OSPAR Maritime area, volume 2005-3. London: OSPAR Commission.
OSPAR (2010). Results of the 2009 ICG-EMO Workshop on Transboundary Nutrient Transport. London: OSPAR Commission. HASEC 11/6/Info.1-E.
OSPAR (2016). Renewed Terms of References for ICG-EMO on WFD Reduction Study. London: OSPAR Commission. HASEC 16/8/7-E.
OSPAR (2017). Eutrophication Status of the OSPAR Maritime area – Third Integrated Report on the Eutrophication Status of the OSPAR Maritime Area. London: OSPAR Commission.
Otto, L., and van Aken, H. M. (1996). Surface circulation in the northeast Atlantic as observed with drifters. Deep-Sea Res. I 43, 467–499.
Painting, S., Foden, J., Forster, R., van der Molen, J., Aldridge, J., Best, M., et al. (2013). “Impacts of climate change on nutrient enrichment,” in Marine Climate Change Impacts Partnership: Science Review, 219–235.
Pätsch, J., and Kühn, W. (2008). Nitrogen and carbon cycling in the North Sea and exchange with the North Atlantic–A model study. Part I. Nitrogen budget and fluxes. Cont. Shelf Res. 28, 767–787. doi: 10.1016/j.csr.2007.12.013
Peeters, J. C. H., Los, F. J., Jansen, R., Haas, H. A., Peperzak, L., and de Vries, I. (1995). The oxygen dynamics of the Oyster Ground, North Sea. Impact of eutrophication and environmental conditions. Ophelia 42, 257–288. doi: 10.1080/00785326.1995.10431508
Philipp, A., Kerl, F., and Müller, U. (2015). Ansprüche potenzieller Nutzer an ein Hochwasser-Frühwarnsystem für Sachsen. Hydrol. Wasserbewirts. 59, 4–22. doi: 10.5675/HyWa_2015,1_1
Pohlmann, T. (1991). Untersuchung Hydro- und Thermodynamischer Prozesse in der Nordsee Mit Einem Dreidimensionalen Numerischem Modell. Ph.D. thesis, Berichte aus dem Zentrum für Meeres- und Klimaforschung.
Pohlmann, T. (1996). Predicting the thermocline in a circulation model of the North Sea–Part I: model description, calibration and verification. Cont. Shelf Res. 16, 131–146. doi: 10.1016/0278-4343(95)90885-S
Pohlmann, T. (2006). A meso-scale model of the central and southern North Sea: consequences of an improved resolution. Cont. Shelf Res. 26, 2367–2385. doi: 10.1016/j.csr.2006.06.011
Queste, B. Y., Fernand, L., Jickells, T. D., Heywood, K. J., and Hind, A. J. (2016). Drivers of summer oxygen depletion in the central North Sea. Biogeosciences 13, 1209–1222. doi: 10.5194/bg-13-1209-2016
Rachor, E., and Albrecht, H. (1983). Sauerstoffmangel im Bodenwasser der Deutschen Bucht. Veröfflichungen des Instituts für Meeresforschung in Bremerhaven 19, 209–227.
Radtke, H., and Maar, M. (2016). Estimating the effective nitrogen import: an example for the North Sea-Baltic Sea boundary. J. Geophys. Res. Biogeosci. 121, 2562–2575. doi: 10.1002/2016JG003516
Schöpp, W., Posch, M., Mylona, S., and Johansson, M. (2003). Long-term development of acid deposition (1880–2030) in sensitive freshwater regions in Europe. Hydrol. Earth Syst. Sci. 7, 436–446. doi: 10.5194/hess-7-436-2003
Seitzinger, S. P., and Giblin, A. E. (1996). Estimating denitrification in North Atlantic continental shelf sediments. Biogeochemistry 35, 235–260. doi: 10.1007/BF02179829
Serna, A., Pätsch, J., Dähnke, K., Wiesner, M. G., Christian Hass, H., Zeiler, M., et al. (2010). History of anthropogenic nitrogen input to the German Bight/SE North Sea as reflected by nitrogen isotopes in surface sediments, sediment cores and hindcast models. Cont. Shelf Res. 30, 1626–1638. doi: 10.1016/j.csr.2010.06.010
Skogen, M. D., Søiland, H., and Svendsen, E. (2004). Effects of changing nutrient loads to the North Sea. J. Marine Syst. 46, 23–38. doi: 10.1016/j.jmarsys.2003.11.013
Thyng, K. M., Greene, C. A., Hetland, R. D., Zimmerle, H. M., and DiMarco, S. F. (2016). True colors of oceanography: guidelines for effective and accurate colormap selection. Oceanography 29, 9–13. doi: 10.5670/oceanog.2016.66
Timmermann, K., Markager, S., and Gustafsson, K. E. (2010). Streams or open sea? Tracing sources and effects of nutrient loadings in a shallow estuary with a 3D hydrodynamic–ecological model. J. Mar. Syst. 82, 111–121. doi: 10.1016/j.jmarsys.2010.04.008
Topcu, H. D., and Brockmann, U. H. (2015). Seasonal oxygen depletion in the north sea, a review. Mar. Pollut. Bull. 99, 5–27. doi: 10.1016/j.marpolbul.2015.06.021
Troost, T. A., Blaas, M., and Los, F. J. (2013). The role of atmospheric deposition in the eutrophication of the North Sea: a model analysis. J. Mar. Syst. 125, 101–112. doi: 10.1016/j.jmarsys.2012.10.005
Ulbrich, U., Brücher, T., Fink, A. H., Leckebusch, G. C., Krüger, A., and Pinto, J. G. (2003). The central European floods of August 2002: Part 1 – Rainfall periods and flood development. Weather 58, 371–377. doi: 10.1256/wea.61.03A
von Westernhagen, H., and Dethlefsen, V. (1983). North Sea oxygen deficiency 1982 and its effects on the Bottom Fauna. Ambio 12, 264–266.
Wakelin, S. L., Artioli, Y., Butenschön, M., Allen, J. I., and Holt, J. T. (2015). Modelling the combined impacts of climate change and direct anthropogenic drivers on the ecosystem of the northwest european continental shelf. J. Mar. Syst. 152, 51–63. doi: 10.1016/j.jmarsys.2015.07.006
Wijsman, J., Los, H., and van Beek, J. (2004). The filtering capacity of an estuary for nutrients. WL|Delft Hydraulics Rep. Z2836:51.
Winther, N. G., and Johannessen, J. A. (2006). North Sea circulation: Atlantic inflow and its destination. J. Geophys. Res. Oceans, 111:C12018. doi: 10.1029/2005JC003310
Keywords: North Sea, eutrophication, biogeochemical modeling, nutrient tagging, nitrogen cycle, nutrient reductions, Water Framework Directive (WFD), trans-boundary nutrient transports (TBNT)
Citation: Lenhart H-J and Große F (2018) Assessing the Effects of WFD Nutrient Reductions Within an OSPAR Frame Using Trans-boundary Nutrient Modeling. Front. Mar. Sci. 5:447. doi: 10.3389/fmars.2018.00447
Received: 31 August 2018; Accepted: 08 November 2018;
Published: 27 November 2018.
Edited by:
Jesper H. Andersen, NIVA Denmark Water Research, DenmarkReviewed by:
Xavier Desmit, Royal Belgian Institute of Natural Sciences, BelgiumTheo C. Prins, Deltares, Netherlands
Copyright © 2018 Lenhart and Große. This is an open-access article distributed under the terms of the Creative Commons Attribution License (CC BY). The use, distribution or reproduction in other forums is permitted, provided the original author(s) and the copyright owner(s) are credited and that the original publication in this journal is cited, in accordance with accepted academic practice. No use, distribution or reproduction is permitted which does not comply with these terms.
*Correspondence: Hermann-Josef Lenhart, hermann.lenhart@uni-hamburg.de