Carbon Isotopic Fractionation in Organic Matter Production Consistent With Benthic Community Composition Across a Coral Reef Flat
 David A. Koweek1*
  Atleigh Forden1 Rebecca Albright1,2
  Yuichiro Takeshita1,3
  David A. Mucciarone4
  Aaron Ninokawa5 Ken Caldeira1
- 1Department of Global Ecology, Carnegie Insitution for Science, Stanford, CA, United States
- 2Department of Invertebrate Zoology, California Academy of Sciences, San Francisco, CA, United States
- 3Monterey Bay Aquarium Research Institute, Moss Landing, CA, United States
- 4Department of Earth System Science, Stanford University, Stanford, CA, United States
- 5Bodega Marine Laboratory, University of California, Davis, Davis, CA, United States
Carbon fluxes on coral reefs (net community production and net community calcification) aggregate the collective activity of all coral reef community members. This integrated approach provides powerful community-level insights, but is unable to resolve the finer-scale contributions of different reef functional groups to the community-scale rates. Tools are required to disaggregate the community-scale approaches and evaluate the performance of co-existing reef functional groups. Such assessments are necessary to improve forecasts of coral reef responses to global and local environmental change. We present results from a coral reef field study on One Tree Island reef in the Great Barrier Reef, off northeastern Australia, in September-October 2016 where we combined observations of total alkalinity, dissolved inorganic carbon (DIC), and the stable isotopic composition of dissolved inorganic carbon () to estimate carbon isotopic fractionation during organic matter formation. Portions of the reef with greater abundance of non-calcifying algae fractionated DIC ~5‰ more (stronger preference for 12C) during organic metabolism than did portions of the reef with a greater abundance of calcifiers. These results were consistent across a wide range of assumed isotopic fractionation factors for net calcification. We attribute the observed differences in carbon isotopic fractionation to the metabolic activities of the ecological community underlying each section of the reef, rather than to environmental factors such as light availability or water temperature. The patterns in carbon isotopic fractionation were generally consistent with inferred ratios of calcification to primary production in each reef zone, giving further confidence to our inference that differences in carbon isotopic fractionation may be related to differences in the ecological community on small spatial scales.
1. Introduction
Field studies of coral reef community metabolism (also called ecosystem metabolism) have greatly improved our collective understanding of coral reef ecosystems since they began over 60 years ago (Sargent and Austin, 1949; Odum, 1953; Odum and Odum, 1955). Together, these studies have illuminated variability in net photosynthetic and calcification rates over a range of timescales, including interannual (Kinsey, 1978; Silverman et al., 2012; Shaw et al., 2015; Yeakel et al., 2015; Kwiatkowski et al., 2016), seasonal (Falter et al., 2012; Shaw et al., 2012; Albright et al., 2013), daily (Nakamura and Nakamori, 2008; Albright et al., 2015), and even hourly (Shamberger et al., 2011; Koweek et al., 2015b; Takeshita et al., 2016). Environmental data collected alongside the metabolic rate data has helped us understand the community-scale dependence of primary production on light availabilty (Gattuso et al., 1993), the close correlation between rates of net production and net calcification (Shaw et al., 2012; McMahon et al., 2013; Albright et al., 2015), and the relative roles of benthic processes in controlling the biogeochemical variability experienced on coral reefs over diel timescales (Andersson and Gledhill, 2013).
Net community production (NCP: gross primary production minus community respiration) and net community calcification (NCC: calcification minus dissolution) have most commonly been estimated by measuring changes, or anomalies, in dissolved inorganic carbon (DIC) or dissolved oxygen (O2) and total alkalinity (TA) over some portion of reef, along with an estimate of the water volume and timescale over which the biogeochemical anomaly took place (Odum and Odum, 1955; Barnes, 1983). NCC estimates rely on the well-documented ratio of approximately 2:1 changes in TA to changes in DIC (Smith and Key, 1975) and assume that NCP does not change TA (Kinsey, 1978). NCP rates calculated using DIC anomalies need to be corrected for DIC changes due to calcification and air/sea gas exchange. These so-called anomaly techniques have strength because of their ability to integrate the activity of all members of the coral reef community into a single rate estimate. However, this integrated approach to metabolic rate estimates is unable to resolve the contributions of different reef functional groups such as corals, macroalgae, calcifying algae, etc. to community-scale metabolic rates. Improved linkages between between the coral reef ecological community and coral reef community metabolic rates are needed to improve our understanding of coral reef ecosystem function.
Recent evidence supports the hypothesis that bulk biogeochemical measurements of seawater chemistry (DIC and TA) may be reflective of the ecological community composition (Lantz et al., 2014; Cyronak et al., 2018) and that variations in biogeochemical variability can be related to the coral and algal cover in a reef community through the metabolic activity of these reef community members (Page et al., 2016). However, coral cover effects on biogeochemical variability through coral metabolic activities are complex. Using mesocosms and corals from Bermuda, Page et al. (2017) showed that variations in coral cover between 40 percent and 80 percent had no effect on biogeochemical variability. Conversely, using mesocosms and corals from Hawai'i Page et al. (2017) showed that nighttime pH decreases from respiration scaled with percent coral cover, but that daytime pH increases from gross production were not dependent on percent coral cover. Clearly work remains to better understand the linkages between benthic community composition, NCC and NCP, and resulting biogeochemical variability. A new suite of biogeochemical tracers could continue to improve our understanding of coral reef ecosystem function by allowing us to zoom in from an aggregated community perspective to better understand the contributions of different functional groups to the community metabolism. These tracers could include coral metabolomic profiles (Sogin et al., 2014), environmental DNA (Stat et al., 2017), and stable isotopic tracers.
Variations in the stable isotopic composition of dissolved inorganic carbon () are driven by variations in carbon isotopic fractionation (ϵ) among members of the coral reef community and thus may yield insights into modern biogeochemical cycling in coral reefs that are unavailable from measurements of DIC and TA alone. Although there has been a long history of using and to study global ocean processes, these measurements have not been applied often to study coral reef metabolism. may act as a powerful tracer of reef community metabolic activities by reflecting the isotopic fractionation of the various carbon fluxes occuring within reefs, and specifically in ways that are not captured by measured TA and DIC anomalies alone. For example, photosynthesis results in the preferential uptake of 12C, leaving seawater DIC enriched in the heavier 13C isotope. The degree of this fractionation, which is dependent upon the rate of uptake and the photosynthetic pathway involved (Hayes, 1993; Carvalho et al., 2015), can range from 10‰ to 30‰ in reef organisms with the organic tissue isotopically depleted relative to the seawater (Smith et al., 1985). Calcification typically involves far less carbon isotopic fractionation, which can either leave the carbonate skeletons of corals and calcifying algae isotopically enriched or depleted relative to the seawater DIC by ~0‰ to 3‰ (Smith et al., 1985; Gischler et al., 2009). Such large differences in carbon isotopic fractionation between photosynthesis and calcification have previously been exploited to estimate reef-scale rates of NCP using reef-scale isotopic fractionation factors (Smith and Kroopnick, 1981), but little effort has been expended to move from reef-scale fractionation toward finer scales of ecological and biogeochemical relevance.
In this study we continue to explore carbon isotopic fractionation of DIC on coral reefs using a reef flat in the Great Barrier Reef as a case study. We hypothesized that portions of the reef community featuring a greater abundance of non-calcifiers would more strongly fractionate DIC than portions of the reef featuring a greater abundance of calcifiers, and that such differences would result in distinct spatial patterns of that can be traced back to the underlying benthic communities. We inferred carbon isotopic fractionation during organic matter formation from variations in , TA, and DIC as water flowed over the reef flat. Our results show that carbon isotopic fractionation on the reef reflects the metabolic activities of the underlying ecological community, but work remains to unlock the full potential of as a biogeochemical tracer.
2. Methods
2.1. Study Site and Sampling Protocol–a Study of Opportunity
Seawater samples were collected from a reef flat on One Tree Island (OTI) in the southern Great Barrier Reef (Figure 1) in September to October 2016 in conjunction with the Albright et al. (2018) CO2 enrichment experiment. As discussed in Albright et al. (2018), OTI features a ponded lagoon system such that free surface gradients exist between lagoons at low tide, causing a gravitational flow from one lagoon to another. Slow, uni-directional flow over this shallow reef flat at low tide creates an excellent environment to make coral reef biogeochemical measurements. We sampled natural abundance , DIC, and TA across the reef flat on days (n = 10) when the Albright et al. (2018) experiment was not adding CO2 to the reef. Because this was largely a study of opportunity that leveraged the resources already in place for the CO2 enrichment experiment, the study site, time of year, and sampling locations were determined by factors outside the direct control of this study.
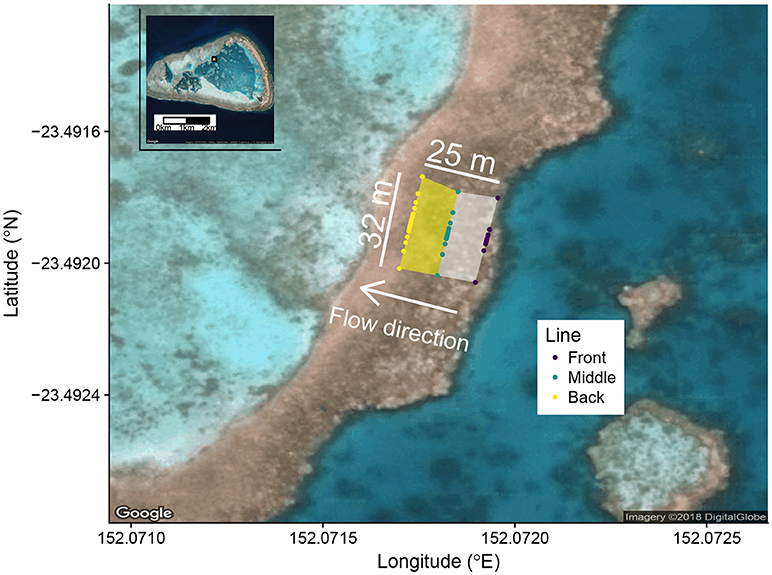
Figure 1. Google Earth image of the study site with One Tree Island as an inset in the upper left corner. The orange rectangle with black border in the inset shows the location of the study site within One Tree Island. Colored dots show the position of all sampling locations. The front zone is defined between the front and middle lines (white shaded area). The back zone is defined between the middle and back lines (yellow shaded area). The white arrow shows the direction of gravitational flow from First Lagoon to Third Lagoon at low tide due to ponding.
The reef flat study area was approximately 32 m wide (perpendicular to the direction of flow) by 25 m long (parallel to the direction of flow). The mean depth of the front zone during sampling was 0.15 m and mean depth of the back zone was 0.08 m. Samples were collected along three lines perpendicular to the direction of water flow across the water. The front line was near the leading edge of the border, the middle line bisected the study area, and the back line defined the trailing edge of the study area (Figure 1). Along each of the three lines, sampling locations were marked into the reef prior to the start of the field season in order to ensure day-to-day consistency in sampling location. The front line had 9 sampling positions approximately normally distributed about the middle of the study area, the middle line had 11 sampling positions and the back line had 15 sampling positions, each also normally distributed about the center of the study area. The sampling stations were centered in the middle of the study area to best track the fate of the released CO2 and Rhodamine WT in the concurrent CO2 enrichment experiment (Albright et al., 2018), which were both released upstream of the midpoint of the front line. Approximately one hour after low tide, seawater samples were collected by a field team of 6 people (2 people per line) who used water pumps to rapidly sample the study area, typically in less than 5 min, by moving from the edges of each line toward the midpoint. Seawater samples were pumped directly into pre-rinsed 500 mL borosillicate bottles taped entirely black to minimize any photosynthetic activity prior to water chemistry analysis. Despite having a sampling design optimized for conditions outside the direct scope of this study, we believe that this study presents a unique opportunity to pair a highly sampled reef flat (n = 35 samples across a 32 x 25 m area) with a detailed survey of the ecological community and environmentally relevant data sets (e.g., PAR). As such, we argue that this study offers value because of its ability to pair measurements with their ecological and environmental controls.
2.1.1. Ecological Community Survey
Benthic surveys were conducted to characterize the ecological community following Albright et al. (2018). The methodology is briefly summarized here. Five transects running parallel to the direction of flow were evenly spaced across the study site. Top-down photographs of 0.25 m2 quadrats were taken each meter along the transect. Coral Point Count software was used to randomly select 15 points per quadrat, which were then classified into one of six functional groups: (1) coral, (2) coralline algae, (3) sand, pavement, and rubble, (4) macroalgae, (5) turf algae, and (6) unknown. Results from each quadrat were aggregated into transect-wide results, which were averaged to establish representative community composition metrics for the front and back zones.
2.2. Analytical Chemistry
Field samples were immediately transferred to a shore-based laboratory for geochemical analysis. As described in Albright et al. (2018) samples were analyzed for pH using spectrophotometry and TA using a Metrohm 855 robotic autotitrator. TA samples were monitored for accuracy using Certified Reference Materials (CRMs) provided by the laboratory of Andrew Dickson (Scripps Insitution of Oceanography). DIC was calculated from pH and TA at 20°C (the constant temperature of the spectrophotometric pH measurements) using field-based measurements of salinity from SBE37 MicroCAT C-T Recorders (Sea-Bird Scientific, Inc.) following the equations and best practices described in Riebesell et al. (2010). Aliquots of the original 500 mL samples were filtered following protocols specified in Bockmon and Dickson (2014) into 30 mL serum vials (Wheaton Inc.) for later stable isotopic analysis. These samples were preserved through addition of 20 μL of saturated mercuric chloride solution within 2 to 3 h of sample collection, and were sealed with rubber septa and tin or aluminum crimp tops.
Stable isotope samples were analyzed at the Stanford University Stable Isotope Biogeochemistry Laboratory (SIBL). The custom methodology used to analyze the samples is briefly described here with additional details available in the SI. Aqueous samples were converted into a gaseous stream for analysis in a Finnigan Delta+ isotope-ratio mass spectrometer (IRMS) with a ConFloII open split interface using a modified version of the sample acidification and delivery system first described by Long et al. (2011). Samples were acidified through addition of 100 μL of 10 percent concentrated phosphoric acid (H3PO4) and passed through both a 2′ Nafion drier and a magnesium perchlorate (Mg(ClO)4) trap to remove water prior to delivery to the IRMS via a CO2-free stream of H2 gas (Figure S2). The IRMS was calibrated daily using injections of an independentally calibrated reference CO2 gas. IRMS performance was monitored through daily analysis of CRMs (Batch 153) as well as replicate filtered aliquots of seawater collected from a a single, well-mixed batch on site at OTI (henceforth referred to as OTI reef water). Note that while the CRMs are typically used to calibrate carbonate chemistry measurements, we used them only as a filtered, stable, internally consistent batch of water in order to assess our sample precision throughout the duration of our analysis. Details on the calibration and quality assurance procedures can also be found in the SI. All reported values of are relative to the Vienna Pee Dee Belemnite (VPDB) standard.
2.2.1. Analytical Uncertainty
Instrumental precision on 185 injections of the CO2 reference gas over the course of the ~6 weeks of sample analysis was 0.09‰ (1 S.D.). Precision on 255 replicates of the CRMs was 0.12‰ (1 S.D.). Finally, replicate analysis of 155 aliquots of OTI reef water originating from 36 replicate bottles yielded a precision of 0.12‰ (1 S.D.). Average daily precision for both the CRMs and OTI reef water was better than 0.04‰. Errors from the different standards (reference gas injections, CRMs, and OTI reef water) were independent of one another based on an analysis of daily means for each type of standard. The small difference in error between the reference CO2 injections and the CRMs suggests little additional analytical error attributable to acidifying the seawater into a gaseous CO2 stream. The negligible difference between the analytical error of the CRMs and the OTI reef water replicates, which were held in 36 separate bottles, indicates no significant error attributable to bottle effects.
We cross-validated our analytical methods with the the laboratory of Paul Quay at the University of Washington (UW). We aggregated some of our internal standard (OTI reef water) and split the samples between bottles to be run at SIBL and those to be sent to UW. SIBL samples had a mean ± S.D. of –0.75 ± 0.05‰ (n = 10). UW samples had a mean ± S.D. of –0.72 ± 0.01‰ (n = 3). The strong agreement between the two laboratories supports the accuracy of the analytical method used in this study.
2.3. Isotopic Calculations
The isotopic mass balance of water flowing across each zone can be expressed as:
where the subscripts “o” and “i” stand for “outgoing” (left hand side) and “incoming” (right hand side), respectively, F is the mass flux of water over the study site (in kgs−1) and A is the study site area (m2). NCC, or net community calcification, is defined as:
and NCP, or net community production, is defined as:
where the overbars on incoming and outgoing TA and DIC signify line-averaged mean values. Based on the flow direction during low tides, in the front zone the outgoing line was the middle line and the incoming line was the front line. In the back zone, the outgoing line was the back line and incoming line was the middle line. We ignored any effects from air-sea gas exchange in Equation (3) because preliminary calculations revealed small (<5 μmolkg−1) air-sea CO2 gradients, which were much smaller than the observed DIC and TA gradients generated during flow across the reef flat zones (see section 3).
We define isotopic fractionation factors (ϵP−S) as δproduct = δsubstrate + ϵ such that positive isotopic fractionation factors (ϵ > 0) indicate an enrichment in the product relative to the substrate and vice versa for negative isotopic fractionation factors. The factor for NCP is and the factor for NCC is where “OM” stands for “organic matter,” recognizing that each of these ϵ's represent the net process (i.e., photosynthesis-respiration and calcification-dissolution) and aggregate across all contributors of the reef community.
Substituting Equations (2) and (3) into Equation (1) (as well as using the short-hand , , and ) allows us to express the isotope balance using , , and :
Note that Equation (4) is independent of mass flow, F, and depends only on changes in TA, DIC, and between two lines oriented normal to the direction of flow. We re-arrange Equation (4) to isolate ϵOM:
We calculated ϵOM from Equation (5) for fixed values of ϵCaCO3 ranging from –5‰ to 5‰. We chose this range in ϵCaCO3 to reflect the inorganic δ13C of reef materials, which typically ranges ± 3–5‰ (Smith et al., 1985; Gischler et al., 2009).
Finally, we wanted to explore how variations ΔTA, ΔDIC, ϵCaCO3, and ϵOM influence fractionation. The change in as the water flows through a given area, , can be expressed by re-arranging Equation (5):
We held DICo constant in order to explore the effects the geochemical changes and isotope effects on the . We set DICo equal to the mean DIC leaving the front zone through the ten days of observation (1,907 μmolkg−1). For simplicity, we henceforth refer to , , and as ΔDIC, ΔTA, and , respectively.
2.4. Uncertainty Analysis
We calculated the standard error in ΔDIC, ΔTA, and between two lines as where σi and ni were the standard deviation and number of samples of the incoming line, respectively, and σo and no were the standard deviation and number of samples of the outgoing line, respectively, for each zone and for each day. We calculated the standard error in the ratio ΔTA/ΔDIC as where ΔTA and ΔDIC are the mean estimates for each zone on each day, and where S.E.ΔTA and S.E.ΔDIC are the standard errors for ΔTA and ΔDIC, respectively, for each zone on each day.
We calculated ϵOM using the daily mean ΔDIC, ΔTA, and within each zone on each day (Figure S1), but we chose to focus on bootstrap estimates of ϵOM for both the front and back zones. We bootstrapped the ϵOM estimates using linear regression since Equation (5) takes the form βx = Y where β = ϵOM. We bootstrapped the ϵOM estimates for both the front and back zones 10,000 times drawing from the original 10 observations (daily mean ΔDIC, ΔTA, , and for each zone on each day). The bootstrap generated ϵOM estimates less sensitive to the results of any given day than did the individual ϵOM calculated using the data from only a single day. Since we were interested in evaluating the differences in ϵOM between zones for the purposes of understanding the degree to which they reflect the benthic community composition, we felt justified in using the more temporally integrated approach to estimating the average ϵOM within each zone. After we completed the bootstrap, we calculated the difference in ϵOM between the front and back zones (Δϵ) for equivalent bootstrap iterations (same sample index used to calculate ϵOM in both the front and back zones), resulting in 10,000 estimates of Δϵ for each value of ϵCaCO3.
3. Results
3.1. Coral Reef Community Composition
Calcifiers (defined as the percent cover of coral and coralline algae) were less abundant in the front zone than in the back zone (21 percent vs. 41 percent) (Figure 2). Non-calcifying algae (defined as macroalgae plus turf algae) were more abundant in the front zone relative to the back zone (48 percent vs. 35 percent). A small fraction (<0.5 percent) of the ecological community in the back zone consisted of sponges and other organisms that were not classified. We omitted these two categories from Figure 2 for clarity.
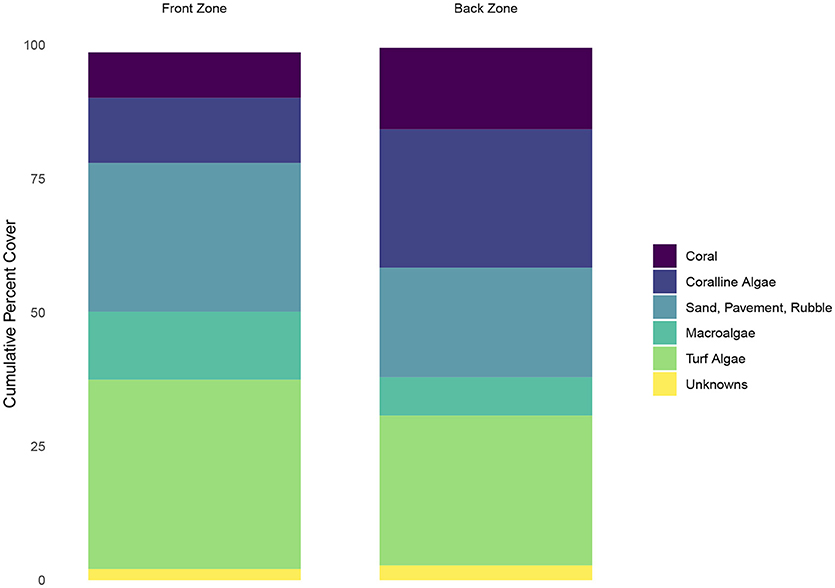
Figure 2. Ecological community composition of the front and back zones on the reef. Calcifers (corals and coralline algae) are show in opaque, while the other functional groups are shown in semi-transparent color to highlight the differences in calcifier abundance between the two zones.
3.2. DIC, TA, and δ13CDIC Variability
DIC ranged from 1,683 μmolkg−1 to 2,008 μmolkg−1 across the study, with strong day-to-day variability in daily DIC minima and less variability in DIC maxima. DIC became depleted moving from the front to the middle to the back lines, although the magnitude of depletion depended upon the position on the line (Figure 3). Sampling positions south of the study area midpoint in Figure 1 (positive values along the line) generally exhibited greater DIC depletion than did those located north of the study area center line (negative values). This pattern was generally consistent across all three lines, although the front line tended to exhibit more DIC variability than did the middle and back lines. Similar patterns in TA along the sampling lines emerged as those observed in the DIC data (Figure 4). TA had a smaller observed range in concentration than did DIC (2,134 μmol kg−1–2,295 μmol kg−1). The DIC and TA data from 03-October-2016 exhibited small-to-negligible depletion moving across the study site. We attribute this outlier to exceptionally low photosynthetically active radiation (PAR), which we believe led to reduced biological uptake of DIC and TA by reducing light available for photosynthesis and subsequent calcification. The PAR measurements on 03-October-2016 were made at 15:51 hrs local time with a PAR value of 169 μmolm−2s−1. In comparison, average PAR during the sampling periods was 1112 ± 175 μmolm−2s−1 (mean ± S.E.) (Albright et al., 2018).
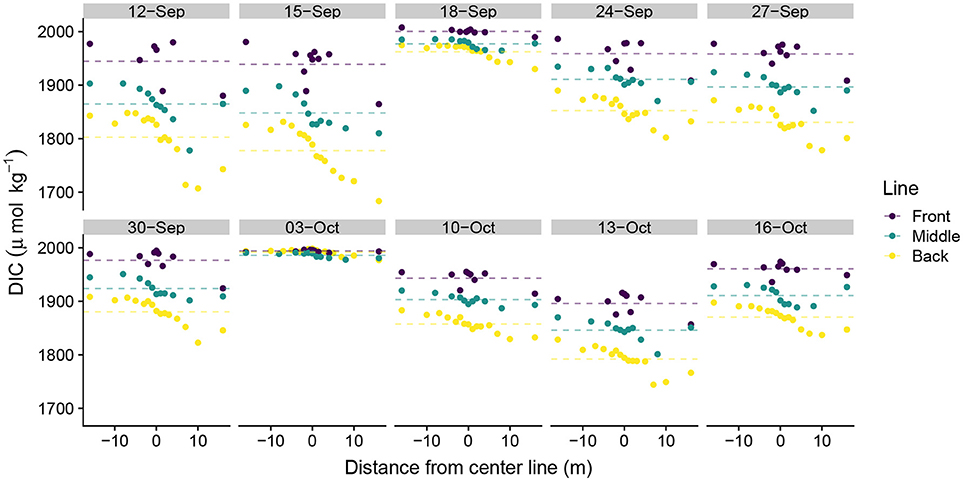
Figure 3. Spatial distribution of dissolved inorganic carbon measurements. Spatial distance values less than zero are located north of the center line and distance values greater than zero are located south of the center line in Figure 1. Dotted lines show line-averaged DIC.
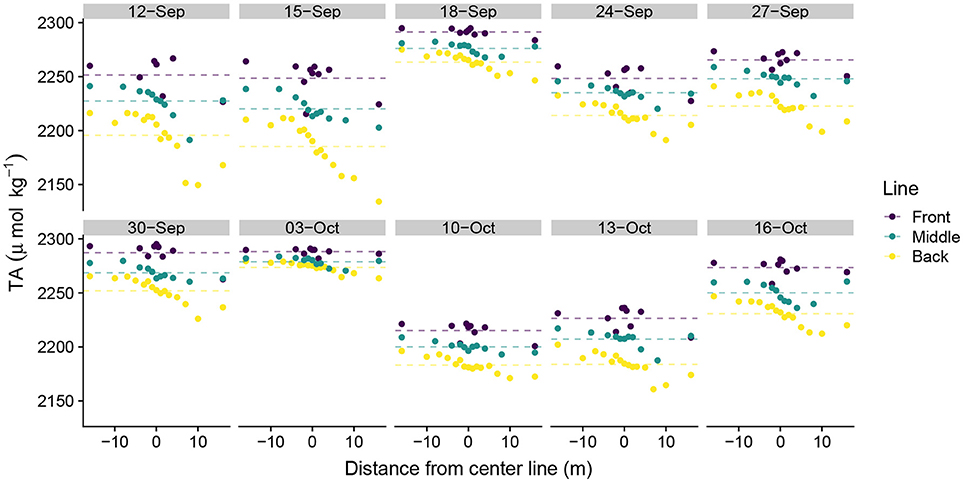
Figure 4. Spatial distribution of total alkalinity measurements. Spatial distance values less than zero are located north of the center line and distance values greater than zero are located south of the center line in Figure 1. Dotted lines show line-averaged TA.
values typically spanned –0.5‰ to 1.4‰ with a few exceptions for more isotopically depleted samples (Figure 5). One back line sample on 03-October-2016 was less than –3‰ and one front line sample on 16-October-2016 was less than –2‰. These two samples, along with the other isotopically light samples, corresponded to high DIC (Figure 6). showed greater along-line and along-flow variability than did DIC or TA which often obscured overall trends of isotopic enrichment during flow across the reef. Some sampling days, such as 12-September-2016, 15-September-2016, and 13-October-2016, revealed clearer spatial patterns in enrichment during transit across the reef flat. Other days, such as 30-September-2016 and 16-October-2016, showed less consistent patterns in during transit across the reef. Line-averaged patterns of isotopic enrichment helped reveal a clearer pattern of average isotopic enrichment during flow across the reef flat (Figure 5).
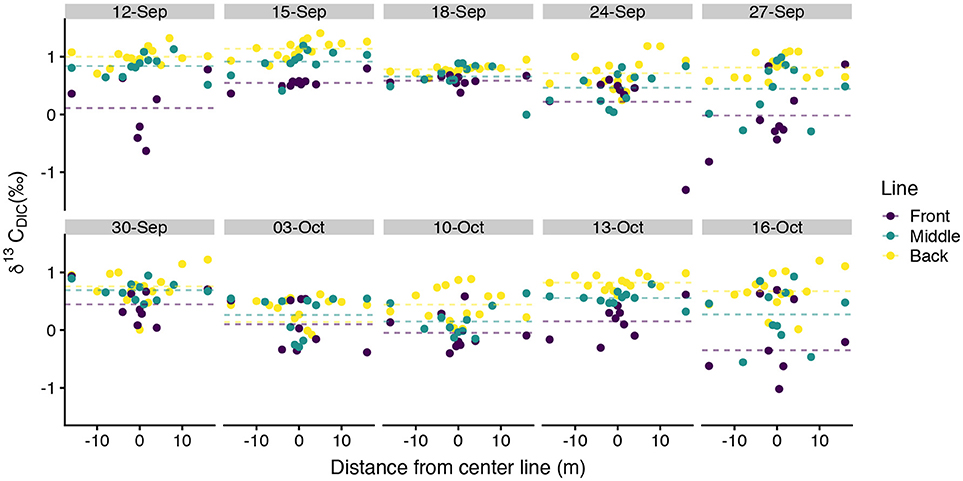
Figure 5. Spatial distribution of measurements. Spatial distance values less than zero are located north of the center line and distance values greater than zero are located south of the center line in Figure 1. Dotted lines show line-averaged . Two anomalously low samples, one on 03-October-2016 and the other on 16-October-2016, extend beyond the y-axis of this plot and are shown in Figure 6.
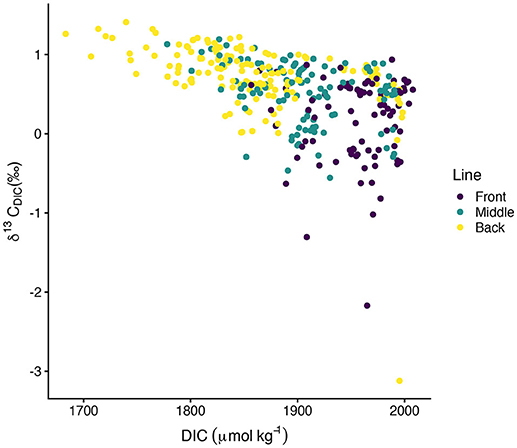
Figure 6. Scatter plot of vs. DIC.
Mean ΔDIC ranged from –6 to 91 μmolkg−1. The only negative ΔDIC value occurred on 03-October-2016, although 18-September-2106 also featured ΔDIC < 25 μmolkg−1. ΔDIC was generally consistent between the front and back zone, but differences between the two zones of up to ~25μmolkg−1 were observed early in the study (Figure 7A). Front zone ΔDIC was greater than back zone ΔDIC on 6 sampling days (including 03-October-2016). ΔTA was positive in both zones on all sampling days (Figure 7B) and ranged from 5 to 35 μmolkg−1. Front zone and back zone ΔTA were of similar magnitudes and showed similar patterns across the sampling days. Back zone ΔTA exceeded front zone ΔTA on 6 sampling days. Mean ranged from 0.12 to –0.73 ‰ (Figure 7C; note that is usually negative since ). estimates were characterized by high variability, although the mean estimates showed a consistent pattern on enrichment. On all 10 sampling days, front zone and on 9 of the 10 sampling days, back zone . The only day for which the back zone Δδ13CDIC > 0 was 03-October-2016.
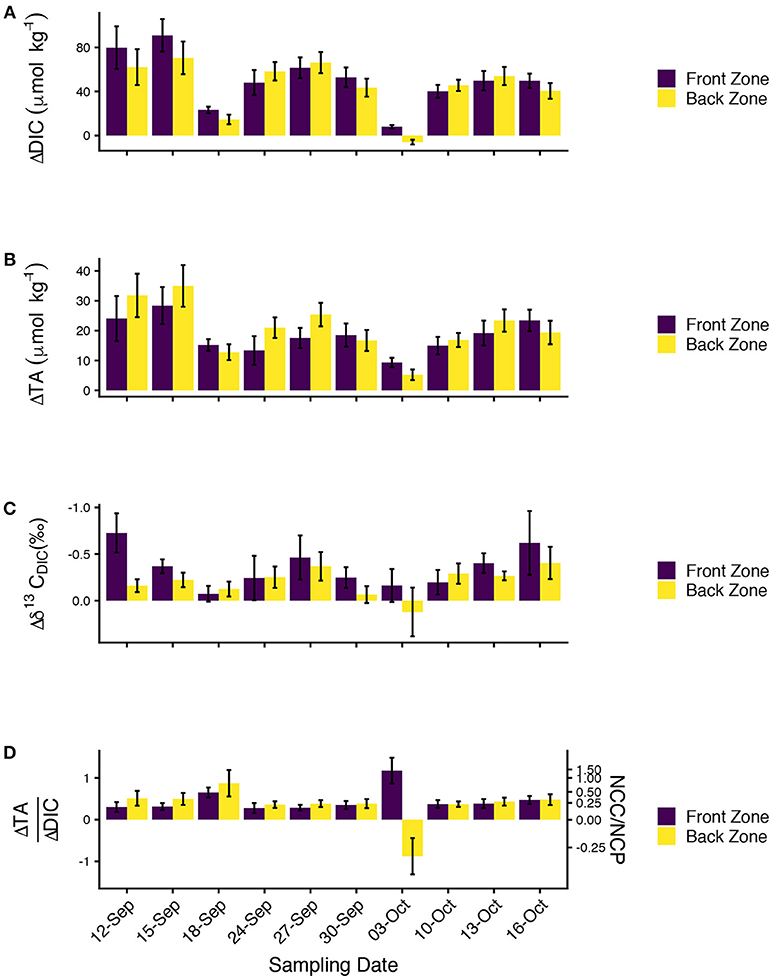
Figure 7. (A) ΔDIC, (B) ΔTA, (C) , and (D) ΔTA/ΔDIC for the front (purple) and back (yellow) zones for all ten sampling days showing biogeochemical changes in water chemistry due to community metabolism. All data are presented as mean ± S.E. Note that the y-axis on (C) is reversed for consistency with the other plots. The second axis on (D) shows the ratio of net community calcification (NCC) to net community production (NCP) inferred from the ΔTA/ΔDIC data.
We calculated ΔTA/ΔDIC because of it has long been used to reveal the relative importance of calcification and primary production on coral reefs (Suzuki and Kawahata, 2003; Andersson and Gledhill, 2013; Cyronak et al., 2018) with higher values signifying greater rates of calcification relative to primary production (Figure 7D). ΔTA/ΔDIC was typically between 0.25 and 0.5, although the back zone ΔTA/ΔDIC on 18-September-2016 was slighly higher (0.87). ΔTA/ΔDIC values on 03-October-2016 deviated from the patterns observed during the other nine sampling days, no doubt driven by the small |ΔDIC|, which led to large positive and negative values of ΔTA/ΔDIC because the ratio is sensitive to the magnitude of the denominator. We converted ΔTA/ΔDIC to NCC/NCP using the formula NCC/NCP = m/(2−m) where m is ΔTA/ΔDIC (Koweek et al., 2015a). Front zone NCC/NCP was 0.24 ± 0.03 and back zone NCC/NCP was 0.33 ± 0.06 (both mean ± S.E., excluding the data from O3-October-2016). The NCC/NCP calculations were consistent with expectations from the ecological survey (greater abundance of calcifiers in the back zone) with the uncertainty surrounding the estimates reflective of the uncertainty in the underlying ΔTA and ΔDIC data.
3.3. Isotopic Fractionation Factors
Mean ϵOM in the front zone spanned −16‰ to −14‰ while the mean back zone estimates ranged from –12‰ to –9‰ (Figure 8A). Mean ϵOM estimates showed minor sensitivity to the ϵCaCO3 value considered, with decreasing ϵOM at increasing ϵCaCO3 in both zones. However, the effect of ϵCaCO3 on mean ϵOM was small (2‰ and 3‰ in the front zone and back zone, respectively). Bootstrapped estimates of ϵOM in the front zone spanned –25‰ to –8‰ and in the back zone ranged from –20‰ to –4‰. (Figure 8A). Inclusion of the anomalous data from 03-October-2016 undoubtably increased the ranges on the ϵOM estimates, so we view these ranges from the bootstrapping as conservative. Back zone ϵOM was, on average, approximately 5‰ higher than front zone ϵOM, independent of the ϵCaCO3 value considered. Greater than 99 percent of the 10,000 bootstrap estimates of Δϵ for each value of ϵCaCO3 were greater than 0 (Figure 8B).
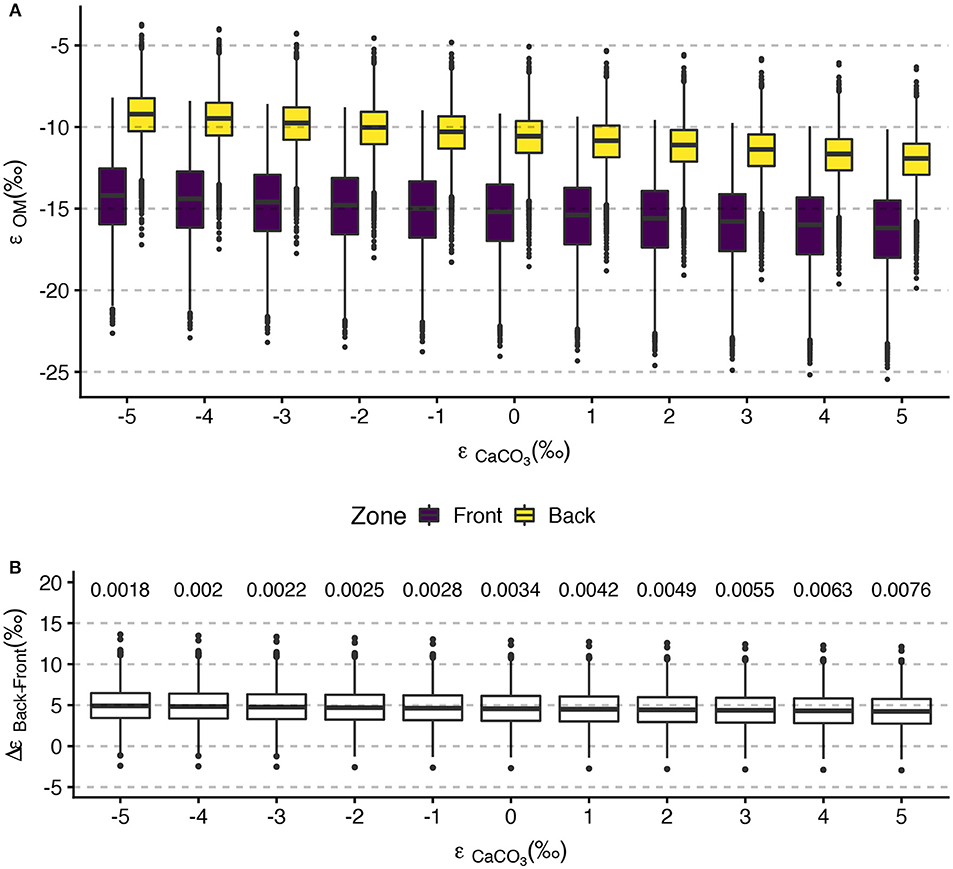
Figure 8. Tukey boxplots of (A) front zone and back zone bootstrapped ϵOM estimates for selected ϵCaCO3 values and (B) ΔϵOM between the back zone and front zone show the greater isotopic fractionation in the front zone relative to the back zone. Bootstrap values were calculated using mean ΔTA, ΔDIC, and on all sampling days. Boxplots in (A) are set at integer values of ϵCaCO3 and are offset for clarity. The numerical values above ΔϵOM display the proportion of bootstrap iterations less than or equal to 0.
3.4. Combining Δ s and ϵ s
We explored how ϵCaCO3 and ϵOM across the range of ΔTA and ΔDIC observed in this study affected because differences in must be observable in order to use differences in ϵ's to trace metabolic activity on a reef (Figure 9). When both ΔTA and ΔDIC are near the lower end of values observed in this data set (10 and 25 μmolkg−1, respectively, Figure 7A), the calculated ϵOM at fixed values of ϵCaCO3 for the front and back zone result in estimates of that were ~–0.15‰ and ~–0.11‰, respectively, a difference of only ~0.04‰ (Figure 9A). This difference between the two estimates lies below instrumental precision thresholds, thus the ϵ's of the front and back zones would fail to fractionate at detectable differences for the same ΔTA and ΔDIC. Since the isotope effects run parallel to the contour lines of constant in Figure 9A, the across both zones is approximately constant across the range of considered ϵ's.
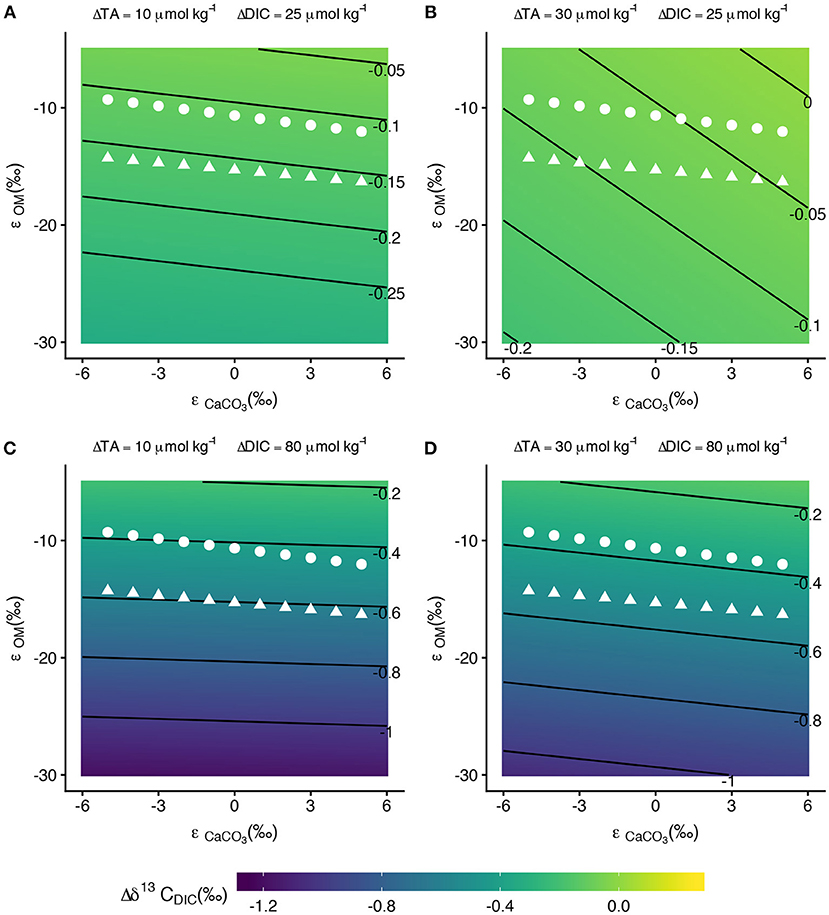
Figure 9. Contour plots of as functions of ϵCaCO3 and ϵOM for different values of ΔTA and ΔDIC. The white points on the plots show the mean ϵOM values from bootstrapping at selected ϵCaCO3 values for the front zone (triangles) and back zone (circles). Contours lines in (A,B) are spaced by 0.05 ‰ while contour lines in (C,D) are spaced by 0.2 ‰. With the exception of high ΔTA and low ΔDIC (B), is relatively insensitive to ϵCaCO3.
In conditions with high ΔTA and low ΔDIC (30 μmol kg−1 and 25 μmol kg−1, respectively), the contour lines are more steeply sloped (Figure 9B). At low values of ϵCaCO3 (~–5‰), for the front zone is ~–0.12‰ and for the back zone is ~–0.08‰ for ϵOM values calculated from the data. Again, these differences between front zone and back zone fractionation are likely too small for analytical instrumentation to detect. At the high end of ϵCaCO3 values considered, the for the front zone and back zone decrease to ~–0.05‰ and ~–0.03‰, respectively. for the front zone, and especially for the back zone, decreased below instrumental limits of detection. Positive ϵCaCO3 offsets the enrichment created by ϵOM < 0, which explains how the estimates of in Figure 9B decrease toward analytical precision limits as ϵCaCO3 becomes increasingly positive.
In conditions with high ΔDIC (80 μmolkg−1) the front zone was ~–0.5‰ to ~–0.6‰ and the back zone was ~–0.4‰, resulting in differences of between the two zones of between 0.15‰ and 0.2‰ (Figures 9C,D). High ΔDIC drives detectable differences in between the front zone and back zone. This condition was consistent for both the low and high ΔTA explored in this analysis (Figures 9C,D). High ΔDIC was necessary to distinguish between estimated using ϵOM from the front and back zones because of the small difference in ϵOM between the front and back zones (~5‰).
4. Discussion
4.1. Consideration of ϵ's
We found substantially different ϵOM between two ecologically distinct zones on a coral reef flat. In the front zone, where algae constituted nearly 50 percent of the benthic community and calcifiers contributed accounted for less than 25 percent of the benthic community, ϵOM was –16‰ to –14‰. In the back zone, where the abundance of calcifiers grew to ~40 percent and the algal abundance dropped to 35 percent, ϵOM increased to between –12‰ and –9‰. Since these two zones were sampled concurrently and at approximately the same depth, we cannot attribute the differences in fractionation to environmental factors such as time of day at sampling, light availability, water depth, and water temperature. Instead, we attribute these differences to the underlying ecological community. That is, we observed greater (more negative) ϵOM in the section the reef with more algae relative to the section of the reef with more calcifiers, regardless of the assumed ϵCaCO3 value. We hypothesize that the greater isotopic fractionation observed in the front zone was due to the prevalence of C3 photosynthesis among marine algae (Koch et al., 2013). C3 photosynthesis fractionates at approximately –25‰ to –29‰ (O'Leary, 1988). Photosynthetic isotopic fractionation in corals can be quite variable at –10‰ to –30‰ (Hayes, 1993; Carvalho et al., 2015), but is, on average, more positive than the fractionation found in marine algae. Thus, we hypothesize that the greater relative abundance of algae resulted in greater isotopic fractionation in the front zone relative to the back zone. Linking the variations in the ecological community to differences in ϵOM on a real reef system is an important step toward constraining the set of physical and biological conditions under which variability may act as a suitable biogeochemical tracer on reefs.
Our estimates of ϵOM in both the front and back zones are within range of other reported values. Smith and Kroopnick (1981) calculated a community-scale isotope effect (ϵ) of −18.6‰, which is more fractionation than our ϵOM values. However, directly comparing the ϵOM in this study to Smith and Kroopnick's (1981) ϵ is difficult because Smith and Kroopnick (1981) did not separate their estimates of fractionation into ϵOM and ϵCaCO3. If one assumed a negative value for ϵCaCO3 in Smith and Kroopnick's (1981) data, their ϵOM would be less negative than their community-scale ϵ and vice-versa. Applying the range of ϵCaCO3 considered in this study (–5‰ to 5‰) to the Smith and Kroopnick (1981) ϵ would result in a range of ϵOM between –23.6‰ to –13.6‰, which is lower, but still overlaps, with our ϵOM. Carvalho et al. (2015) similarly defined a community-scale DIC isotopic fractionation factor that aggregated photosynthesis and biogenic calcification, but excluded respiration and carbonate dissolution. They documented a much larger range in isotopic fractionation than we observed in our bootstrap analysis, however their mean isotope effect estimates tended to converge between –15‰ and –10‰. Given that our observed did not diverge far from 0, the ϵOM reported here should be close to the δ13C of organic matter in members of the reef community. Heikoop et al. (2000) found coral tissue δ13C from a pan-tropical data set ranged from –16‰ to –10‰. Smith (Smith et al., 1985) found that reef organic material (plankton, benthic macroalgae, and corals) ranged from –28‰ to –12‰. This collective evidence of similarity between reef material organic δ13C and our estimates of ϵOM gives confidence in our estimates.
ϵOM as calculated in this study is an imperfect representation of the many carbon fluxes occuring simultaneously on reef systems. ϵOM aggregates the isotopic fractionation due to all photosynthesis, and their respective pathways, as well as all respiratory processes (including those of fish and other mobile organisms). Photosynthetic preference for either CO2 or will also affect estimates of ϵOM because of the equilibrium fractionation between CO2 and ( ~–10‰) (Zeebe and Wolf-Gladrow, 2001), as well as the different photosynthetic pathways and degrees of “leakage” between photosynthetic cells and the ambient seawater (Carvalho et al., 2015). Algal respiration may exhibit some small isotopic fractionation (~3‰), with resulting changes reflected in the (Carvalho and Eyre, 2011). We also ignored any potential contributions of air/sea CO2 fluxes to the variability because we calculated small air/sea CO2 fluxes. However, these fluxes contribute to variability because of the known fractionation between DIC and CO2 in the atmosphere (ϵDIC−CO2atm ~8‰ to 10‰, temperature-dependent) (Zhang et al., 1995).
We regret that we were unable to sample during nighttime hours because nighttime samples would have been useful for quantifying respiratory fluxes of DIC and the changes in associated with replenishment from isotopically light respired CO2. Such information may have helped us partition the photosynthetic and respiratory contributions to ϵOM. As an example, we observed exceptionally low values on 03-October-2016 and 16-October-2016. We attribute these anomalously isotopically light samples to accumulation of respiratory CO2 during their transit across the reef (Figure 6). Water moving over the reef flat did not travel above an impermeable benthic substrate, but rather traveled through a semi-permeable substrate due to holes and cracks in the substrate, as well as areas of sediment cover. Visual inspection of the flow paths by following the fate of the released Rhodamine WT during this study revealed flow through through these cracks in the shallow back zone of the study area. These two exceptionally isotopically light samples may have been sampled after traveling through gaps and cracks in the benthic substrate, during which time the water accumulated respiratory CO2 from the metabolic activity of organisms living within the benthic substrate. Independent estimates of the ϵ for community respiration would have allowed us to more rigorously test this hypothesis.
Our ϵOM estimates are for one reef flat during one season in one year. Future work should expand the sampling to account for potential seasonal and inter-annual variations in metabolism, and ϵOM, within individual reef systems. Sampling across multiple reef systems will add independent observations and increase the statistical rigor with which hypotheses about the connections between benthic community composition and ϵ's can be tested.
4.2 Δδ13CDIC Model Assumptions
We developed our model of Δδ13CDIC (Equation 6) in order to explore the combination of ΔDIC, ΔTA, and ϵ's necessary to drive observable and differentiable changes in . We constrained the model using ranges in ΔDIC and ΔTA observed in the study, along with calculated values of ϵOM across a conservative range of assumed ϵCaCO3 values. However, Equation (6) also shows that is inversely proportional to DICo. While we did not consider DICo variability in Figure 9, incorporating realistic variability in DICo (comparing the middle and back lines) of ~5 percent (Figure 3) would lead to differences in estimates of up to 0.03‰ to 0.04‰ (at high ΔDIC and ΔTA). While this difference is small, it can amplify or attentuate the differences in between different sections of a reef depending upon the configuration of the benthic community. For instance, DICo leaving the back zone (the back line DIC) was less than the front zone DICo (the middle line DIC). Holding everything else constant, these differences in DICo would act to increase the in the back zone relative to the front zone. However, since the front zone already had stronger fractionation due to its greater algal abundance, the net effect would be to decrease the differences in between the front zone and back zone (at equivalent ΔDIC and ΔTA).
4.3. Study Limitations and Future Considerations
A few aspects of the study design hindered our ability to develop further inference into the controls on carbon isotopic fractionation at our study site. First, we were unable to make flow speed estimates across our study site which prevented us from being able to calculate NCC and NCP from our ΔDIC and ΔTA in the two zones (Equation 2). As described above, the study site was shallow during sampling periods, and this inhibited the use of current meters for flow speed estimates during sampling. While we assumed steady-state equivalent mass fluxes of water across both zones during the short sampling period (<5 min), direct estimates of the water flow would have allowed us to evaluate this assumption in Equation (4), and therefore, potentially refine our ϵOM estimates. Future work would be enhanced by direct measurements of flow speed and directionality throughout the study site. As discussed in Cyronak et al. (2018), ΔTA and ΔDIC measurements are useful for understanding individual reef metabolism, but having NCC and NCP estimates greatly facilitates inter-reef comparisons.
Second, we observed high variability along and across our sampling lines (Figures 5–7). As we have described above, this study was largely a study of opportunity conducted concurrently with the Albright et al. (2018) CO2 enrichment study and therefore the study site and sampling locations were pre-determined. A longer reef flat as a study site would have resulted in longer contact time between the reef community and the overlying water, which presumably would have decreased the variability in , ΔTA, and ΔDIC estimates, resulting in better estimates of ϵOM. Our simple model of (Figure 9) provides a starting point for choosing sampling locations sufficiently far enough apart to generate observable ΔTA, ΔDIC, and . Our along-line variability highlighted the high spatial heterogeneity present in reef environments, possibly due to lateral variations in flow rate, and thus contact time with the benthic community as the water flowed over the reef. However, the cause of these along-line variations cannot be determined conclusively without flow rate measurements. The across-line and along-line variability highlight the need for more lateral sampling during flow respirometry-style studies, which often oversimplify coral reef biogeochemical processes as one-dimensional along the flow path.
4.4. Summary
We explored small-scale spatial variations in ϵOM along a reef flat in the Great Barrier Reef. The ecological survey of the study site revealed differences in calcifier and algal abundance between the two zones of the reef flat, with the front zone featuring a lower percent cover of calcifiers and a higher percent cover of non-calcifying algae when compared to the back zone (Figure 2). had high variability, but revealed a consistent pattern of enrichment during transit across the reef, with front zone ϵOM exhibiting ~5‰ greater enrichment than the back zone (Figure 8). The ϵOM estimates complemented the ΔTA/ΔDIC data, and inferred NCC/NCP, which generally exhibited a greater ratio of calcification to primary production in the back zone relative to the front zone. At the upper end of the observed ΔTA and ΔDIC, ϵOM estimates between the front and back zone have the potential to yield observable differences in enrichment. is most likely to act as an additional useful biogeochemical tracer on coral reefs when the ϵ's, ΔTA, ΔDIC, and hydrodynamic conditions are well characterized.
Data Availability Statement
Data used in this study is publicly avaiable at: https://github.com/dkoweek/one_tree_island_DIC_isotope_data.
Author Contributions
DAK conceived the study with input from KC. DAK, RA, YT, AN, and KC collected samples on a field expedition led by RA and KC. RA conducted the ecological survey. YT and AN analyzed carbonate chemistry data. DAM and AF developed the stable isotope analytical methods with AF analyzing the samples and DAM processing the isotopic data. DAK led the overall data analysis. DAK wrote the paper with input from all co-authors.
Conflict of Interest Statement
The authors declare that the research was conducted in the absence of any commercial or financial relationships that could be construed as a potential conflict of interest.
Acknowledgments
We thank Paul Quay and Johnny Stutsman at the University of Washington for their assistance with cross-validation of our analytical methods. Conversations with Jennifer Johnson, Shawna Foo, and Philip Brodrick helped improve an earlier version of this manuscript. Kenny Wolfe, Lilian Caldeira, Tanya Rivlin, Roberta Johnson, Yana Nebuchina, Jordan Young, and the One Tree Island Research Station staff provided field assistance. We thank the reviewers whose comments improved earlier versions of this manuscript.
Supplementary Material
The Supplementary Material for this article can be found online at: https://www.frontiersin.org/articles/10.3389/fmars.2018.00520/full#supplementary-material
References
Albright, R., Benthuysen, J., Cantin, N. E., Caldeira, K., and Anthony, K. R. (2015). Coral reef metabolism and carbon chemistry dynamics of a coral reef flat. Geophys. Res. Lett. 42, 3980–3998. doi: 10.1002/2015GL063488
Albright, R., Langdon, C. J., and Anthony, K. R. (2013). Dynamics of seawater carbonate chemistry, production, and calcification of a coral reef flat, central Great Barrier Reef. Biogeosciences 10, 6747–6758. doi: 10.5194/bg-10-6747-2013
Albright, R., Takeshita, Y., Koweek, D. A., Ninokawa, A., Wolfe, K., Rivlin, T., et al. (2018). Carbon dioxide addition to coral reef waters suppresses net community calcification. Nature 555, 516–519. doi: 10.1038/nature25968
Andersson, A. J., and Gledhill, D. (2013). Ocean acidification and coral reefs: effects on breakdown, dissolution, and net ecosystem calcification. Annu. Rev. Mar. Sci. 5, 321–348. doi: 10.1146/annurev-marine-121211-172241
Barnes, D. J. (1983). Profiling coral reef productivity and calcification using pH and oxygen electrodes. J. Exp. Mar. Biol. Ecol. 66, 149–161.
Bockmon, E. E., and Dickson, A. G. (2014). A seawater filtration method suitable for total dissolved inorganic carbon and pH analyses. Limnol. Oceanogr. Methods 12, 191–195. doi: 10.4319/lom.2014.12.191
Carvalho, M. C., and Eyre, B. D. (2011). Carbon stable isotope discrimination during respiration in three seaweed species. Mar. Ecol. Prog. Ser. 437, 41–49. doi: 10.3354/meps09300
Carvalho, M. C., Santos, I. R., Maher, D. T., Cyronak, T., McMahon, A., Schulz, K. G., et al. (2015). Drivers of carbon isotopic fractionation in a coral reef lagoon: predominance of demand over supply. Geochim. Cosmochim. Acta 153, 105–115. doi: 10.1016/j.gca.2015.01.012
Cyronak, T., Andersson, A. J., Langdon, C. J., Albright, R., Bates, N. R., Caldeira, K., et al. (2018). Taking the metabolic pulse of the world's coral reefs. PLoS ONE 13:e0190872. doi: 10.1371/journal.pone.0190872
Falter, J. L., Lowe, R. J., Atkinson, M. J., and Cuet, P. (2012). Seasonal coupling and de-coupling of net calcification rates from coral reef metabolism and carbonate chemistry at Ningaloo Reef, Western Australia. J. Geophys. Res. Oceans 117, 1–14. doi: 10.1029/2011JC007268
Gattuso, J.-P., Pichon, M., Delesalle, B., and Frankignoulle, M. (1993). Community metabolism and air-sea CO2 fluxes in a coral reef ecosystem (Moorea, French Polynesia). Mar. Ecol. Prog. Ser. 96, 259–267. doi: 10.3354/meps096259
Gischler, E., Swart, P. K., and Lomando, A. J. (2009). Stable isotopes of carbon and oxygen in modern sediments of carbonate platforms, barrier reefs, atolls and ramps: patterns and implications. Int. Assoc. Sedimentol. Spec. Publ. 41, 61–74. doi: 10.1002/9781444312065.ch5
Hayes, J. (1993). Factors controlling 13C contents of sedimentary organic compounds: principles and evidence. Mar. Geol. 113, 111–125.
Heikoop, J., Dunn, J., Risk, M., Tomascik, T., Schwarz, H., Sandeman, I., et al. (2000). δ15N and δ13C of coral reef tissue show significant inter-reef variation. Coral Reefs 19, 189–193. doi: 10.1007/s003380000092
Kinsey, D. W. (1978). Productivity and calcification estimates using slack-water periods and field enclosures. Monogr. Oceanogr. Methodol. 5, 439–468.
Koch, M., Bowes, G., Ross, C., and Zhang, X. H. (2013). Climate change and ocean acidification effects on seagrasses and marine macroalgae. Global Change Biol. 19, 103–132. doi: 10.1111/j.1365-2486.2012.02791.x
Koweek, D. A., Dunbar, R. B., Monismith. S. G., Mucciarone, D. A., Woodson, C. B., and Samuel. L (2015a). High-resolution physical and biogeochemical variability from a shallow back reef on Ofu, American Samoa: an end-member perspective. Coral Reefs 34, 979–991. doi: 10.1007/s00338-015-1308-9
Koweek, D. A., Dunbar, R. B., Rogers, J. S., Williams, G. J., Price, N. N., Mucciarone, D. A., et al. (2015b). Environmental and ecological controls of coral community metabolism on Palmyra Atoll. Coral Reefs 34, 339–351. doi: 10.1007/s00338-014-1217-3
Kwiatkowski, L., Albright, R., Hosfelt, J., Nebuchina, Y., Ninokawa, A., Rivlin, T., et al. (2016). Interannual stability of organic to inorganic carbon production on a coral atoll. Geophys. Res. Lett. 43, 3880–3888. doi: 10.1002/2016GL068723
Lantz, C. A., Atkinson, M. J., Winn, C. W., and Kahng, S. E. (2014). Dissolved inorganic carbon and total alkalinity of a Hawaiian fringing reef: chemical techniques for monitoring the effects of ocean acidification on coral reefs Coral Reefs 33, 105–115. doi: 10.1007/s00338-013-1082-5
Long, M. C., Dunbar, R. B., Tortell, P. D., Smith, W. O., Mucciarone, D. A., and DiTullio, G. R. (2011). Vertical structure, seasonal drawdown, and net community production in the Ross Sea , Antarctica. J. Geophys. Res. Oceans 116, 1–19. doi: 10.1029/2009JC005954
McMahon, A., Santos, I. R., Cyronak, T., and Eyre, B. D. (2013). Hysteresis between coral reef calcification and the seawater aragonite saturation state. Geophys. Res. Lett. 40, 4675–4679. doi: 10.1002/grl.50802
Nakamura, T., and Nakamori, T. (2008). Estimation of photosynthesis and calcification rates at a fringing reef by accounting for diurnal variations and the zonation of coral reef communities on reef flat and slope: a case study for the Shiraho reef, Ishigaki Island, southwest Japan. Coral Reefs 28, 229–250. doi: 10.1007/s00338-008-0454-8
Odum, H. T., and Odum, E. P. (1955). Trophic structure and productivity ofa windward coral reef community on Eniwetok Atoll. Ecol. Monogr. 25, 291–320.
Page, H. N., Andersson, A. J., Jokiel, P. L., Rodgers, K. S., Lebrato, M., Yeakel, K. L., et al. (2016). Differential modification of seawater carbonate chemistry by major coral reef benthic communities. Coral Reefs 35, 1311–1325. doi: 10.1007/s00338-016-1490-4
Page, H. N., Courtney, T. A., Collins, A., Carlo, E. H. D., and Andersson, A. J. (2017). Net community metabolism and seawater carbonate chemistry scale non-intuitively with coral cover. Front. Mar. Sci. 4:161. doi: 10.3389/fmars.2017.00161
Riebesell, U., Fabry, V. J., Hansson, L., and Gattuso, J.-P. (2010). Guide to Best Practices for Ocean Acidification Research and Data Reporting. Luxembourg: European Union.
Sargent, M. C., and Austin, T. S. (1949). Organic productivity of an atoll Eos Trans. Am. Geophys. Union 30, 245–249.
Shamberger, K. E. F., Feely, R. A., Sabine, C. L., Atkinson, M. J., DeCarlo, E., Mackenzie, F. T., et al. (2011). Calcification and organic production on a Hawaiian coral reef. Mar. Chem. 127, 64–75 doi: 10.1016/j.marchem.2011.08.003
Shaw, E. C., McNeil, B. I., and Tilbrook, B. (2012). Impacts of ocean acidification in naturally variable coral reef flat ecosystems. J. Geophys. Res. Oceans 117, 1–14. doi: 10.1029/2011JC007655
Shaw, E. C., Phinn, S. R., Tilbrook, B., and Steven, A. (2015). Natural in situ relationships suggest coral reef calcium carbonate production will decline with ocean acidification. Limnol. Oceanogr. 60, 777–788. doi: 10.1002/lno.10048
Silverman, J., Kline, D. I., Johnson, L., Rivlin, T., Schneider, K., Erez, J., et al. (2012). Carbon turnover rates in the One Tree Island reef: a 40-year perspective. J. Geophys. Res. Biogeosci. 117, 1–16. doi: 10.1029/2012JG001974
Smith, S. V., and Key, G. (1975). Carbon dioxide and metabolism in marine environments. Limnol. Oceanogr. 20, 493–495. doi: 10.4319/lo.1975.20.3.0493
Smith, S. V., and Kroopnick, P. (1981). Carbon-13 isotopic fractionation as a measure of aquatic metabolism. Nature 294, 252–253.
Smith, S. V., Schneider, R. C., and Tribble, G. W. (1985). “Carbon isotopic balance in coral reef ecosystems,”in Proceedings of the Fifth International Coral Reef Congress, Vol. 3 (Tahiti), 445–450.
Sogin, E. M., Anderson, P., Williams, P., Chen, C. S., and Gates, R. D. (2014). Application of 1H-NMR metabolomic profiling for reef-building corals. PLoS ONE 9:e111274. doi: 10.1371/journal.pone.0111274
Stat, M., Huggett, M. J., Bernasconi, R., Dibattista, J. D., Berry, T. E., Newman, S. J., et al. (2017). Ecosystem biomonitoring with eDNA: metabarcoding across the tree of life in a tropical marine environment. Sci. Rep. 7, 1–11. doi: 10.1038/s41598-017-12501-5
Suzuki, A., and Kawahata, H. (2003). Carbon budget of coral reef systems: an overview of observations in fringing reefs, barrier reefs and atolls in the Indo-Pacific regions. Tellus B 55, 428–444. doi: 10.1034/j.1600-0889.2003.01442.x
Takeshita, Y., McGillis, W. R., Briggs, E. M., Carter, A. L., Donham, E. M., Martz, T. R., et al. (2016). Assessment of net community production and calcification of a coral reef using a boundary layer approach. J. Geophys. Res. Oceans 121, 5655–5671. doi: 10.1002/2016JC011886
Yeakel, K. L., Andersson, A. J., Bates, N. R., Noyes, T. J., Collins, A., and Garley, R. (2015). Shifts in coral reef biogeochemistry and resulting acidification linked to offshore productivity. Proc. Natl. Acad. Sci. U.S.A. 112, 14512–14517. doi: 10.1073/pnas.1507021112
Zeebe, R. E., and Wolf-Gladrow, D. A. (2001). Carbon Dioxide in Seawater: Equilibrium, Kinetics, and Isotopes. ed D Halpern. Elsevier Ltd.
Keywords: coral reefs, stable isotopes, carbonate chemistry, calcification, primary production, Great Barrier Reef, marine chemistry, biogeochemistry
Citation: Koweek DA, Forden A, Albright R, Takeshita Y, Mucciarone DA, Ninokawa A and Caldeira K (2019) Carbon Isotopic Fractionation in Organic Matter Production Consistent With Benthic Community Composition Across a Coral Reef Flat. Front. Mar. Sci. 5:520. doi: 10.3389/fmars.2018.00520
Received: 12 April 2018; Accepted: 21 December 2018;
Published: 25 January 2019.
Edited by:
Eric 'Pieter Achterberg, GEOMAR Helmholtz Center for Ocean Research Kiel, GermanyReviewed by:
Matheus Carvalho, Southern Cross University, AustraliaBenoit Thibodeau, The University of Hong Kong, Hong Kong
Copyright © 2019 Koweek, Forden, Albright, Takeshita, Mucciarone, Ninokawa and Caldeira. This is an open-access article distributed under the terms of the Creative Commons Attribution License (CC BY). The use, distribution or reproduction in other forums is permitted, provided the original author(s) and the copyright owner(s) are credited and that the original publication in this journal is cited, in accordance with accepted academic practice. No use, distribution or reproduction is permitted which does not comply with these terms.
*Correspondence: David A. Koweek, dkoweek@carnegiescience.edu