Incorporation of Feed and Fecal Waste From Salmon Aquaculture in Great Scallops (Pecten maximus) Co-fed by Different Algal Concentrations
 Maria Bergvik
 Lene Stensås1†
  Yngvar Olsen
- 1Department of Biology, Norwegian University of Science and Technology, Trondheim, Norway
- 2Environment and New Resources, SINTEF Ocean, Trondheim, Norway
- 3Institute of Marine Research, Bergen, Norway
Juvenile scallops of Pecten maximus were studied to see the capability to clear out and incorporate salmon feed and feces (30 μg L-1). Algae were also given, in a low and high concentration in addition to feed and feces, to mimic a winter and summer situation in Norwegian waters. Rhodomonas baltica and Chaetoseris muelleri were provided in a concentration of 50 μg L-1 and 300 μg L-1. The feeding trial lasted for 27 days. Clearance rate was measured to study filtration characteristics, while fatty acid profiling and stable isotopes of nitrogen and carbon were used to trace the uptake of salmon feed and feces in the digestive gland and muscle of juvenile scallops (30–35 mm shell height). The results show that the scallops could clear out and retain both salmon feed and feces particles, although at a statistically lower clearance rate than the algae. Fatty acid profiling revealed that the scallops assimilated and incorporated the consumed salmon feed and feces, given with either high or low algae concentrations, in their tissues, where the fatty acid C18:1n9 was used as a tracer fatty acid. The digestive gland of the scallops that were fed salmon feed and feces contained a higher share of C18:1n9 than those that were only fed algae. The digestive gland reflected the fatty acid composition of the diet, while the fatty acid composition of the muscle, which also changed, reflected a more complex relation between diet and metabolic processes in the tissue. The use of stable isotopes of carbon and nitrogen to trace food sources was inconclusive in this study due to low differences between samples fed different feeds. Fatty acid profiling was a more sensitive method for tracing low concentrations of salmon feed and feces in the algae diet of scallops. Our results suggest that P. maximus could be a candidate for integrated multitrophic aquaculture (IMTA) and that scallops have the potential to utilize small particles of wasted salmon feed and feces during a winter situation with low phytoplankton concentration and during an algal bloom in Norwegian waters.
Introduction
The production of Norwegian salmon is estimated to increase from 1.2 million tons to 3 million tons, resulting in the use of 3.6 million tons of feed per year in 2030 (Olafsen et al., 2012). A considerable fraction of such feed is released to surrounding waters as respiratory products, feces and uneaten feed, with total losses estimated to be 62% C, 57% N, and 76% P of the total feed input (Wang et al., 2013). The increasing amount of nutrients and organic loads released from the Norwegian aquaculture industry are causing environmental concerns (Taranger et al., 2014). Emission of nutrients can result in eutrophication (Folke et al., 1994), although highly dependent on the capacity of the recipient waters to assimilate the nutrients (Wang et al., 2012). Particle discharge will increase the organic load and could alter the sediment chemistry and lead to changes in the benthic communities (Carroll et al., 2003).
The integration of species that are able to filter out particulate nutrient wastes originating from fish farms in integrated multitrophic aquaculture (IMTA) systems could mitigate the possible negative environmental effects of salmon farming. In IMTA, the particulate nutrient wastes of feed and feces can be consumed by organic extractive filter feeding organisms, such as mussels (Redmond et al., 2010; Handå et al., 2012a,b), while the dissolved inorganic nutrients can be taken up by inorganic extractive organisms, such as seaweeds (Chopin et al., 2001; Broch and Slagstad, 2012; Handå et al., 2013). In addition to reducing environmental influence, IMTA can add value to production because more biomass can be produced on the same feed resource (Buschmann et al., 2001; Chopin et al., 2001; Troell et al., 2009). Blue mussels (Mytilus edulis) have been shown to be capable of incorporating nutrient wastes from salmon aquaculture (Redmond et al., 2010; Handå et al., 2012a,b). Mussels have also shown higher growth adjacent to fish farms (e.g., Wallace, 1980; Lander et al., 2004; Peharda et al., 2007; Sara et al., 2009), but their efficiency and the potential for industrial application has been questioned (Handå et al., 2012b; Cranford et al., 2013). While blue mussels are a low-value species, scallops like Pecten maximus are an attractive, highly valued species.
The great scallop (P. maximus) is a filter feeder that lives on the seabed at a depth of 10–30 m (Shumway and Parsons, 2006). Suspended detrital material and phytoplankton are its main food source, and it has been suggested that such scallops are able to exploit food particles associated with surface sediments (MacDonald et al., 2006). It has also been shown that the organic material from the feed and fecal waste resulting from salmon aquaculture can contribute to the diet of pectinids (Seguel et al., 1998). Moreover, dead particulate organic material (detritus) originating from degraded macroalgae can be a potential food source when ambient phytoplankton concentrations are low (Cranford and Grant, 1990), and P. maximus has shown its ability to degrade algal fucoidan (Daniel et al., 1999), suggesting that scallops also can utilize particles from degraded seaweed tissue in IMTA. However, experiments have revealed that scallops have a lower retention efficiency for food particles smaller than 5–7 μm (MacDonald et al., 2006). This could be a challenge because particles close to a salmon farm have been shown to be between 1 and 10 μm (Lander et al., 2013). These smaller particles are available in the water column as suspended particles and will spread out from the farm, while larger particles will sink more rapidly to seabed (Bannister et al., 2016). The availability of suspended particles in the water column will depend on depth, current, sinking velocity, how fast the particles dissolve and the feeding regime at the farm (Troell and Norberg, 1998; Lander et al., 2013; Bannister et al., 2016; Husa et al., 2017).
Fatty acid profiling and analysis of stable isotopes are classic tools used to study the incorporation of food particles in bivalves. These methods are used to study trophic relations and to identify potential food sources (Peterson and Fry, 1987; Dalsgaard et al., 2003). They have also been used to trace waste particles released from fish farms (Gao et al., 2006; Handå et al., 2012a; Irisarri et al., 2014, 2015). Stable isotopes of carbon and nitrogen can reveal complex interactions of food sources, and are traditionally used for ecological and population biological studies (Peterson and Fry, 1987). Different tissues have different metabolic turnover rates. Muscle have a slow turnover rate and could reflect long term changes in diet, whereas digestive gland and gonads have a rapid turnover rate and can reflect a recent diet (Tieszen et al., 1983; Lorrain et al., 2002; Logan et al., 2006). Analysis of tissues with a high turnover rate makes stable isotope ratios possible to use in shorter experiments with shifts in diet (Paulet et al., 2006).
The digestive gland is the main organ for nutrient digestion and lipid storage in P. maximus and other pectinids (Giese, 1966). The lipid stored in the digestive gland can take two forms: small lipid droplets (when stored in the tubular area) or a form similar to that of adipocyte cells (when stored in the acinus areas of the digestive gland) (Le Pennec et al., 2001). These lipids are proposed to have different roles in scallops, with the small droplets serving as a short-term energy storage for daily metabolism and somatic growth and the adipose-like lipid as a long-term lipid storage that, for example, can be used for the maturation of gametes (Le Pennec et al., 2001). There is then a transfer of lipids from the digestive gland to the female gonads for egg production (Strohmeier et al., 2000). The fatty acids of the lipid in the digestive gland have been shown to reflect the diet of pectinids. Moreover, the digestive gland has a rapid metabolic turnover, which makes it a suitable organ to analyze in studies of nutrition, trophic relations and the tracing of feed components with both fatty acids and stable isotopes.
The primary objective of the present experiment was to study the capability of scallops to incorporate salmon feed and feces particles in “high” and “low” concentrations phytoplankton environments. Doing so simulated IMTA scenarios during the spring bloom and the winter period, in the temperate coastal waters of Northern Europe. Secondary objectives were to evaluate the importance of the different components as food resources in “high” and “low” phytoplankton environments and to compare the use of fatty acid profiling and stable isotopes as tracers of particulate waste nutrients from salmon aquaculture.
Materials and Methods
Experimental Design
The experiment followed a factorial design where juvenile scallops (30–35 mm) were given diets consisting of algae (Rhodomonas baltica and Chaetoceros muelleri) in combination with either salmon feed or salmon feces. The algae were fed in a high concentration (300 μg C L-1) and in a low concentration (50 μg C L-1). The controls were given algae in high and low concentrations, resulting in six different treatments (Table 1). The high and low algae concentration were based on POC values in Handå et al. (2012b) and Etter et al. (2017) from middle Norway. The winter values of POC were typical 100 μg POC L-1 in both references with low values of Chl a. The value of 50 μg C L-1 was chosen as an approximation of a winter situation. POC varied between 200 and 500 μg POC L-1 during spring bloom, and 300 μg C L-1 was chosen to be an average spring bloom value of carbon from seston (Handå et al., 2012a; Etter et al., 2017). Salmon feed and salmon feces were fed in relatively low concentrations separately (30 μg C L-1) and were provided in addition to the two different concentrations of algae. The low concentration of waste particles was chosen to mimic a low availability of particles in surface waters from salmon farming (Bannister et al., 2016). A small fraction of the waste (5–10%), of smaller size, will be suspended particles in the surface waters (Husa et al., 2017) and could be available for filter feeders kept close to the farm. Although the particulate effluents from farms have shown to be patchy and to come in pulses (Troell and Norberg, 1998; Brager et al., 2016), we decided to mimic a constant low supply of waste particles in our experiment.
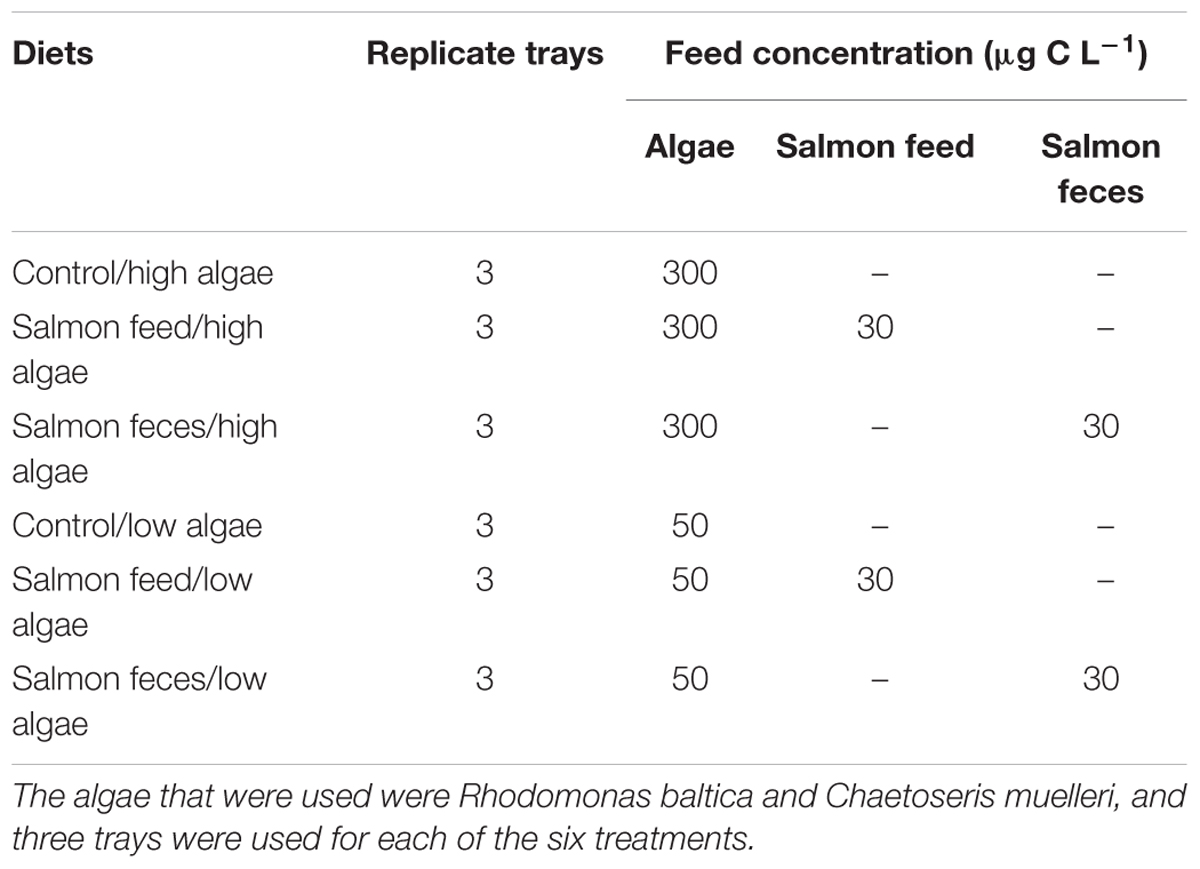
Table 1. Diets used in the experiment.
Three trays with 30 scallops each were deployed for each treatment. The experiment lasted for 27 days, and is considered long enough to give responses in both fatty acids and stable isotopes (Paulet et al., 2006; Redmond et al., 2010; Handå et al., 2012b). The photoperiod was 12 h with lights and 12 h in darkness.
The algae diet consisted of R. baltica (CloneNIVA 5/9) and C. muelleri (CCAP1010/3), with R. baltica constituting 90% of the total carbon content. C. muelleri was chosen because of the nutritional quality in terms of lipids and carbohydrates for scallops (Parrish et al., 1999; Reitan, 2011). R. baltica is also regarded to be of high nutritional quality because of a high content of polyunsaturated fatty acids (Gagné et al., 2010; Brown and Blackburn, 2013), and was also used for blue mussels in the laboratory trial of Handå et al. (2012b). Semi-continuous cultures of R. baltica and C. muelleri were cultured in polycarbonate tubes (200 L) and glass bulbs (20 L), respectively, using autoclaved seawater enriched with Conwy medium (Walne, 1974) and with a continuous supply of CO2. The C. muelleri was also supplied with silicate that diatoms need to build their cell walls with the silica containing frustule. Every day prior to feeding, the algal density was measured with a Beckman Coulter-Counter Multisizer 3, and the feeding suspensions were mixed with 1 μm of filtered seawater to obtain the correct concentration. The salmon feed in the diet was Optiline Premium 2500 (Skretting Ltd.), and salmon feces were collected from a 6-kg salmon (Salmo salar) that was anesthetized with benzoak prior to stripping at Farmannsøya fish farm (Marine Harvest). Salmon feces was freeze dried and kept at -18°C to preserve the nutrients. Freeze drying is considered as a gentle preservation method. The carbon content of the diets was analyzed on a Carlo Erba CHN model 1106 elemental analyzer. Salmon feed and freeze dried salmon feces contained 50% and 30% C dw-1, respectively. Each day, feed pellets and freeze dried salmon feces were weighed (Mettler Toledo XA204), homogenized (Elektrolux ASB 2600) with 1 μm of filtered seawater and diluted to obtain the correct concentration for the diets. The diets were then placed in 30-L cans with aeration to provide a uniform feed distribution.
The scallops were provided by ScalPro (Bergen, Norway). After transport and 14 days prior to the experiment, they were immediately placed in flow-through raceways (40 × 20 × 400 cm, 320 L volume, 1.6 L min-1 exchange rate) in a temperature-controlled room (12°C) for acclimatization. R. baltica was continuously added to the raceway with peristaltic pumps (Watson-Marlow 505U) in order to keep the algal concentration at 15 μg C L-1 in the raceway. Seawater (salinity 35) was pumped from a depth of 70 m from the Trondheim fjord. It was then filtered through sand and treated with UV light being stored in aerated reservoirs in order to regulate the temperature. The water was further filtered with two aerially coupled CUNO AquaPure filters with nominal retention of particles (>10 μm and >1 μm, respectively) before entering the experimental setup.
After acclimatization, 30 scallops with a shell height of 30–36 mm were placed in each tray (n = 3 for each treatment) with flowing seawater. The temperatures of each tray were measured every day and were on average 12.6 ± 0.2°C. The design of the trays was similar to that described by Handå et al. (2012b), who studied blue mussels. Some adjustments were made for the present experiment. A perforated plastic plate (2-mm holes) was placed across the tray (40 × 12 × 70 cm, 30 L volume) to create a mixing zone for the water and feed inflow, providing an even feed distribution and preventing turbulence in the water stream (Figure 1). The rate of water exchange was 6 L h-1. Along with aquarium pumps (New-Jet 1), this exchange rate generated a stream of water along the tray. The aquarium pumps pumped water from the distal end to the mixing zone at a rate of 3 L min-1, meaning that the water was exchanged six times per hour. Regulation of the water level was achieved by placing a vertical discharge pipe (12 cm) at the distal end. Food was added continuously at a rate of 1.5 mL of food suspended per minute with peristaltic pumps (Watson-Marlow 505U) into the mixing zone.
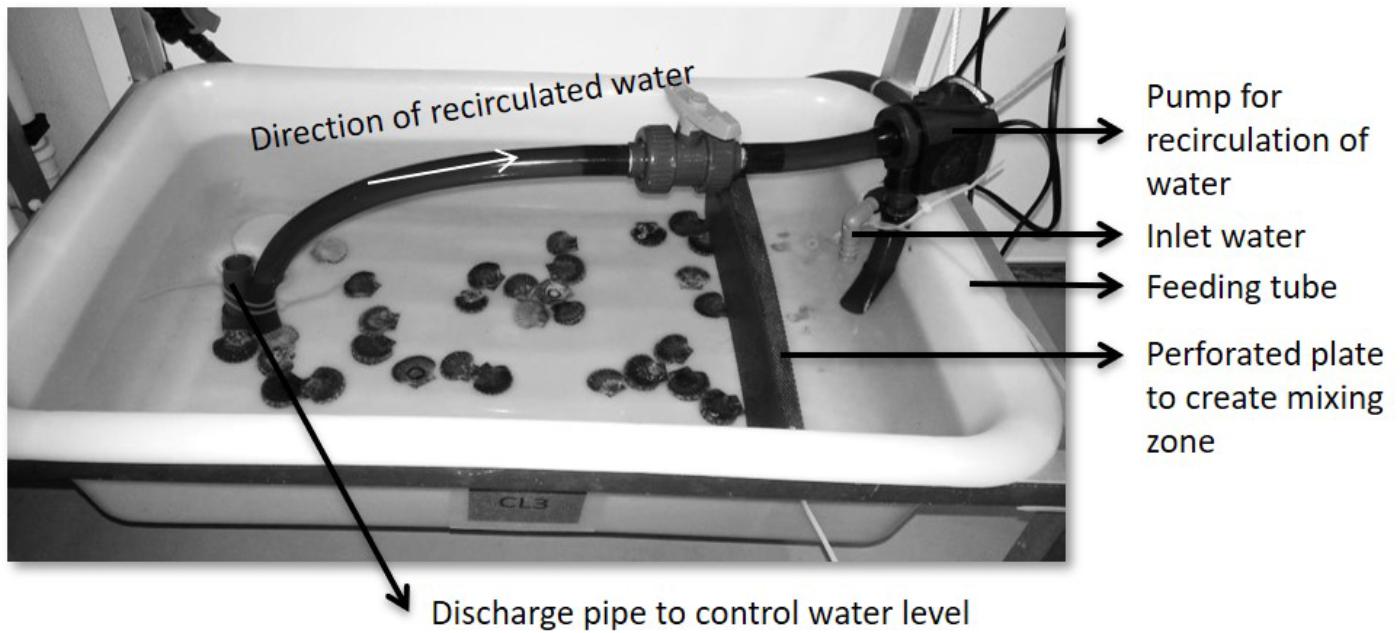
Figure 1. Overview of the experimental setup of each tray, with water inflow and feeding tube, pump to achieve recirculation of water, perforated plate to create a mixing zone and the discharge pipe for water-level regulation.
Growth Measurements
Individual shell height was measured prior to and at the end of the experiment using a digital caliper (Vernier 150 mm). Dry weight of the tissue was measured after drying at 105°C until constant weight (24 h) at the end of the experiment. Average growth rate was calculated by the difference in length before and after the experiment divided by the length of the trial (27 days). Condition index was calculated by determining the relationship between shell height and dry weight of soft parts (Luoma and Carter, 1991) (n = 15–20 for each tray).
Clearance Rate
Clearance rate was measured twice during the experiment, after 15 and 25 days, when the scallops had acclimated to the different diets. Single scallops were placed on a horizontal grid in circular 1-L glass beakers covered with dark plastic to avoid disturbances during the measurement in the temperature controlled room (10°C). Water circulation was achieved with a magnetic stirrer in order to reduce sedimentation of feed particles.
To measure clearance rate three scallops from each tray were transferred to 1-L beakers and given feed, see experimental diets at the end of this section.
In each series of measurements, there was one extra beaker with the same carbon concentration as the other beakers but with no added scallop. This was done to ensure that stirring maintained a uniform distribution of particles. No sedimentation was observed during the clearance rate trials. The measurement started when the first scallop was observed to be actively feeding. Water samples (20 mL) were collected at 7, 15, 30, 45, 60, 90, and 120 min. Particle size (2–40 μm) and concentration (particles mL-1) were measured with a Beckman Coulter-Counter Multisizer 3. When the scallops started filtering, the decline in particles with time was logarithmic. Clearance rate was calculated by the following equation:
where, v is the volume of the container, t is the duration of the experiment, and C0 and Ct are the initial and final particle concentration within the linear area of the curve (Marin et al., 1986). The scallops were marked after the first clearance rate analysis and returned to the feeding experiment. After the second clearance rate analysis the scallops were used for analysis of condition index.
Experimental Diets
At day 15 of the experiment the clearance rate was measured, and the diet was the same as in the feeding experiment (six different diets, n = 9, Table 1).
Clearance rate was also measured at day 25. The diet was algae (R. baltica and C. muelleri, where R. baltica constituted 90% of the total carbon content), salmon feed and salmon feces separately with a starting concentration on 12,000 particles mL-1 for each diet (three different diets, n = 9). The carbon concentrations were 300 μg C L-1 for algae, 1390 μg C L-1 for salmon feed and 865 μg C L-1 for feces.
Lipid Analysis
Scallops were dissected at the end of the feeding trial, at day 27, for analysis of lipids. This was 24 h after feeding was stopped, in order to empty the content of the intestine before analysis. The digestive glands and muscles were dissected from the scallops (n = 10 from each tray) and frozen in liquid nitrogen. The gills were not analyzed in this study, because the main focus was on lipids and the accumulation of lipid is in the digestive gland. The muscle was included to study the pattern of fatty acid incorporation in the muscle tissue. These juvenile scallops did not have gonads. All samples used in lipid determination was freeze dried, flushed with N2 and stored at -80°C until analysis. Total lipid was extracted and determined gravimetrically according to Bligh and Dyer (1959), but with the modifications described by Jakobsen et al. (2008). Fatty acid methyl esters were prepared from the extracted lipid according to the method of Metcalfe et al. (1966). They were then analyzed with a gas chromatograph (AutoSystem XL, Perkin Elme, Waltham, MA, United States) with TotalChrom Version 6.3.1 software. The system was equipped with an auto-injector (injection volume of 1 μL, on-column injection, inlet temperature 250°C) and a flame ionization detector (FID, 280°C). A fused silica capillary column coated with a chemically bonded polyethylene glycol (CP-Wax 52CB, 25 m × 0.25 mm i.d.; Varian, Palo Alto, CA, United States) was used. The temperature program for the oven was initially set at 90°C for 1 min. It was then raised to 150°C at 30°C min-1 and finally to 225°C at 3°C min-1 and held for 7 min. Helium was used as the carrier gas. The retention times of the fatty acid methyl esters were compared to commercial standards (Nu-Chek Prep, Tokyo, Japan) and quantified by the use of 19:0 as an internal standard, added prior to extraction, in combination with external standard curves.
Stable Isotope and Elemental Analysis
The digestive glands and muscles of scallops and the different diets used in this experiment were analyzed for their content of carbon, nitrogen as well as the isotope ratios of carbon and nitrogen (δ13C and δ15N) at the Colorado Plateau Stable Isotope Laboratory at Northern Arizona University, United States. The samples were freeze dried, ground, weighed and packed in tin capsules before being analyzed with a Carlo Erba NC2100 elemental analyzer coupled with a Thermo-Electron Delta V Advantage isotope ratio mass spectrometer, configured through a CONFLO III. Isotope ratios were calculated as follows:
where X is 13C or 15N and R is a of ratio 13C/12C for carbon and 15N/14N for nitrogen, respectively. The standard Pee Dee Belemnite was used for carbon isotope analysis, while atmospheric nitrogen was used as the standard for nitrogen.
Data Analysis
All statistical analyses were done with SigmaPlot 13.0 with a level of significance of p < 0.05. Two-way ANOVA with the post hoc Holm-Sidak test was used to compare the samples after they passed a normality test (Shapiro–Wilk) and a test of homogenic variability. Normalized data was square-root transformed before statistical analysis. The statistical parameters degrees of freedom, F-value and p-values are given in Supplementary Table 2. Unscrambler 10.2 (CAMO AS, Oslo, Norway) was used for principal component analysis (PCA) of the square-root transformed normalized data of fatty acids. Values presented in this paper are average values with standard error of the mean.
Results
Filtration and Preference of Particles
The size of the particles in the diets of this trial was smaller than 10 μm (Figure 2A). Particles from salmon feed and salmon feces were mainly between 2.2 and 6.0 μm (95–96%), and the algal size of the mixed culture (R. baltica and C. muelleri) was mainly between 6 and 10 μm (82%, Figure 2A).
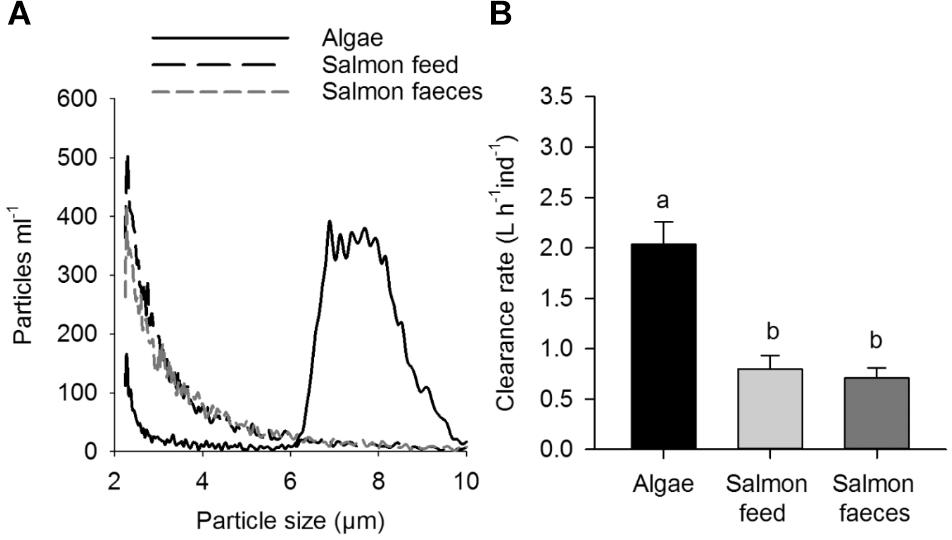
Figure 2. (A) Size distribution (particles ml-1) of salmon feed, salmon feces and algae (R. baltica and C. muelleri) particles used in the laboratory experiment and in particle retention studies. Size distribution of particles were measured with a Beckman Coulter-Counter Multisizer 3. (B) Clearance rate of algae, salmon feed and salmon feces (L ind-1 h-1). Values shown with uncertainties are mean values ± 1 SD. Significant differences are annotated with letters.
Scallops cleared out algae more efficiently than the smaller particles of salmon feed and salmon feces when given diets of algae (R. baltica and C. muelleri), salmon feed and salmon feces (p < 0.05), and there was no significant difference in clearance rate between salmon feed and salmon feces (p > 0.05, Figure 2B).
When scallops were given the different diets used in the feeding experiment, there were no statistical differences in clearance rate (p < 0.05) between scallops fed a high particle concentration (algae 2.7 ± 0.5 L ind-1 h-1, algae and salmon feed 2.7 ± 0.4 L ind-1 h-1, algae and salmon feces 2.2 ± 0.4 L ind-1h-1) and scallops fed the low particle concentration (algae 2.0 ± 0.2 L ind-1h-1, algae and salmon feed 2.2 ± 0.1 L ind-1h-1, algae and salmon feces 2.1 ± 0.2 L ind-1h-1). Moreover, the additional salmon feed and salmon feces had no influence on the clearance rate at the concentrations used in the experiment.
Growth and Condition Index
There were no differences in the condition index of scallops fed salmon feed or salmon feces (or in the scallops of the control) for each of the algal concentrations, but scallops that were given a high concentration of algae obtained a higher condition index than those given a low concentration for all treatments (p < 0.001, Figure 3A). Scallops fed a high algal concentration showed no significant differences in average growth rate between the high algal diets (p > 0.05, Figure 3B). Scallops fed salmon feed and salmon feces in addition to a low concentration of algae showed no significant differences compared to the control (p > 0.05). Scallops that were fed a high concentration of algae grew faster than those fed a low concentration for the control (p < 0.001), the salmon feed diet (p < 0.05) and the salmon feces diet (p < 0.05, Figure 3B).
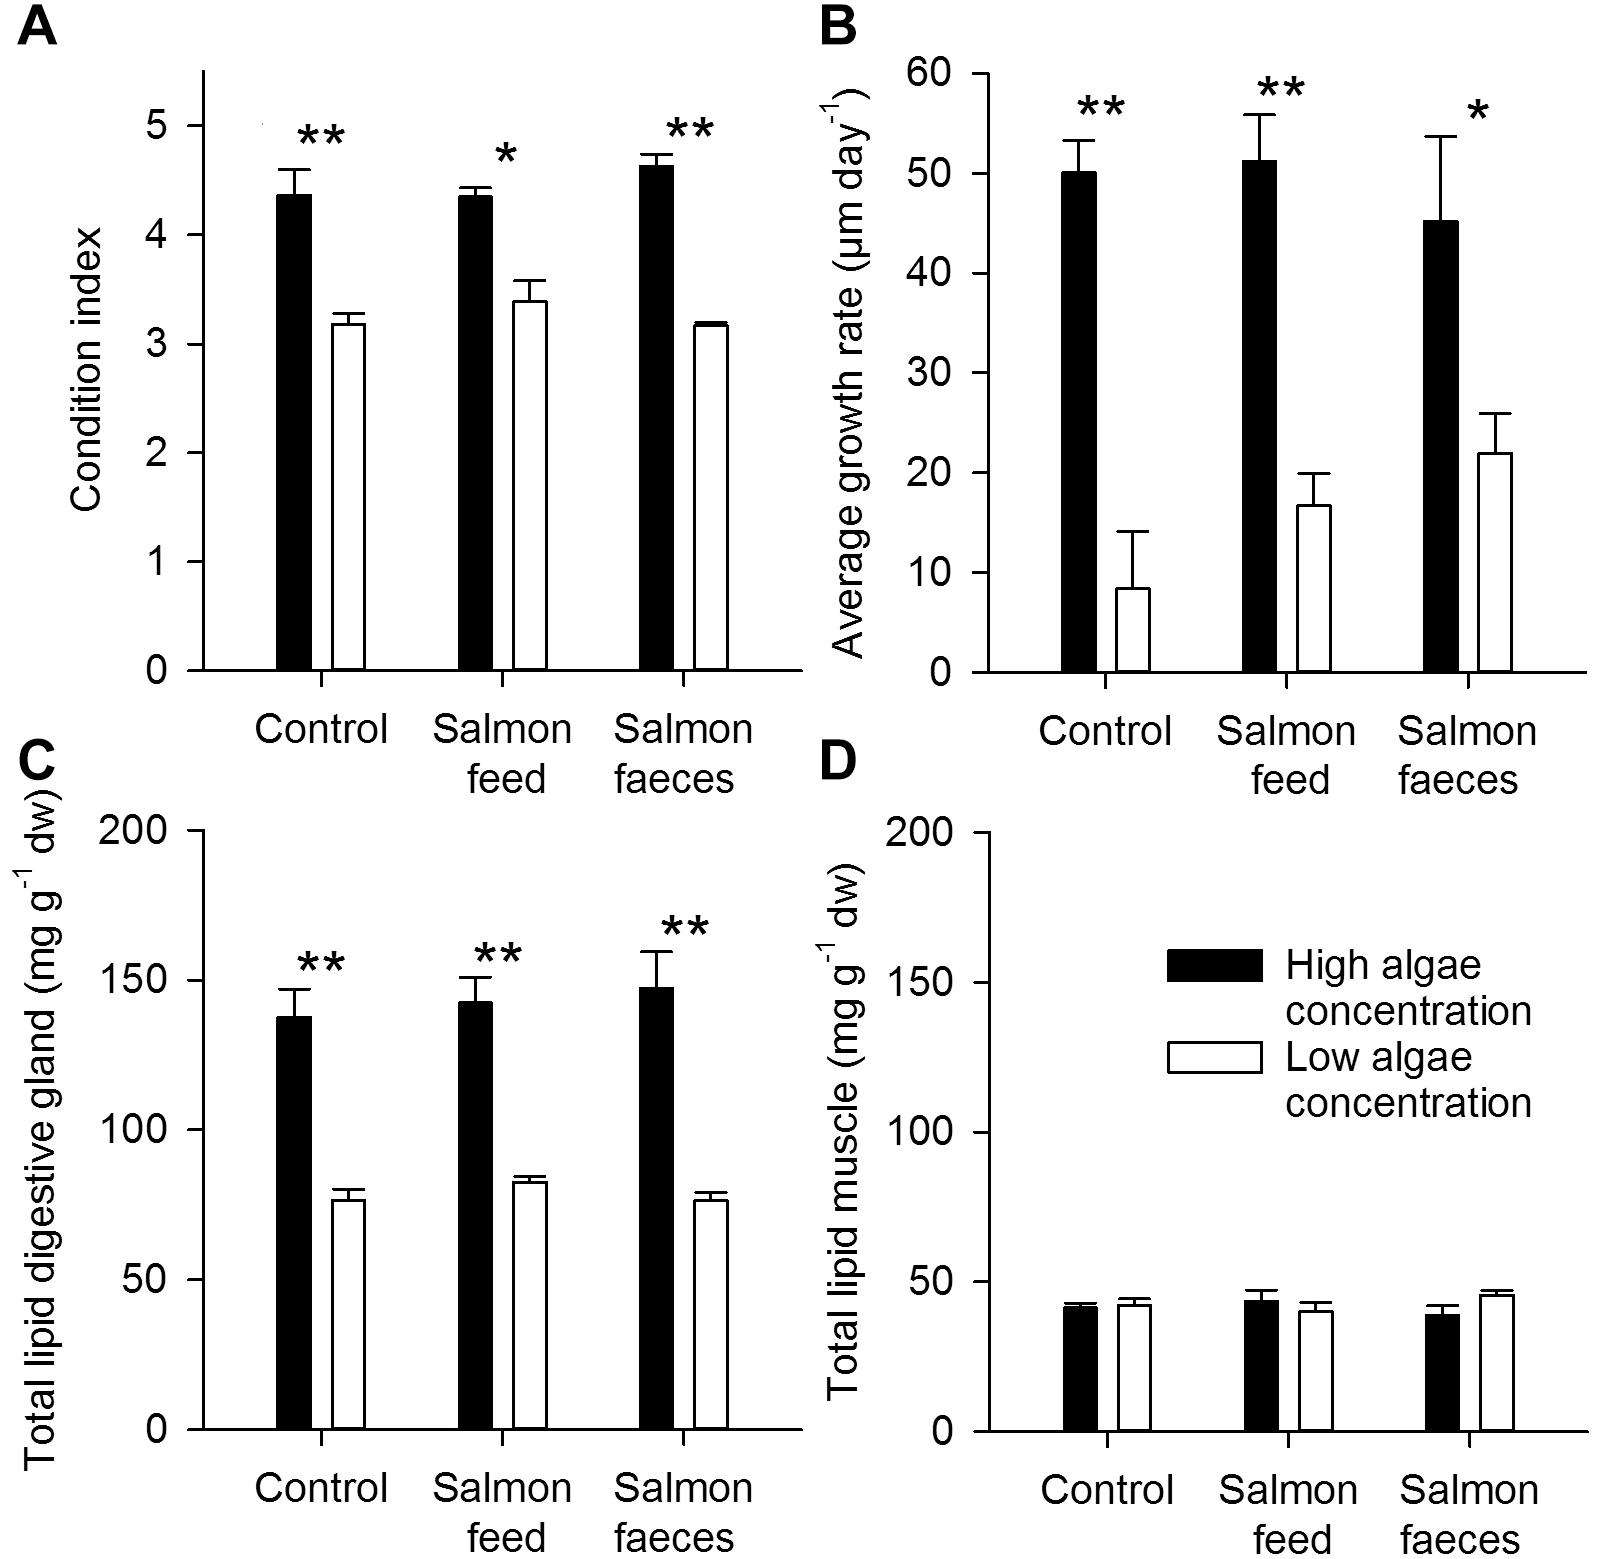
Figure 3. Average growth rate (μm day-1) (A), condition index (B), total lipid in the digestive gland (mg g-1 dw) (C) and total lipid in the muscle (mg g-1 dw) (D) of control scallops, scallops fed salmon feed and scallops fed salmon feces in addition to a high or low algae concentration. Values shown with uncertainties are mean values ± 1 SD. Significant differences between high and low algae concentration are annotated with a star (∗p < 0.05, ∗∗p < 0.001).
Total lipid contents of the digestive gland showed no significant differences between the control and scallops given either salmon feed or salmon feces at both high and low algal concentrations (p > 0.05). Provision of a high algae concentration resulted in a higher total lipid content in the digestive gland of the scallops compared to that obtained for low algae concentration (mean values of 143 ± 5 mg g-1 dw and 79 ± 4 mg g-1 dw, respectively, P < 0.05, Figure 3C). The mean content of total fatty acids in the digestive gland for the treatments was 33.2 ± 5.9 mg g-1 dw in scallops fed a low algae concentration and 95.5 ± 13.6 mg g-1 dw in scallops fed a high algae concentration. There were no significant differences in the total lipid content of the muscle in scallops fed either salmon feed or salmon feces at both algal concentrations (p > 0.05, Figure 3D). The muscle showed an average lipid content of 42.0 ± 2.5 mg g-1 dw and a mean total fatty acid content of 16.8 ± 1.6 mg g-1 dw.
Tracing Feed Components With Fatty Acids
The fatty acid profile varied between the different dietary components (Table 2). The main fatty acids, which accounted for 52% of total fatty acids in Rhodomonas sp. was 18:3n3, 18:4n3 and 18:2n6, whereas in Chaetoceros sp., 16:0 and 16:1n7 constituted 55% of the total fatty acids (Table 2). The two most abundant fatty acids in salmon feed were 18:1n9 and 18:2n6, whereas 18:1n9 and 16:0 were the dominant fatty acids in salmon feces, accounting for 39% and 50% of total fatty acids, respectively. The monounsaturated fatty acids 18:1n9, 20:1n9, and 22:1n11 were accordingly present in both salmon feed and salmon feces, but only in significantly lower quantities in both algal species (Table 2). These fatty acids therefore serve as potential tracer fatty acids for salmon feed and salmon feces in the experiment.
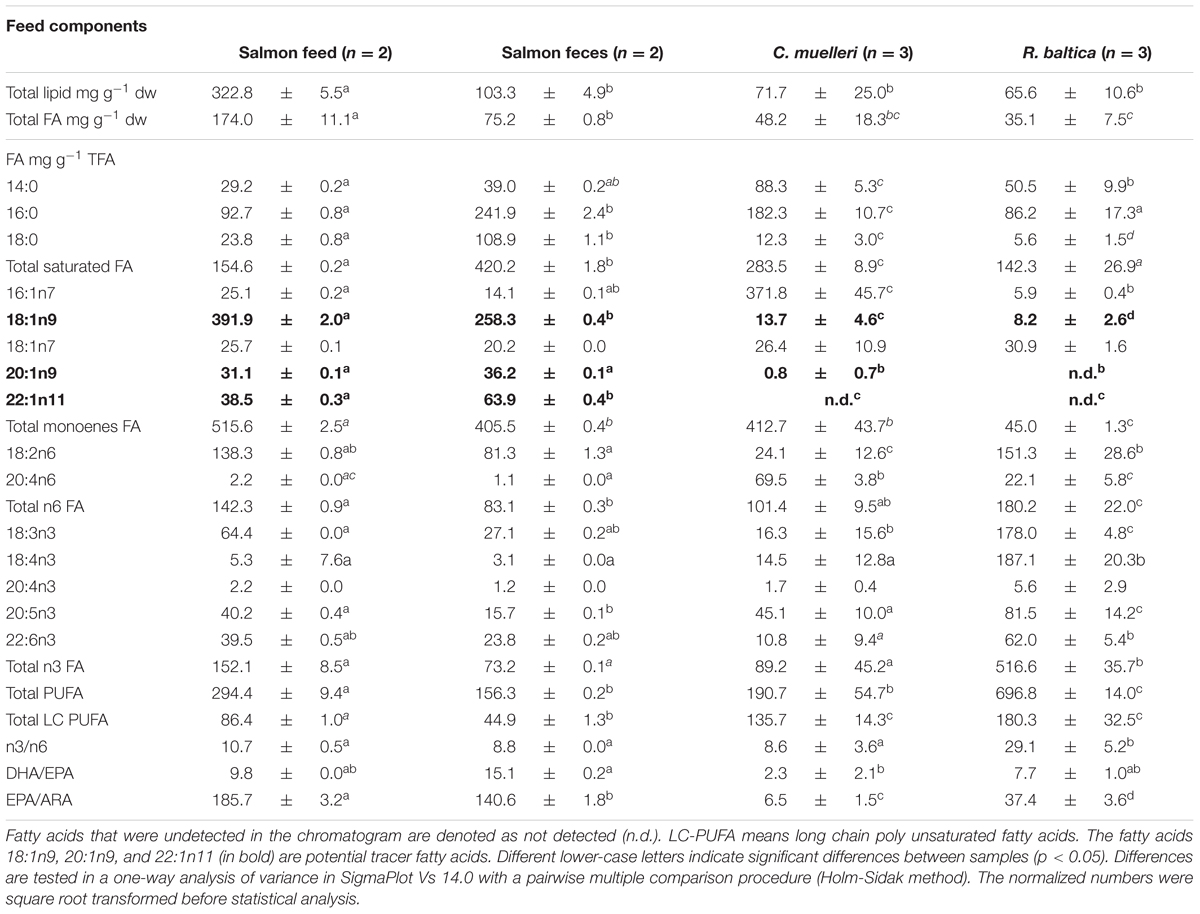
Table 2. Total lipid content (mg g-1 dw), total fatty acid (FA) content (mg g-1 dw) and share of fatty acids (mg g-1 total fatty acids) in the feed components of the diets in the feeding experiment.
The share of the potential tracer fatty acid 18:1n9 in the digestive gland of the scallops showed significant differences between diets (Figure 4A). For both high and low algae concentration, the share of 18:n9 became higher when the scallops were fed salmon feed and salmon feces in addition to the algae. Moreover, the difference between the shares of 18:1n9 in the control and the scallops given salmon feed and salmon feces was higher in the groups given the low algae concentration (p < 0.001) than in those given high algae concentration (p < 0.05), suggesting a higher relatively incorporation of salmon feed and feces at a low algae concentration than at a high concentration. The muscle of scallops fed salmon feces in addition to both high and low algae concentrations contained significantly lower shares of 18:1n9 than the controls and the addition of salmon feed to both high (p < 0.05) and low algae concentrations (p < 0.05, Figure 4B). Contrary to this, a diet of salmon feed in addition to algae resulted in a higher share of 18:1n9 for high algae concentration (p < 0.05), but there were no significant differences compared to the control for low algae concentration (p > 0.05).
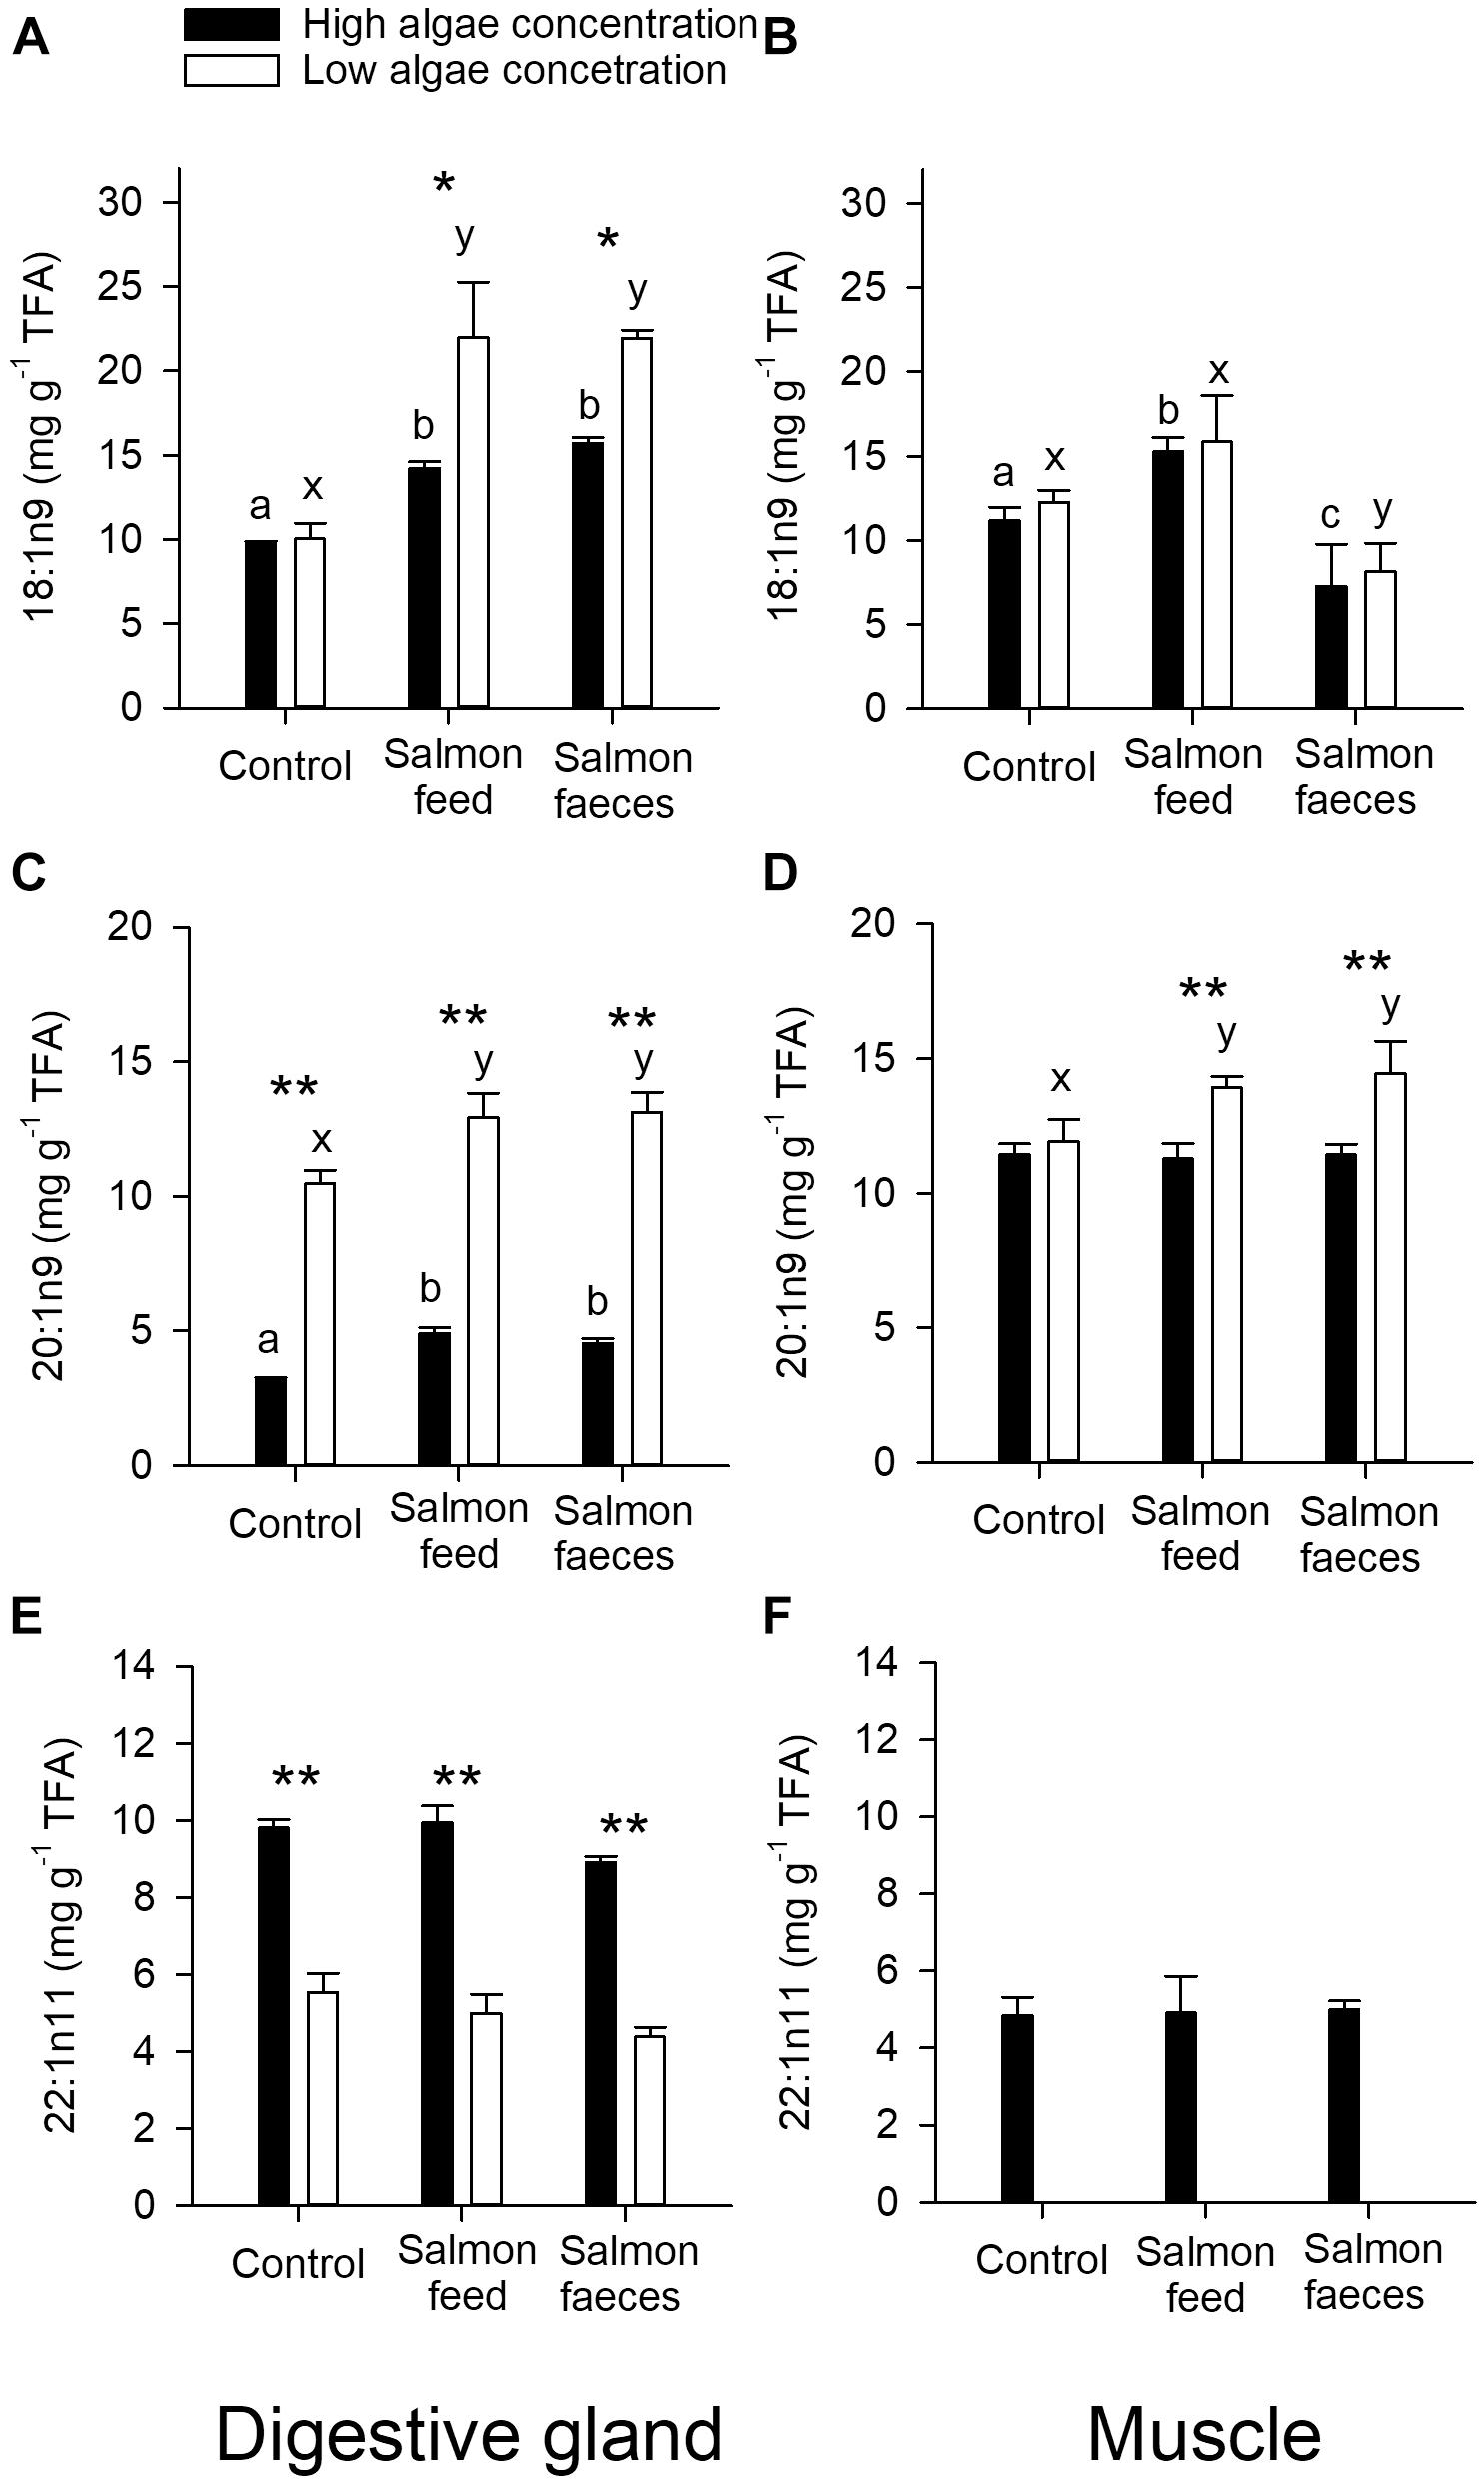
Figure 4. Content of potential tracer fatty acids [18:1n9 (A,B), 20:1n9 (C,D), 22:1n11 (E,F), mg g-1 of total fatty acids, TFA] in the digestive gland (A,C,E) and muscle (B,D,F) of scallops fed algae, salmon feed and salmon feces in addition to a high and low algae concentration. Significant differences between diets with a high algae concentration are annotated with the letters a, b, and c, while significant differences between diets with a low algae concentration are annotated with the letters x, y, and z. Significant differences between high and low algae concentration are annotated with a star (∗p < 0.05, ∗∗p < 0.001).
The share of 20:1n9 in the digestive gland was higher for all diets in scallops fed a low algae concentration than a high concentration (p < 0.001, Figure 4C). At both high and low algal concentrations, there was a higher share of 20:1n9 in scallops fed salmon feed and salmon feces than the scallops that were given only algae (control, p < 0.05). In the muscle of the scallops there was a slightly higher share of 20:1n9 found in scallops fed a low concentration of algae compared to a high concentration when salmon feces or salmon feed was given in addition (Figure 4D). The muscle of scallops fed salmon feces or salmon feed in addition to a low algae concentration contained a slightly higher share of 20:1n9 compared to the control (p < 0.05), while there were no significant differences in scallops fed the high concentration of algae.
The share of 22:1n11 in the digestive gland showed no differences between diets that included the same algae concentration, but there was a higher share found in scallops fed a high algae concentration compared to a low concentration for all diets (Figure 4E). The share of 22:1n11 in the muscle was not detectable in scallops fed a low concentration of algae, and there were no significant differences between scallops fed the high algae concentration (p > 0.05, Figure 4F). The share of all fatty acids analyzed in muscle and digestive gland, are given in Supplementary Table 1.
A PCA of the fatty acids in the digestive gland showed that scallops fed the high and low algal diet alone clustered, with principal component 1 (PC-1) describing 96% of this variation (Figure 5A). The fatty acids responsible for this variability were mainly 18:2n6, 18:3n3, 18:4n3, and 22:6n3. These fatty acids (together with 20:5n3) are the most abundant fatty acids in R. baltica, suggesting that the fatty acid composition of the digestive gland was strongly affected by the algal diet.
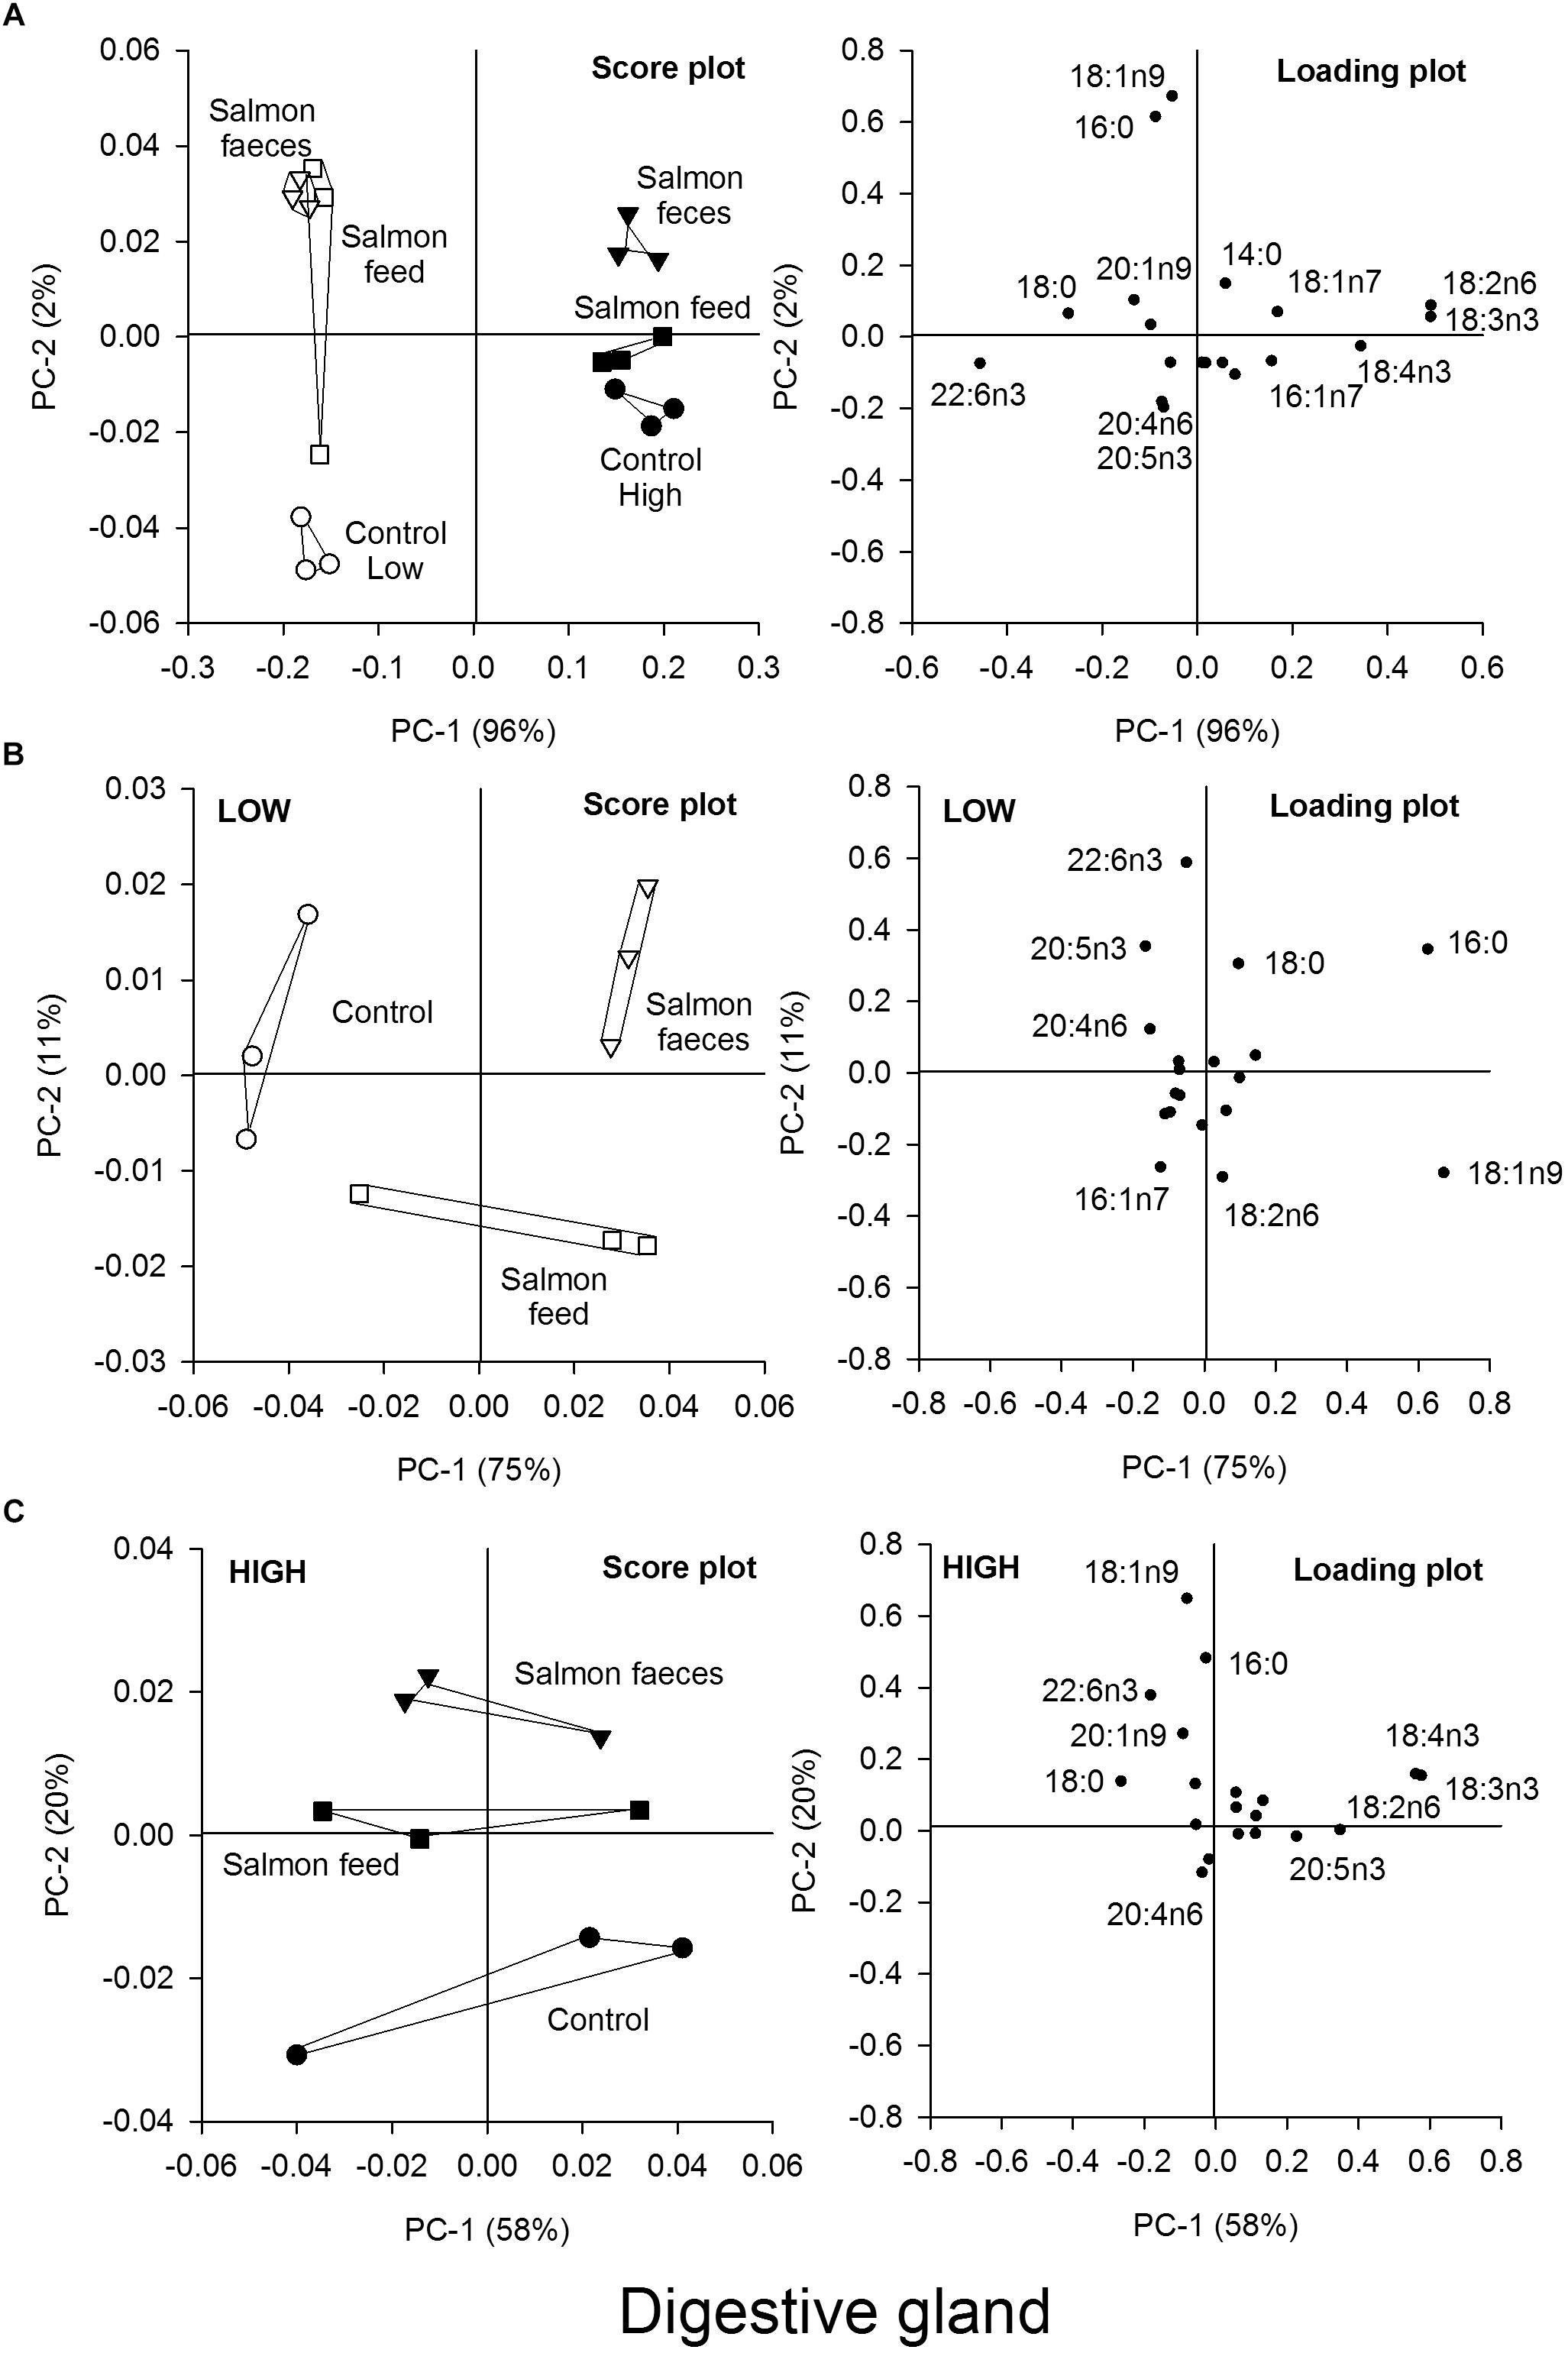
Figure 5. Principal component analysis (PCA) of the fatty acid content in the digestive gland of scallops that were fed salmon feed (squares), salmon feces (triangles) and the control (circles) for a high algae concentration (filled symbols) and a low algae concentration (open symbols). (A) Score plot and loading plot of fatty acids in the digestive gland of all samples in the feeding experiment, (B) score plot and loading plot of samples from the low algae concentration, and (C) score plot and loading plot of samples from the high algae concentration.
The groups fed low and high algal concentration were then analyzed separately (Figures 5B,C). In both groups, the control was separated from the two other groups, either fed salmon feed or salmon feces. For the low algae group, the control was separated from the other diets in the PC-1 direction, which described 75% of the variation in the samples, where 18:1n9 and 16:0 were the main fatty acids responsible for this variation. For the groups fed a high algae concentration, the control was separated from the salmon feed and salmon feces groups in the PC-2 direction, describing 20% of the variation in the samples. The two fatty acids 18:1n9 and 16:0 were again responsible for most of this variation. The PCA plots also showed that 18:1n9 best described the variation in the samples for the groups fed the low algae concentration, where salmon feed and salmon feces had the highest contribution to the diet.
The PCA of fatty acids in muscles from scallops also showed that scallops fed a high algae concentration were separated from the scallops that were fed a low algae concentration, where PC-1 described 89% of the variation (Figure 6A). The fatty acids 18:3n3, 18:2n6, 18:4n3, and 22:6n3 also explained most of the clustering of samples for the muscle, thus indicating that the fatty acid composition of the diet also affected the fatty acid composition of the muscle. The groups that were fed a low algae concentration were analyzed in a separate PCA plot (Figure 6B). The control that was only fed algae was separated from those co-fed with salmon feces or salmon feed, except for one of the replicates fed salmon feed. The fatty acids 18:3n3 and 22:6n3 were responsible for the separation in the PC-1 direction, which explained 50% of the variation. In the PC-2 direction, which explained 24% of the variation, the salmon feed and the control fed only with low algae were separated from the salmon feces group, where 18:1n9 and 18:2n6 explained most of this variability. For muscles from scallops fed a high algal concentration, the salmon feed group differed from the salmon feces and control groups in the PC-1 direction, explaining 50% of the variation (Figure 6C). The fatty acid 18:1n9 was responsible for most of this variation.
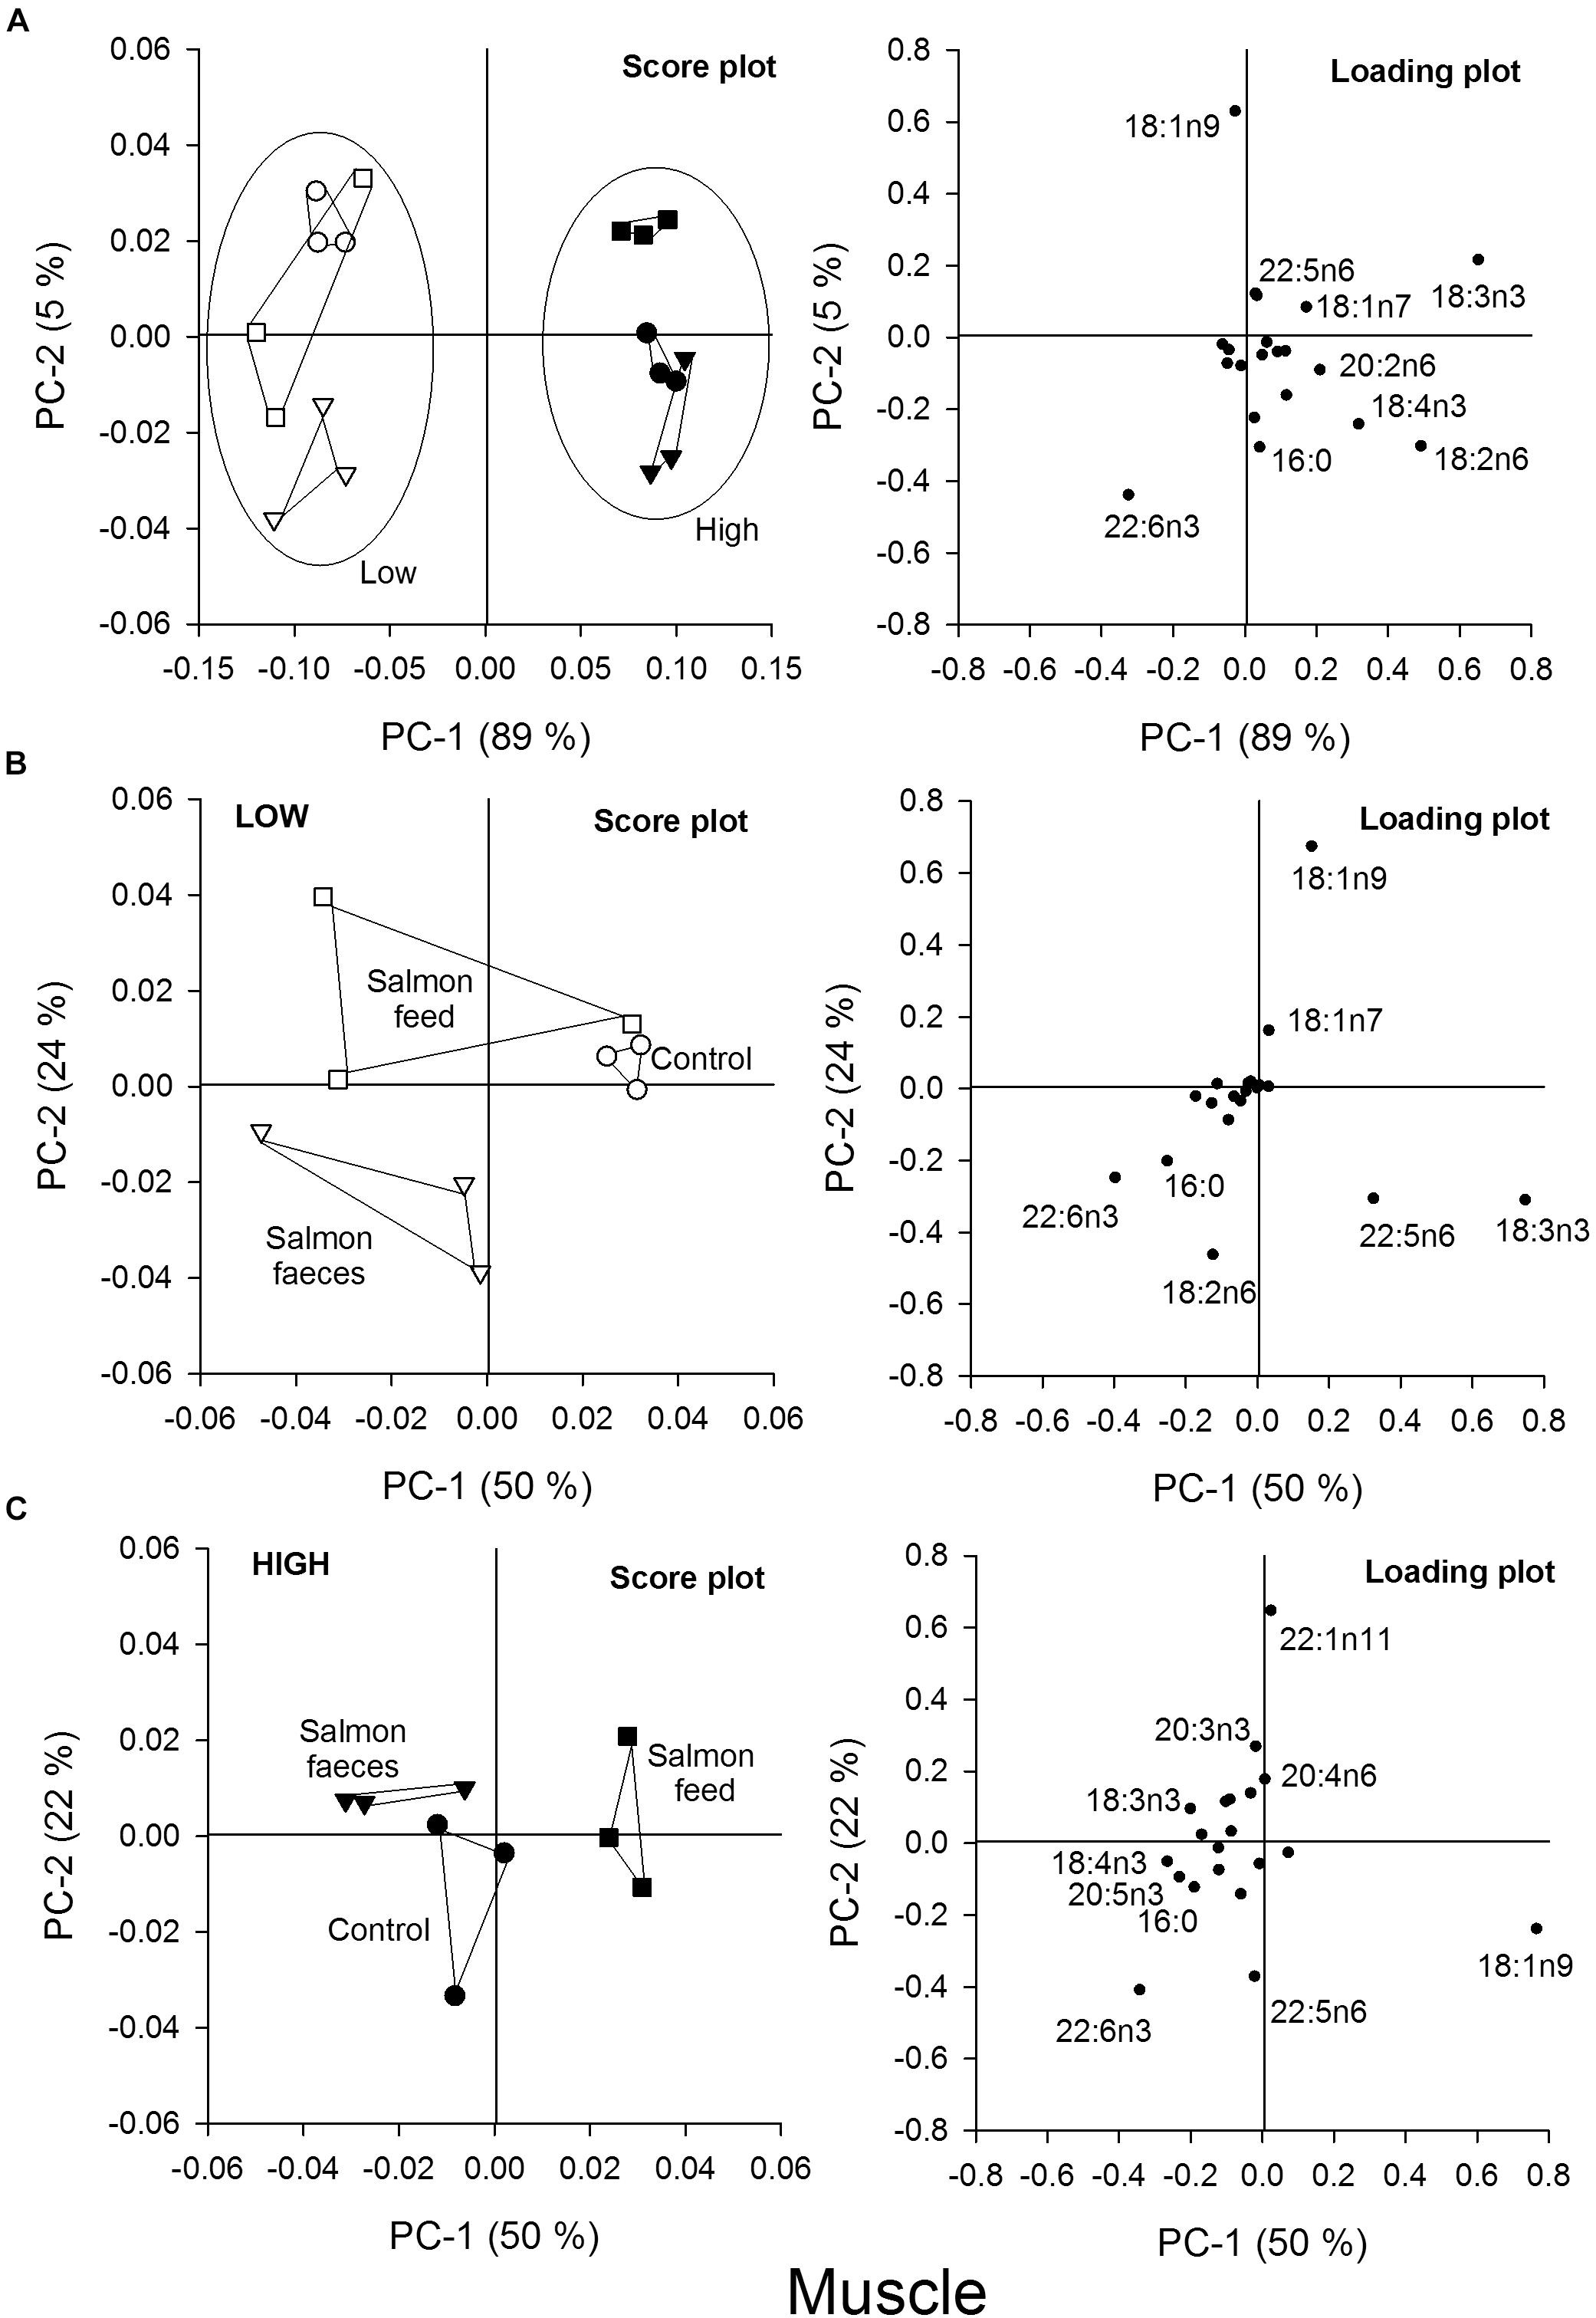
Figure 6. Principal component analysis (PCA) of the fatty acid content in the muscle of scallops that were fed salmon feed (squares), salmon feces (triangles) and the control (circles) for a high algae concentration (filled symbols) and a low algae concentration (open symbols). (A) Score plot and loading plot of fatty acids in the muscle of all samples in the feeding experiment, (B) score plot and loading plot of samples from the low algae concentration, and (C) score plot and loading plot of samples from the high algae concentration.
The stable isotopes δ13C and δ15N were analyzed in the different diets, in the digestive gland of the scallops and in the muscle of the scallops (Figure 7). The δ13C signatures of the two algae were not significantly different (p > 0.05) and had a low ratio of -37.8 ± 0.3 (n = 3) and -38.4 ± 0.4‰ (n = 3) (for R. baltica and C. muelleri, respectively). Salmon feed and feces showed a higher δ13C signature compared to the algae, but they were comparable to each other (-26.4 and -25.6‰). The analysis of stable isotopes in salmon feed and salmon feces is unfortunately based on one analysis and the difference cannot be tested.
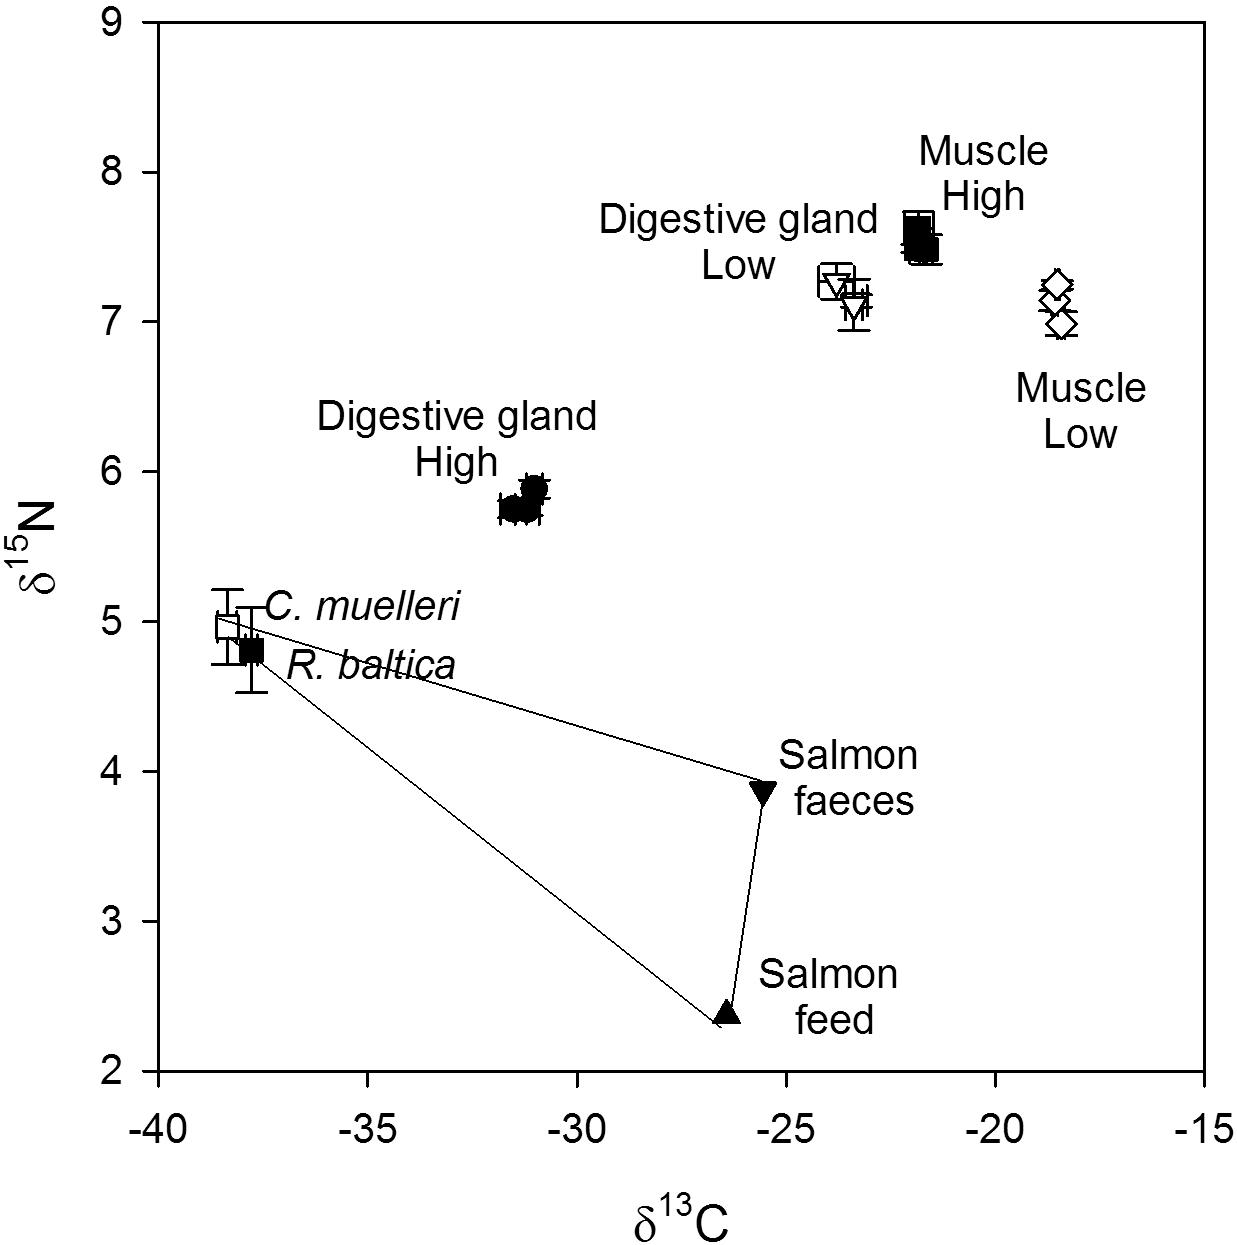
Figure 7. Dual isotope plot (δ13C and δ15N, ‰) of the food sources (salmon feed, salmon feces, R. baltica and C. muelleri), digestive gland and muscle of control scallops, scallops fed salmon feed and scallops fed salmon feces in addition to a high and low algae concentration.
The digestive gland of the scallops that were fed a high algae concentration were clustered together and showed a significantly lower δ13C signature than the digestive gland of scallops fed a low algae concentration (p < 0.001, n = 9). The same was also seen for the muscle; the muscle from scallops fed a high algae concentration had a significantly lower δ13C signature than scallops that were fed a low algae concentration (p < 0.001, n = 9). The difference in δ13C signature between high and low algae concentration was, however, higher in the digestive gland than in the muscle (7.7 and 3.3‰ difference, respectively). There was no significant difference between the control that was fed only algae and the scallops that were also given salmon feed or salmon feces. This was true both for the high and low algae concentration and for the digestive gland and muscle (p > 0.05, n = 3).
The δ15N signatures of R. baltica and C. muelleri were also not significant different showing values of 4.8 ± 0.5 (n = 3) and 5.0 ± 0.4‰ (n = 3), respectively. Salmon feed and salmon feces showed values of 2.4 (n = 1) and 3.9‰ (n = 1), and could not be tested for differences.
The digestive gland showed a δ15N signature of 5.8 ± 0.1 (n = 9) and 7.2 ± 0.2‰ (n = 8) for scallops fed a high and low algae concentration, respectively, while the muscle showed a δ15N signature of 7.5 ± 0.1 (n = 9) and 7.2 ± 0.2‰ (n = 9) for scallops fed a high and low algae concentration, respectively.
Discussion
Importance of Salmon Feed and Feces in High and Low Phytoplankton Environments
The primary objective of the present experiment was to study the capability of scallops to incorporate salmon feed and feces particles in an IMTA scenario of a spring bloom and a winter condition. These conditions are characterized by relatively high and low phytoplankton concentrations, respectively, in the temperate coastal waters of Northern Europe.
The measurements of clearance rate in the present study showed that the scallops had the ability to clear out and retain salmon feed and feces, although with lower rates than algae. The lower rates are likely a result of the small particle size; particle retention for other bivalves has been shown to be lower for particles <3 μm (Mohlenberg and Riisgard, 1978; Riisgard, 1988), while pectinids have shown a lower efficiency for particles <5–7 μm (Cranford and Grant, 1990; MacDonald et al., 2006). The concentration of particles could also explain the hampered capability of the scallops to clear out salmon feed and feces. The carbon concentrations of salmon feed and feces were 1390 and 865 μg C L-1, respectively, when clearance rate was measured with salmon feed and salmon feces. The carbon concentrations of salmon feed and feces used in the experimental diets were 30 μg C L-1. The clearance rate measured for the diets in the feeding experiment showed no differences between the diets.
Fatty acids of the digestive gland have been used to trace salmon feed and/or salmon feces in blue mussels in several studies (Redmond et al., 2010; Handå et al., 2012a,b; Irisarri et al., 2014). Our results show that the content of 18:1n9 was higher in the digestive gland of scallops fed salmon feed and salmon feces compared to scallops fed only algae, both at high and low algal concentrations. This fatty acid is found in high fractions in the feed and feces of salmon, but only in low levels in the microalgae used in the experiment (Table 2). A higher share of 18:1n9 has also been found in blue mussels fed salmon feed and salmon feces in laboratory studies (Redmond et al., 2010; Both et al., 2011; Handå et al., 2012b) and in field studies in the proximity of fish farms (Gao et al., 2006; Handå et al., 2012a). The change in the share of this fatty acid was most prominent at a low algae concentration, both for salmon feed and feces added. Moreover, the PCA plot of the digestive gland shows that characteristic fatty acids from the salmon feed and feces explain most of the variation in fatty acid composition when the algae concentration was low, whereas algae fatty acids explained most of the variation when the algae concentration was high. This further suggests that salmon feed and feces became a more important food source when the ambient algal concentration was low, also suggested by Troell and Norberg (1998).
The lipid content of the digestive glands was approximately twice as high when fed a high algal concentration compared to the low concentration. This confirms that the scallops used the digestive gland for lipid storage when given a high concentration of food. At low algae concentrations, the energy was primarily used to maintain metabolism, as the scallops showed minimal growth in this short experimental period. Analysis of the nutritional profile of the scallop muscle could have given more information about the incorporation of proteins and carbohydrates from salmon feed and salmon feces, and should be considered in future trials.
Moreover, there was also a change in the fatty acid composition in the muscle, revealed by a separation of the different groups in the PCA plots. This suggests that the lipid incorporated into the digestive gland was transferred to phospholipids in the muscle. The incorporation of fatty acids in the phospholipids is more strongly metabolically regulated than in the triacylglycerides because phospholipids are an important functional component of muscle cells and because they play important roles in the cells’ signaling system (Sargent et al., 2002). The PCA plot of the fatty acid profile of the muscles showed a high influence of the algae concentration on the fatty acid profile of the muscle (Figure 6A). Scallops that received a high algal diet showed more inclusion of the algal fatty acids C18:3n3, C18:2n6, and C18:4n3 in the phospholipids of muscles than scallops that were given low algal concentrations. The PCA plot also showed that diets of both salmon feed and feces influenced the fatty acid profile of muscles of the scallops that were fed a low algae concentration more than the high algae concentration.
The fatty acid composition of the digestive gland and muscle suggests that scallops have the potential to utilize salmon feed and feces when algal concentrations are low, as suggested also for mussels (Wallace, 1980; Stirling and Okumuş, 1995; Handå et al., 2012a).
Another difference in the fatty acid profile of the muscles of scallops that received high and low algae diets was that the algal diet had a stronger influence on the fatty acid profile, resulting in a lower share of C22:6n3. Scallops that received a high algal diet had an average share of 33% C22:6n3 of total fatty acids while scallops that received a low algal diet had a share of 40% C22:6n3 of TFA. Accordingly, this important fatty acid showed a selective accumulation in the phospholipids of the muscle. A selective assimilation of this fatty acid has previously been suggested for scallop larvae (Marty et al., 1992), which have been shown to have specific requirements for long chain n3 poly-unsaturated fatty acids like C22:6n3 (Delaunay et al., 1993). C22:6n3 has important structural and functional roles in the membranes of most species.
Tracing Salmon Feed and Feces With Fatty Acid Biomarkers and Stable Isotopes
The most abundant fatty acid in the salmon feed and salmon feces was 18:1n9, which was expected to be a potential tracer of these diet components in the present experiment. This was because both algal species used showed low levels of this fatty acid and because this fatty acid has been used as a tracer fatty acid for salmon feed and/or salmon feces in studies with blue mussels (Redmond et al., 2010; Handå et al., 2012a,b) and green-lipped mussels Perna viridis (Gao et al., 2006). There are, however, some questions related to the general use of 18:1n9 as a tracer fatty acid for shellfish cultivated in natural habitats. Because 18:1n9 is a very common fatty acid, the content is variable among phytoplankton species (Reuss and Poulsen, 2002), and many protozoan and metazoan species that may form part of the scallop feed are able to synthesize it. 18:1n9 will therefore exhibit background levels, or even high levels, in natural seston. Therefore, it is not fully adequate to assess the influence of feed and fecal waste from salmon farming on scallops simply by analyzing the 18:1n9 content in the scallops. The 18:1n9 contents of the natural seston food of the scallops can be dominated by phytoplankton in a representative reference site that is not affected by waste from salmon farming. Such measurement can make assessment based on 18:1n9 contents more feasible if the contents of the natural seston is low.
Other fatty acids have been suggested as tracer fatty acids for fish waste, including the monounsaturated fatty acids 20:1n9 and 22:1n11 (Van Biesen and Parrish, 2005; Both et al., 2012). However, these fatty acids did not show (with the exception of 20:1n9 in the digestive gland in scallops fed the high algae concentration) any relation to salmon feed and feces particles in our study. However, we used a relatively low concentration of salmon feed and feces in the diet and the concentration of these fatty acids was low compared to that of 18:1n9. Both 20:1n9 and 22:1n11 are also zooplankton markers and will vary in fish feed depending on the contents of fish meal and oil normally prepared from planktivorous fish (Van Biesen and Parrish, 2005). Moreover, mussels and other bivalves are capable of consuming protozoan and early stages of metazoan zooplankton (Davenport et al., 2000), which may further complicate the use of these fatty acids as tracers of salmon farm waste nutrients. 18:2n6 has also been suggested as a potential tracer of waste nutrients from fish farms because it originates from the inclusion of higher plants in the feed (Olsen et al., 2009, 2012; Both et al., 2011). However, this fatty acid was not applicable as a marker in our experiment because R. baltica contained high amounts of 18:2n6. Other phytoplankton that may be abundant in field experiments may also produce this fatty acid (Dalsgaard et al., 2003; Shin et al., 2014).
Quantification of stable isotopes has previously been used to determine the extent to which bivalves incorporate fish feed and feces in field (Gao et al., 2006) and laboratory experiments (Redmond et al., 2010). This method, however, was not sensitive enough to determine whether the scallops had incorporated salmon feed or feces in their muscle and digestive gland in our experiment. This inability may have originated in the relatively low concentrations of salmon feed and salmon feces used in the diets. There was, however, a difference in the isotopic signatures of scallops fed a low algae concentration compared to a high algae concentration, in both muscle and digestive gland. Lorrain et al. (2002) reported the seasonal variation of stable isotopes in scallops where the muscle showed minor variations and the digestive gland varied from 5 to 7.5‰ δ15N. The highest value of the digestive gland was found in February/March, when food was scarce, and the lowest value was in April and May, when food was abundant. This agrees well with our findings for scallops fed high and low algae concentration. Pectinids have been shown to use protein instead of lipids as their source of energy under gametogenesis and when food is scarce during winter (MacDonald et al., 2006). The amount of ammonia excreted then increases due to the deamination of amino acids. This ammonia would be depleted in δ15N due to deamination because enzymes prefer the lighter isotope, which may result in a scallop enriched in 15N. If the scallops that received a low algae concentration in our study primarily used proteins to support their metabolic energy demand, it could result in a scallop with higher loss of ammonia than scallops fed a high algae diet and consequently a scallop with a higher δ15N signature. The combination of a high metabolic turnover resulting in a faster incorporation of stable isotopes from the food and deamination could explain the differences in the δ15N signature between the digestive gland and the muscle. The digestive gland and muscles of scallops fed the high algae concentration in our experiment were more depleted in 13C than that of scallops fed the low algae concentration. This difference is probably caused by the difference in lipid content (DeNiro and Epstein, 1977), turnover rate and physiological processes (Lorrain et al., 2002).
Conclusion
The present laboratory experiment found that the scallop P. maximus can clear out and incorporate salmon feed and salmon feces particles, thus suggesting that the scallop can be a suitable candidate for IMTA. However, when the particle concentration of salmon feed and salmon feces is high, the filtration efficiency is lower compared to algae. Based on fatty acid profiling, we concluded that the scallops incorporated salmon feed and salmon feces; however, the use of stable isotopes of carbon and nitrogen to trace food sources were inconclusive. The fatty acid 18:1n9 is abundant in fish feed and feces but not in the microalgae used in this experiment, so it was used as a tracer. Its contents in the digestive gland and muscle suggest that scallops can utilize salmon feed and feces. The use of fatty acids was accordingly found to be a more sensitive method for tracing low concentrations of salmon waste feed components, provided that the natural seston diets have low and known contents of 18:1n9.
Ethics Statement
The present study involves scallops which is not regulated under the Norwegian regulations on the use of animals in experiments (FOR-2015-06-18-761). The experiment was carried out with great respect of scallops’ well being and were humanely killed after the experiments.
Author Contributions
MB was a part of planning the experiment, contributed and guided both the experiments and following analysis, and wrote the manuscript. LS did the major part of the experiments and analysis, and also contributed to the manuscript. AH, KR, ØS, and YO was a part of planning the experiment and contributed to the manuscript.
Conflict of Interest Statement
The authors declare that the research was conducted in the absence of any commercial or financial relationships that could be construed as a potential conflict of interest.
Acknowledgments
We would like to thank the Research Council of Norway for financing the EXPLOIT project (216201/E40). Dag Altin (Biotrix) is highly appreciated for lending laboratory equipment and for interesting discussions. We would also like to thank ScalPro for providing scallops for our laboratory experiment.
Supplementary Material
The Supplementary Material for this article can be found online at: https://www.frontiersin.org/articles/10.3389/fmars.2018.00524/full#supplementary-material
References
Bannister, R. J., Johnsen, I. A., Hansen, P. K., Kutti, T., and Asplin, L. (2016). Near- and far-field dispersal modelling of organic waste from Atlantic salmon aquaculture in fjord systems. ICES J. Mar. Sci. 9, 2408–2419. doi: 10.1093/icesjms/fsw027
Bligh, E. G., and Dyer, W. J. (1959). A rapid method of total lipid extraction and purification. Can. J. Biochem. Phys. 37, 911–917. doi: 10.1139/y59-099
Both, A., Parrish, C. C., and Penney, R. W. (2012). Growth and biochemical composition of Mytilus Edulis when reared on effluent from a cod, Gadus Morhua, aquaculture facility. J. Shellfish. Res. 31, 79–85. doi: 10.2983/035.031.0110
Both, A., Parrish, C. C., Penney, R. W., and Thompson, R. J. (2011). Lipid composition of Mytilus edulis reared on organic waste from a Gadus morhua aquaculture facility. Aquat. Living Resour. 24, 295–301. doi: 10.1051/alr/2011138
Brager, L., Cranford, P. J., Jansen, H. M., and Strand, Ø. (2016). Temporal variations in suspended particulate waste concentrations at open-water fish farms in Canada and Norway. Aquacult. Environ. Interact. 8, 437–452. doi: 10.3354/aei00190
Broch, O. J., and Slagstad, D. (2012). Modelling seasonal growth and composition of the kelp Saccharina latissima. J. Appl. Phycol. 24, 759–776. doi: 10.1007/s10811-011-9695-y
Brown, M. R., and Blackburn, S. I. (2013). “Live microalgae as live feeds in aquaculture hatcheries,” in . Chapter 4 in: Advances in Aquaculture Hatchery Technology, eds C. Dennis and M. Stringer (New York, NY: Woodhead Publishing Series in Food Science, Technology and Nutrition, Elsevier), 680. doi: 10.1533/9780857097460.1.117
Buschmann, A. H., Troell, M., and Kautsky, N. (2001). Integrated algal farming: a review. Cah. Biol. Mar. 42, 83–90.
Carroll, M. L., Cochrane, S., Fieler, R., Velvin, R., and White, P. (2003). Organic enrichment of sediments from salmon farming in Norway: environmental factors, management practices, and monitoring techniques. Aquaculture 226, 165–180. doi: 10.1016/S0044-8486(03)00475-7
Chopin, T., Buschmann, A. H., Halling, C., Troell, M., Kautsky, N., Neori, A., et al. (2001). Integrating seaweeds into marine aquaculture systems: a key toward sustainability. J. Phycol. 37, 975–986. doi: 10.1046/j.1529-8817.2001.01137.x
Cranford, P. J., and Grant, J. (1990). Particle clearance and absorption of phytoplankton and detritus by the sea scallop Placopecten magellanicus (Gmelin). J. Exp. Mar. Biol. Ecol. 137, 105–121. doi: 10.1016/0022-0981(90)90064-J
Cranford, P. J., Reid, G. K., and Robinson, S. M. C. (2013). Open water integrated multi-trophic aquaculture: constraints on the effectiveness of mussels as an organic extractive component. Aquacult. Environ. Interac. 4, 163–173. doi: 10.3354/aei00081
Dalsgaard, J., St John, M., Kattner, G., Muller-Navarra, D., and Hagen, W. (2003). Fatty acid trophic markers in the pelagic marine environment. Adv. Mar. Biol. 46, 225–340. doi: 10.1016/S0065-2881(03)46005-7
Daniel, R., Berteau, O., Jozefonvicz, J., and Goasdoue, N. (1999). Degradation of algal (Ascophyllum nodosum) fucoidan by an enzymatic activity contained in digestive glands of the marine mollusc Pecten maximus. Carbohyd. Res. 322, 291–297. doi: 10.1016/S0008-6215(99)00223-2
Davenport, J., Smith, R. J. J. W., and Packer, M. (2000). Mussels Mytilus edulis: significant consumers and destroyers of mesozooplankton. Mar. Ecol. Prog. Ser. 198, 131–137. doi: 10.3354/meps198131
Delaunay, F., Marty, Y., Moal, J., and Samain, J. F. (1993). The effect of monospecific algal diets on growth and fatty acid composition of Pecten maximus (L.) larvae. J. Exp. Mar. Biol. Ecol. 173, 163–179. doi: 10.1016/0022-0981(93)90051-O
DeNiro, M. J., and Epstein, S. (1977). Mechanism of carbon isotope fractionation associated with lipid-synthesis. Science 197, 261–263. doi: 10.1126/science.327543
Etter, S. A., Andresen, K., Leiknes,Ø., Wang, X. X., and Olsen, Y. (2017). Miljødokumentasjon Sunnmøre – Utslipp og vurdering av miljøvirkninger av næringssalter tilført fra oppdrett i regionen Sunnmøre i 2014 og 2015. Trondheim: Norges teknisk-naturvitenskapelige universitet (NTNU), Institutt for biologi, Trondhjem biologiske stasjon. NTNU-rapport.
Folke, C., Kautsky, N., and Troell, M. (1994). The costs of eutrophication from salmon farming: implications for policy. J. Environ. Manage. 40, 173–182. doi: 10.1006/jema.1994.1013
Gagné, R., Tremblay, R., Pernet, F., Miner, P., Samain, J. F., and Olivier, F. (2010). Lipid requirements of the scallop Pecten maximus (L.) during larval and post-larval development in relation to addition of Rhodomonas salina in diet. Aquaculture 370–371, 172–178. doi: 10.1016/j.aquaculture.2010.09.040
Gao, Q. F., Shin, P. K. S., Lin, G. H., Chen, S. P., and Cheung, S. G. (2006). Stable isotope and fatty acid evidence for uptake of organic waste by green-lipped mussels Perna viridis in a polyculture fish farm system. Mar. Ecol. Prog. Ser. 317, 273–283. doi: 10.3354/meps317273
Giese, A. C. (1966). Lipids in the economy of marine invertebrates. Physiol. Rev. 46, 244–298. doi: 10.1152/physrev.1966.46.2.244
Handå, A., Forbord, S., Wang, X. X., Broch, O. J., Dahle, S. W., Storseth, T. R., et al. (2013). Seasonal- and depth-dependent growth of cultivated kelp (Saccharina latissima) in close proximity to salmon (Salmo salar) aquaculture in Norway. Aquaculture 414, 191–201. doi: 10.1016/j.aquaculture.2013.08.006
Handå, A., Min, H. J. E., Wang, X. X., Broch, O. J., Reitan, K. I., Reinertsen, H., et al. (2012a). Incorporation of fish feed and growth of blue mussels (Mytilus edulis) in close proximity to salmon (Salmo salar) aquaculture: implications for integrated multi-trophic aquaculture in Norwegian coastal waters. Aquaculture 35, 328–341. doi: 10.1016/j.aquaculture.2012.04.048
Handå, A., Ranheim, A., Olsen, A. J., Altin, D., Reitan, K. I., Olsen, Y., et al. (2012b). Incorporation of salmon fish feed and feces components in mussels (Mytilus edulis): implications for integrated multi-trophic aquaculture in cool-temperate North Atlantic waters. Aquaculture 370, 40–53. doi: 10.1016/j.aquaculture.2012.09.030
Husa, V., Hansen, P. K., Bannister, R., Kutti, T., and Fredriksen, S. (2017). “Utslipp av partiklulære og løste stoffer fra matfiskanlegg,” in Kap 7 i Risikorapport Norsk Fiskeoppdrett 2017, eds. T. Svåsand, E. S. Grefsrud, Ø. Karlsen, B. O. Kvamme, K. Glover, V. Husa, and T. S. Kristiansen (Oslo: Fisken og havet).
Irisarri, J., Fernandez-Reiriz, M. J., De Troch, M., and Labarta, U. (2014). Fatty acids as tracers of trophic interactions between seston, mussels and biodeposits in a coastal embayment of mussel rafts in the proximity of fish cages. Comp. Biochem. Phys. B 172, 105–115. doi: 10.1016/j.cbpb.2014.04.006
Irisarri, J., Fernández-Reiriz, M. J., Labarta, U., Cranford, P. J., and Robinson, S. M. C. (2015). Availability and utilization of waste fish feed by mussels Mytilus edulis in a commercial integrated multi-trophic aquaculture (IMTA) system: a multi-indicator assessment approach. Ecol. Indicat. 48, 673–686. doi: 10.1016/j.ecolind.2014.09.030
Jakobsen, A. N., Aasen, I. M., Josefsen, K. D., and Strom, A. R. (2008). Accumulation of docosahexaenoic acid-rich lipid in thraustochytrid Aurantiochytrium sp strain T66: effects of N and P starvation and O(2) limitation. Appl. Microbiol. Biotecnol. 80, 297–306. doi: 10.1007/s00253-008-1537-8
Lander, T., Barrington, K., Robinson, S. M. C., MacDonald, B., and Martin, B. (2004). Dynamics of the blue mussel as an extractive organism in an integrated multi-trophic aquaculture system. Bull. Aquacult. Assos. Canada 904, 79–82.
Lander, T. R., Robinson, S. M. C., MacDonald, B. A., and Martin, J. D. (2013). Characterization of the suspended organic particles released fromsalmon farms and their potential as a food supply for the suspension feeder, Mytilus edulis in integrated multi-trophic aquaculture (IMTA) systems. Aquaculture 406, 160–171. doi: 10.1016/j.aquaculture.2013.05.001
Le Pennec, G., Le Pennec, M., and Beninger, P. G. (2001). Seasonal digestive gland dynamics of the scallop Pecten maximus in the Bay of Brest (France). J. Mar. Biol. Assoc. U.K. 81, 663–671. doi: 10.1017/S0025315401004349
Logan, J., Haas, H., Deegan, L., and Gaines, E. (2006). Turnover rates of nitrogen stable isotopes in the salt marsh mummichog, Fundulus heteroclitus, following a laboratory diet switch. Oecologia 147, 391–395. doi: 10.1007/s00442-005-0277-z
Lorrain, A., Paulet, Y. M., Chauvaud, L., Savoye, N., Donval, A., and Saout, C. (2002). Differential delta C-13 and delta N-15 signatures among scallop tissues: implications for ecology and physiology. J. Exp. Mar. Biol. Ecol. 275, 47–61. doi: 10.1016/S0022-0981(02)00220-4
Luoma, S. N., and Carter, J. L. (1991). “Effects of trace metals on aquatic benthos,” in Metal Ecotoxicology: Concepts and Applications, eds M. C. Newman and A. W. McIntosh (Lansing, MI: CRC Press).
MacDonald, B. A., Bricelj, V. M., and Shumway, S. E. (2006). “Physiology: energy acquisition and utilisation,” in Scallops: Biology, Ecology and Aquaculture, eds S. E. Shumway and G. J. Parsons (New York, NY: Elsevier).
Marin, V., Huntley, M. E., and Frost, B. (1986). Measuring feeding rates of pelagic herbivores – Analysis of experimental-design and methods. Mar. Biol. 93, 49–58. doi: 10.1007/BF00428654
Marty, Y., Delaunay, F., Moal, J., and Samain, J. F. (1992). Changes in the fatty acid composition of Pecten maximus (L.) during larval development. J. Exp. Mar. Biol. Ecol. 163, 221–234. doi: 10.1016/0022-0981(92)90051-B
Metcalfe, L. D., Schmitz, A. A., and Pelka, J. R. (1966). Rapid preparation of fatty acid esters from lipids for gas chromatographic analysis. Anal. Chem. 38, 514–515. doi: 10.1021/ac60235a044
Mohlenberg, F., and Riisgard, H. U. (1978). Efficiency of particle retention in 13 species of suspension feeding bivalves. Ophelia 17, 239–246. doi: 10.1080/00785326.1978.10425487
Olafsen, T., Winther, U., Olsen, Y., and Skjermo, J. (2012). Value Created From Productive Oceans in 2050. Trondheim: DKNVS and NTVA.
Olsen, S. A., Ervik, A., and Grahl-Nielsen, O. (2009). Deep-water shrimp (Pandalus borealis, Krøyer 1838) as indicator organism for fish-farm waste. J. Exp. Mar. Biol. Ecol. 381, 82–89. doi: 10.1016/j.jembe.2009.09.019
Olsen, S. A., Ervik, A., and Grahl-Nielsen, O. (2012). Tracing fish farm waste in the northern shrimp Pandalus borealis (Kroyer, 1838) using lipid biomarkers. Aquacult. Environ. Interac. 2, 133–144. doi: 10.3354/aei00036
Parrish, C. C., Wells, J. S., Yang, Z., and Dabinett, P. (1999). Growth and lipid composition of scallop juveniles, Placopecten magellanicus, fed the flagellate Isochrysis galbana with varying lipid composition and the diatom Chaetoceros muelleri. Mar. Biol. 133, 461–471. doi: 10.1007/s002270050486
Paulet, Y. M., Lorrain, A., Richard, J., and Pouvreau, S. (2006). Experimental shift in diet δ13C: a potential tool for ecophysiological studies in marine bivalves. Org. Geochem. 37, 1359–1370. doi: 10.1016/j.orggeochem.2006.01.008
Peharda, M., Župan, I., Bavčević, L., Frankić, A., and Klanjšček, T. (2007). Growth and condition index of mussel Mytilus galloprovincialis in experimental integrated aquaculture. Aquacult. Res. 38, 1714–1720. doi: 10.1111/j.1365-2109.2007.01840.x
Peterson, B. J., and Fry, B. (1987). Stable isotopes in ecosystem studies. Annu. Rev. Ecol. Syst. 18, 293–320. doi: 10.1146/annurev.es.18.110187.001453
Redmond, K. J., Magnesen, T., Hansen, P. K., Strand, O., and Meier, S. (2010). Stable isotopes and fatty acids as tracers of the assimilation of salmon fish feed in blue mussels (Mytilus edulis). Aquaculture 298, 202–210. doi: 10.1016/j.aquaculture.2009.10.002
Reitan, K. I. (2011). Digestion of lipids and carbohydrates from microalgae (Chaetoceros muelleri Lemmermann and Isochrysis aff. galbana clone T-ISO) in juvenile scallops (Pecten maximus L.). Aquacult. Res. 42, 1530–1538. doi: 10.1111/j.1365-2109.2010.02745.x
Reuss, N., and Poulsen, L. (2002). Evaluation of fatty acids as biomarkers for a natural plankton community. A field study of a spring bloom and a post-bloom period off West Greenland. Mar. Biol. 141, 423–434. doi: 10.1007/s00227-002-0841-6
Riisgard, H. U. (1988). Efficiency of particle retention and filtration-rate in 6 species of Northeast American Bivalves. Mar. Ecol. Prog. Ser. 45, 217–223. doi: 10.3354/meps045217
Sara, G., Zenone, A., and Tomasello, A. (2009). Growth of Mytilus galloprovincialis (mollusca, bivalvia) close to fish farms: a case of integrated multi-trophic aquaculture within the tyrrhenian Sea. Hydrobiologia 636, 129–136. doi: 10.1007/s10750-009-9942-2
Sargent, J. R., Tocher, D. R., and Bell, J. G. (2002). “The Lipids,” in Fish Nutrition, Third Edn, eds E. H. John and W. H. Ronald (San Diego, CA: Academic Press).
Seguel, M., Osses, J., Farias, A., Avila, M., Plaza, H., and Pavez, H. (1998). Evaluación del Efecto de Mitigación de Aporte de Nutrientes al Medio, al Desarrollar Policultivos Marinos de Salmónidos. FIP-IT/94-01. Hague: Instituto de Fomento Pesquero.
Shin, P. K. S., Cheung, S. G., Tsang, T. Y., and Wai, H. Y. (2014). Ecology of artificial reefs in the subtropics. Adv. Mar. Biol. 68, 1–63. doi: 10.1016/B978-0-12-800169-1.00001-X
Shumway, S. E., and Parsons, G. J. (2006). Scallops: Biology, Ecology and Aquaculture. New York, NY: Elsevier.
Stirling, H. P., and Okumuş, I. (1995). Growth and production of mussels (Mytilus edulis L.) suspended at salmon cages and shellfish farms in two Scottish sea lochs. Aquaculture 134, 193–210. doi: 10.1016/0044-8486(95)00033-X
Strohmeier, T., Duinker, A., and Lie, O. (2000). Seasonal variations in chemical composition of the female gonad and storage organs in Pecten maximus (L.) suggesting that somatic and reproductive growth are separated in time. J. Shellfish. Res. 19, 741–747.
Taranger, G. L., Karlsen,Ø., Bannister, R. J., Glover, K. A., Husa, V., Karlsbakk, E., et al. (2014). Risk assessment of the environmental impact of Norwegian Atlantic salmon farming. ICES J. Mar. Sci. 72, 997–1021. doi: 10.1093/icesjms/fsu132
Tieszen, L. L., Boutton, T. W., Tesdahl, K. G., and Slade, N. A. (1983). Fractionation and turnover of stable carbon isotopes in animal tissues: implications for δ13C analysis of diet. Oecologia 57, 32–37. doi: 10.1007/BF00379558
Troell, M., Joyce, A., Chopin, T., Neori, A., Buschmann, A. H., and Fang, J. G. (2009). Ecological engineering in aquaculture – Potential for integrated multi-trophic aquaculture (IMTA) in marine offshore systems. Aquaculture 297, 1–9. doi: 10.1016/j.aquaculture.2009.09.010
Troell, M., and Norberg, J. (1998). Modelling output and retention of suspended solids in an integrated salmon-mussel culture. Ecol. Eng. 110, 65–77. doi: 10.1016/S0304-3800(98)00042-8
Van Biesen, G., and Parrish, C. C. (2005). Long-chain monounsaturated fatty acids as biomarkers for the dispersal of organic waste from a fish enclosure. Mar. Environ. Res. 60, 375–388. doi: 10.1016/j.marenvres.2004.12.003
Wallace, J. C. (1980). Growth-rates of different populations of the edible mussel, Mytilus edulis, in north Norway. Aquaculture 19, 303–311. doi: 10.1007/BF00390381
Wang, X. X., Andresen, K., Handa, A., Jensen, B., Reitan, K. I., and Olsen, Y. (2013). Chemical composition and release rate of waste discharge from an Atlantic salmon farm with an evaluation of IMTA feasibility. Aquacult. Environ. Interac. 4, 147–162. doi: 10.3354/aei00079
Keywords: scallops, Pecten maximus, salmon waste, IMTA, fatty acid profiling, stable isotopes
Citation: Bergvik M, Stensås L, Handå A, Reitan KI, Strand Ø and Olsen Y (2019) Incorporation of Feed and Fecal Waste From Salmon Aquaculture in Great Scallops (Pecten maximus) Co-fed by Different Algal Concentrations. Front. Mar. Sci. 5:524. doi: 10.3389/fmars.2018.00524
Received: 12 October 2018; Accepted: 21 December 2018;
Published: 11 January 2019.
Edited by:
António V. Sykes, Centro de Ciências do Mar (CCMAR), PortugalReviewed by:
Max Fredrik Troell, Beijer Institute of Ecological Economics, SwedenReece Wartenberg, City University of Hong Kong, Hong Kong
Copyright © 2019 Bergvik, Stensås, Handå, Reitan, Strand and Olsen. This is an open-access article distributed under the terms of the Creative Commons Attribution License (CC BY). The use, distribution or reproduction in other forums is permitted, provided the original author(s) and the copyright owner(s) are credited and that the original publication in this journal is cited, in accordance with accepted academic practice. No use, distribution or reproduction is permitted which does not comply with these terms.
*Correspondence: Maria Bergvik, maria.bergvik@gmail.com
†Present address: Maria Bergvik, Planktonic AS, Trondheim, Norway Lene Stensås, Langstein Fisk AS, Skatval, Norway