Assessing Vulnerability of Fish in the U.S. Marine Aquarium Trade
 Laura E. Dee
 Kendra Anne Karr
 Celia J. Landesberg3
  Daniel J. Thornhill
- 1Department of Fisheries, Wildlife, and Conservation Biology, University of Minnesota, St. Paul, MN, United States
- 2Oceans Program, Environmental Defense Fund, San Francisco, CA, United States
- 3Department of Geography and the Environment, University of Richmond, Richmond, VA, United States
- 4Department of Biological Sciences, Auburn University, Auburn, AL, United States
The trade in coral reef fishes for aquariums encompasses over 1,800 species from over 40 exporting countries, yet the population status for most traded species is unknown and unevaluated. At the same time, these coral reef fishes face a growing number of threats and often occur in jurisdictions with limited management capacity and data. In response, we assess vulnerability to overfishing for 72 coral reef fishes popular in the aquarium trade for the United States – the top importer – from the top exporting countries (Indonesia and the Philippines). We use a data-limited assessment approach: productivity susceptibility analysis (PSA). PSA estimates relative vulnerability of species by assessing their biological productivity and susceptibility to overfishing. The most and least vulnerable stocks were differentiated by attributes related to the reproductive biology (e.g., breeding strategy, recruitment pattern, and fecundity), appropriateness, for an average home aquarium, ease of capture (e.g., schooling and aggregation), and rates of natural mortality. Our analysis identifies several of the most and least vulnerable species popular in the aquarium fish trade. The species that ranked as least vulnerable to overcollection were Gobiodon okinawae, Nemateleotris magnifica, Gobiodon acicularis, Salarias fasciatus, Ptereleotris zebra, Gobiodon citrinus, Pseudocheilinus hexataenia, Chaetodon lunula, Nemateleotris decora, and Halichoeres chrysus. In contrast, the ten most vulnerable species were Chromileptes altivelis, Plectorhinchus chaetodonoides, Pterapogon kauderni, Premnas biaculeatus, Echidna nebulosa, Centropyge bicolor, Zebrasoma veliferum, Pomacanthus semicirculatus, Zebrasoma scopas, and Thalassoma lunare. In a data-limited context, we suggest how these vulnerability rankings can help guide future efforts for reducing vulnerability risk. In particular, species that are relatively high-vulnerability are prime targets for research and aquaculture efforts, increased monitoring of collection and exports, species-specific stock assessments, and voluntary reductions by retailers and consumers to avoid overexploitation.
Introduction
Fisheries are an important livelihood source for millions of people worldwide. Yet, most fisheries lack the necessary data, resources, infrastructure, and expertise to use conventional statistical stock assessment for formal management (Honey et al., 2010; Costello et al., 2012). In these data-limited fisheries, assessing the status of fish stocks and implementing science-based management present challenges for managers. The ensuing lack of information, management, and capacity can lead to diminished economic and social benefits from fisheries, as well as ecological degradation (Beddington et al., 2007; Willman et al., 2009). This challenge is notable for coral reef species: there is a large diversity of species, and many species face myriad threats ranging from climate change to pollution and overfishing (Burke et al., 2011). The aquarium fish trade exemplifies the issue, encompassing over 1,800 species of coral reef fishes from over 40 exporting countries (Wabnitz et al., 2003; Tissot et al., 2010; Rhyne et al., 2012a). These fisheries support livelihoods, provide benefits to hobbyists, and contribute to education efforts about coral reefs (Rhyne et al., 2014). At the same time, potential pressures from collection of fish populations are occurring in addition to other threats facing coral reef species and habitats (e.g., climate change, habitat degradation, pollution), including from food fisheries (Hixon et al., 2014). Similarly, destructive fishing methods used to collect fishes, like cyanide fishing, degrade habitats for aquarium fishes (Bruckner and Roberts, 2008). The majority of countries involved in the aquarium trade, including the top exporting countries (Indonesia and the Philippines), have limited fisheries management and formal stock assessments (Dee et al., 2014; Fujita et al., 2014; Rhyne et al., 2015).
For almost all of the species in the trade, the population status and the effects of collection are unknown and unassessed (Dee et al., 2014; International Union for the Conservation of Nature, 2014). As a result, there is limited information about which species most need a population assessment, monitoring, or other management interventions, for many developing locations. On one hand, limited management and unsustainable or destructive fishing practices (e.g., methods like cyanide fishing that also impact habitat) could leave species vulnerable to overharvest (here ‘overcollection’) (Schmidt and Kunzmann, 2005; Bruckner and Roberts, 2008; Thornhill, 2012). Overcollection has been reported for a small number of species, such as Pterapogon kauderni, Synchiropus splendidus, and various Amphiprion spp. (Allen, 2000; reviewed in Thornhill, 2012), in addition to other threats (e.g., Indrawan, 1999; Lilley, 2008). On the other hand, many other aquarium reef fishes possess life history traits that buffer populations from overharvest (e.g., many are naturally short-lived and highly fecund), such that collection could continue to provide benefits to local communities without posing a risk to populations of species (Rhyne et al., 2012a). However, nearly all ornamental species are understudied, have minimal monitoring, go unmanaged, or are managed with little scientific input (Dee et al., 2014). Based on the findings of Fujita et al. (2014), there is still a strong need to identify individual species vulnerable to overcollection, as well as to prioritize future monitoring and management interventions across data-limited aquarium fish species.
To address this knowledge gap and to make management recommendations, we assess the vulnerability to overcollection for 72 popular species imported into the United States (U.S.) – the world’s highest consumer of aquaria fishes – from the largest-volume exporting countries, the Philippines and Indonesia (Tissot et al., 2010; Rhyne et al., 2015, 2017). Popular fishes in the U.S. trade were identified based on import data (from Rhyne et al., 2015, 2017) and defined as species that were among the top-100 imported during at least 1 year in which data were available. We use a risk-based prioritization tool, productivity susceptibility analysis (PSA; Patrick et al., 2009). Given the data-limited status of the majority of species that are represented in the aquarium fish trade, risk assessment provides a useful starting point for individual species to be quantitatively ranked based on their relative vulnerability to overfishing, with more vulnerable species then prioritized for data collection, stock assessments, or conservation and management interventions (Cope et al., 2011; Fujita et al., 2014; Okemwa et al., 2016; Puga et al., 2018). We identify the species most and least vulnerable to overcollection, and suggest harvest control measures that different stakeholders could take to reduce overcollection risk of individual species. We also synthesize the attributes of species that drive vulnerability and find that susceptibility to collection rather than low intrinsic productivity drives the vulnerability of many aquarium fishes in the analysis, in contrast to many fishes caught for food (Cope et al., 2011; Fujita et al., 2014).
Materials and Methods
We evaluated the vulnerability of 72 species popular in the U.S. aquarium fish trade from Indonesia and the Philippines. Species were selected by considering trends in U.S. import volume, because the U.S. is the top importing country by volume (Tissot et al., 2010), and species originating from Indonesia and the Philippines, as top exporting countries to the U.S. by volume (Rhyne et al., 2015; Rhyne et al., 2017). In addition, fisheries in both Indonesia and the Philippines are considered data-limited (Dee et al., 2014). We selected species to evaluate based on U.S. fish import records (based on data from Rhyne et al., 2015; Rhyne et al., 2017) from the available years (2000, 2004, 2005, 2008, 2009, 2011), as well as importance within the marine aquarium trade according to published scientific literature and reports (Wood, 2001; Wabnitz et al., 2003; Rhyne et al., 2012b; Reef Protection International [RPI], 2013; Sustainable Aquarium Industry Association [SAIA], 2014) and informal surveys of fish species sold by major U.S. retailers. These species include 19 of the top 20 species imported by volume combined from both Indonesia and the Philippines (based on Rhyne et al., 2015; Rhyne et al., 2017; see the Supplementary Information for the full species list).
We use Productivity Susceptibility Analysis (PSA; Patrick et al., 2009) to assess the vulnerability of 72 reef fish stocks to overfishing; henceforth the combination of species and region of collection will be referred to as stocks (see Supplementary Table S1 for more details). PSA semi-quantitatively estimates and compares species productivity and susceptibility using available life history, population, and fishery information (Patrick et al., 2009). Productivity is an approximation of a stock’s ability to rebound from depletions based on 10 different life history attributes, whereas susceptibility estimates the likelihood of population declines based on 12 catchability, management, and fishing practice attributes that are location-specific (see Supplementary Table S1). Stocks with low productivity estimates are predisposed to overfishing due to attributes like slow growth rates, delayed maturation, or limited fecundity. By contrast, stocks with high susceptibility estimates are exposed to overfishing due to attributes such as limited management, schooling behaviors, and fisheries practices that damage habitat. Supplementary Table S1 provides scoring criteria for each life history attribute and additional explanations of scoring categories (Supplementary Information). Overall, productivity attributes should be similar across the geographic distribution of the stock, except in cases where there are large spatial differences in environmental conditions. Susceptibility attributes are more likely to vary among regions based on the local attributes of the fishing fleet, including vessel size, gear types and other target species.
When combined, the estimates of productivity and susceptibility produce a semi-quantitative assessment of relative vulnerability. Following attribute scoring, we calculated productivity and susceptibility for each stock using NOAA-Fisheries PSA software package v1.41, as the average of the 10 productivity and 12 susceptibility attributes, respectively. The stocks’ vulnerability to overcollection was quantified as the Euclidian distance from the plot origin of low susceptibility and high productivity (i.e., 1, 3) to each data point on Figure 1. Specifically, following Patrick et al. (2009), the vulnerability score (V) for each stock is calculated as
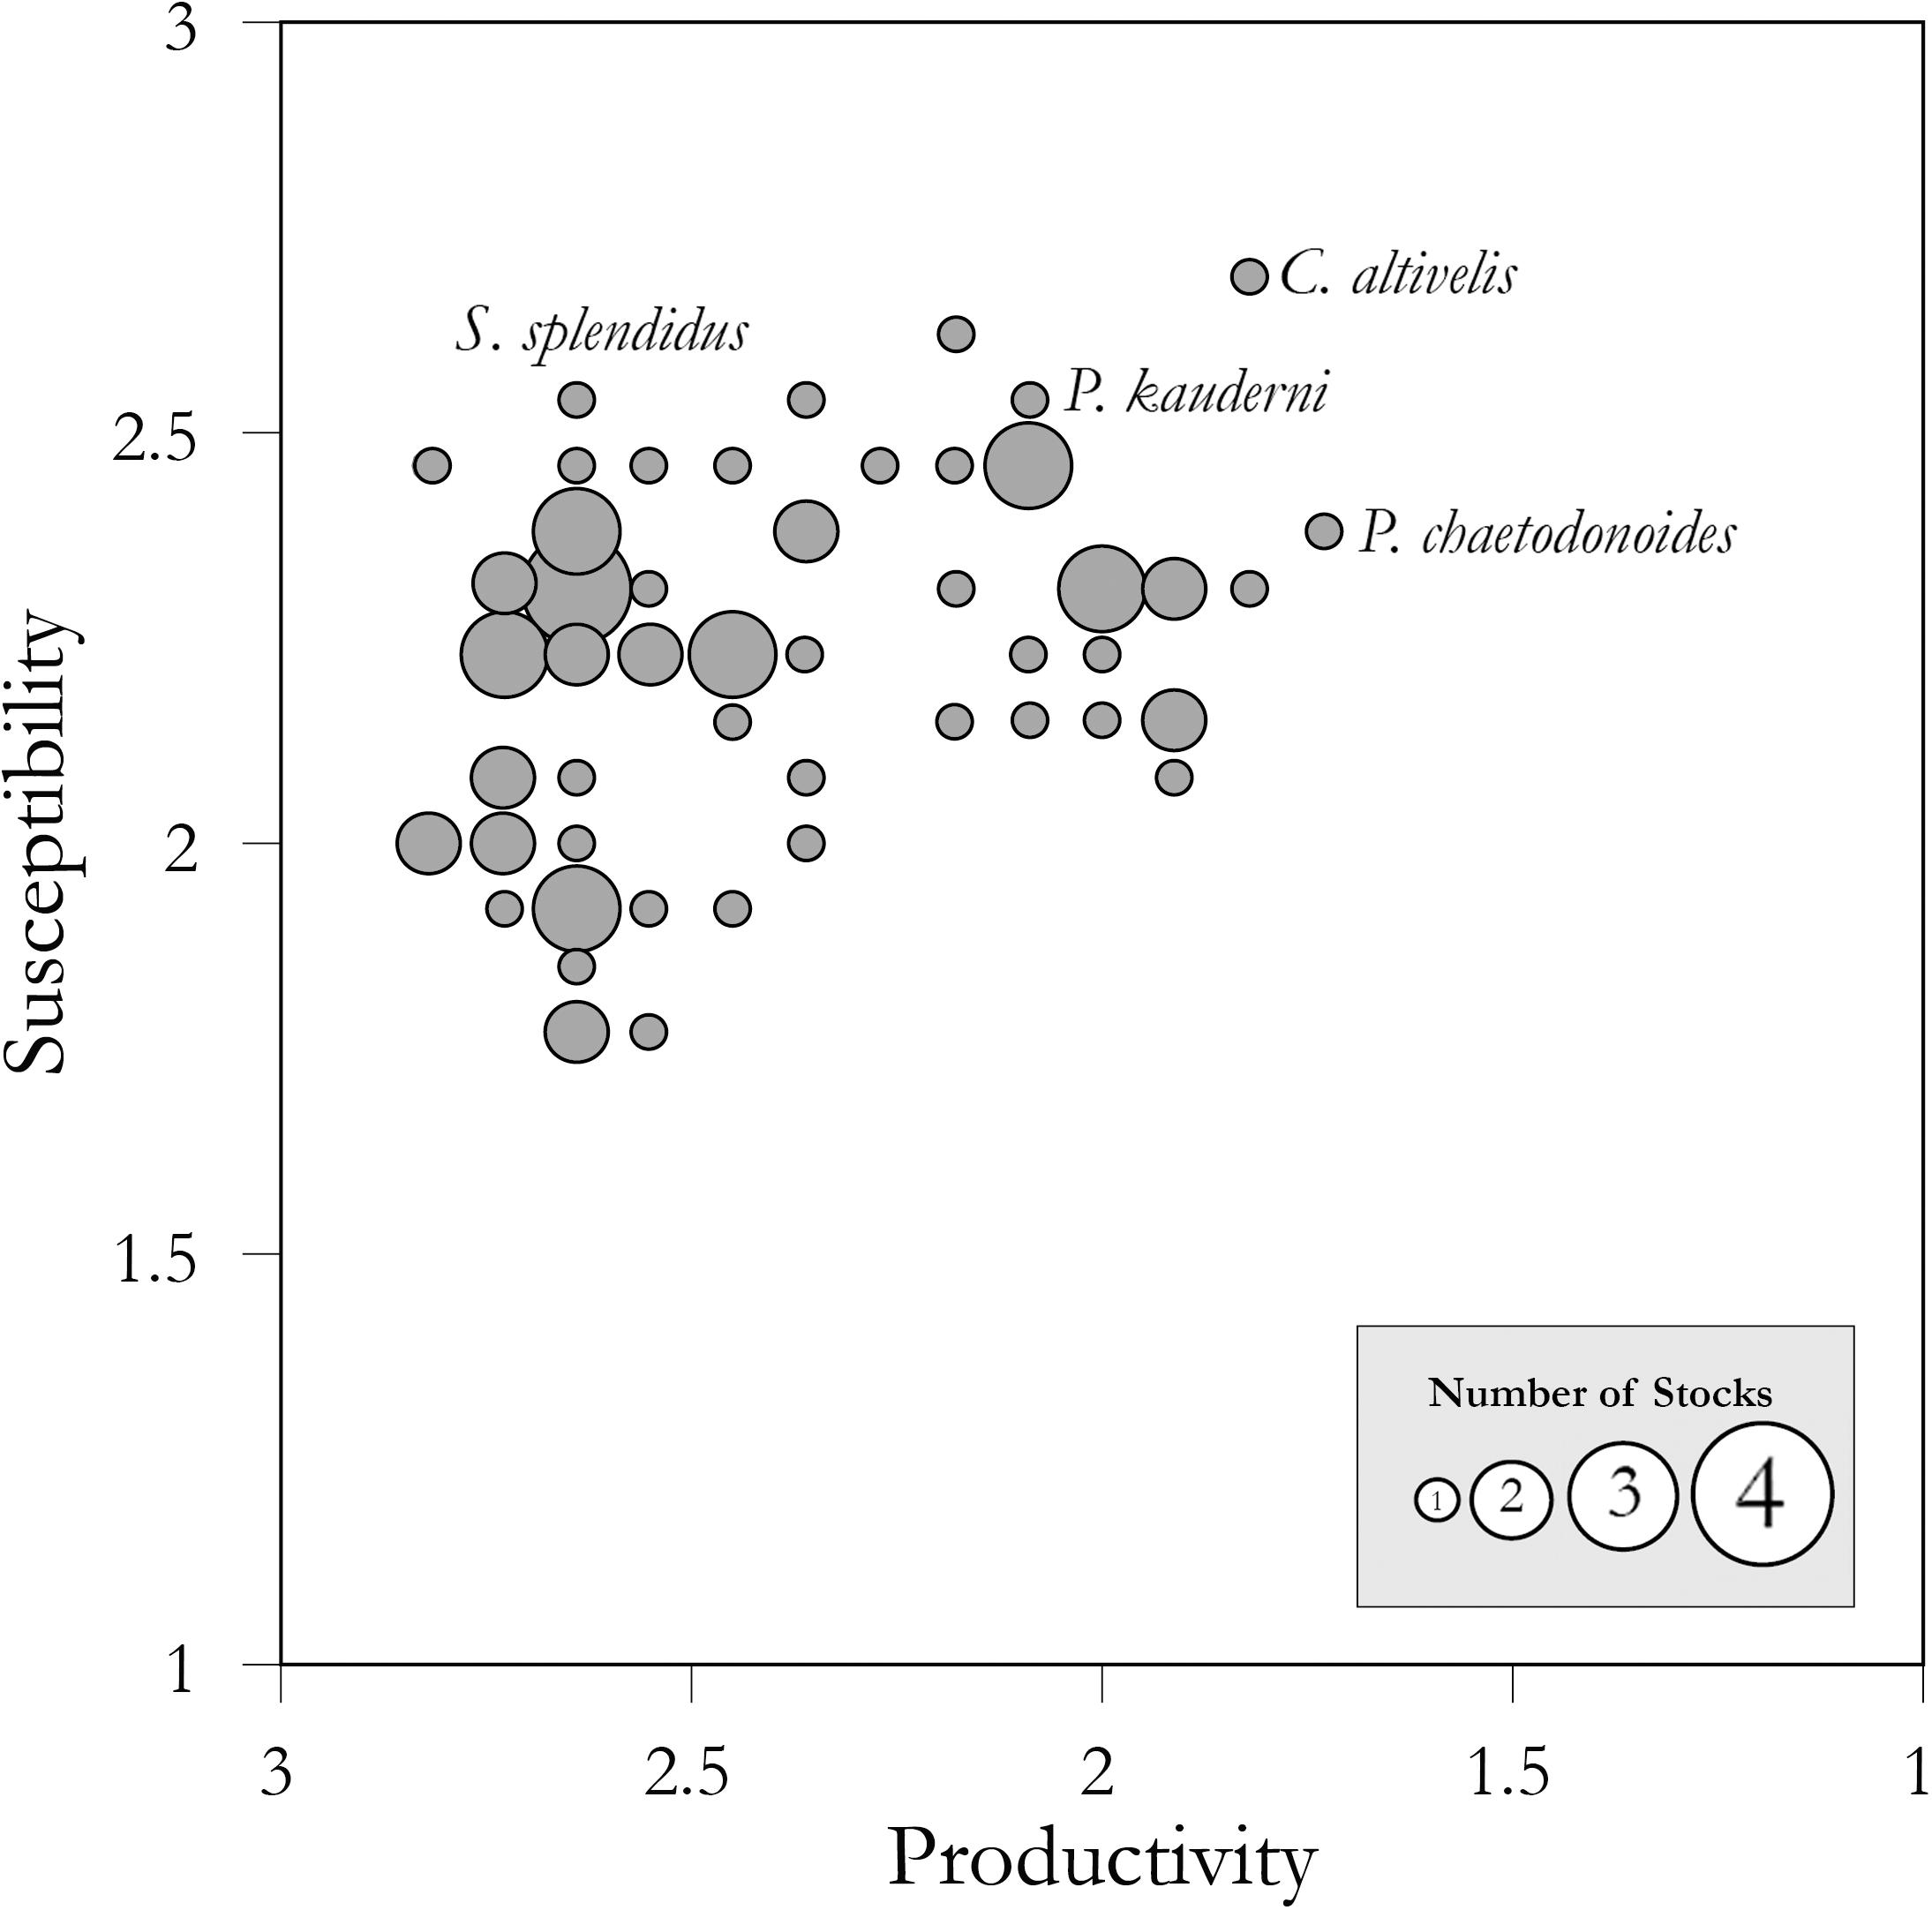
Figure 1. Scatterplot of productivity versus susceptibility scores for 72 coral reef fish stocks as estimated by PSA. Circle size corresponds to the number of stocks at that position on the graph (see inset legend). Scientific names of the stocks highlighted in the text are noted. Following standard PSA methods from Patrick et al. (2009), the x-axis scale is reversed (from high to low productivity).
where p is the average of the attribute scores for productivity and s is the average of the attribute scores for susceptibility. Following standard PSA methods from Patrick et al. (2009), the x-axis scale is reversed (from high to low productivity).
We scored the 10 productivity and 12 susceptibility attributes for each stock. Attributes are on a scale of 1 (reflecting low productivity or susceptibility) to 3 (high productivity or susceptibility) and were determined based on the available primary literature, gray literature, expert consultation, and online databases. We used Patrick et al. (2009)’s default value judgments, assumptions, attribute weightings, and data quality weightings throughout the analysis (see Supplementary Information; summarized in Supplementary Tables S1, S2), with a few exceptions made due to either data limitations or the unique characteristics of aquarium fisheries from coral reefs (see Supplementary Table S1 for details). Our analysis was customized to the aquarium trade in one important way that differed from other PSAs, including Fujita et al. (2014). We replaced the “seasonal migration” susceptibility category with an “appropriateness” category aimed at capturing mortality in the supply chain and difficulty of care in captivity. Seasonal migration is not a useful category for species in the aquarium trade as these fish are almost all demersal reef dwellers that do not migrate and would thus be scored identically in this category. Conversely, species with high mortality following capture need to be collected at higher volumes to maintain adequate supply for consumers (Schmidt and Kunzmann, 2005). Species vary widely in their survival following capture and thus this customized category for the aquarium trade provides additional insight into the vulnerabilities of aquarium trade fishes.
We provide all attribute scores (Supplementary Table S2) and source references (Supplementary Table S3) so that this information can be used in future analyses or be updated as new information becomes available. To insure scoring accuracy and consistency, each author independently checked attribute score determination for every stock in the analysis. Additionally, six external reviewers (see Acknowledgments) audited and critiqued a subset of attribute scores (approximately 20% of the data). Almost all of the scoring determinations were consistent across individuals. When differences occurred, they were resolved via re-review of the primary source material and discussed until coauthors and external experts unanimously agreed upon a new estimate. Data quality scores reflect confidence in the information utilized, but these scores do not impact the estimates of productivity or susceptibility. The index is based on five tiers, ranging from best data (1) or high belief to no data (5) to assess the individual attributes (see Supplementary Information). The data quality score for productivity and susceptibility are calculated as a weighted average of the data quality scores for the individual attributes, and provides an estimate of uncertainty for an individual vulnerability scores and denotes the overall quality of the data or belief in the score.
Finally, we explore how improved management or sourcing species from locations with low versus high management capacity could change vulnerability scores (via altering susceptibility). Although aquarium fisheries in many countries are unregulated, management and fishing practices vary widely across countries. For example, Australia has local enforcement, fisheries management measures, and export regulations, whereas the Philippines has little regulation and oversight of fisheries or exports (Roelofs, 2008; Roelofs and Silcock, 2008; Dee et al., 2014). To illustrate the sensitivity of vulnerability scores to management systems, we compared outcomes from the Philippines and Australia (management information in Dee et al., 2014) for 12 fish species collected from both locations (according to Ochavillo et al., 2004; Gonzales and Savaris, 2005; Ryan and Clarke, 2005; Roelofs and Silcock, 2008). To compare, we scored the management strategy and impact to essential fish habitat susceptibility attributes in the Philippines stocks as 3 and Australian stocks as 1. We used this comparison as a proxy for how improving management could affect susceptibility and therefore vulnerability scores, as well as to analyze the sensitivity of our results to the source location.
Results
The PSA estimated that these 72 coral reef aquarium fishes were moderately to highly productive (productivity = 1.73–2.82) and moderately to highly susceptible to collection (susceptibility = 1.77–2.69) (Figure 1, Table 1, and Supplementary Table S4). Combining these productivity and susceptibility estimates yielded vulnerability scores ranging from low (e.g., 0.85 for the Yellow clown goby, Gobiodon okinawae, and 0.89 for the Firefish goby, Nemateleotris magnifica) to moderately high (e.g., 1.88 for Plectorhinchus chaetodonoides and 2.06 for C. altivelis, the most vulnerable species to overcollection in the analysis) (Table 1, Figure 1, and Supplementary Table S4). Following the Panther grouper (C. altivelis), the top ten most vulnerable species also included the Harlequin sweetlips (Plectorhinchus chaetodonoides), the Banggai cardinalfish (P. kauderni), and the Maroon clownfish (P. biaculeatus) (Table 1A). For 17 species in both analyses, we compare our results to the PSA from Fujita et al. (2014) (Supplementary Table S5).
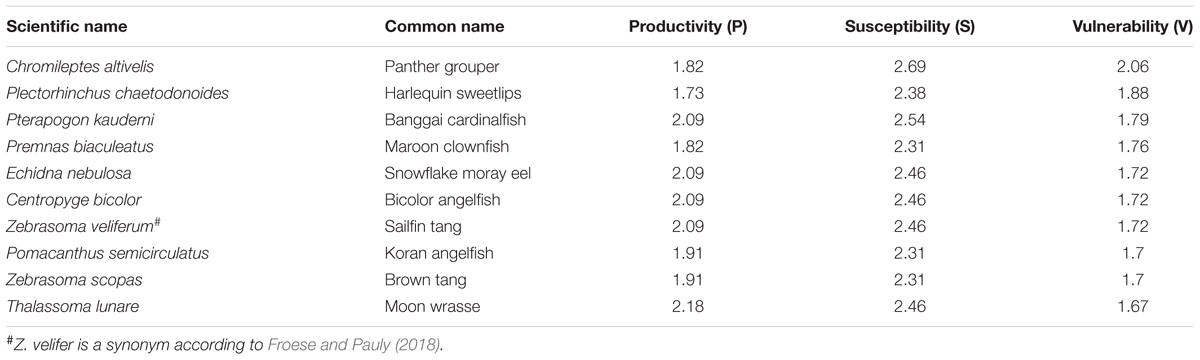
Table 1A. Vulnerability (V) scores for the top 10 most vulnerable species in the assessment, ranked from high to low vulnerability.
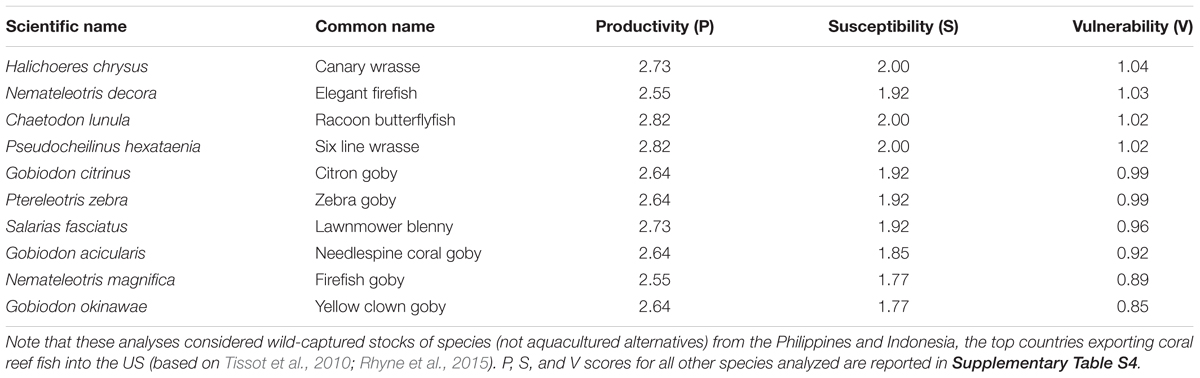
Table 1B. Vulnerability (V) scores for the 10 least vulnerable species in the assessment, ranked from highest to lowest vulnerability.
The factors that led to relatively high vulnerability estimates varied among stocks (Figure 2). For example, the Banggai cardinalfish was one of the most vulnerable stocks in the analysis due to low fecundity, a breeding strategy (male mouth brooding) that involves considerable parental care and limited dispersal of offspring, endemism within the Banggai Archipelago of Indonesia, areal and depth overlap between the fishery and species distribution, and aggregation behavior that facilitates capture (Kolm and Berglund, 2003). By comparison, Mandarinfish, S. splendidus, had a high productivity score (2.73) yet scored as relatively vulnerable due to high susceptibility from injurious collection methods (needle-spear fishing) and a specialized diet that increases chances that individuals starve in captivity, driving further collection (Sadovy et al., 2001; Gonzales and Savaris, 2005; Michael, 2005). As a final example, the Harlequin sweet lips, P. chaetodonoides, scored among the most vulnerable stocks due to its slow growth rate, high trophic level, as well as its large size and unappealing appearance as adults which requires a high level of expertise to keep in home aquariums.
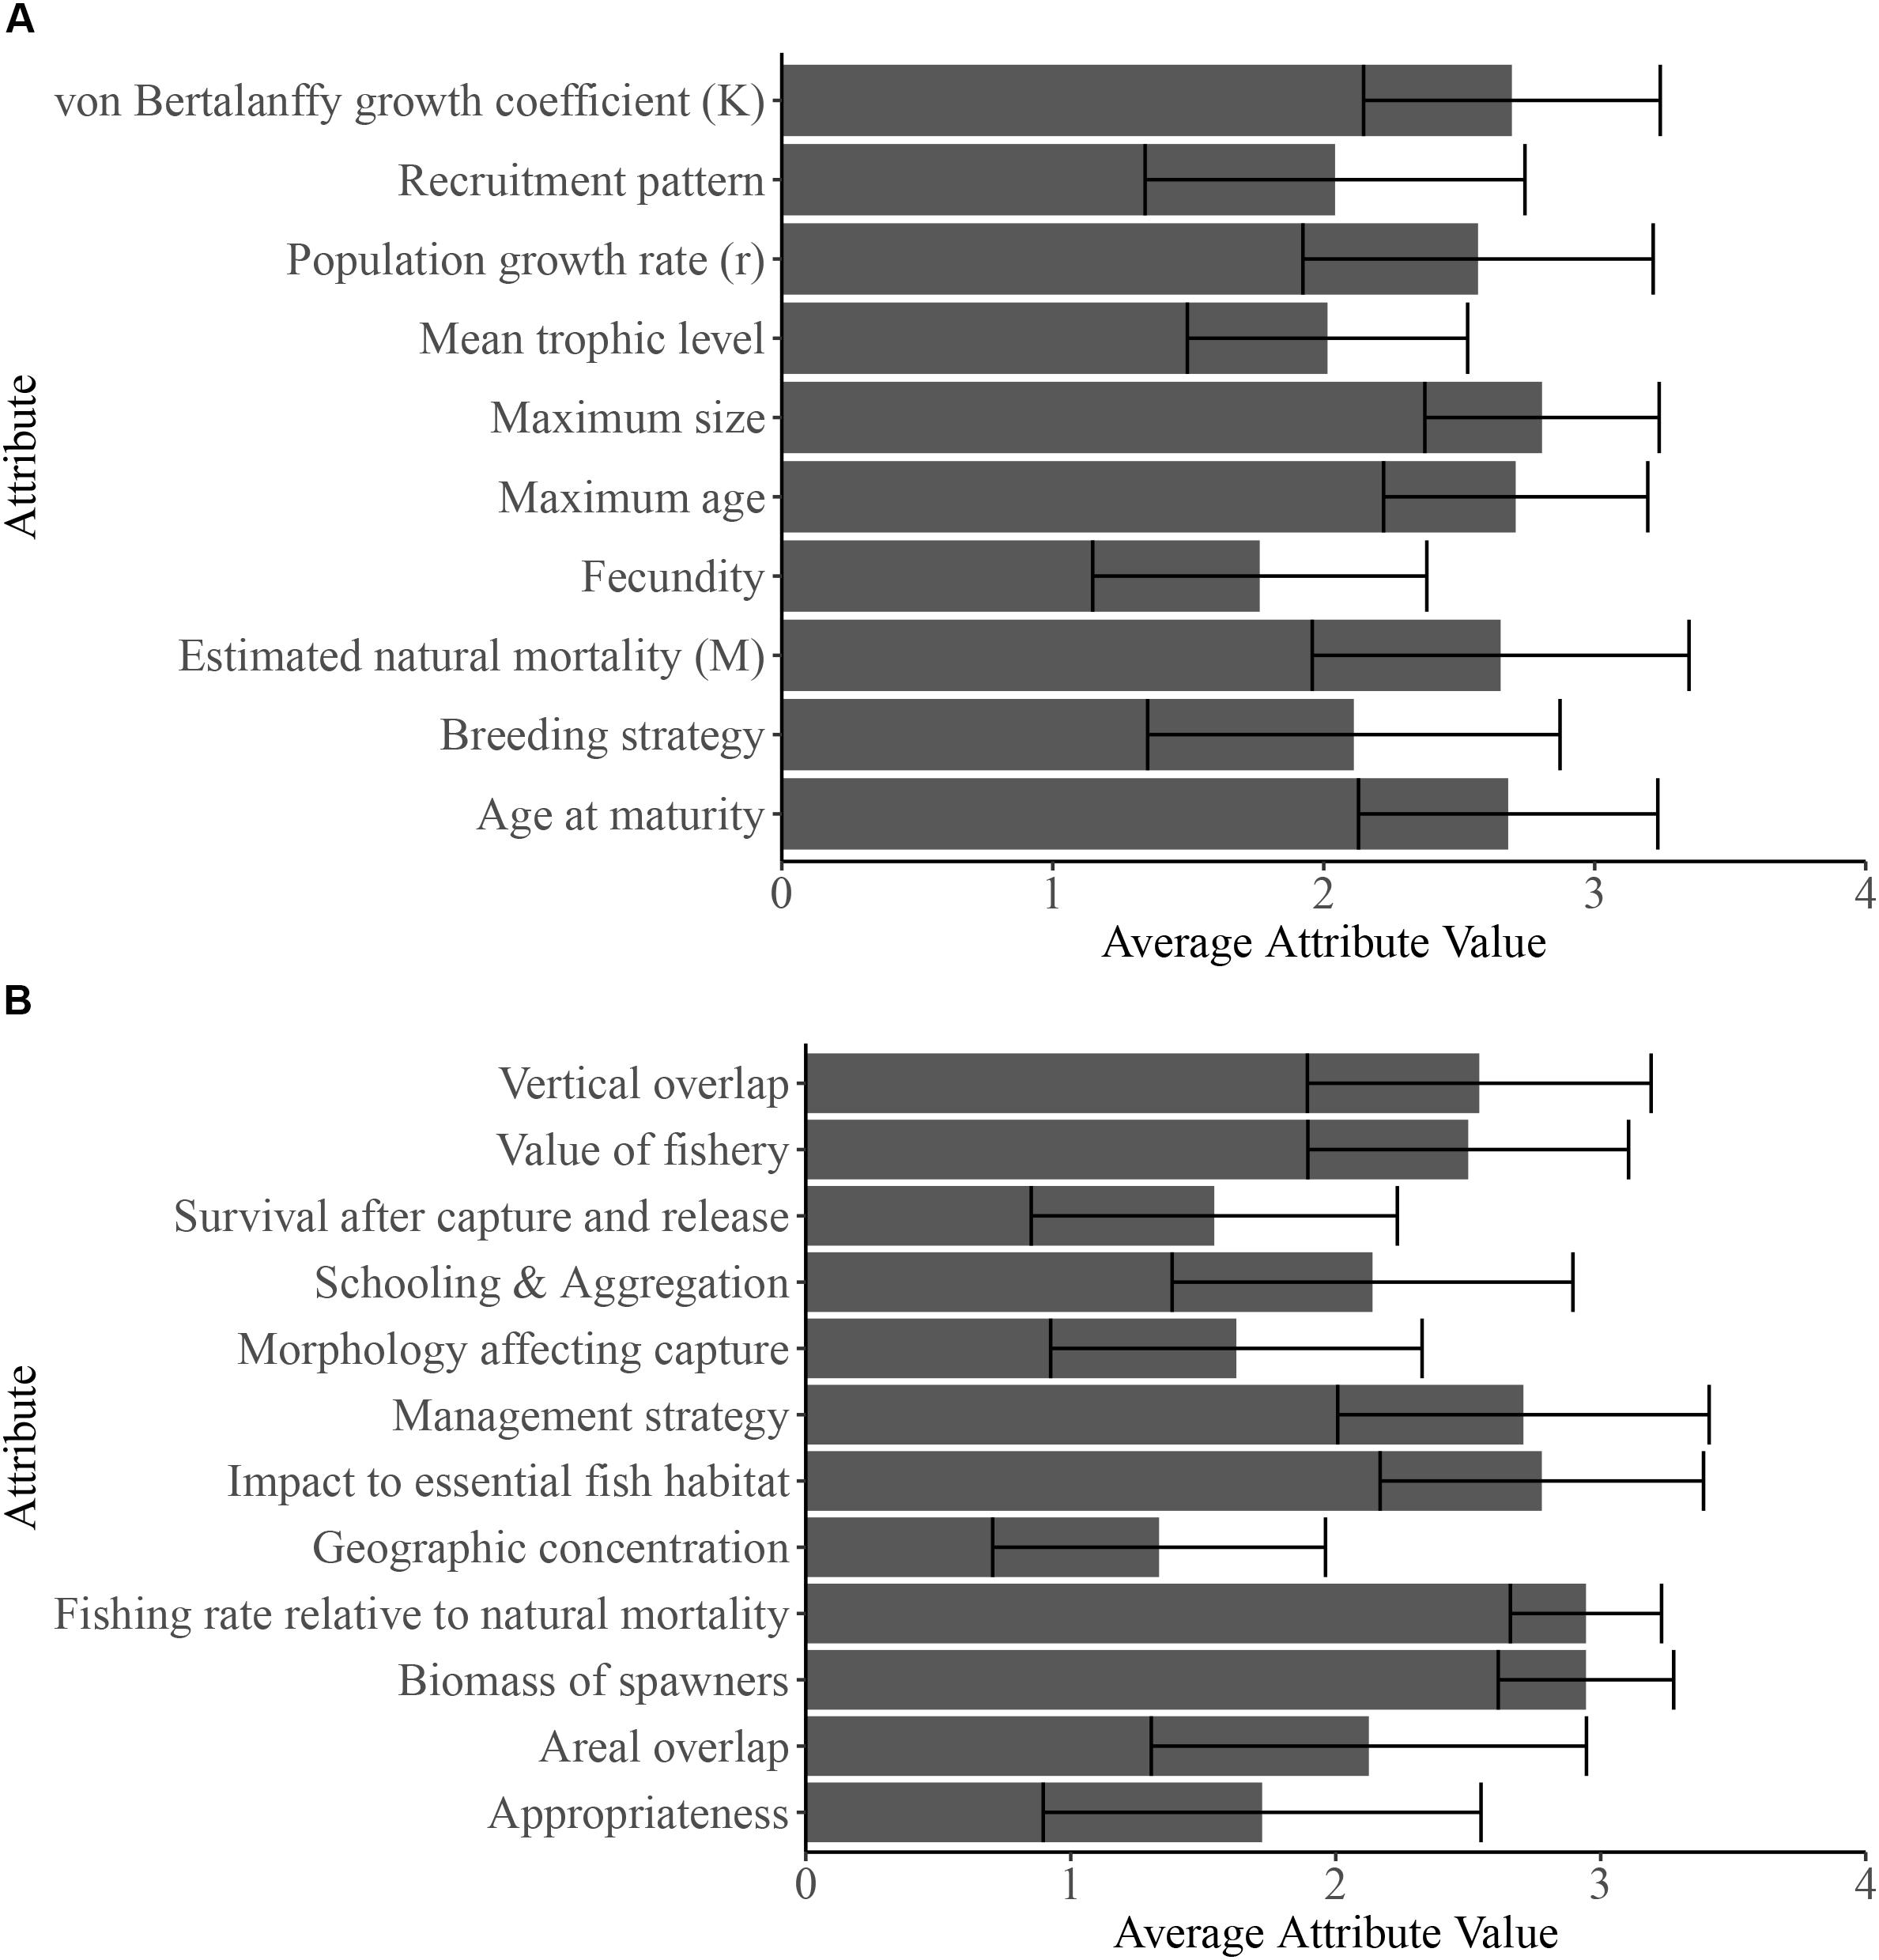
Figure 2. Averages of each attribute score for the (A) 10 productivity (‘P’) and (B) 12 susceptibility (‘S’) attributes for the 72 stocks. Error bars represent +/-1 standard deviation. Supplementary Table S1 provides details about the attribute categories, and the Supplementary Information provides criteria and for attribute scoring. Supplementary Table S2 provides the attribute scores for each stock and attribute.
Many of the aquarium fish species that we reviewed share similar productivity and susceptibility attribute scores. On average, many aquarium fishes share attributes that reflect high productivity – i.e., rapid population growth rates, low maximum age, small body size, rapid growth from juveniles to adults, maturation at an early age, high natural mortality, and distribution over a large oceanographic area (Figure 2). These species also shared many susceptibility scores based on the locations of their fisheries in Indonesia and the Philippines (i.e., on average, in places with low management capacity, measures, monitoring, and enforcement, reviewed in Dee et al., 2014). For instance, to our knowledge, most stocks occurred in fisheries with little to no management measures, high vertical overlap between the depth of species occurrence and where fishing occurred, and in fisheries using damaging collection practices (Vaz et al., 2017). Each characteristic raised the susceptibility score and therefore the vulnerability of these species (Figure 2). In contrast, breeding strategy, fecundity, recruitment pattern, mean trophic level, appropriateness, schooling and aggregation behaviors, morphology, and survival after capture varied widely across stocks (Supplementary Table S2). As a result, these attributes most often separated the low versus high vulnerability species in our relative ranking.
We explored the sensitivity of vulnerability scores to management attributes by comparing scores for 12 fish species from fisheries in the Philippines and Australia (Supplementary Table S6). The more robust management measures implemented by Australia and the absence of cyanide fishing reduced vulnerability by 10.9–29.4% (Supplementary Table S6).
Discussion
Our results provide a relative measure of vulnerability across the most popular aquarium fish species imported into the U.S. from Indonesia and the Philippines. We compared the stock’s ranking in the import records versus the scores from our vulnerability assessment, to provide a preliminary assessment of whether the most imported species from these countries to the U.S. are also vulnerable to overcollection. Several popular fishes emerged as relatively low vulnerability. For example, Nemateleotris magnifica was one of the least vulnerable species in the analysis (Table 1) yet ranked 6th by volume from the Philippines in 2011, and 9th across all available years, according to the available import records (Rhyne et al., 2015; Rhyne et al., 2017). Similarly, Gobiodon okinawae, the least vulnerable stock, ranked 24th by volume from Indonesia, based on import volume data from Rhyne et al. (2015, 2017, from 2011 records). By contrast, the most popular fish in this trade across all available years, Chromis viridis, which is the #1 imported species by volume from both Indonesia and the Philippines, scored as a stock of moderately vulnerability (V = 1.51) (Rhyne et al., 2015, 2017). Several of the remaining most vulnerable stocks in the analysis also rank among the top 100 imported by volume: Chromileptes altivelis (ranked 47th from Indonesia in 2011 records), Plectorhinchus chaetodonoides (ranked 61st from Indonesia and 64th from the Philippines), Echidna nebulosa (ranked 54th from the Philippines); and Pomacanthus semicirculatus (67th from Indonesia and 86th from the Philippines). Consistent with previous reports, the Banggai cardinalfish (P. kauderni), Mandarinfish (S. splendidus), Maroon clownfish (P. biaculeatus), and Amphiprion spp. were also among the most vulnerable stocks in the relative rankings (Table 1; Edwards and Shepherd, 1992; Sadovy et al., 2001; Kolm and Berglund, 2003; Shuman et al., 2005; Okemwa et al., 2016). Notably several popular, vulnerable species, including P. kauderni, S. splendidus, P. biaculeatus, and other Amphiprion spp., have aquacultured alternatives but wild collection and import continues (according to trade data from Rhyne et al., 2015, 2017).
To reduce vulnerability of the highest-ranking stocks, several measures are readily available, including investment in research and aquaculture, monitoring of collection and exports, and management interventions. This assessment can help identify the species in the greatest relative need of these measures (Figure 1). For these vulnerable stocks, a precautionary approach to management (e.g., species-specific harvest limits), increased monitoring of population trends could reduce vulnerability to overcollection, and increased investment in aquaculture alternatives. To reduce vulnerability to overcollection in wild populations, retailers and consumers can consider alternative species or sources where sustainable collection can be credibly demonstrated. Lower vulnerability species could be managed under an aggregate quota and generalized management measures (e.g., entry limits through licensing, gear restrictions). Low to moderate vulnerability stocks are satisfactory options for retailers and consumers. Overall, sourcing these animals from locations with known sustainable management practices would also reduce over collection risk and promote sustainability (see also Fujita et al., 2014). On the demand-side, these vulnerability estimates could also inform purchasing decisions for retailers and hobbyists interested in reducing overcollection risk (e.g., through education; Sustainable Aquarium Industry Association [SAIA], 2014).
Many similarities among coral reef fishes caught by aquarium collectors resulted in clustering of vulnerability estimates for the majority of stocks (Figure 1) and lower vulnerability scores relative to some fish species caught for food (Patrick et al., 2009; Cope et al., 2011; Fujita et al., 2014). The aquarium fish stocks we analyzed shared various life history, catchability, and fisheries attributes from the exporting countries (Figure 2). For instance, most aquarium reef fishes are small in size and short lived, exhibit fast growth rates, disperse through a pelagic larval stage, are from intermediate trophic levels, all of which raise productivity attributes (see Figure 2 and Supplementary Table S2). Many stocks also had similar scoring for susceptibility attributes like impact to essential habitat and management strategy, based on the locations of these fisheries in areas with low management measures and capacity (Dee et al., 2014); high scores for these susceptibility attributes increased vulnerability. The most and least vulnerable stocks were differentiated by attributes related to the reproductive biology (e.g., breeding strategy, recruitment pattern, and fecundity), appropriateness, for an average home aquarium, ease of capture (e.g., schooling and aggregation, areal overlap, morphology), and rates of natural mortality (Figure 2). Future assessments should also consider the relative vulnerability of stocks to climate change, including through its impact on essential habitat, because many of these species are dependent on live coral or anemones that are highly susceptible to heat stress.
We also explored how changing susceptibility through improved management could alter vulnerability scores for several species, because susceptibility attributes, rather than intrinsic biological characteristics determining productivity, were common drivers of vulnerability scores for many stocks (Figure 2). To that end, we compared vulnerability scores for 12 species exported from both the Philippines, with limited management oversights, and Australia, with regulation of collection and exports (see Roelofs, 2008; Roelofs and Silcock, 2008; Dee et al., 2014 for more information). The sensitivity analysis revealed that management and fishing practices of Australia reduced vulnerability by approximately 10.9–29.4%, compared to the largely unmanaged Philippine fishery (Supplementary Table S6). Therefore, adjusting management practices within a source location could reduce susceptibility (e.g., via improved management and reducing fishing practices that damage habitat and have high bycatch), thereby reducing vulnerability scores. This sensitivity analysis also illustrates how species collected from other locations with management and monitoring measures could fare differently in the vulnerability rankings. Sourcing certain species from fisheries in locations with better management can offer a more immediate option for reducing risk of overcollection in wild populations (reviewed in Dee et al., 2014).
Beyond management, an avenue to reduce vulnerability to overcollection is sourcing species of “most vulnerable” with aquacultured individuals – bred, born, and reared entirely in captivity – to reduce collection pressure (Olivotto et al., 2011). Importantly, our analysis focuses solely on vulnerability of wild-caught fishes. Captive-bred fish are available for several of the most vulnerable species identified in this analysis, including S. splendidus, P. biaculeatus, and Amphiprion spp., yet sourcing from wild populations often continues (according to the trade volume data from Rhyne et al., 2015, 2017). In the case of P. kauderni, intensive aquaculture systems have cost-effectively produced adequate numbers of animals, thereby limiting the reliance on wild caught specimens. However, for many other at-risk species, captive-bred specimens do not currently exist (Olivotto et al., 2011). Moving forward, our results could help inform where to target investments in aquaculture efforts to reduce pressures on wild populations for species identified as relatively vulnerable to collection.
Despite the flexibility and utility of PSA in data-limited contexts, this approach has limitations. Importantly, PSA does not estimate population sizes and dynamics. Therefore, it does not provide quantitative estimates needed to determine sustainable collection levels or total allowable catch limits for managers and which species will be overharvested or collapse (Hordyk and Carruthers, 2018). As a threat-based assessment tool, PSA does not consider other ecological and social objectives, such as phylogenetic uniqueness, ecological role in communities, economic considerations, or cultural and aesthetic significance (Bowen, 1999; Mace et al., 2007; Perry, 2010). Similarly, PSA analyses do not include information on the costs of management reform to determine how best to allocate resources (e.g., money, time, personnel) among different species or locations (Mace et al., 2007; Joseph et al., 2008), when species interact (Xiao et al., 2018), or under uncertainty (e.g., Polasky et al., 2011; Dee et al., 2017). By providing semi-quantitative information on relative threat levels, PSA serves as a useful starting point for a larger and more comprehensive assessment and management process (e.g., see the tiered-approach proposed in Fujita et al., 2014).
This analysis identifies species exported from Indonesia and the Philippines that merit additional focus from future research, management, and monitoring efforts, as well as education initiatives for retailers and hobbyists; e.g., about the vulnerability of wild populations or suitability of given species for home aquaria (Sustainable Aquarium Industry Association [SAIA], 2014). Particularly, several of the 10 most vulnerable species to overcollection are also ranked in the top 20 imported species into the U.S. by volume (e.g., P. kauderni, S. splendidus, P. biaculeatus, and several Amphiprion spp.) of the top-100 imported species (e.g., Chromileptes altivelis, Plectorhinchus chaetodonoides, Echidna nebulosa, Pomacanthus semicirculatus). These species are prime candidates for additional species-specific assessment, monitoring, and standards for collection and handling practices. Similarly, the #1 imported species by volume from both Indonesia and the Philippines, Chromis viridis, scored as moderately vulnerable to overcollection (Supplementary Table S4; according to the import records from Rhyne et al., 2015; Rhyne et al., 2017). In contrast, we also identified several species in the top-100 imported species by volume that have relatively low vulnerability to overcollection (e.g., Nemateleotris magnifica, Salarias fasciatus, Gobiodon okinawae, Ptereleotris zebra, Gobiodon citrinus, Chaetodon lunula). This analysis provides one step toward assessing and managing the aquarium fish trade, to ensure the sustainable collection of coral reef species to both protect reef wildlife and maintain the long-term viability of the aquarium fish trade.
Author Contributions
LD, KK, and DT designed the study. CL and DT scored the stocks with input from all authors. LD, KK, DT, and CL analyzed the data. LD and DT wrote the manuscript and led the writing with contributions from KK and CL. LD and DT created the figures. CL and DT contributed the Supplementary Material.
Funding
This work was supported by the Kingfisher Foundation, the University of Richmond Spider Internship Program (to CL), and an NSF GRFP (to LD). The Marine Aquarium Societies of North America’s Dr. Junda Lin Memorial Fund for Publishing Open Access Marine Aquarium Research helped offset the Open Access Publishing costs of this article awarded to LD (more info at tiny.cc/MASNAPubFund).
Conflict of Interest Statement
The authors declare that the research was conducted in the absence of any commercial or financial relationships that could be construed as a potential conflict of interest.
Acknowledgments
We thank Satoshi Awata, Rod Fujita, J. Christopher Haney, Tim Male, Randi Rotjan, Christiane Schmidt, Todd Stevenson, and Rene Umberger for providing data, critical feedback, and peer-review for our PSA that greatly improved this analysis. We thank Andrew Rhyne and Michael Tlusty for providing data on imported species. We thank two reviewers for constructive comments and suggestions that improved this work. We also would like to thank the Marine Aquarium Societies of North America’s Dr. Junda Lin Memorial Fund for Publishing Open Access Marine Aquarium Research for offsetting the open access publishing costs of this article awarded to LD (more info at tiny.cc/MASNAPubFund).
Supplementary Material
The Supplementary Material for this article can be found online at: https://www.frontiersin.org/articles/10.3389/fmars.2018.00527/full#supplementary-material
Footnotes
References
Allen, G. R. (2000). Threatened fishes of the world: Pterapogon kauderni koumans, 1933 (Apogonidae). Environ. Biol. Fishes 57, 142–142. doi: 10.1023/A:1007639909422
Beddington, J. R., Agnew, D. J., and Clark, C. W. (2007). Current problems in the management of fisheries. Science 316, 1713–1716. doi: 10.1126/science.1137362
Bowen, B. W. (1999). Preserving genes, species, or ecosystems? Healing the fractured foundations of conservation policy. Mol. Ecol. 8, 5–10. doi: 10.1046/j.1365-294X.1999.00798.x
Bruckner, A. W., and Roberts, G. (2008). Proceedings of the International Cyanide Detection Testing Workshop Maryland, MD: NOAA Technical Memorandum.
Burke, L., Reytar, K., Spalding, M., and Perry, A. (2011). Reefs at Risk Revisited. Washington, DC: World Resources Institute.
Cope, J. M., DeVore, J., Dick, E. J., Ames, K., Budrick, J., Erickson, D. L., et al. (2011). An approach to defining stock complexes for U.S. west coast groundfishes using vulnerabilities and ecological distributions. N. Am. J. Fish. Manage. 31, 589–604. doi: 10.1080/02755947.2011.591264
Costello, C., Ovando, D., Hilborn, R., Gaines, S. D., Deschênes, O., and Lester, S. E. (2012). Status and solutions for the world’s unassessed fisheries. Science 338, 517–520. doi: 10.1126/science.1223389
Dee, L. E., De Lara, M., Costello, C., and Gaines, S. D. (2017). To what extent can ecosystem services motivate protecting biodiversity? Ecol. Lett. 20, 935–946. doi: 10.1111/ele.12790
Dee, L. E., Horii, S. S., and Thornhill, D. J. (2014). Conservation and management of ornamental coral reef wildlife: successes, shortcomings, and future directions. Biol. Conserv. 169, 225–237. doi: 10.1016/j.biocon.2013.11.025
Edwards, A. J., and Shepherd, A. D. (1992). Environmental implications of aquarium-fish collection in the Maldives, with proposals for regulation. Environ. Conserv. 19, 61–72. doi: 10.1017/S0376892900030265
Froese, R., and Pauly, D. (eds). (2018). FishBase. World Wide Web Electronic Publication. Available at: www.fishbase.org
Fujita, R., Thornhill, D. J., Karr, K., Cooper, C. H., and Dee, L. E. (2014). Assessing and managing data-limited ornamental fisheries in coral reefs. Fish Fish. 15, 661–675. doi: 10.1111/faf.12040
Gonzales, E., and Savaris, J. (2005). International Seafood trade: Supporting Sustainable Livelihoods Among Poor Aquatic Resource Users in Asia (EP/R03/014). Available at: http://aquaticcommons.org/2309/1/MarineOrnamentalsPhilippines_opt.pdf
Hixon, M. A., Johnson, D. W., and Sogard, S. M. (2014). Structure in fishery populations. ICES J. Mar. Sci. 71, 2171–2185. doi: 10.1093/icesjms/fst200
Honey, K., Moxley, J., and Fujita, R. (2010). From rags to fishes:data-poor methods for fishery managers. Manag. Data Poor Fisher. Case Stud. Models Solutions 1, 159–184.
Hordyk, A. R., and Carruthers, T. R. (2018). A quantitative evaluation of a qualitative risk assessment framework: examining the assumptions and predictions of the Productivity Susceptibility Analysis (PSA). PLoS One 13:e0198298. doi: 10.1371/journal.pone.0198298
International Union for the Conservation of Nature. (2014). Red list of threatened species v2013.2. Available at http://www.iucnredlist.org/. [accessed February 24, 2014].
Indrawan, M. (1999). Live reef food fish trade in the Banggai islands (Sulawesi, Indonesia): A case study. SPC Live Reef Fish Informa. Bull. 6, 7–14.
Joseph, L. N., Maloney, R. F., and Possingham, H. (2008). Optimal allocation of resources among threatened species: a project prioritization protocol. Conserv. Biol. 23, 328–338. doi: 10.1111/j.1523-1739.2008.01124.x
Kolm, N., and Berglund, A. (2003). Wild populations of a reef fish suffer from the “nondestructive” aquarium trade fishery. Conserv. Biol. 17, 910–914. doi: 10.1046/j.1523-1739.2003.01522.x
Lilley, R. (2008). The Banggai cardinalfish: An overview of conservation challenges. SPC Live Reef Fish Informa. Bull. 18, 3–12.
Mace, G. M., Possingham, H. P., and Leader-Williams, N. (2007). “Prioritizing choices in conservation,” in Key Topics in Conservation Biology, eds D. Macdonald and K. Service (Oxford: Blackwell Publishers), 17–34.
Ochavillo, D., Hodgson, G., Shuman, C., and Ruz, R. (2004). “Status of the philippine marine aquarium fish trade,” in Turbulent Seas: The Status of Philippine Marine Fisheries, eds G. Silvestre, S. J. Green, A. T. White, N. Armada, C. Luna, A. Cruz-Trinidad, and M. F., III. Carreon (Cebu: Department of Agriculture-Bureau of Fisheries and Aquatic Resources), 60–64.
Okemwa, G. M., Kaunda-Arara, B., Kimani, E. N., and Ogutu, B. (2016). Catch composition and sustainability of the marine aquarium fishery in Kenya. Fish. Res. 183, 19–31. doi: 10.1016/j.fishres.2016.04.020
Olivotto, I., Planas, M., Simoes, N., Holt, G. J., Avella, M. A., and Calado, R. (2011). Advances in breeding and rearing marine ornamentals. J. World Aquac. Soc. 42, 135–166. doi: 10.1111/j.1749-7345.2011.00453.x
Patrick, W. S., Spencer, P., Ormseth, O., Cope, J., Field, J., Kobayashi, D., et al. (2009). Use of Productivity and Susceptibility Indices to Determine Stock Vulnerability, with Example Applications to six U.S. fisheries. Washington, DC: U.S. Department of Commerce.
Perry, N. (2010). The ecological importance of species and the Noah’s Ark problem. Ecol. Econ. 69, 478–485. doi: 10.1016/j.ecolecon.2009.09.016
Polasky, S., Carpenter, S. R., Folke, C., and Keeler, B. (2011). Decision-making under great uncertainty: environmental management in an era of global change. Trends Ecol. Evol. 26, 398–404. doi: 10.1016/j.tree.2011.04.007
Puga, R., Valle, S., Kritzer, J. P., and Karr, K. A. (2018). Vulnerability of nearshore tropical finfish in cuba: implications for scientific and management planning. Bull. Mar. Sci. 94, 1–16.
Reef Protection International [RPI] (2013). Reef fish Guide. Available at: http://www.reefprotect.org/fish_guide.htm [accessed May 10, 2013].
Rhyne, A. L., Tlusty, M. F., Holmberg, R. J., and Szczebak, J. T. (2015). Marine Aquarium Biodiversity and Trade Flow. Available at: https://www.aquariumtradedata.org/ [accessed May 20, 2018].
Rhyne, A. L., Tlusty, M. F., and Kaufman, L. (2012a). Long-term trends of coral imports into the United States indicate future opportunities for ecosystem and societal benefits. Conserv. Lett. 5, 478–485. doi: 10.1111/j.1755-263X.2012.00265.x
Rhyne, A. L., Tlusty, M. F., Schofield, P. J., Kaufman, L., Morris, J. A. Jr., and Bruckner, A. W. (2012b). Revealing the appetite of the marine aquarium fish trade: the volume and biodiversity of fish imported into the United States. PLoS One 7:e35808. doi: 10.1371/journal.pone.0035808
Rhyne, A. L., Tlusty, M. F., and Kaufman, L. (2014). Is sustainable exploitation of coral reefs possible? A view from the standpoint of the marine aquarium trade. Curr. Opin. Environ. Sustain. 7, 101–107. doi: 10.1016/j.cosust.2013.12.001
Rhyne, A. L., Tlusty, M. F., Szczebak, J. T., and Holmberg, R. J. (2017). Expanding our understanding of the trade in marine aquarium animals. PeerJ 5:e2949. doi: 10.7717/peerj.2949
Roelofs, A. (2008). Ecological Risk Assessment of the Queensland Marine Aquarium Fish Fishery. Brisbane: Department of Primary Industry and Fisheries.
Roelofs, A., and Silcock, R. (2008). A Sustainability Assessment of Marine Fish Species Collected in the Queensland Marine Aquarium Trade. Brisbane: Department of Primary Industries and Fisheries.
Ryan, S., and Clarke, K. (2005). Ecological assessment of the Queensland Marine Aquarium Fish Fishery. Parkes, ACT: Australian Government Department of Environment Heritage.
Sadovy, Y., Mitcheson, G., and Rasotto, M. B. (2001). Early development of the mandarinfish, Synchiropus splendidus (Callionymidae), with notes on its fishery and potential for culture. Aquar. Sci. Conserv. 3, 253–263. doi: 10.1023/A:1013168029479
Schmidt, C., and Kunzmann, A. (2005). Post-harvest mortality in the marine aquarium trade: a case study of an Indonesian export facility. SPC Live Reef Fish Bull. 13, 3–12.
Shuman, C. S., Hodgson, G., and Ambrose, R. (2005). Population impacts of collecting sea anemones and anemonefish for the marine aquarium trade in the Philippines. Coral Reefs 24, 564–573. doi: 10.1007/s00338-005-0027-z
Sustainable Aquarium Industry Association [SAIA] (2014). Lists of Unsuitable and Unsustainable Species. Available at: http://www.saia-online.eu/index.php/en/what-we-do/saia-fish-lists. [accessed Jan 17, 2014].
Thornhill, D. J. (2012). Ecological Impacts and Practices of the Coral Reef Wildlife Trade. Washington, DC: Defenders of Wildlife. doi: 10.1016/j.marpol.2010.06.002
Tissot, B. N., Best, B. A., Borneman, E. H., Bruckner, A. W., Cooper, C. H., D’Agnes, H., et al. (2010). How US ocean policy and market power can reform the coral reef wildlife trade. Mar. Policy 34, 1385–1388. doi: 10.1038/s41598-017-04940-x
Vaz, M. C. M., Esteves, V. I., and Calado, R. (2017). Live reef fish displaying physiological evidence of cyanide poisoning are still traded in the EU marine aquarium industry. Sci. Rep. 7:6566. doi: 10.1038/s41598-017-04940-x
Wabnitz, C., Taylor, M., Green, E., and Razak, T. (2003). From Ocean To Aquarium: The Global Trade In Marine Ornamental Species. Cambridge: UNEP-WCMC.
Willmann, R., and Kelleher, K. (2009). “The sunken billions: the economic justification for fisheries reform (English),” in Agriculture and Rural Development (Washington, DC: World Bank), 130. Available at: http://documents.worldbank.org/curated/en/656021468176334381/The-sunken-billions-the-economic-justification-for-fisheries-reform
Wood, E. (2001). Collection of Coral Reef Fish for Aquaria: Global Trade, Conservation Issues and Management Strategies. Ross-on-Wye: Marine Conservation Society. doi: 10.1111/1365-2664.13192
Keywords: data-limited fisheries management, coral reefs, aquarium fisheries, productivity susceptibility analysis, wildlife trade
Citation: Dee LE, Karr KA, Landesberg CJ and Thornhill DJ (2019) Assessing Vulnerability of Fish in the U.S. Marine Aquarium Trade. Front. Mar. Sci. 5:527. doi: 10.3389/fmars.2018.00527
Received: 25 September 2018; Accepted: 22 December 2018;
Published: 18 January 2019.
Edited by:
Steven W. Purcell, Southern Cross University, AustraliaReviewed by:
Thane Militz, University of the Sunshine Coast, AustraliaShaun Wilson, Conservation and Attractions, Australia
Copyright © 2019 Dee, Karr, Landesberg and Thornhill. This is an open-access article distributed under the terms of the Creative Commons Attribution License (CC BY). The use, distribution or reproduction in other forums is permitted, provided the original author(s) and the copyright owner(s) are credited and that the original publication in this journal is cited, in accordance with accepted academic practice. No use, distribution or reproduction is permitted which does not comply with these terms.
*Correspondence: Laura E. Dee, ledee@umn.edu Daniel J. Thornhill, thornhill.dan@gmail.com