A Carding System as an Approach to Increasing the Economic Risk of Engaging in IUU Fishing?
 U. Rashid Sumaila
- Fisheries Economics Research Unit, Institute for the Oceans and Fisheries and School of Public Policy and Global Affairs, The University of British Columbia, Vancouver, BC, Canada
The European Union (EU) instituted a carding system via its European Commission Regulation (EC) No. 1005/2008 with the goal of incentivizing fish and fish products (fish) exporting countries to the Union to take action to reduce IUU fishing in their waters. This regulation stipulates that the EU will issue warnings, known as a “yellow card,” to countries that perform poorly in the effort to end IUU fishing in their waters. Failure to curb IUU fishing will result in a ban in the export of fish to the EU via the issuance of a red card. Here, I ask the following questions: what is the economic risk of being red carded by the EU? Is the economic risk big enough to significantly reduce IUU fishing in a targeted country’s waters? Would the risk be broad enough to result in a significant reduction in IUU fishing globally? What if the two other leading fish importing countries, i.e., the United States and Japan, also institute a similar carding system as the EU? To address these questions, I develop and compute an economic risk index for the carding system. This study suggests that the impact of an EU only IUU carding system could be significant for some targeted countries but its effect globally, with respect to reducing IUU fishing, would be minimal. However, I find that the economic risk to fish exporting countries would increase significantly if the United States and Japan also instituted similar carding systems, which would in turn help to reduce IUU fishing worldwide. This contribution shows that an IUU carding system could contribute significantly to the elimination of IUU fishing provided a critical mass of top fish importing countries participate in such a system.
Highlights
- A carding system can incentivize fishers to avoid IUU fishing.
- An EU only IUU carding system can incentivize targeted countries to curb IUU fishing in their waters.
- An EU only IUU carding system is limited in its ability to prevent, deter and stop IUU fishing worldwide.
- Carding systems by the United States, Japan and EU would increase the worldwide effect of the system in stopping IUU fishing.
Introduction
Illegal, unreported, and unregulated (IUU) fishing is a significant problem facing fisheries worldwide (Sumaila et al., 2006; Agnew et al., 2009), with a significant impact on sustainability of fish stocks and the economic and social benefits derived from fisheries (Charles et al., 1999; Sumaila et al., 2006). Thus, several measures have been proposed to tackle IUU fishing (OECD, 2004; Österblom et al., 2015) many of which are derived from the basic economic insight that people engage in IUU fishing because it pays economically to do so (Becker, 1995; Kuperan and Sutinen, 1998; OECD, 2004; Miller et al., 2016). IUU fishing can be reduced (possibly to zero) by doing one or both of the following: (i) decreasing the gross benefits enjoyed by IUU fishers from engaging in this activity; (ii) increasing the cost of doing so. Increasing the cost of engaging in IUU fishing can be achieved by increasing the probability of being apprehended fishing illegally and/or by imposing a significant penalty when caught fishing illegally (OECD, 2004; Sumaila et al., 2004).
To increase the likelihood of being apprehended while engaging in IUU fishing, monitoring control and surveillance (MCS) systems in maritime countries need to be strengthened and made more effective, especially in many developing countries. This is because current MCS systems are not in good shape as evidenced by the high levels of IUU fishing taking place in many parts of the global ocean. It is the recognition of the limits of on water control of destructive overfishing that has increased interest in using market-based instruments to provide solutions to what is essentially cases of regulatory failure.
Looking to the market to address IUU fishing ‘flips’ traditional MCS models (where monitoring and control occurs at sea) to a focus on the post-harvest supply chain. Market approaches recognize that products eventually enter the market because fishing is an economic activity where the return from the catch is a critical element in the viability of the activity. The development of catch documentation systems introduced by management organizations and non-state based “third party” certification of fisheries are direct responses to the concerns over unregulated fishing, and are now more common and embedded tools at the fishery or stock level.
European Commission Regulation (EC) No. 1005/2008 was adopted on September 29, 2008 and entered into force on January 1, 2010 (European Commission, 2008). This regulation establishes a Community-wide system to prevent, deter, and eliminate IUU fishing. It is a market approach that seeks to reduce the benefits from IUU fishing by drying up the market for IUU caught fish exported to EU countries. This regulation stipulates that the EU will issue warnings, known as a “yellow card,” to countries whose waters are judged to be prone to IUU fishing (European Commission Regulation (EC) No. 1005/2008, Articles 23 and 241). The goal is to incentivize countries to take action to reduce IUU fishing in their waters.
The regulation sets terms and conditions for third parties via a certification scheme which issues yellow, and ultimately, red cards that prohibit the export of IUU caught fish in EU markets (European Commission Regulation (EC) No. 1005/2008, Articles 4 and 242). The regulation sets an assessment scheme for port inspection. It also introduces a community alert system and sanction measures (Papaioannou, 2016). The introduction of the carding system has seen yellow and red cards applied to a range of countries (e.g., Belize, Fiji, Guinea, Sri Lanka, Togo, Viet Nam, Thailand, Ghana), with some (e.g., Belize, Fiji, Togo) delisted after meeting requirements for strong controls over fisheries and others upgraded from yellow to red for failing to address issues. Countries such as Cambodia, Guinea, and Sri Lanka failed to meet the requirements and therefore remain red listed1.
It is worth noting that this is not the first time that the EU has used its market power with respect to bans on fish. In 1997, the EU banned shrimp imports from Bangladesh and demanded the introduction and enforcement of HACCP compliance systems in processing plants exporting shrimp to the markets of its member countries.
Here, I create a simple Carding Economic Risk Index (C-ERI) and apply it to determine the economic risk of being red carded by the EU. I first quantify the potential economic risk facing fish exporting countries to the EU should they be red carded, and therefore lose access to EU’s fish markets. The analysis is then extended to include those of the United States and Japan. The goal is to find out the extent to which the implementation of a similar red carding system by these two important fish markets would strengthen the efficacy of such a system with respect to combatting IUU fishing. These three markets constitute a large proportion of the global fish import-export market (Swartz et al., 2010), importing fish of an estimated average annual value of USD 58 billion between 2010 and 2014. Hence, together they are in a position to exert significant market influence.
Materials and Methods
Fish Export Dependency Indicators
The EU carding system is not relevant to countries that do not export fish to its member countries. In other words, the carding system is less relevant the less the amount of fish a country exports to the EU market and vice versa. To capture the extent of dependency on the EU market, I created three simple indicators:
(1) The ratio of the value of exported fish to the EU relative to fish exported by the exporting country worldwide (denoted: Fish2Fish ratio);
(2) The ratio of the value of exported fish to the EU relative to the total export of all products by the exporting country worldwide (denoted: Fish2Products ratio);
(3) The proportion of the value of exported fish to the EU to Gross Domestic Product (GDP) of the exporting country (denoted: Fish2GDP ratio).
The higher the Fish2Fish ratio for a country exporting fish to the EU the stronger its dependence on the EU market since this implies that most of the country’s fish export goes to the EU. A high Fish2Products ratio for a country exporting fish to the EU implies an even stronger dependence on exports to EU member countries than a similarly high Fish2Fish ratio because this means that fish is a major portion of the country’s total product exports. Finally, a high Fish2GDP ratio for a country exporting fish to the EU is an indication of an even stronger dependence on EU markets because fish is a major part of the country’s GDP.
An exporting country with Fish2Fish = Fish2Products = Fish2GDP = 1 is completely dependent on the EU market for its export earnings. On the other hand, a country with zero scores for all three indicators has zero dependency on the EU fish market.
Note that the ratios above work similarly if we replace the EU with the United States and Japan separately or jointly with the EU in a scenario in which all three countries are assumed to have in place a carding system.
A Carding Economic Risk Index
I bring the three ratios presented above together to create a carding risk index (C-ERI). I assume that the economic risk facing an exporting country depends on how high the Fish2Fish, Fish2Products and Fish2GDP ratios are, and proceed to develop an economic risk index made up of a weighted sum of the computed values of the three ratios as follows:
where w1, w2 and w3 are weights assigned to each ratio, respectively, which are given the values of 1, 2, 3, respectively, because of the assumed relative dependence of the exporting country on the EU market depicted by each of these ratios. The justification for assigning these weights flows from the explanation of relative dependence of a country to the EU fish market depicted by the three different indicators described in Section “Fish Export Dependency Indicators.”
To illustrate how the index is calculated and what it means, let’s consider two fish exporting countries, X and Y, with the following Fish2Fish; Fish2Products; and Fish2GDP ratios, respectively: (1; 1; 1) and (0; 0; 0). Then country X will have a total economic risk index of 6, highlighting that it will face a massive economic risk should it be red carded by the EU. On the other hand, Country Y will have a total ratio = 0, implying it will face no economic risk at all if red carded by the EU. In the real world, all fish exporting countries to the EU will have economic risk indices that lie between 0 and 6.
It is worth noting that the suggested formula above for capturing the economic risk does not take into account an important element of the EU IUU Regulation, i.e., red carding also results in a ban on EU vessels fishing in the waters of the red-carded country. This is significant as some of the EU Member States are among the countries with the world’s biggest fishing fleets (e.g., Spain). This additional provision in the regulation could motivate countries such as Spain to want to block the red carding of a country in which it has vested interests.
Fish Exports Data to the EU, the United States and Japan
The amount of fish exported to the EU both in terms of weight and value3 were retrieved from the European Commission Trade Market Access Database (European Commission, 2016). The amount of fish in weight exported to both Japan and the United States were obtained from the UNComtrade database (UN Comtrade, 2016). The value of imported fish to the United States were retrieved from NOAA Fish Trade Statistics (NOAA, 2017) but the value of all products exported to the United States was retrieved from the UNComtrade database. The UNComtrade database also provided the exported value of fish products and all products to Japan. To fill data gaps, I calculated average prices using available quantity of exports in weight and trade values in USD.
The value of exported products, both for all products and for only fish, from each exporting country to the entire world were taken from the UNComtrade database, and are reported in USD. It should be noted that fish products were assumed to be encompassed by Harmonized System Codes 03 [The Harmonized System is an international nomenclature for the classification of products, which allows participating countries to classify traded goods on a common basis for customs purposes. At the international level, the Harmonized System (HS) for classifying goods is a six-digit code system] – Fish and Crustaceans; 1504 – Fats and oils, their fractions, fish and marine mammal; 1603 – Extracts, etc. of meat, fish, crustaceans; 1604 – Prep or pres fish, caviar, and caviar substitutes; 1604 – Crustaceans molluscs etc. prepared or preserved; 051191 – Products of fish or crustaceans, molluscs or other aquatic invertebrates; dead animals of chapter 3; 230120 – Flours, Meals, Pellets of Fish, Crustaceans, Molluscs (Non-Edible).
It is worth noting that even though the codes listed above have fish-related headings, not all trade under the listed codes can be attributed completely to fish as some include other things such as meat and marine mammals. However, the bulk of the items will be fish-related items. Also, the codes would also capture freshwater fish caught in rivers and lakes and not only the ocean, here, too the bulk of the coverage is almost surely ocean fish.
The World Bank (2016) [formally known as International Bank for Reconstruction and Development] and UN Statistics (2016) were the sources for GDP data. In the few cases where GDP values were not available in these databases, other sources (e.g., national statistics) were used.
Computing Carding Economic Risk Indices (C-ERI)
Data described in Section “Fish Exports Data to the EU, the United States and Japan” are used to, first, calculate the economic risk index for fish exporting countries to the EU. Next, I do the same for countries that export fish to the EU, the United States and Japan combined. I then determine the top 50 countries that export to the EU, Japan and the United States in terms of value and assess how many of these countries are included in the list of top 20 highest economic risk countries under a red card scenario by the EU alone and by the three countries combined. I do this for the top 10, 20, and 50 exporting countries by value.
Results
Fish Imports by the EU, the United States and Japan
The EU, United States and Japan together were by far the largest importers of fish worldwide between 2010 and 2014. On average, I estimated that (Table 1):
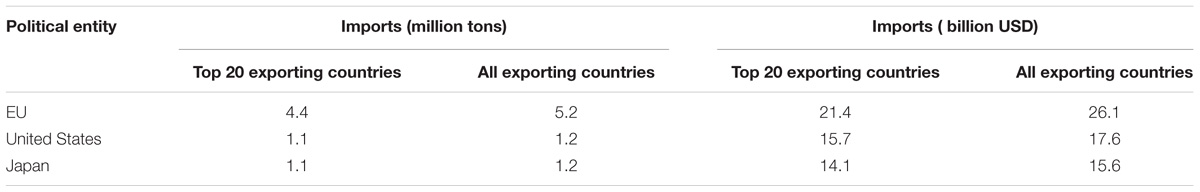
Table 1. Fish exports to the EU, the United States and Japan.
1. The EU imported 5.2 million tons of fish amounting to about USD 26 billion per year during this period;
2. The United States average annual imports was 1.2 million tons with total value of USD 18 billion during the period;
3. Japan imported on average 1.2 million tons of fish valued at USD 16 billion per year during this period.
We see from the above that, on average, fish imported by the EU are less valuable per unit weight than those imported by Japan and the United States. This could be explained by the kind of species that each of these political entities import and consume. For instance, while the consumption of less expensive fish such as herring is common in some EU countries, shrimps, and tunas are key species that are consumed in large quantities in the United States and Japan.
From Table 2, we see that 5 out of the 20 top fish exporting countries ship their fish to only the EU with the remainder exporting to at least two of the three major importing countries. This means that 75% of the top exporting countries will have alternative markets in either the United States or Japan or both because they already have a presence in these markets. This implies that the economic risk to these countries, if they are issued a red card, would not be as severe as for the 25% of countries that export only to the EU. This is because unlike the latter countries, the former would be able to relatively quickly redirect their exports to Japan and/or the United States. However, with the United States and Japan also instituting similar carding systems to that of the EU, all the top 20 exporting countries to each of these countries will be captured in the red card web limiting their ability to switch to an alternative market.
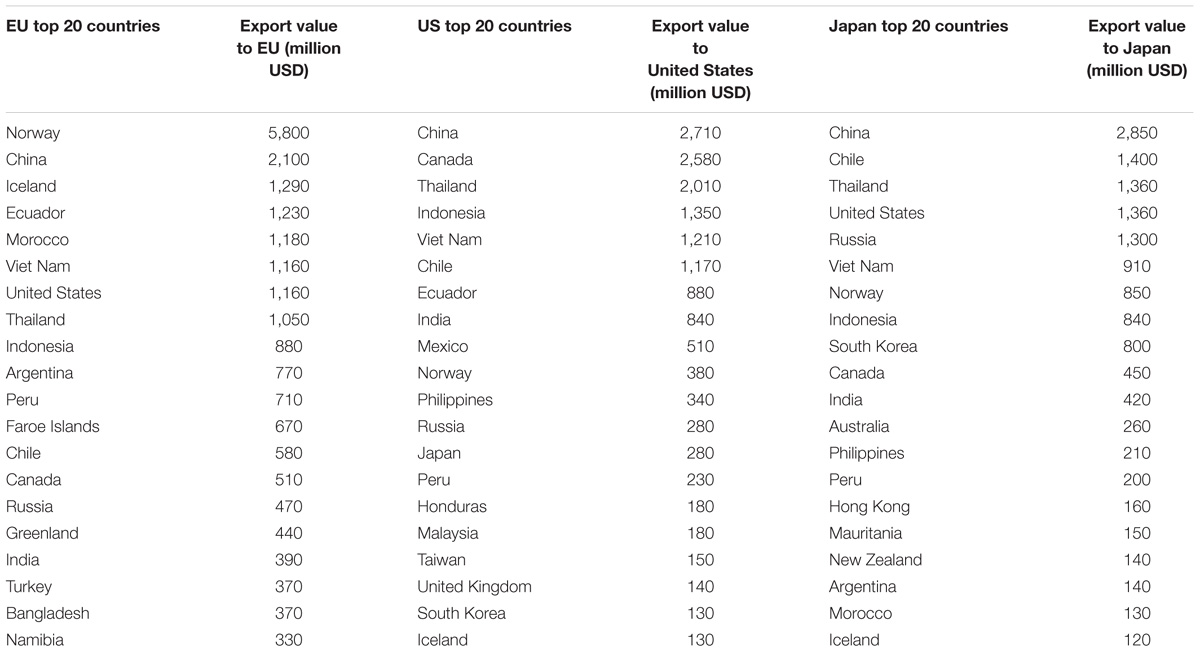
Table 2. Top 20 Fish exporting countries to the EU, the United States and Japan.
Fish Export Dependency Indicators
Fish2Fish Ratio
I present in Table 3 the top Fish2Fish ratio fish and fish products (from now on “fish”) exporting countries to the EU only and to the EU, the United States and Japan combined. We see from the table (Columns 1 and 4) that most of the top 20 Fish2Fish exporting countries to the EU are small developing countries, 10 of which are African. Three of the top 20 exporting countries (French Southern Territories; Macedonia and Cote d’Ivoire) send over 90% of their fish exports to the EU; nine of these countries export over 80% while all twenty fish exporting countries send 70% or more of their exports to the EU.
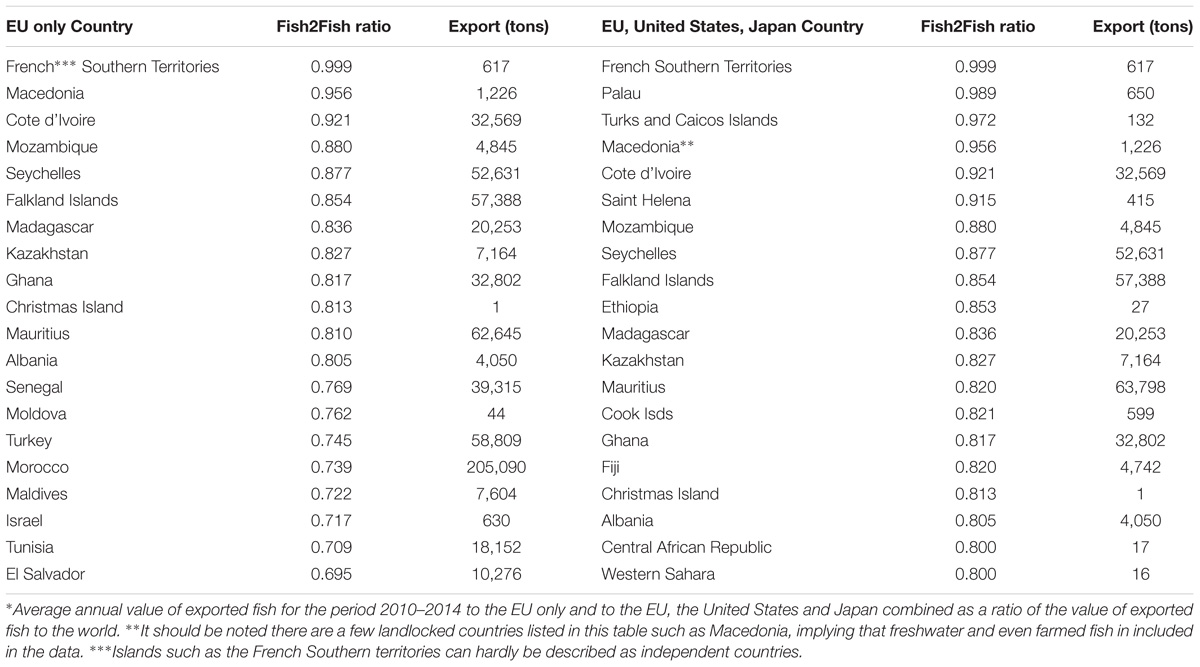
Table 3. Top Fish2Fish ratio∗ of fish exporting countries to the EU only and to the EU, the United States and Japan combined.
When all three leading fish importing countries implement a carding system, we see that 6 (not 3 as in the case of an EU only carding system) of the top 20 countries export over 90% of their fish to the 3 countries while all the remaining 14 countries export over 80% of their fish to these countries.
The high Fish2Fish ratios reported above indicate that the top 20 exporting countries to the EU are highly dependent on the EU market for their fish.
Fish2Products Ratio
Table 4 reports the proportion of the annual value of exported fish to the EU only and the EU, United States and Japan combined relative to the value of all products exported to the world as a whole (i.e., Exported fish to EU/All exported products to the world) by the 20 exporting countries with the highest proportions from 2010 to 2014, on average.
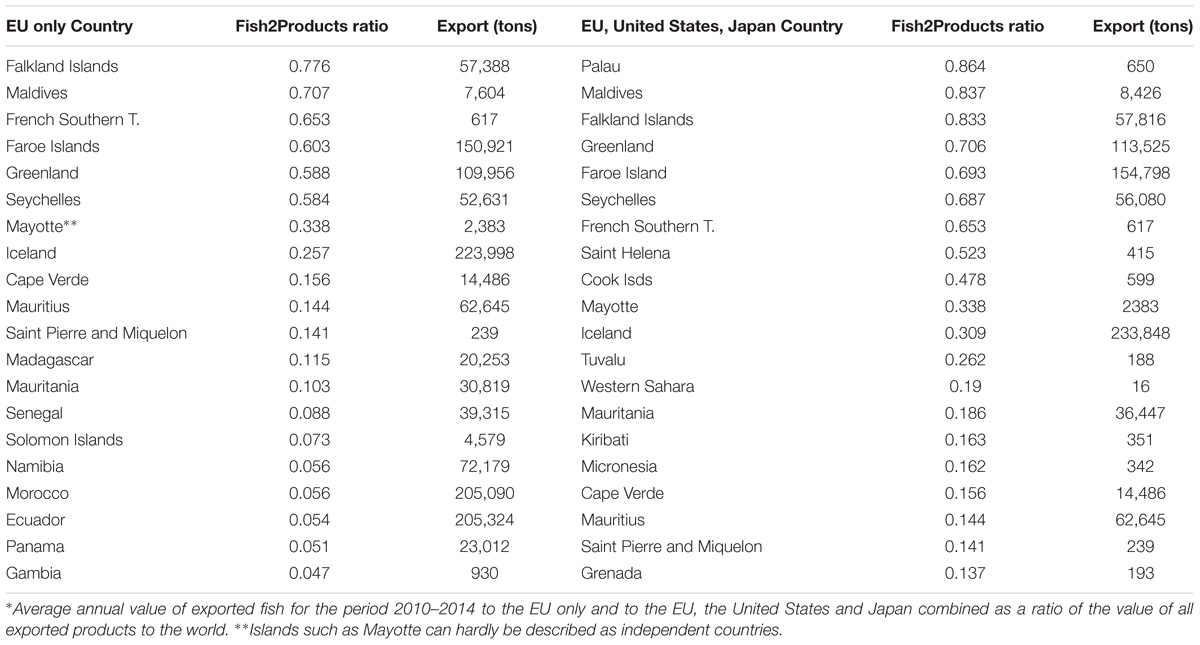
Table 4. Top Fish2Products ratio∗ of fish exporting countries to the EU only and to the EU, the United States and Japan combined.
In the case of Fish2Products ratio too, we see that most of the top 20 Fish2Products exporting countries are small developing countries when the EU alone implements a carding system, 11 of which are African while 4 are South, Central American and Caribbean countries. For six of the countries, fish export values to the EU constitute over 50% of their total product exports to the EU. For 13 of these countries, fish export values are over 10% of the value of all the products they export to the EU. Furthermore, many of these countries export relatively small quantities of fish to the EU (Table 4), with Iceland exporting the highest in weight of ∼224 1000 tons to the EU (Table 4).
The above numbers change dramatically when the EU, United States and Japan implement a carding system. While no country sends over 80% of the total products export to the EU, three countries do so to the three importing countries combined. Also, while 7 out of the 20 countries send less than 10% of the products export to the EU, all the 20 exporting countries on the list export more than 10% of their total products exports to the EU, United States and Japan markets.
Fish2GDP Ratio
I present in Table 5 the proportion of the value of exported fish to the EU relative to the GDP of the exporting country (i.e., value of exported fish to EU/GDP) by the 20 exporting countries with the highest proportions.
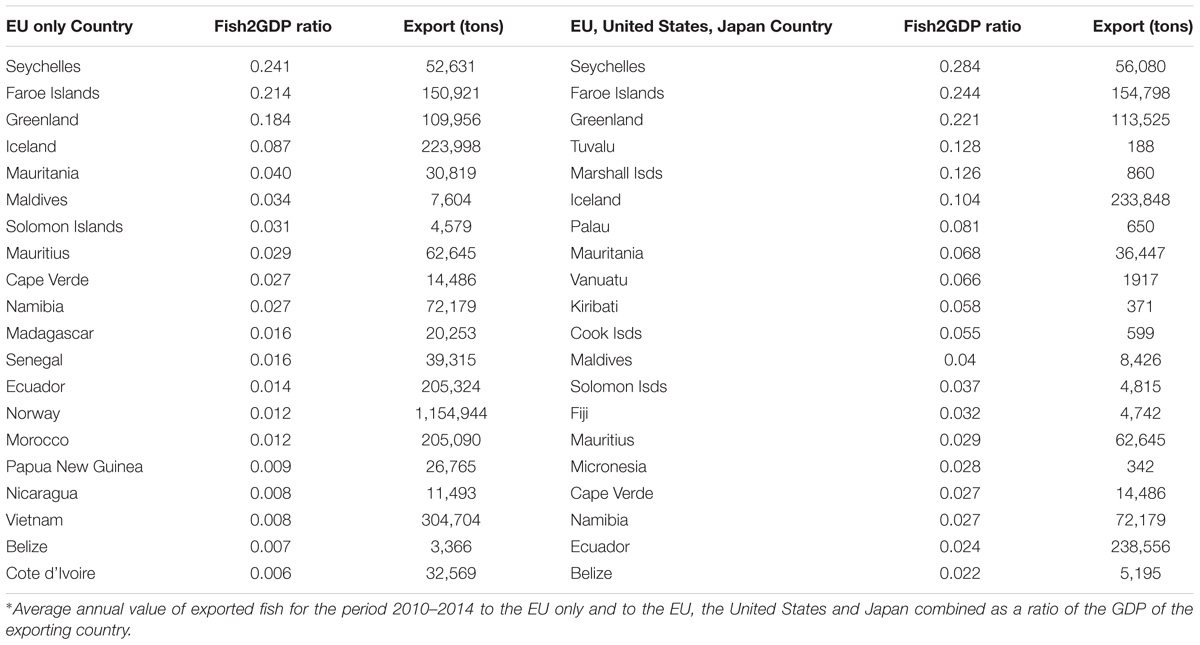
Table 5. Top Fish2GDP ratio∗ of fish exporting countries to the EU only and to the EU, the United States and Japan combined.
The pattern we see in the case of Fish2Fish and Fish2Product continues here too, with the Fish2GDP ratio being higher when all three leading fish importing countries institute a carding system. For instance, while only 10 countries have a Fish2GDP ratio of more than 2% when only the EU carding system is in place, all 20 countries have a Fish2GDP ratio of greater than 2% when all three major importing political entities implement a carding system.
Observation
All three economic dependency ratios (Fish2Fish, Fish2Products, Fish2GDP) increase significantly when all three top importing fish countries institute IUU carding systems compared to when only the EU does.
Effect of EU, United States and Japan Implementing an IUU Carding System
I report in Table 6 below the top 20 countries with the highest economic risk indices under a red carding scenario by the EU only, and by the EU, United States and Japan combined.
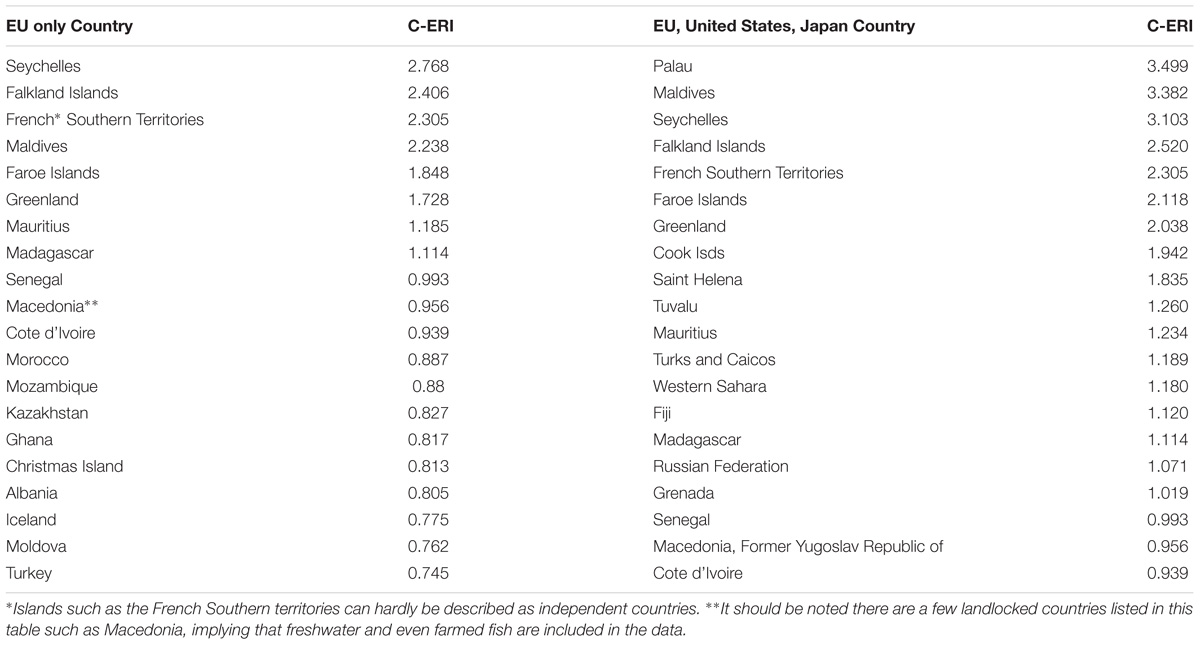
Table 6. Top high carding economic risk index (C-ERI) fish exporting countries to the EU only and to the EU, the United States and Japan combined.
We see from Table 6 that the economic risk when all three countries implement a carding system is higher than when only the EU implements it. The implication is that all three major fish importing countries implementing a carding system would increase the economic risks to fish exporting countries to these three major markets across the board.
Observation
Increased economic dependency with the three top fish exporting countries instituting IUU carding systems would lead to higher economic risk facing the top fish exporters to these countries.
Table 7 reports the top 50 exporting countries to the EU, Japan and the United States, we see that most of the countries listed in this table are either developed countries (e.g., Norway, Canada) or large developing coastal countries (e.g., China, Indonesia).
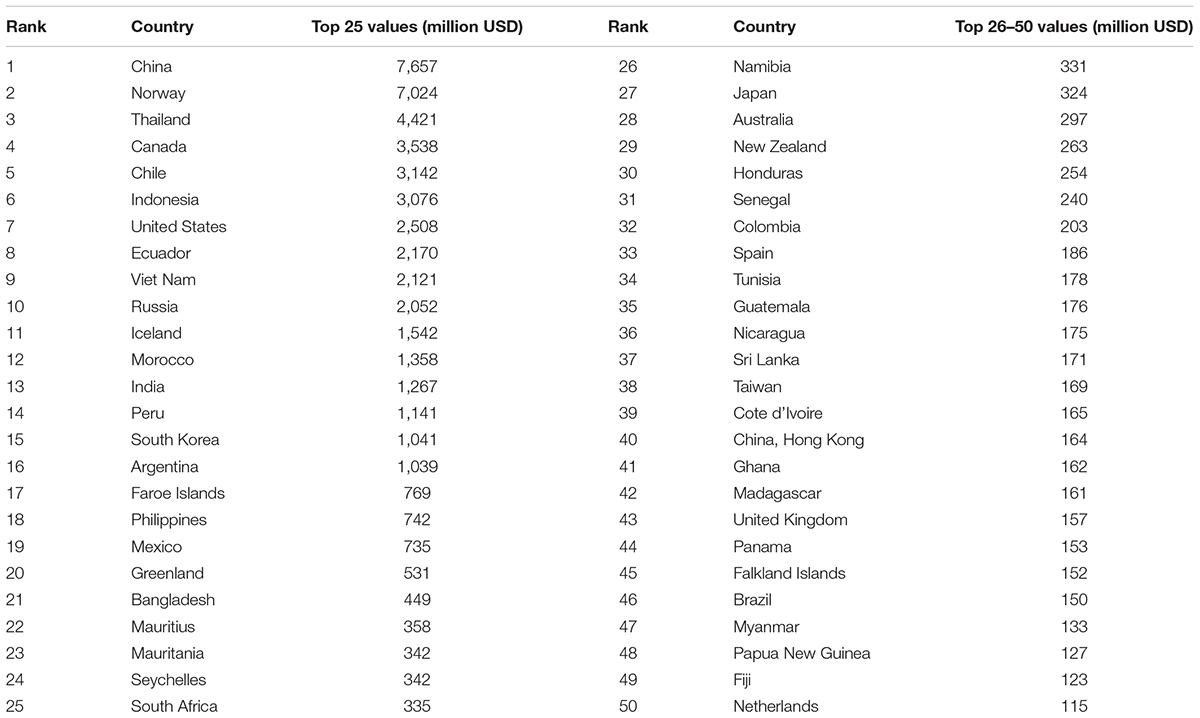
Table 7. Top 50 countries that exported fish to the EU, Japan and the United States in terms of value from 2010 to 2014.
The data in the above tables are used to determine how many of the top 10, 20, and 50 countries that export to the EU only, and to the EU, Japan and the United States combined are included in the list of top 20 highest economic risk countries under a red card scenario. The results obtained are presented in Table 8.
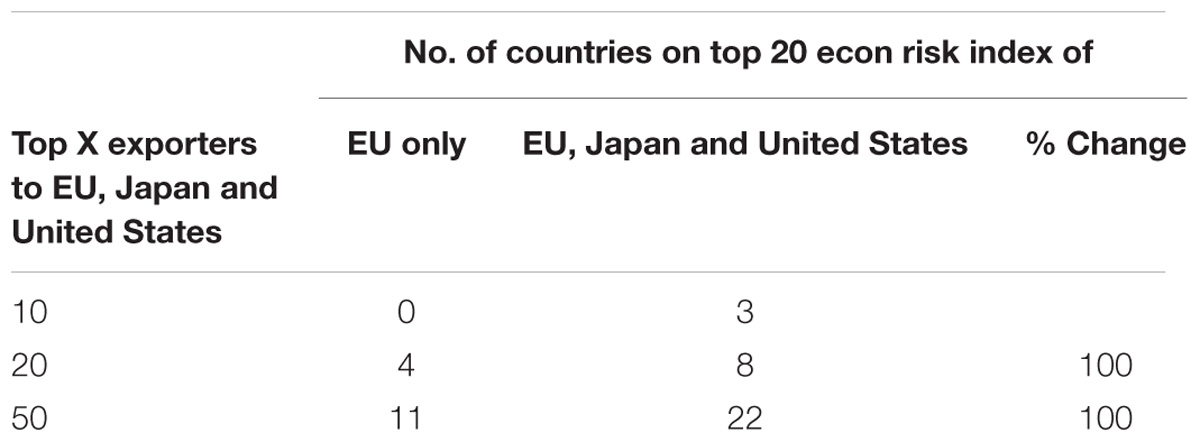
Table 8. The number of the top 10, 20, and 50 countries that export fish to the EU, Japan and the United States included in the list of top 20 highest economic risk countries under a red card scenario by the EU alone, and by the three countries combined.
We see from the table that when the EU is the only one issuing red cards none of the top 10 fish exporting countries are under economic risk while three countries (Canada, Chile, and Russia) face economic risk under a scenario in which all three countries issue red cards. Similarly, the number of economic risk countries increases for the top 20 and 50 fish exporting countries to the three political entities when all of them implement a carding regulation. In fact, I find that the number of countries increases by 100% in both cases (Table 8).
Observation
IUU carding systems implemented by the EU, United States and Japan would ensure that many more top fish exporting countries are included in the carding system.
Conclusion
European Commission Regulation (EC) No. 1005/2008 has been a new policy instrument with the potential to contribute to the global effort to deter people from engaging in illegal, unreported and unregulated fishing if applied fairly and comprehensively on major fish exporters to the EU. The analysis carried out in this contribution shows that the regulation can motivate countries to take action on IUU fishing. In fact, this happened in the case of Thailand and Ghana, for example, where yellow cards issued by the EU has motivated these countries to increase their efforts in tackling IUU fishing in their waters. Another positive contribution of this regulation is the change of expectation and perception of IUU fishing that it may have instilled in the fishing industry. It has also demonstrated to large fish importing countries such as the United States and Japan one possible way by which they could contribute to reducing IUU fishing worldwide.
Having said the above, this study shows that the EU alone putting in place and implementing this regulation may not be enough to put a significant dent on IUU fishing worldwide. For this to be more effective, more major fish importing countries such as the United States, Japan, China, etc. would have to institute similar regulations. There are several reasons for this. First, data analysis shows that 11 (including Norway, China, Canada, Iceland, Vietnam, Thailand, Indonesia, Peru) of the top 20 fish exporting countries to the EU, China and Japan, export to all three countries. Also, more than six countries (e.g., Ecuador, Morocco, Philippines, and South Korea) in this category export to two of these countries. This means that it would be quite possible for these exporting countries to redirect the fish they sell to the EU to Japan and/or the United States when faced with a red card from the EU. Second, we see that the countries that would face the highest economic risk of being red carded by only the EU are small developing countries that export relatively small quantities of fish to the EU countries, making action by only the EU less weighty. Finally, with the three countries all implementing a red carding system, the economic risk to leading exporters increases thereby improving the effectiveness of red carding as a deterrent to IUU fishing.
Author Contributions
The author confirms being the sole contributor of this work and has approved it for publication.
Funding
This paper emerged from a project funded by the Pew Charitable Trusts Grant No. 29512.
Conflict of Interest Statement
The author declares that the research was conducted in the absence of any commercial or financial relationships that could be construed as a potential conflict of interest.
The handling Editor declared a shared affiliation, though no other collaboration, with the author.
Acknowledgments
The author wishes to thank Sachiko Ouchi, her 2017 NSERC student intern for helping retrieve and compile data needed for this study from existing databases. The author also thanks Anthony Rogers of California Ocean Science Trust (formerly of Pew Charitable Trusts), for many fruitful discussions on earlier drafts of this paper.
Footnotes
- ^ http://eur-lex.europa.eu/legal-content/EN/TXT/?uri=uriserv:OJ.C_.2012.354.01.0001.01.ENG
- ^ http://eur-lex.europa.eu/legal-content/EN/TXT/?uri=uriserv:OJ.L_.2014.091.01.0043.01.ENG
- ^ Note that the values were reported in Euros, which I converted into USD using exchange rate data Canadian Forex (2017).
References
Agnew, D. J., Pearce, J., Ganapathiraju, P., Peatman, T., Watson, R., Beddington, J. R., et al. (2009). Estimating the worldwide extent of illegal fishing. PLoS One 4:e4570. doi: 10.1371/journal.pone.0004570
Canadian Forex (2017). Yearly Average Exchange Rates for Currencies. Available at: http://www.canadianforex.ca/forex-tools/historical-rate-tools/yearly-average-rates, [accessed January 07, 18].
Charles, A. T., Mazany, R. L., and Cross, M. L. (1999). The economics of illegal fishing: a behavioral model. Mar. Res. Econ. 14, 95–110. doi: 10.1007/s13280-013-0459-6
European Commission (2016). Trade Market Access Database Statistics. http://madb.europa.eu/madb/statistical_form.htm [accessed January 07, 2018].
European Commission (2008). A Community System to. (Prevent), Deter and Eliminate Illegal, Unreported and Unregulated Fishing. Available at: https://eur-lex.europa.eu/LexUriServ/LexUriServ.do?uri=OJ:L:2008:286:0001:0032:EN:PDF
Kuperan, K., and Sutinen, J. G. (1998). Blue water crime: deterrence, legitimacy, and compliance in fisheries. Law Soc. Rev. 32, 309–338. doi: 10.2307/827765
Miller, D. D., Sumaila, U. R., Copeland, D., Zeller, D., Soyer, B., Nikaki, T., et al. (2016). Cutting a lifeline to maritime crime: marine insurance and IUU fishing. Front. Ecol. Environ. 14, 357–362. doi: 10.1002/fee.1293
NOAA (2017). Commercial Fisheries Statistics. Available at: http://www.st.nmfs.noaa.gov/commercial-fisheries/foreign-trade/applications/annual-product-by-countryassociation, [accessed January 07, 2018].
OECD (2004). Fish Piracy: Combating Illegal, Unreported and Unregulated Fishing. Paris: Organisation for Economic Co-operation and Development (OECD). doi: 10.1787/9789264016804-en
Österblom, H., Bodin, Ö, and Sumaila, U. R. (2015). Reducing illegal fishing in the Southern Ocean: a . global effort. Solutions 4, 72–79.
Papaioannou, M. (2016). The EU–Africa partnership in the fight against IUU fishing. Afr. J. Int. Comp. Law 24, 158–167. doi: 10.3366/ajicl.2016.0145
Sumaila, U. R., Alder, J., and Keith, H. (2004). “The cost of being apprehended for fishing illegally: empirical evidence and policy implications,” in Fish Piracy: Combating Illegal, Unreported and Unregulated Fishing, eds K. Gray, F. Legg, and E. Andrews-Chouicha (Paris: Organisation for Economic Co-operation and Development (OECD)), 201–230.
Sumaila, U. R., Alder, J., and Keith, H. (2006). Global scope and economics of illegal fishing. Mar. Policy 30, 696–703. doi: 10.1016/j.marpol.2005.11.001
Swartz, W., Sumaila, U. R., Watson, R., and Pauly, D. (2010). Sourcing seafood for the three major markets: the EU, Japan and the United States. Mar. Policy 34, 1366–1373. doi: 10.1016/j.marpol.2010.06.011
The World Bank (2016). GDP at Market Prices (Current USD). Available at: http://data.worldbank.org/indicator/NY.GDP.MKTP.CD?page=1 [accessed January 07, 2018].
UN Comtrade (2016). UN Comtrade Database. Available at: http://comtrade.un.org/data/ [accessed January 07, 2018].
UN Statistics (2016). National Accounts Main Aggregates Database: GDP and its Breakdown at Current Prices in USD. Available at: http://unstats.un.org/unsd/snaama/dnlList.asp [accessed January 07, 2018].
Keywords: IUU fishing, economic indicators, economic risk index, EU, United States, Japan
Citation: Sumaila UR (2019) A Carding System as an Approach to Increasing the Economic Risk of Engaging in IUU Fishing?. Front. Mar. Sci. 6:34. doi: 10.3389/fmars.2019.00034
Received: 24 May 2018; Accepted: 22 January 2019;
Published: 13 February 2019.
Edited by:
Philippe Le Billon, The University of British Columbia, CanadaReviewed by:
Andrew Serdy, University of Southampton, United KingdomMarcus Geoffrey Haward, University of Tasmania, Australia
Copyright © 2019 Sumaila. This is an open-access article distributed under the terms of the Creative Commons Attribution License (CC BY). The use, distribution or reproduction in other forums is permitted, provided the original author(s) and the copyright owner(s) are credited and that the original publication in this journal is cited, in accordance with accepted academic practice. No use, distribution or reproduction is permitted which does not comply with these terms.
*Correspondence: U. Rashid Sumaila, r.sumaila@oceans.ubc.ca