 Pauline Chauvet
 Anna Metaxas
 Marjolaine Matabos
- 1Ifremer Centre de Bretagne, REM/EEP, Laboratoire Environnement Profond, Bretagne, France
- 2Department of Oceanography, Dalhousie University, Halifax, NS, Canada
Understanding the population dynamics of commercially fished deep-sea species, on seasonal to inter-annual scales, is of great importance in areas where fishing pressure is high. The remoteness of the deep-sea environment constitutes a challenge for monitoring these populations. The few studies that have investigated population structure of deep-sea species, have used trawls, a destructive approach for benthic ecosystems. The development of deep-sea observatories offers a continuous long-term presence on the seafloor. Using imagery from the Ocean Network Canada deep-sea observatory, video footage was acquired on a daily basis and analyzed to describe the population dynamics of the deep-sea crab Chionoecetes tanneri located in depths of 900–1000 m in Barkley Canyon, off Vancouver Island (BC, Canada). The objectives here were to describe the dynamics of the local population in relation to changes in environment and/or life-cycle related behaviors. Sampling sites were located along the canyon axis and on the canyon wall. Only juveniles (1–10 cm) were found at the axis site (1000 m depth) with densities varying from 0 to 144 individuals/m2. On the canyon wall (900 m depth), adults (>10 cm) were sporadically observed and densities were lower (max. 13 individuals/m2). Variation in density between the two sites reflected the observed arrival of small individuals (<2.4 cm) at the axis site in summer and autumn. Apart from a distinct migration event in January 2015, intra-annual variability in density was higher than inter-annual variability as illustrated by significant annual and sub-annual cycles of 7.5 and 3.5 months. Our results confirmed the hypothesis of ontogenic migration and provide further insight into inter-molt periodicity; we demonstrated a duration of 16 months for one crab to grow from 1.8 cm to more than 5 cm. Our findings also show a correlation between population dynamics, chlorophyll concentration, surface wave height and wind speed, suggesting that surface blooms have a potential influence on the migration patterns of C. tanneri. Although our study was spatially limited (maximum surface 9 m), this innovative long-term study of a deep-sea crab demonstrates the potential of deep-sea observatories to enable research into the population dynamics of some deep-sea species.
Introduction
With the decline of some species targeted by fisheries, including crab stocks (Orensanz et al., 1998; Johnston et al., 2011; Mullowney et al., 2014), and with increasing efficiency of vessels and fishing gear, fleets now operate at increasingly greater depths, impacting populations down to 3000 m (Ramirez-Llodra et al., 2011). To evaluate the viability of a fishery, knowledge of the species’ biology, population dynamics, and life-history traits is essential. However, due to the remoteness of the environment, our understanding of the structure and function of deep-sea ecosystems and of species’ dynamics is still too rudimentary to properly inform sustainable fisheries (Francis and Clark, 2005; Ramirez-Llodra et al., 2011). To date, most studies on deep-sea commercial species are based on trawling surveys (Francis and Clark, 2005; Devine et al., 2006). While trawling is an appropriate method to collect samples for precise identification, measurements, sexing and various observations such as hardness of shell or presence of diseases in deep-sea decapods (Phillips and Lauzier, 1997; Workman et al., 2002; Boutillier and Gillespie, 2005; Perry et al., 2005; Keller et al., 2012; Cusba and Paramo, 2017; Chakraborty et al., 2018), it is not suitable for high frequency time series (López Abellán et al., 2002; Keller et al., 2012). In addition, trawling is a destructive sampling technique which can impact the seafloor (Puig et al., 2012; Martín et al., 2014; Clark et al., 2016). In contrast, in situ video surveys were used to quantify the density of Nephrops norvegicus as a complementary method to fishery trawling (ICES, 2013; Martinelli et al., 2013). Over the last decade, the increasing use of imagery has provided insights into our knowledge of deep-species distribution ranges and abundances while mitigating the impact of more destructive techniques on the environment (Van den Beld et al., 2016; De Leo et al., 2017; Domke et al., 2017). More recently, the development of deep-sea observatories, facilitating multidisciplinary studies over periods of several years at high temporal resolution, offer new means to study and assess the temporal dynamics of deep-sea ecosystems (Aguzzi et al., 2012; Matabos et al., 2012; Lelièvre et al., 2017; Chauvet et al., 2018). In this study, we propose to use this technology for the first time to assess the population dynamics of a commercially targeted deep-sea crab species.
One of the best known groups of crustacean is the infraorder Brachyura (true crabs). They can colonize diverse environments and are found in a broad range of salinity [from freshwater to hypersaline >175% of normal (Gross, 1961; Yeo et al., 2008)], temperature [<0 to 43°C (Edney, 1961; Dawe and Colbourne, 2002)] and oxygen [supporting life in hypoxia (Levin, 2003; Ng et al., 2008)]. They can be terrestrial or aquatic and colonize areas from 2,000 m above sea level on mountains down to abyssal depths (6,000 m deep) (Ng et al., 2008). The biology and ecology of deep-sea crabs has been studied mostly in chemosynthetic environments, such as hydrothermal vents, because of their potential adaptations to extreme environmental conditions (e.g., Chausson et al., 2001; Goffredi et al., 2014; Watsuji et al., 2015, 2017; Hui et al., 2017). Few studies have focused on population dynamics, with the exception of some harvested species, whether as bycatch such as the portunid crab Bathynectes piperitus in Benguela (Abelló et al., 1990) and the red crab Chaeceon affinis in the Faroes (Lorance, 2007) or as a primary targeted species, e.g., the red king crab Paralithodes camtschaticus (ICES, 2010) with its high commercial value (Dvoretsky and Dvoretsky, 2016). Only a subset of those studies has focused on spatial structure at small scales and life-history characteristics (e.g., Abelló et al., 1990; López Abellán et al., 2002; Martí-Trujillo et al., 2014; Biscoito et al., 2015). Indeed, most studies have focused on the estimation of biomass for the management of the development of new fisheries (Defeo et al., 1991; Pezzuto et al., 2006; Perez et al., 2009; Masello and Defeo, 2016). These studies often recommended a need for increased knowledge of population dynamics (Perez et al., 2003).
In British Columbia (Canada), four species of crabs are commercially targeted: the Dungeness crab (Cancer magister), the red rock crab (Cancer productus), the golden king crab (Lithodes aequispinus) and the red king crab (Paralithodes camtschaticus) (British Columbia Marine Conservation Analysis Project Team, 2010), all distributed at depths from shallow waters to 400 m (Butler and Hart, 1962; Rickets et al., 1968). A decline in the Dungeness crab fishery in the 1990s encouraged the development of a new sustainable fishery along the Pacific coast of Canada (Perry et al., 2005) and the grooved Tanner crab C. tanneri became a species of interest. Before a fishery was instigated, an initial review of knowledge on the biology and ecology of C. tanneri and its congeneric species C. angulatus identified numerous data gaps regarding the distribution, abundance, population structure, life history characteristics, and bycatch in existing fisheries (Phillips and Lauzier, 1997). As a result of subsequent trawl and trap surveys used to assess abundance and life-history features (Boutillier et al., 1998; Workman et al., 2001, 2002), conservative commercial fishing quotas were set, and one area was closed to fishing as a control (Perry et al., 2005). Because of its potential as an emerging fishery, it is of great importance to better understand the distribution and population dynamics of C. tanneri.
The genus Chionoecetes includes four species from the Gulf of Alaska to northern Mexico (Rathbun, 1925; Pereyra, 1966; Hart, 1982): Chionoecetes bairdi and C. opilio, which occur in waters shallower than 450 m and C. tanneri and C. angulatus found from 458 to 1784 m and from 1069 to 3000 m, respectively (Rathbun, 1925; Pereyra, 1966; Hart, 1982; Workman et al., 2001). Stages of maturity are depth-segregated, with adults living from 600 to 900 m depth (Pereyra, 1966; Workman et al., 2002; Gillespie et al., 2004; Keller et al., 2012, 2016), and juveniles and subadults (immature with carapace width <10 cm; Keller et al., 2016) deeper than 900 m (1200 m for C. angulatus). Reproduction also impacts crab distribution through aggregating behaviors of adults in late winter (Pereyra, 1966; Workman et al., 2001). Chionoecetes crabs are opportunistic and feed on benthic invertebrates: mostly amphipods, copepods, smaller juvenile Chionoecetes, ophiuroids, clams, worms and detritus (Phillips and Lauzier, 1997).
Since 2009, the Ocean Networks Canada (ONC) observatory has provided continuous interdisciplinary data at various locations off Vancouver Island (British Columbia, Canada), from coastal areas to the abyssal plain. One of ONC’s research themes focuses on the study of bentho-pelagic coupling in Barkley Canyon, a mid-slope submarine canyon located in the Northeast Oxygen Minimum Zone (dissolved oxygen <0.5 mL/L). Recent studies reported the presence of C. tanneri from 550 to 1400 m depth in the region (De Leo et al., 2017; Doya et al., 2017; Chauvet et al., 2018). ONC cameras located between 800 and 1000 m depth along the axis of Barkley Canyon have revealed the presence of a few adults and a large number of juveniles of C. tanneri (Doya et al., 2017; Chauvet et al., 2018). Barkley Canyon has been hypothesized to offer shelter for species with a high tolerance to hypoxia (Chauvet et al., 2018). The seasonal dynamics that characterize benthic communities in the canyon (Doya et al., 2017; Chauvet et al., 2018) could affect the behavior and dynamics of the crab populations in relation to changes in environmental conditions or biotic interactions (e.g., predation, resource variability). Using available long-term, high-resolution data provided by ONC, this study aims to demonstrate that the use of imagery offers an alternative method to study deep-sea species population dynamics. More specifically, the objectives are to: (i) describe the dynamics of the local population of C. tanneri and (ii) investigate how these dynamics relate to changes in environmental factors and/or life-cycle related behaviors. We expected that at depths >890 m, mainly juvenile C. tanneri would occur, particularly since this would be an area with few predators but sufficient food to allow their development. We also expected to observe the seasonal arrival and departure of crabs linked to reproductive migration (Jamieson et al., 1990; Pereyra, 1966; Workman et al., 2001). Our study used daily video observations collected over a period of 2.5 years to measure abundance and size frequency of C. tanneri. Results will contribute to increasing biological knowledge useful for the sustainable management of this potential commercial species.
Materials and Methods
Sampling Site
Barkley Canyon incises the continental margin 80 km west of Vancouver Island (British Columbia, Canada) commencing at a depth of ∼400 m and opening out to a submarine fan at ∼2,200 m depth (Figure 1). It is ∼42 km long with a maximum width at the canyon head of 8 km.
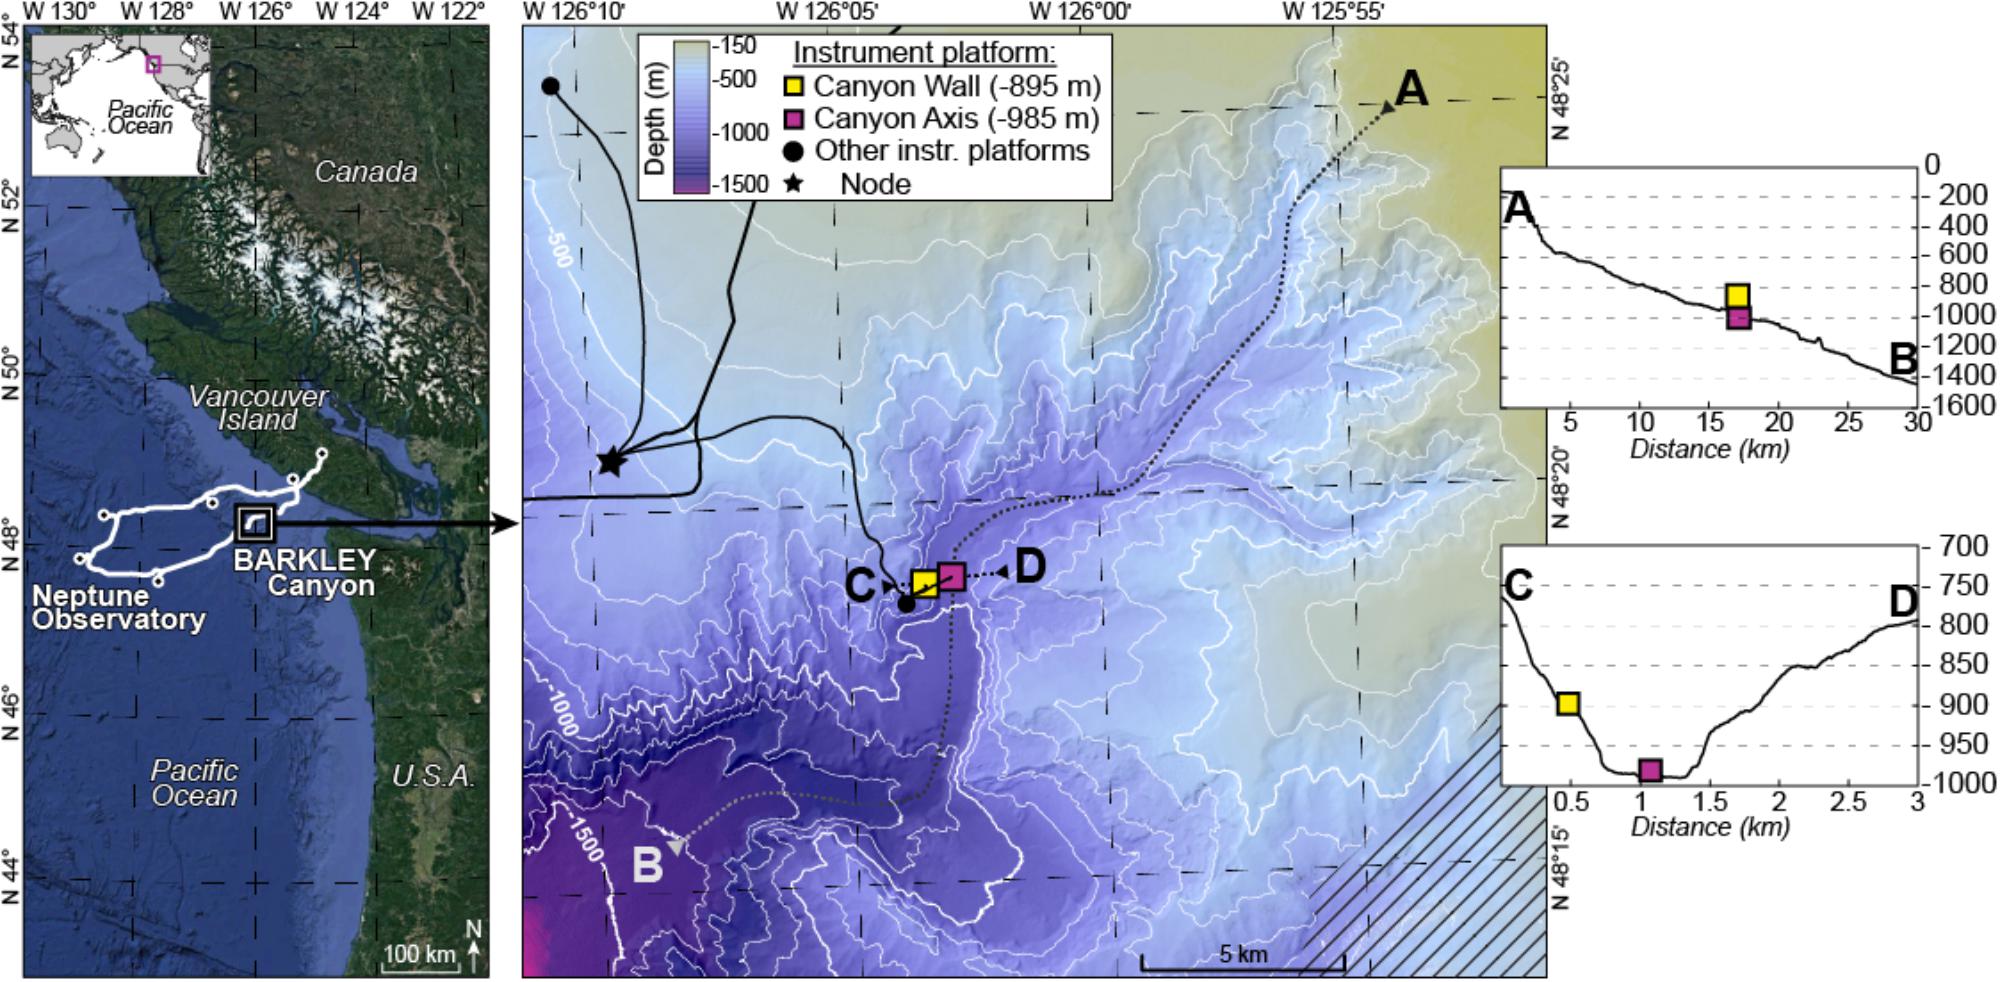
Figure 1. Location map. Left panel: position of the cabled Ocean Networks Canada observatory. Right panel: Barkley Canyon showing the position of the sampling sites; the axis site is shown as a pink square and wall site as a yellow square. Inset side: topography of transects traversing the canyon lengthwise (A,B) and widthwise (C,D).
The two sampling sites were located in the canyon axis (latitude: 48°19.0087′N, longitude: 126°03.077′W, depth: 985 m) at the ONC-designated pod 1 site and on the canyon wall (latitude: 48°18.8915′N, longitude: 126°03.4912′W, depth: 894 m) at the ONC-designated pod 4 and pod 3 sites. Pods are cabled instrument platforms equipped with biological and physico-chemical sensors. For more details on the cabled network specifications see Juniper et al. (2013).
Data Collection
Faunal Characterization
The crab C. tanneri (Figure 2) was identified and enumerated in video sequences that were recorded with a color camera mounted on a motorized pan/tilt head allowing for a maximum of 360° sweep for 5 min, every two hours (60 min per day) (all videos1). Illumination was provided by two Deep-Sea Power and Light variable intensity projectors. Because the pan and tilt limit settings for the camera were modified during annual maintenance cruises, the surface area covered by the camera varied between 3.9 and 9 m2 over the study period (see details in Table 1). From the 60 min of daily records, we analyzed the 5-min record from 0800 to 0805 daily (which we refer to as a “sample”) from 12 June 2012 to 11 January 2015. This time window was chosen to minimize the number of gaps in the time-series. Previous research at the wall site suggests the absence of a diel or tidal rhythm for this species (Doya et al., 2014). Each video was viewed using VLC media player®. All visible crabs were counted and density (ind/m2) obtained by dividing the observed abundance with the surface area of the field of view. Because the footage quality was too low for precise measurement on the wall (pod 3), only individuals from the axis were measured. For one video sequence per week, snapshots were taken to cover the total surface recorded during a single camera rotation using VLC 2.0.1©. All pictures were then overlapped with a perspective grid previously built using laser and referenced rulers with ImageJ© (Ferreira and Rasband, 2012; Figure 3). From August 2014 to January 2015, the change in tilt did not allow the creation of a precise perspective grid for most of the surface covered by the camera; thus, the surface area over which crabs could be measured with sufficient precision was reduced to 0.5 m2. We measured carapace width (CW), i.e., the greatest measurement across the branchial regions of the carapace excluding the lateral spines (Pereyra, 1966; Figures 2, 3), in crabs with visible carapace. To validate whether a single video per week provided a representative sample of crab size and abundance, we collected daily samples during three non-consecutive weeks (15 to 23 of June and 01 to 05 of August 2012, and from 26 to 31 of January 2013) (chosen during phases of increased or decreased crab density –results not shown-). Measurement accuracy (0.2 cm) was determined by sizing 10 crabs, 10 times in five different snapshots.
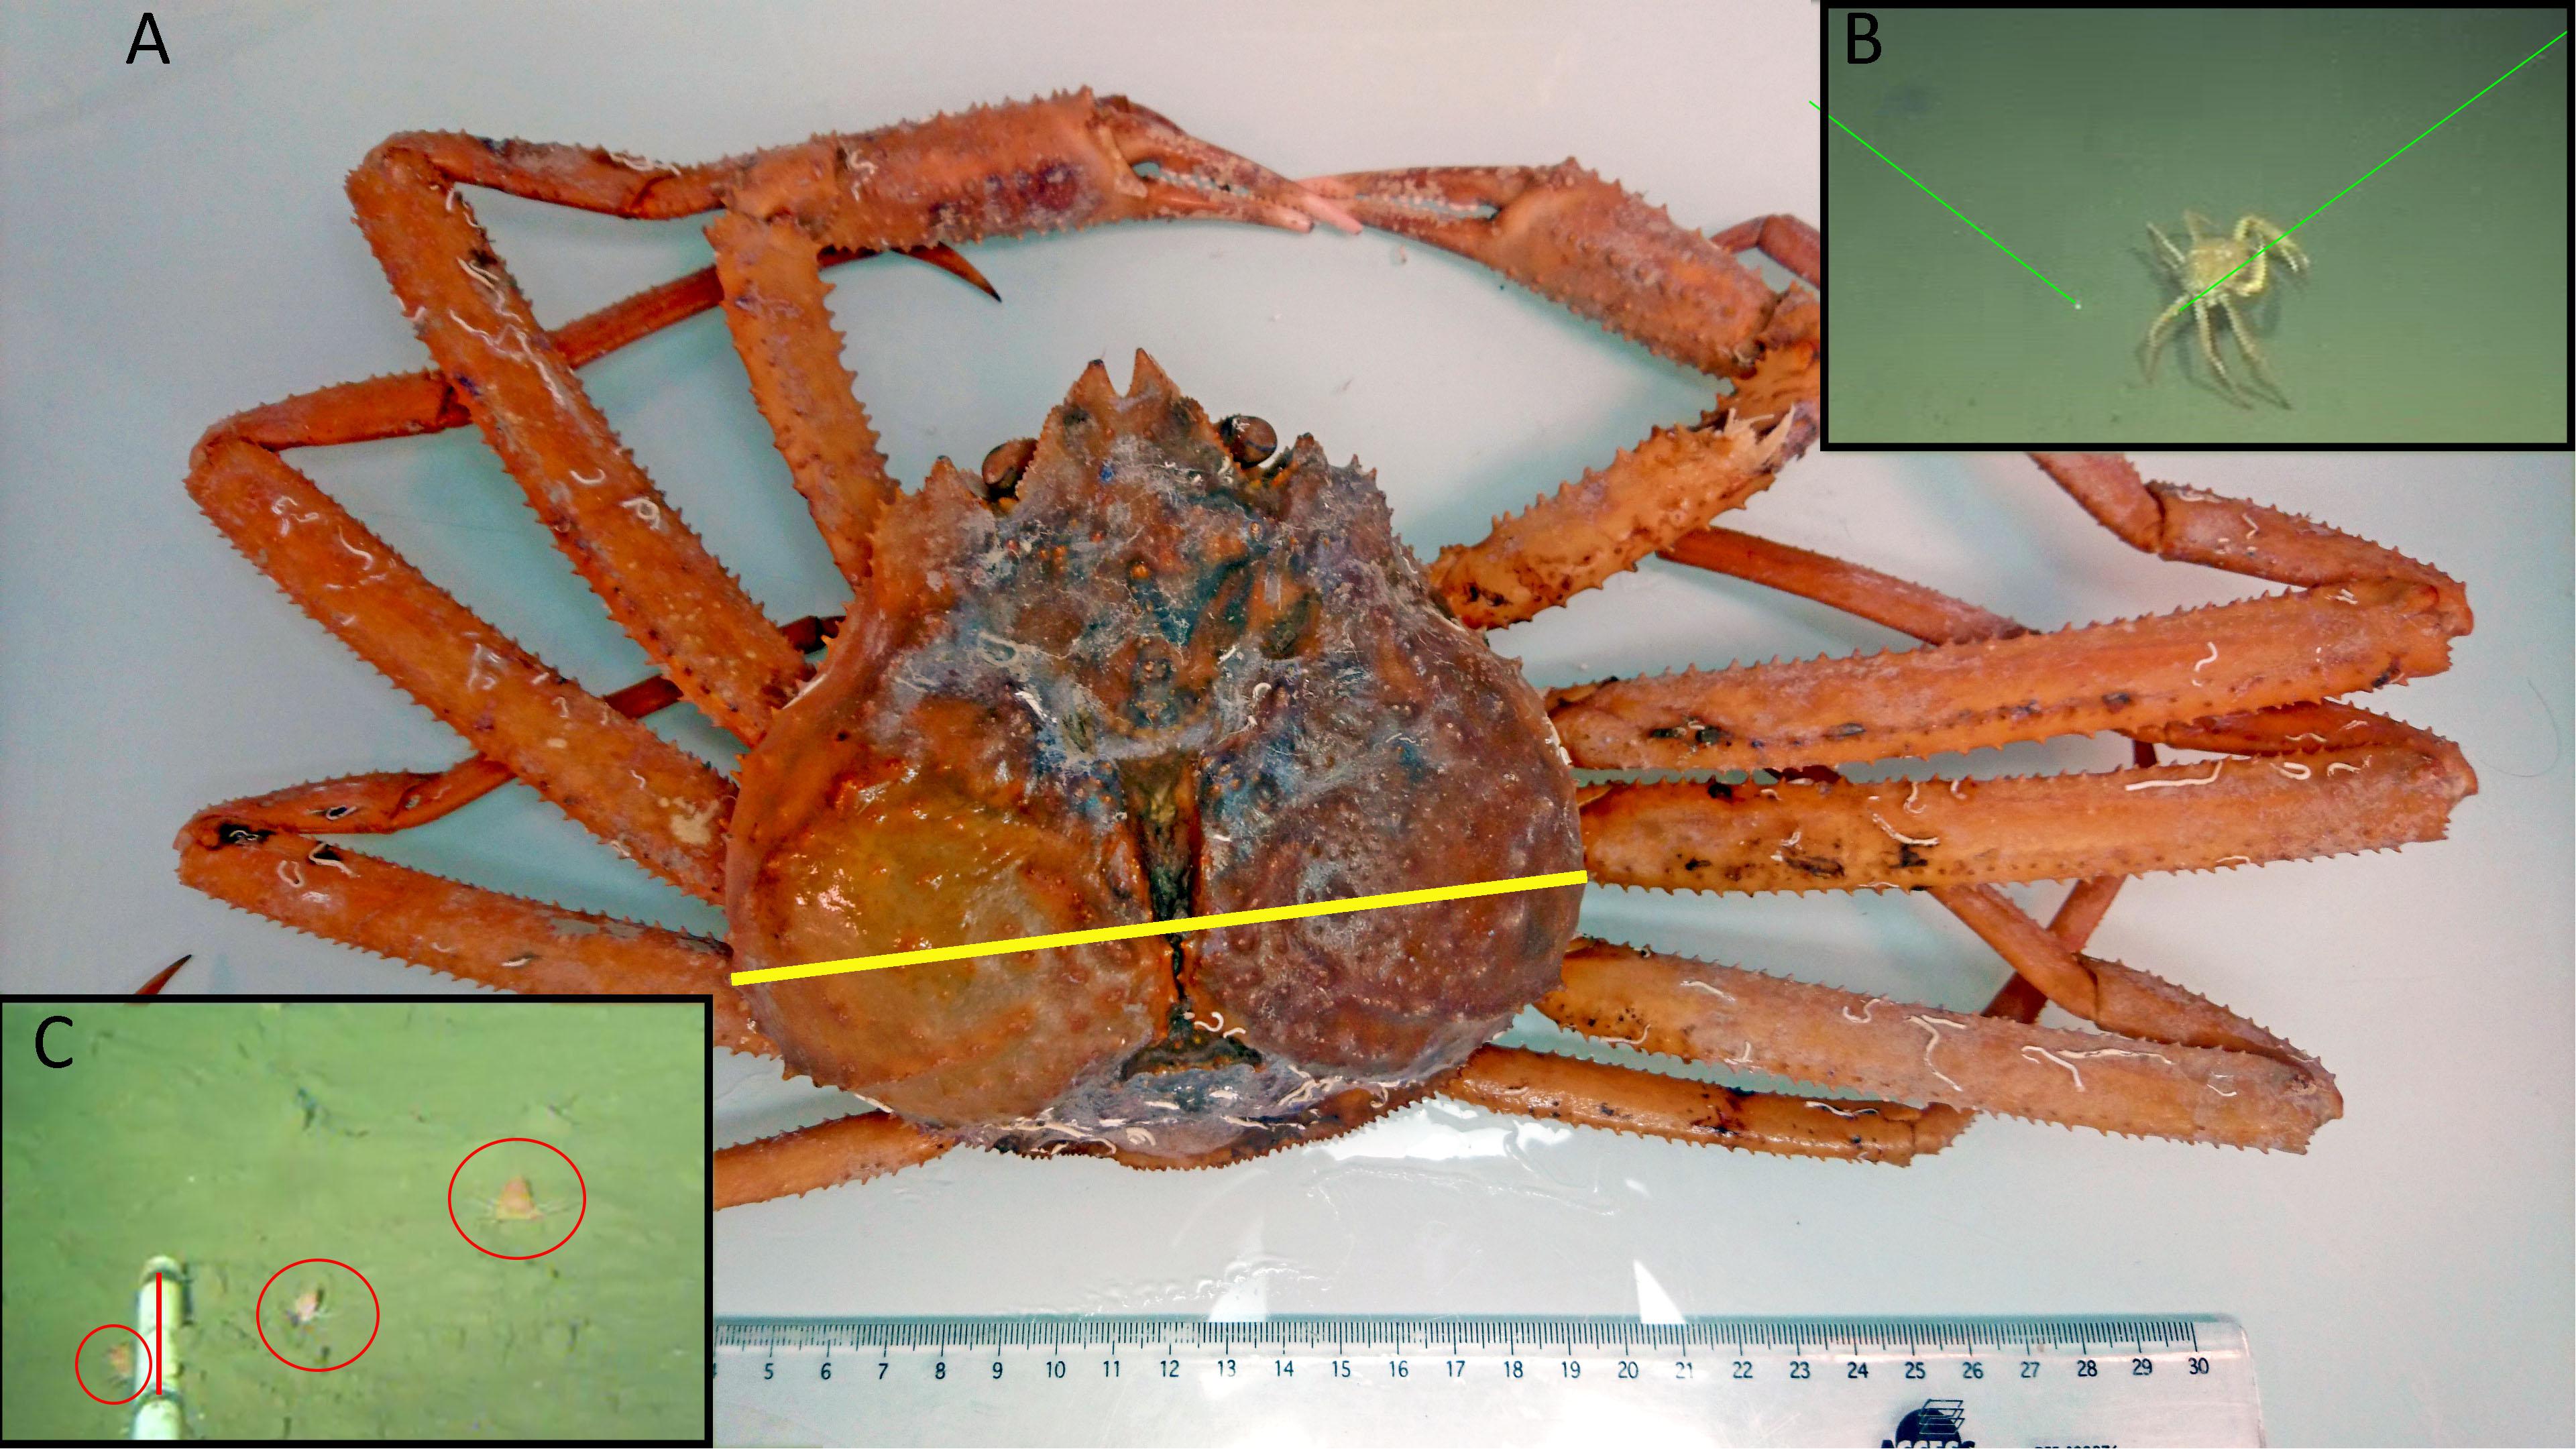
Figure 2. (A) An adult Chionoecetes tanneri sampled with an ROV during a 2016 maintenance cruise at the wall (pod 3) at 890 m depth in Barkley Canyon (British Columbia, Canada). The carapace width (yellow line) is 15 cm. (B) Snapshot of this crab walking on the bottom before being sampled. (C) Snapshot of a video record at the wall (pod 3) station taken by the fixed camera showing two juveniles and one sub adult (on the right); the red line on the scaling ruler corresponds to 10 cm.
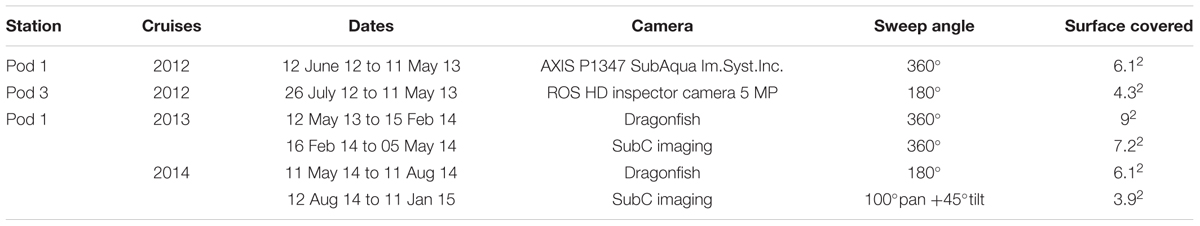
Table 1. List of the characteristics of the camera systems deployed in Barkley Canyon (British Columbia, Canada) from (i) 12 June 2012 to 11 January 2015 at 985 m depth at pod 1 at the axis and (ii) 26 July 2012 to 11 May 2013 at 894 m depth at pod 3 on the wall.
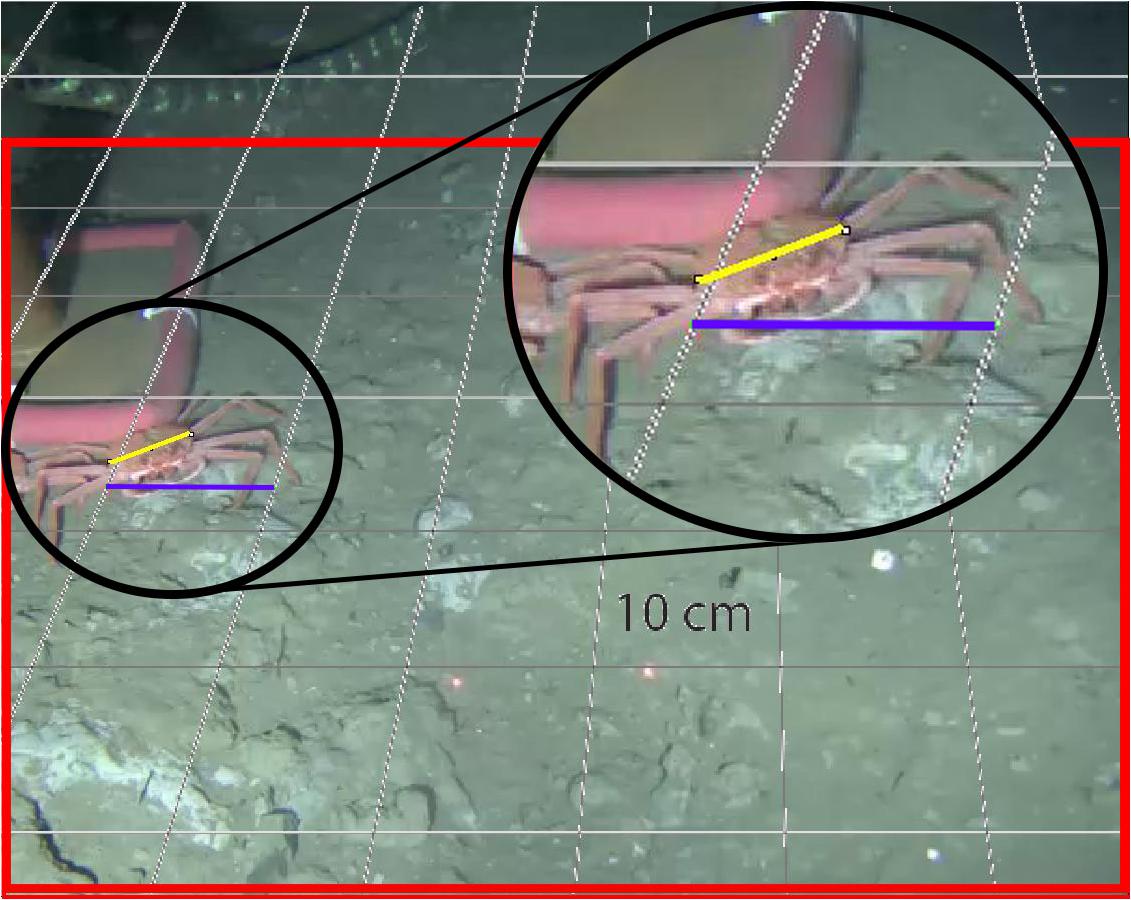
Figure 3. An example of a snapshot taken at 985 m depth at the axis (pod 1) in Barkley Canyon (British Columbia, Canada) combined with the perspective grid (each square = 10 cm × 10 cm). The red square delimits the area where measurements were made with sufficient precision. The purple line represents a 10-cm vector and the yellow line the measurement of carapace width.
Environmental Characterization
In a previous study, we showed that benthic environmental conditions were homogeneous over the study period with temperature ranging from 3.51 to 4.07°C, oxygen concentration from 0.24 to 0.34 mL/L and the benthic boundary layer current varying from 0 to 0.2 m/s (Chauvet et al., 2018; Supplementary Figure 1). In addition, epibenthic community dynamics appear to respond predominantly to changes in surface rather than bottom conditions (Chauvet et al., 2018).
Atmospheric pressure (dbar), significant wave height (m), and wind speed (m/s) were acquired by an NBDC meteorological buoy 46206 on La Perouse Bank (Tofino, British Columbia, latitude: 48°50′24′′N, longitude: 126°00′00′′W2) (Table 2). Surface concentration of chlorophyll used for the analysis was provided as 8-day averages by MODIS, NASA Earth Observations (NEO) Goddard Ocean Color Group3 (Table 2).
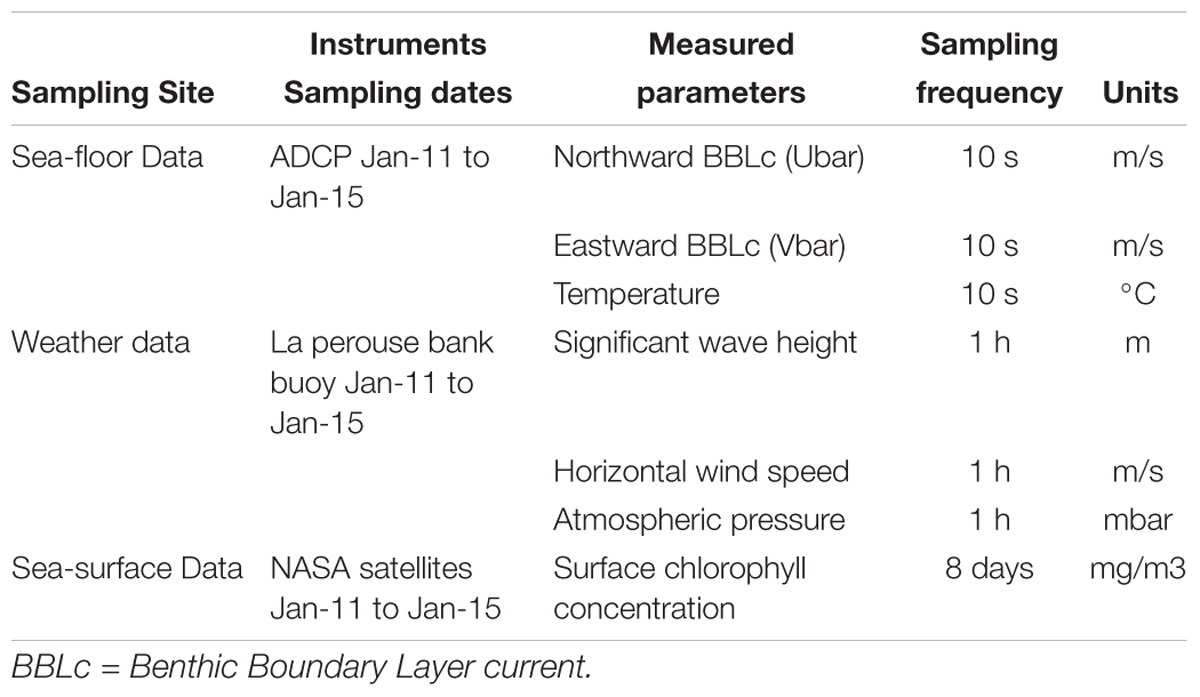
Table 2. List of instruments acquiring environmental data in Barkley Canyon (British Columbia, Canada) including (i) hydrographic parameters on the seafloor at the axis of the canyon at pod 1 station (48°19′N, 126°03′W) at 985 m depth, (ii) weather data from La Perouse buoy (48°50′N, 126°00′W, Tofino, British Columbia) and, (iii) sea surface chlorophyll concentrations from NASA satellites in a square surface around Barkley Canyon (45°56′ to 50°05′N, 124°87′ to 132°07′W).
Data Processing
A Kruskal-Wallis test showed no significant differences in size between the weekly and daily samples (p-value >0.2), confirming the accuracy of weekly sampling frequency in representing the dynamics in size frequency.
Because the size frequency distributions of individual C. tanneri displayed a multi-modal pattern, we assumed that the sampled population was composed of mixed cohorts. Histograms of the size frequency distributions were analyzed as mixtures of statistical distributions for samples containing at least 40 individuals (18 samples fitted this restriction). Histograms of classes of size frequency were derived following the criteria described by Jollivet et al. (2000), with most size-classes having at least five individuals, the number of adjacent empty classes minimized, and an interval greater than the error of measurement. We determined the overlapping component distribution that gives the best fit to the histogram with the “mixdist” package (Macdonald and Pitcher, 1979; Macdonald and Du, 2012) in R (RStudio Team, 2016). Measurements made on juveniles and sub-adults sampled in Oregon (United States) (Tester, 1975) and British Columbia (Canada) (Gillespie et al., 2004) revealed nine consistent modes between 1 and 10.5 cm (Table 3). Input values in the function MIX can be used to test the validity of certain constraint parameters, here, the mean size for each cohort based on findings reported in the literature. The test, which is based on the chi-square approximation to the likelihood ratio statistic, is considered valid as long as most of the intervals have expected counts of >5. This allowed the identification of gamma components and their parameters (mean, sigma, estimated proportion), each corresponding to a different cohort. The mean size and sigma given by averaging the results of the MIX analysis were used to define cohorts observed at the axis at 985 m depth (pod 1) in Barkley Canyon. The entire set of observation dates was then decomposed into their individual constituent cohorts (i.e., for all dates, individuals were pooled into size class corresponding to defined cohorts) and these were used in the ensuing analyses. The measuring accuracy of our method resulted in overlap of the smallest cohorts given in the literature. Thus, we pooled the first three cohorts (i.e., cohort 1, 2, and 3 in Table 3) as a single group, labeled cohort 1 thereafter.
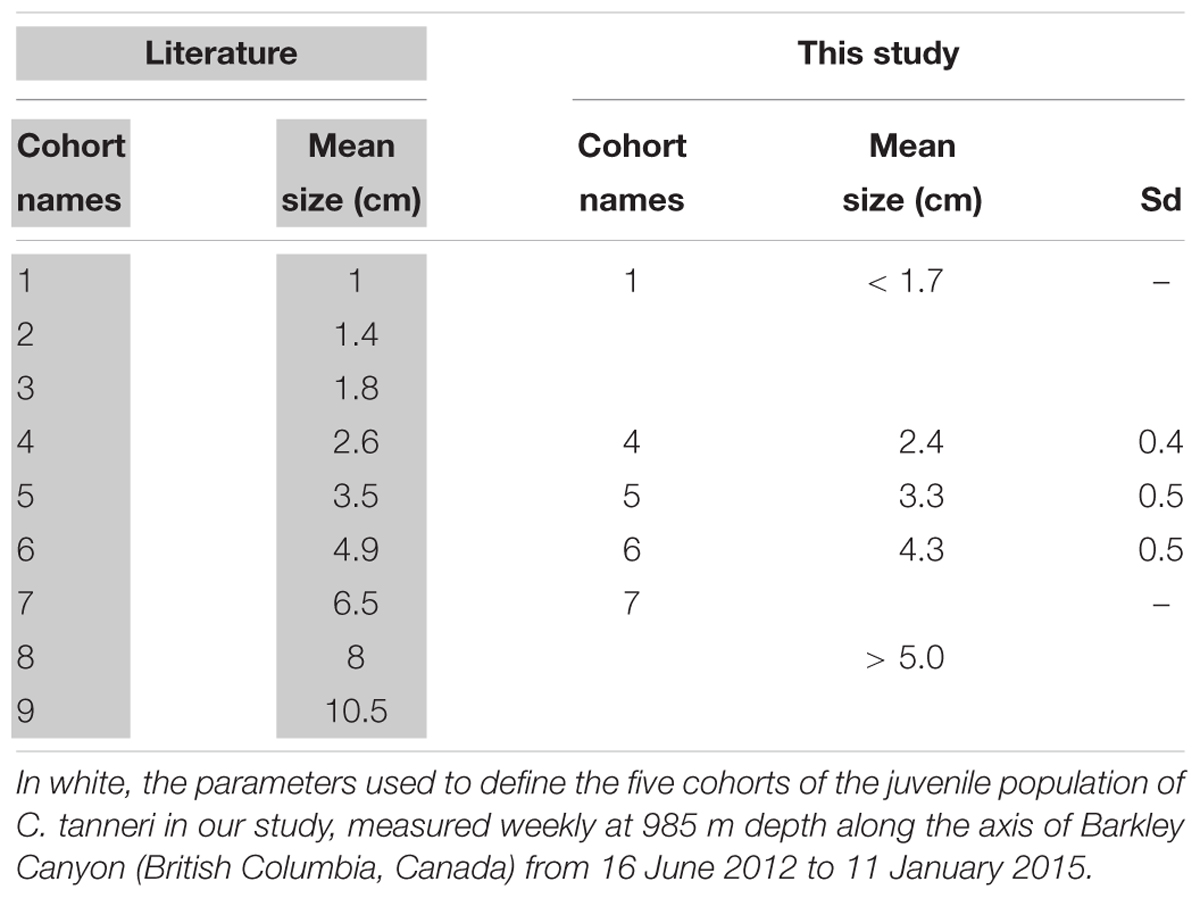
Table 3. In gray, mean size of subadults and juvenile of Chionoecetes tanneri cohorts from trawl sampling of populations found in Oregon (United States) between April 1973 and March 1975 (Tester, 1975) and British Columbia (Canada) between 1999 and 2003 (Gillespie et al., 2004).
We computed the density time-series of each cohort and environmental factors with a Whittaker-Robinson (WR) periodogram to reveal potential periodicities. In the WR-periodogram analysis, time series are folded into Buys-Ballot tables with periods of 2 to a maximum of n/2, where n is the total number of observations. Amplitude is the underlying statistic used in this periodogram function and equals the standard deviation of the means of the columns of the Buys-Ballot table (Legendre and Legendre, 2012). The WR periodogram can handle missing values in the datasets. Prior to periodogram analyses, trends were removed after linear regression and residuals were used in the periodogram analysis. Some degree of caution is warranted in the interpretation as this type of periodogram also finds the harmonics of basic periods to be significant (Legendre and Legendre, 2012).
Each density time-series of each cohort was tested for auto-correlation using the Auto-Correlation Function (ACF) (library stats, R). Correlations among cohorts and between cohorts and environmental factors were tested using the Cross-Correlation Function (CCF) (library stats, R).
To identify potential groups of seasons/years in the local population, we used Principal Component Analysis to visualize the distribution of individual samples (i.e., densities of measured crabs for each observation date) on the first two principal axes. PCA was performed on Hellinger-transformed density data, preserving the Hellinger distance which is appropriate in Euclidean -based multivariate methods. This transformation also mitigates the importance of zero-inflated data (i.e., to avoid inferring similarity between sites from double absences) (Legendre and Gallagher, 2001). This analysis suffered from a horseshoe distortion (Guttman effect) characterized as a one-dimensional ecological gradient that bent into an arch in axis 1 – axis 2 space. This type of distortion limits interpretation and is often due to the progressive change of samples along an environmental gradient (Legendre and Legendre, 2012). As an alternative method, we computed extended dissimilarities (De’ath, 1999), allowing us to generate an ordination where the sites are ordered more linearly along the gradient. The step-across function in vegan was used to transform the dissimilarity matrix on which we applied a Principal Coordinate Analysis (PCoA) (Legendre and Legendre, 2012).
All statistical analyses were performed with R statistical software 3.3.2 (RStudio Team, 2016).
Results
A total of 3,962 individuals were counted at the wall site (pod 3) from 26 July 2012 to 11 May 2013 while at the axis site (pod 1), a total of 53,040 individuals were recorded between 16 June 2012 and 11 January 2015. At both sites, crabs feeding on dead juvenile crabs and empty shells were observed (Figure 4).
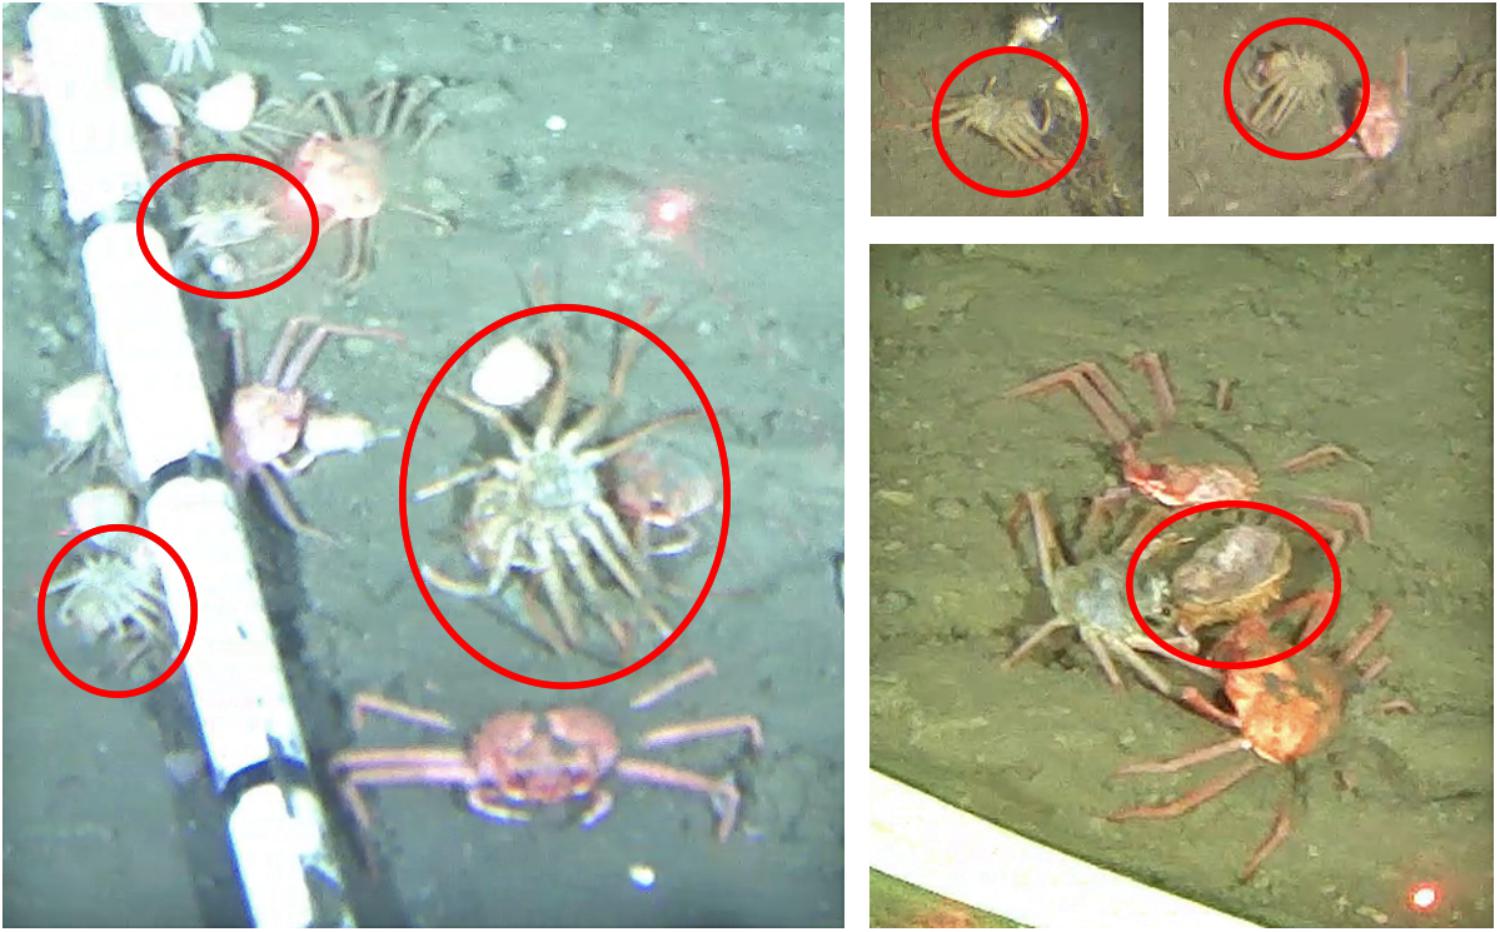
Figure 4. Illustration of cadavers observed at 985 m depth at the axis site in Barkley Canyon (British Columbia, Canada) in June 2013 (left picture) and September 2014.
Densities of C. tanneri varied with time (from 0 to 144/m2 at the axis and 0 to 13/m2 at the wall) following a similar pattern at both sites during the overlapping sampling period (July 2012 to May 2013). Density was relatively constant from July to October before increasing to a maximum in mid-November 2012 (Figure 5) followed by a decrease to a minimum in December 2012. A second density peak occurred in mid-January 2013 at the wall (pod 3) attaining the same low values observed in the previous year. At the axis site, in 2013, periodic peaks of density occurred at the end of February, April, and July and from November to mid-January 2014. In 2014, peaks were again observed in April (minor) and then in July, September, late November and, in unusually high proportions, in January 2015 (Figure 5). An unusually high number of individuals were observed walking in the same direction (144 ind/m2) on 11 January 2015 (Supplementary Figure 4). Whittaker-Robinson periodograms revealed 3 significant scales of periodicity at the axis: a broad ∼annual cycle (from 351 to 393 days), an intermediate cycle of ∼7.5 months (from 210 to 239 days) and a short cycle of ∼2.5 months (from 72 to 73 days). The shorter time-series available for the wall site meant that only a fine cycle of ∼3.5 months (from 102 to 114 days) was detectable.
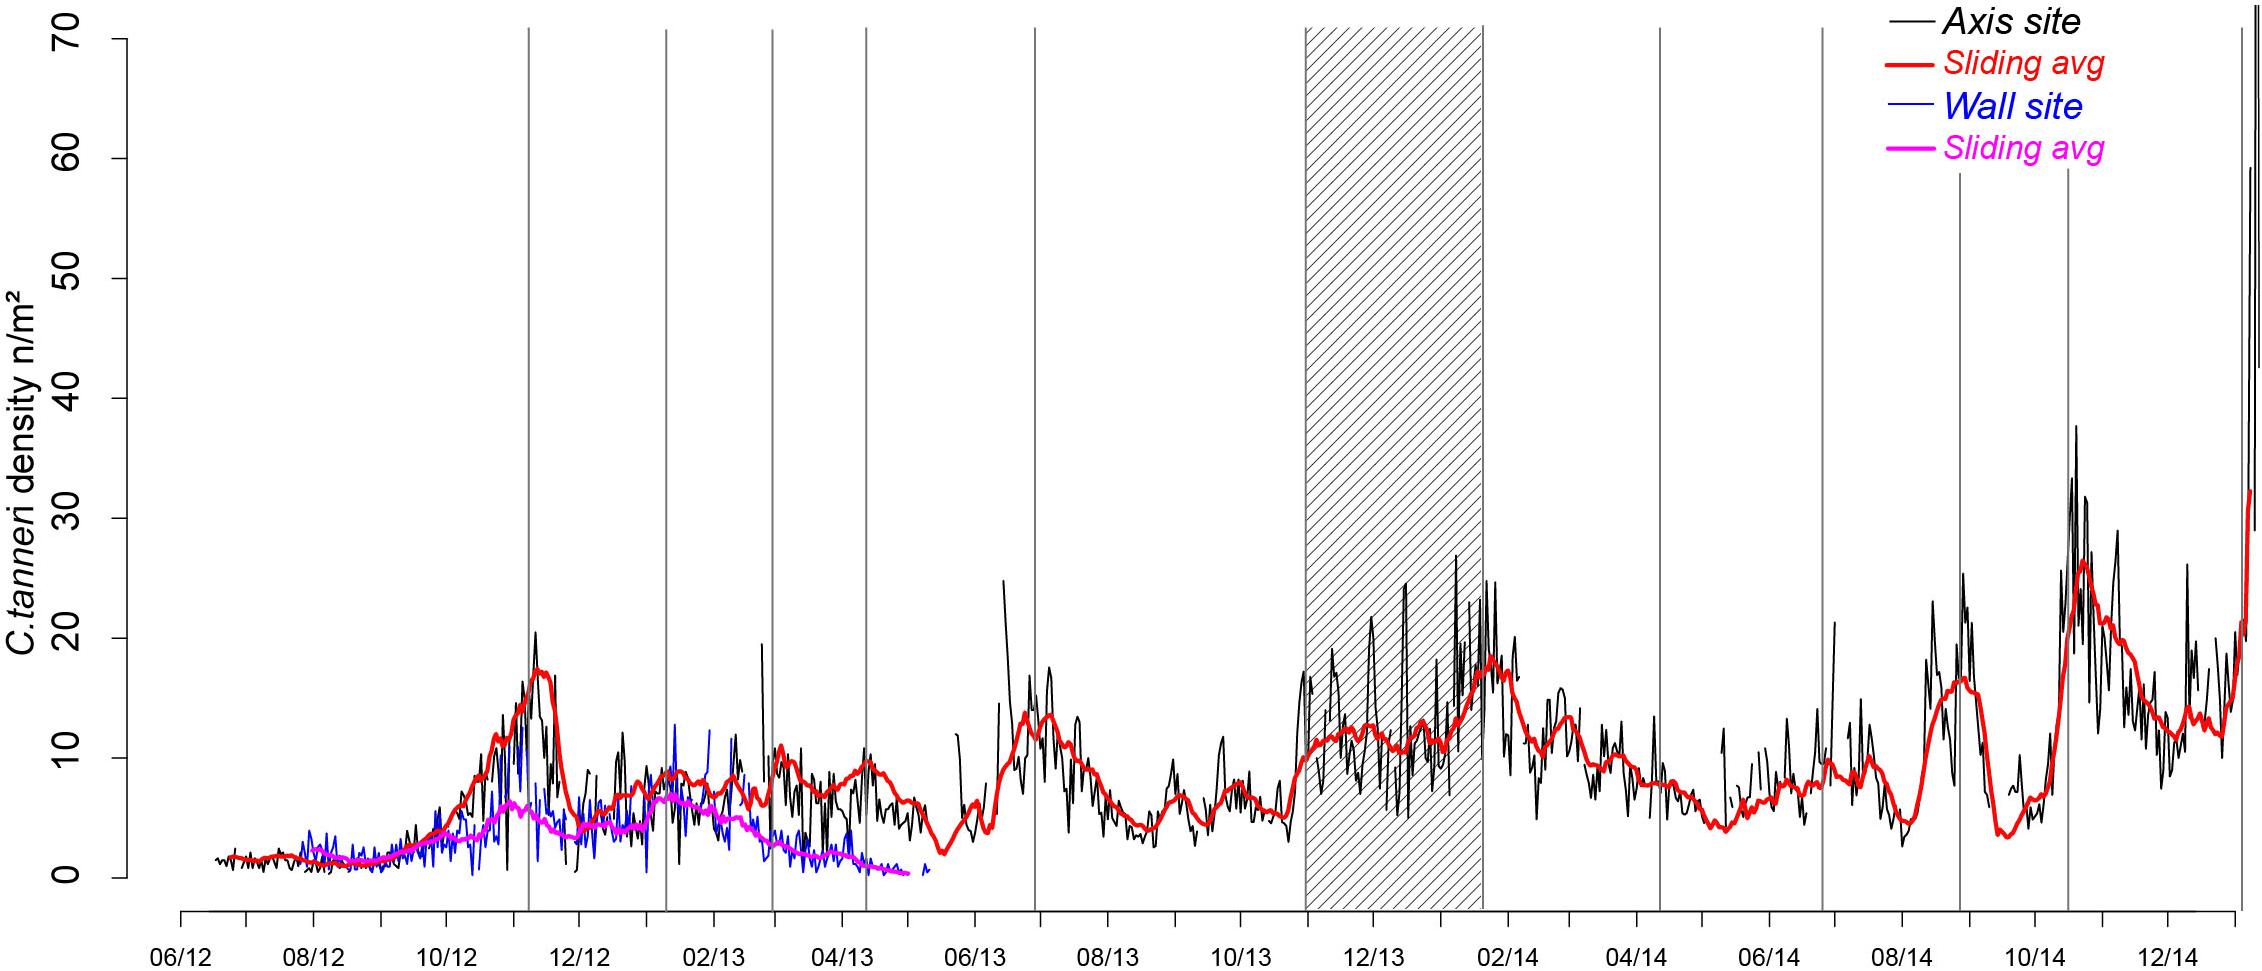
Figure 5. Time-series of C. tanneri density from 12 June 2012 to 11 January 2015 at 985 m depth at the canyon axis/pod 1 (black line) and from 26 July 2012 to 11 May 2013 at 894 m depth at the wall/pod 3 (blue line) of Barkley Canyon (British Columbia, Canada). Density is in individuals per m2, counted from 5 min video sequences, daily over the sampling period. Moving averages over 15 days are indicated in red (axis) and pink (wall). Density peaks are highlighted using gray bars and the period of increasing density in winter 2013–2014 using a stripped rectangle.
Depending on the orientation of the camera and variations in total surface area across the different recording periods (Table 1), the proportion of enumerated crabs that could be measured varied over time. From June 2012 and February 2014, 35–63% of the counted crabs on the images could be measured. Between August 2014 and January 2015 this proportion dropped to 18%. A total of 4,985 crabs were measured at the axis (pod 1). No crabs were measured at the wall because of low video quality. However, even if a temporal approach was not possible, with the addition of data from a ROV video transect, we were able to identify adults, subadults (i.e., immature) and juveniles of C. tanneri at the wall (Figure 2).
At the axis site, the mean carapace width (CW) of individuals in the local crab population was 2.3 cm (SD = 1.1 cm; range: 0.1–12.0 cm) over the entire study period. More than 50% of the measured crabs were between 1.6 and 3.0 cm CW (Table 4), indicating they were juveniles according to the literature (<4.0 cm; Workman et al., 2002). Classes of crabs <0.8 cm and >5 cm CW contained fewer than 50 individuals. It is thus important to note that the full population structure was not detected at this site. MIX analysis showed that not all cohorts were present in each sample (Table 4 and Figure 6). However, except for the first and the last cohorts (μ = 1 cm and μ = 6 cm, respectively), each one was present in at least 5 out of the 18 samples tested and was represented by >50 individuals in total (Table 4). Seven cohorts were detected overall (Table 4, last three lines) and while the proportion of the population in each cohort varied with time, the most frequently represented size classes had mean carapace widths of 1.4, 1.8, and 2.5 cm. Our results were similar to the mean size recorded in the literature for the 5 first cohorts with carapace widths of 1, 1.4 and 1.7 cm (these three grouped for our analyses), and 2.4 and 3.3 cm (Table 3 and Figure 6). The next two cohorts were smaller than indicated by the literature, at 4.3 instead of 4.9 cm and 5.8 instead of 6.5 cm. Because of the low abundance of individuals with CW >5 cm, the three last modes were grouped into a single cohort 7 of subadults [immature crabs with carapace widths between 4.0 and 10.0 cm (Workman et al., 2002; Keller et al., 2016)] (Table 4).
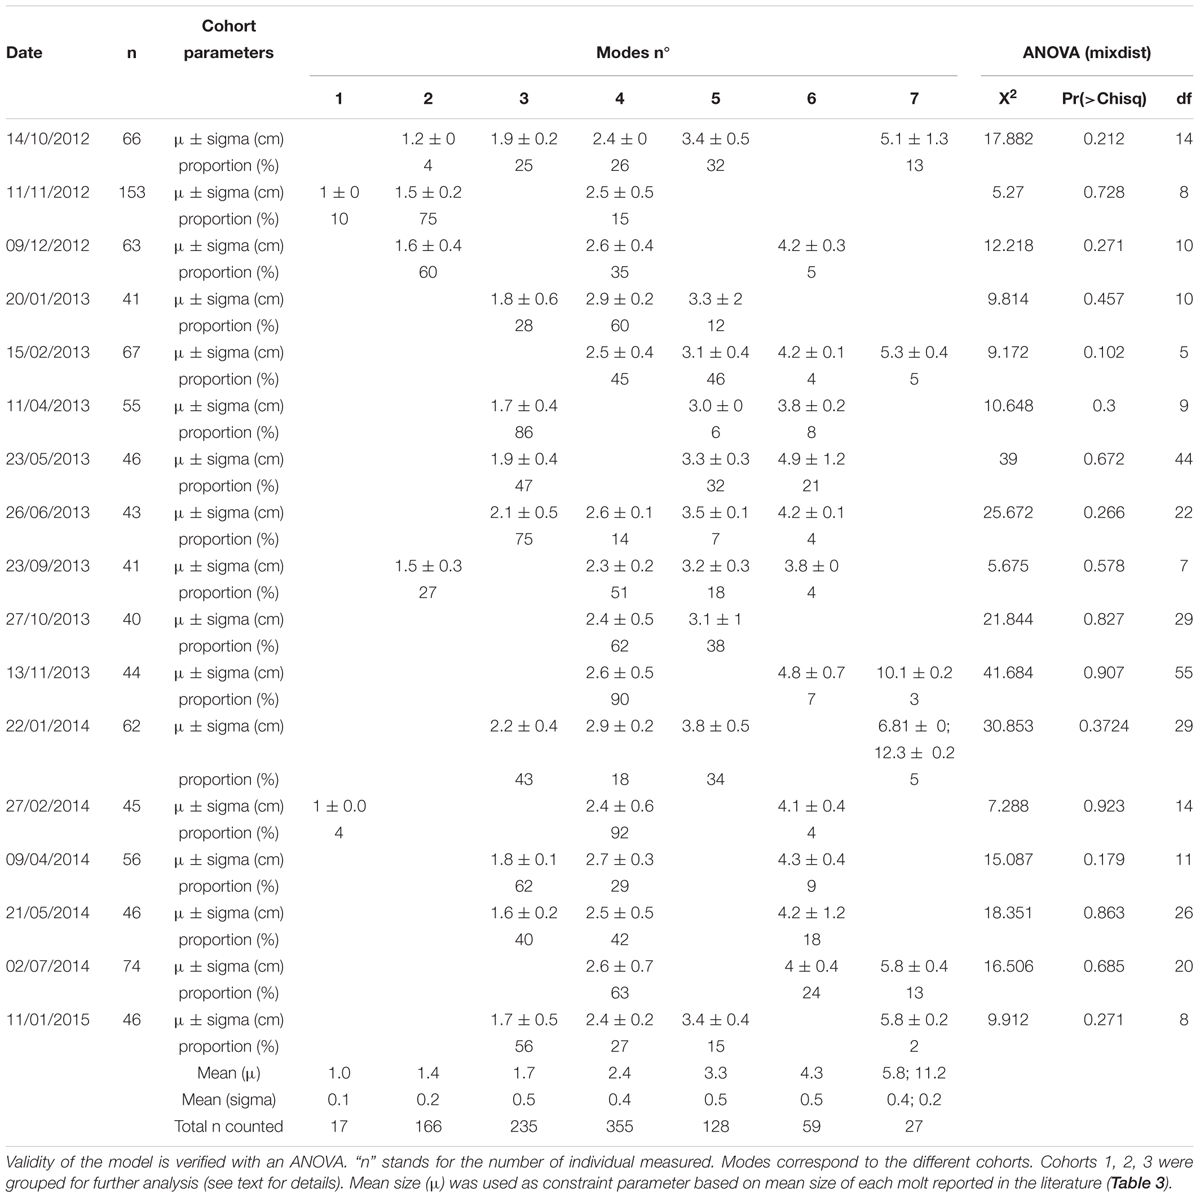
Table 4. Results of MIX analysis conducted on carapace width of C. tanneri (for n > 40) from 16 June 2012 to 11 January 2015 at 985 m depth at the axis of Barkley Canyon (British Columbia, Canada).
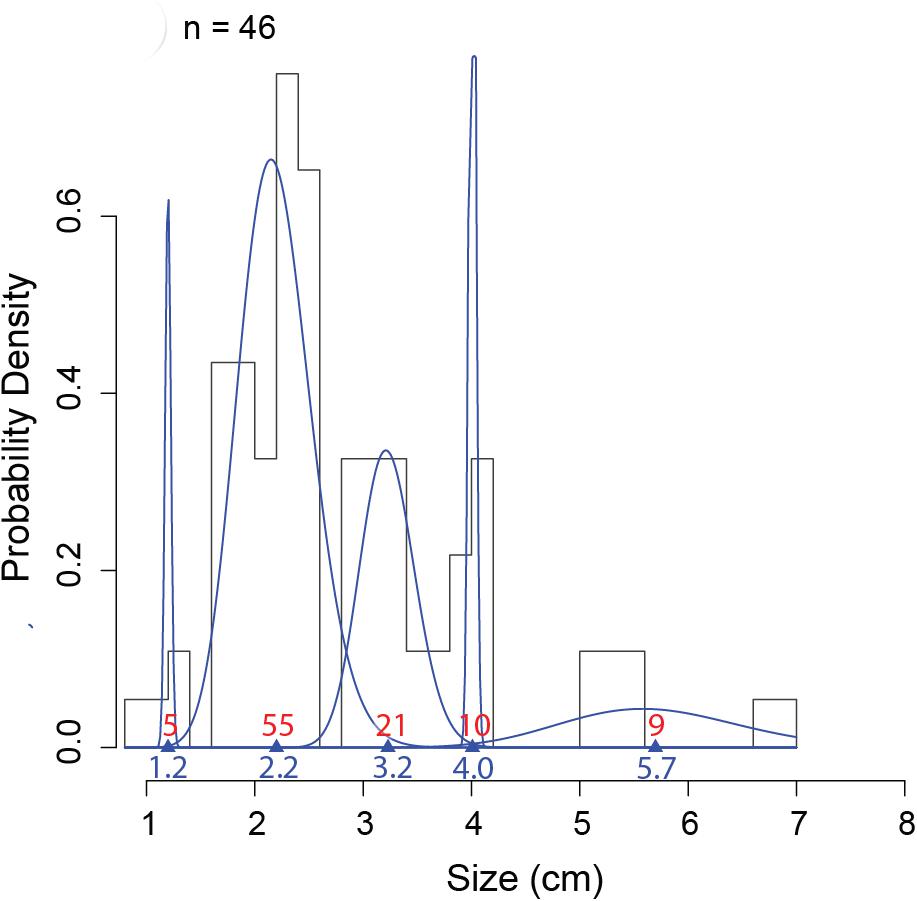
Figure 6. An example of MIX analysis on one sampling date (22 February 2013), representing the probability density histograms of carapace width of the 46 measured individuals at 985 m depth at the axis (pod 1) of Barkley Canyon (British Columbia, Canada). Blue lines represent the gamma distribution of each cohort identified using the mixdist package in R (Macdonald and Pitcher, 1979; Macdonald and Du, 2012). Triangles and blue numbers indicate the mean size of cohorts, and red numbers indicate the estimated proportions in each distribution. Validity of the model was verified with an ANOVA: Df = 14; Chisq = 18.335 Pr(>Chisq) = 0.192.
Enumerated crabs in each sample were assigned to cohorts using the parameters defined for each cohort by MIX analysis (Table 4). At the beginning of the study period, from June to December 2012, the crab population was dominated by cohort 1 (60%) (Table 4 and Figure 7). Subsequently, a pattern emerged with small juveniles (cohort 1) dominating in spring and larger juveniles (cohorts 4 and 5) dominating in summer (Table 4 and Figure 7). More precisely, the density peaks observed in April in 2013 and 2014 were attributable to the arrival of cohort 1 individuals (Figures 5, 7) while the peaks in July in 2013 and 2014 were due to cohorts 4 and 5. In Autumn 2012 and 2014, cohort 1 dominated, while in Autumn 2013 cohort 4 and 5 were dominant (highest densities occurred in November each year). In winter, the peaks in density observed between January and March in 2013, 2014, and 2015 were attributable to cohorts 4 and 5 (Figure 7 and Table 4). The proportion of large juveniles and subadults (cohorts 6 and 7) peaked at >10% in October 2012, late May and mid-November 2013, and late May and July 2014 (Table 4 and Figure 7). The smallest cohorts displayed a significant periodicity at 5.5 months, while cohorts 4 and 5 displayed significant periodicity at 1, 9, and 12 months.
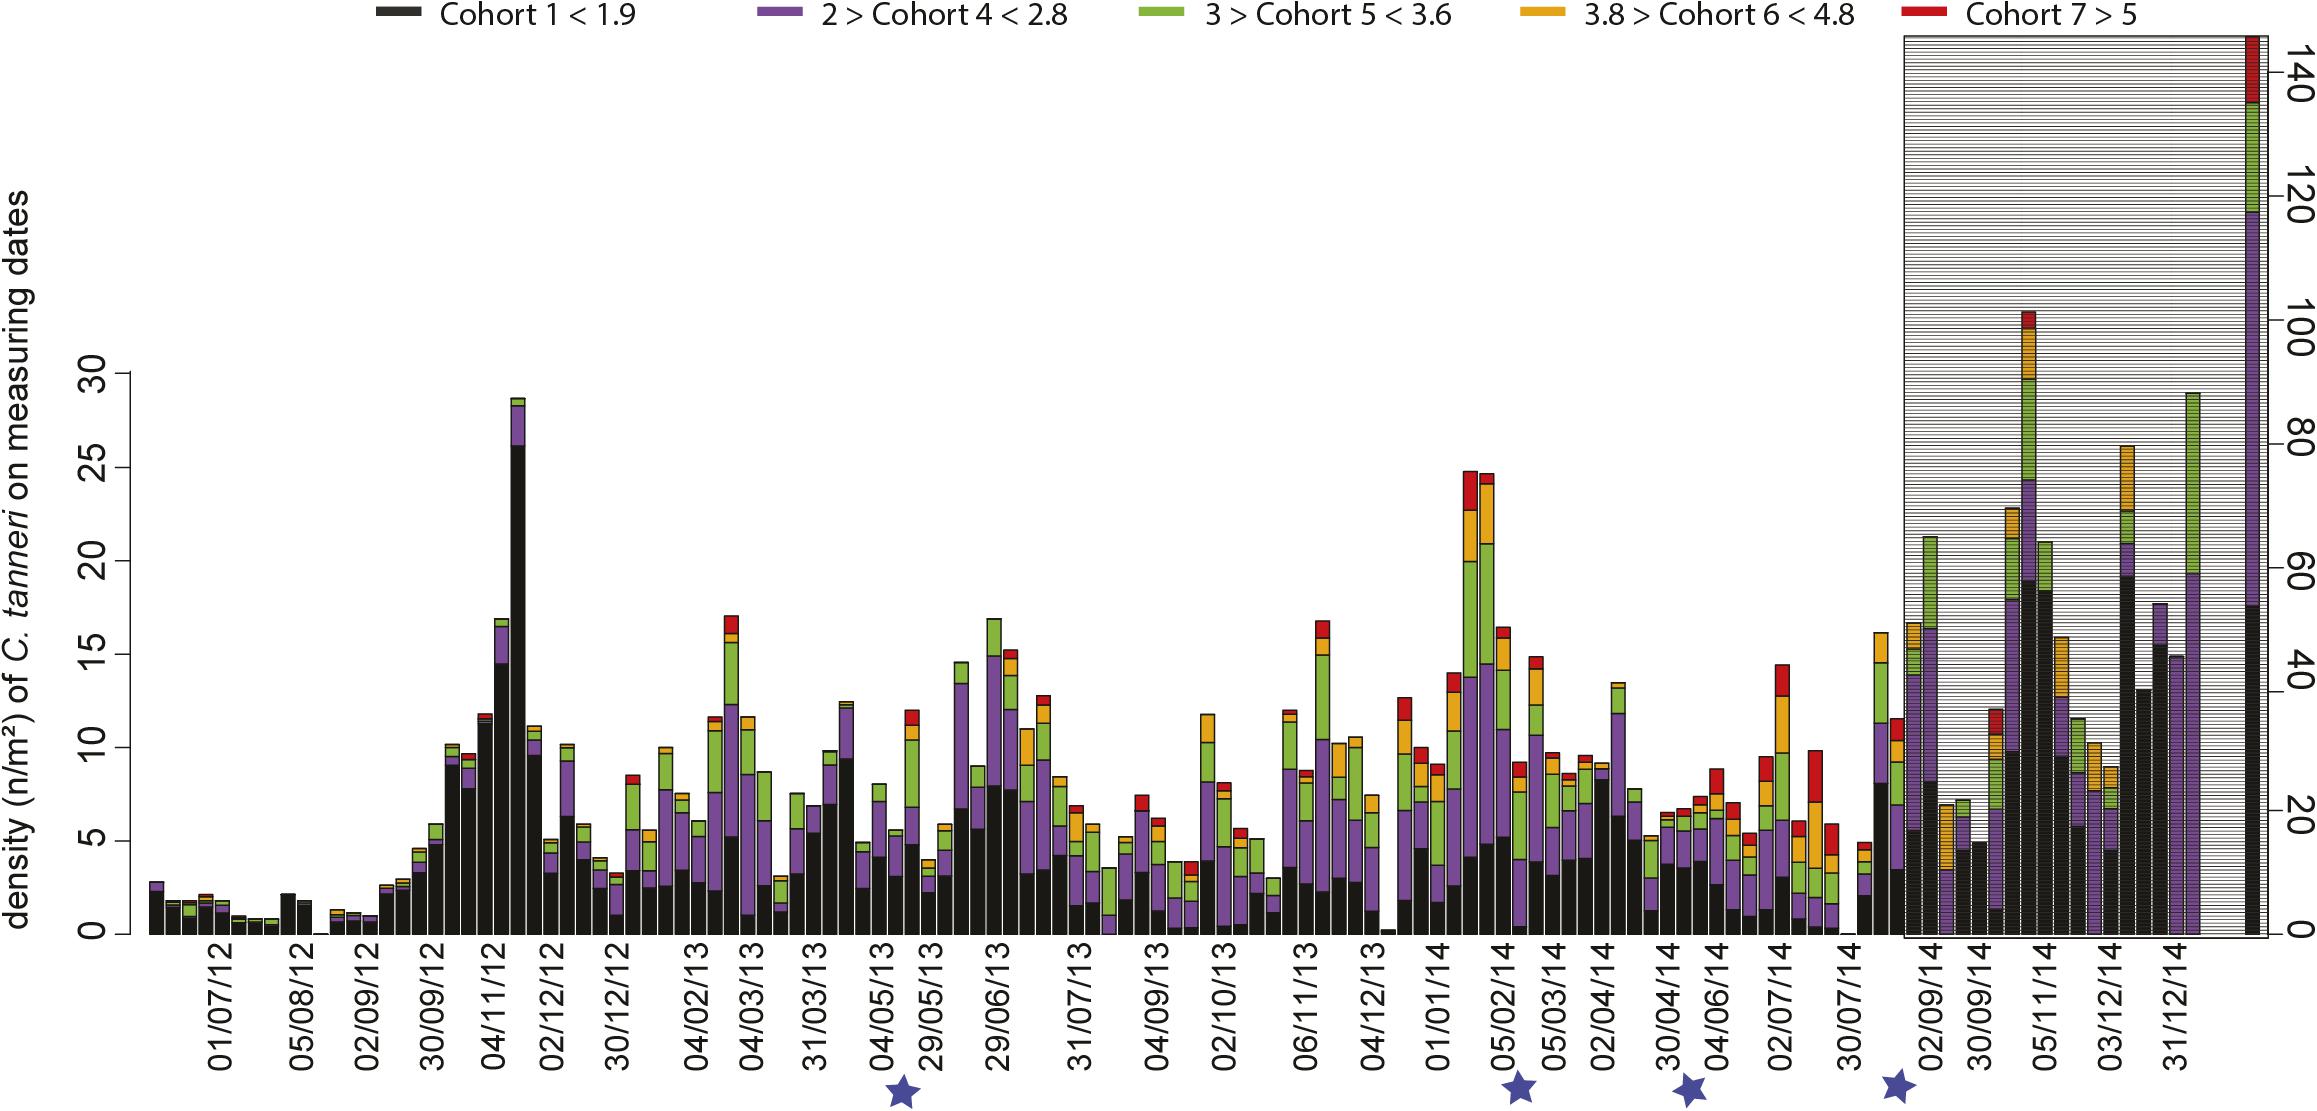
Figure 7. Time-series of the density of each cohort of C. tanneri measured on each observation date. Measurements were made from 16 June 2012 to 11 January 2015 at 985 m depth at the axis site in Barkley Canyon (British Columbia, Canada). Colors represent the proportion of each cohort. Blue stars indicate dates when camera parameters were changed. In gray, the time period for which the proportion of crabs that could be accurately measured was low compared to the total number of crabs in the images (small surface area available for accurate measurements). Please note that for the last date (11 January 2015) an expanded scale was used to accommodate the larger densities encountered.
Auto-correlation functions revealed significant correlations for each cohort for all consecutive weeks (significant correlations for lags from 1 to 2 weeks). Cohort 1 was also significantly auto-correlated with a lag of ∼5 months, and cohort 4 with a lag of 1.5 months. Large juveniles and sub adults from cohorts 4, 5, 6 and 7 were all cross-correlated with no lag (Table 5). Negative lags of 2.5 to 7 months between consecutive cohorts might indicate that an increase of the smallest cohort could induce an increase in the following biggest cohort with a lag of several months. For example, an increase in the smallest juveniles could lead to an increase of cohort 4 and 5 with a lag of 2.5 months (Table 5). Positive lags were significant but these correlations are more likely a consequence of covariance related to the annual cycle detected within each cohort.
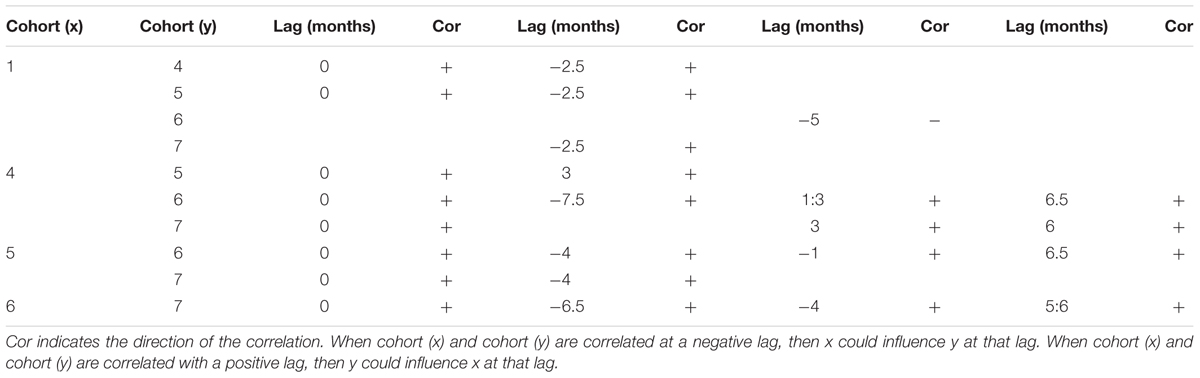
Table 5. Results of the cross correlation function analysis performed between cohorts of juveniles of C. tanneri sampled with a stationary camera from June 2012 to 11 January 2015 at 985 m depth along the axis of Barkley Canyon (BC, Canada).
The absence of correlations between cohort 1 and the largest cohorts is also supported by PCoA (Figure 8), which explained 83% of the variance. Cohort 1 was negatively correlated, and cohorts 4, 5, 6, and 7 were positively correlated with the first axis, which showed a gradient of observations from 2012 to 2014–2015 (from left to right). Cohort 4 was positively correlated and cohorts 6 and 7 were negatively correlated with the second axis. This analysis confirmed the association of Cohort 1 with 2012, cohorts 4 and 5 with 2013 and cohorts 6 and 7 with 2014.
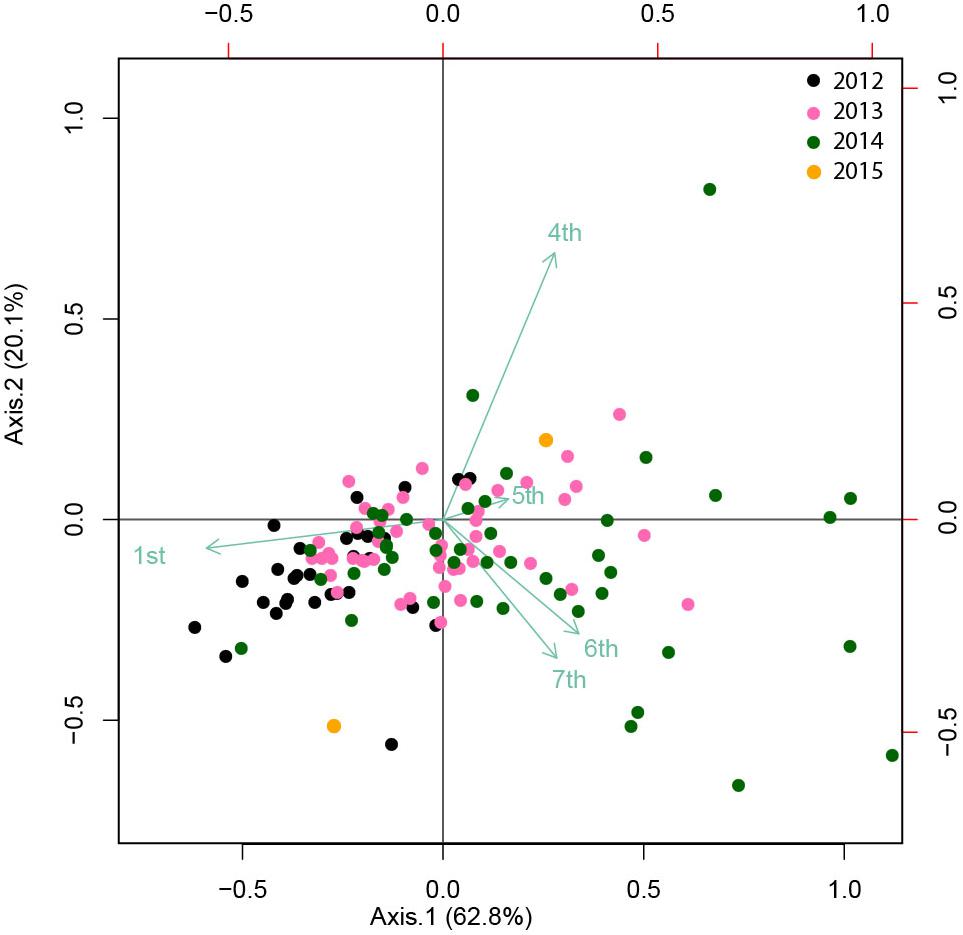
Figure 8. A PCoA (Principal coordinate analysis) biplot showing the ordination of the transformed distance matrix generated from Hellinger-transformed C. tanneri densities measured from 16 June 2012 to 06 August 2014 at 985 m depth at the axis of Barkley Canyon (British Columbia, Canada). Cohorts were considered as variables for each sample or observation date. The first and second axis explained 63 and 20% of the variance, respectively.
Increases in density of cohorts 1 and 6 after 3.5 months, and of cohorts 4, 5, and 7 after 6 months were correlated with an associated increase in chlorophyll concentration (Table 6). Similarly, the densities of the three first cohorts were positively correlated with increases in wave height and wind speed. The other tested environmental parameters (in situ) were also significantly correlated but with a very low coefficient and are thus not shown (ccf <0.25).
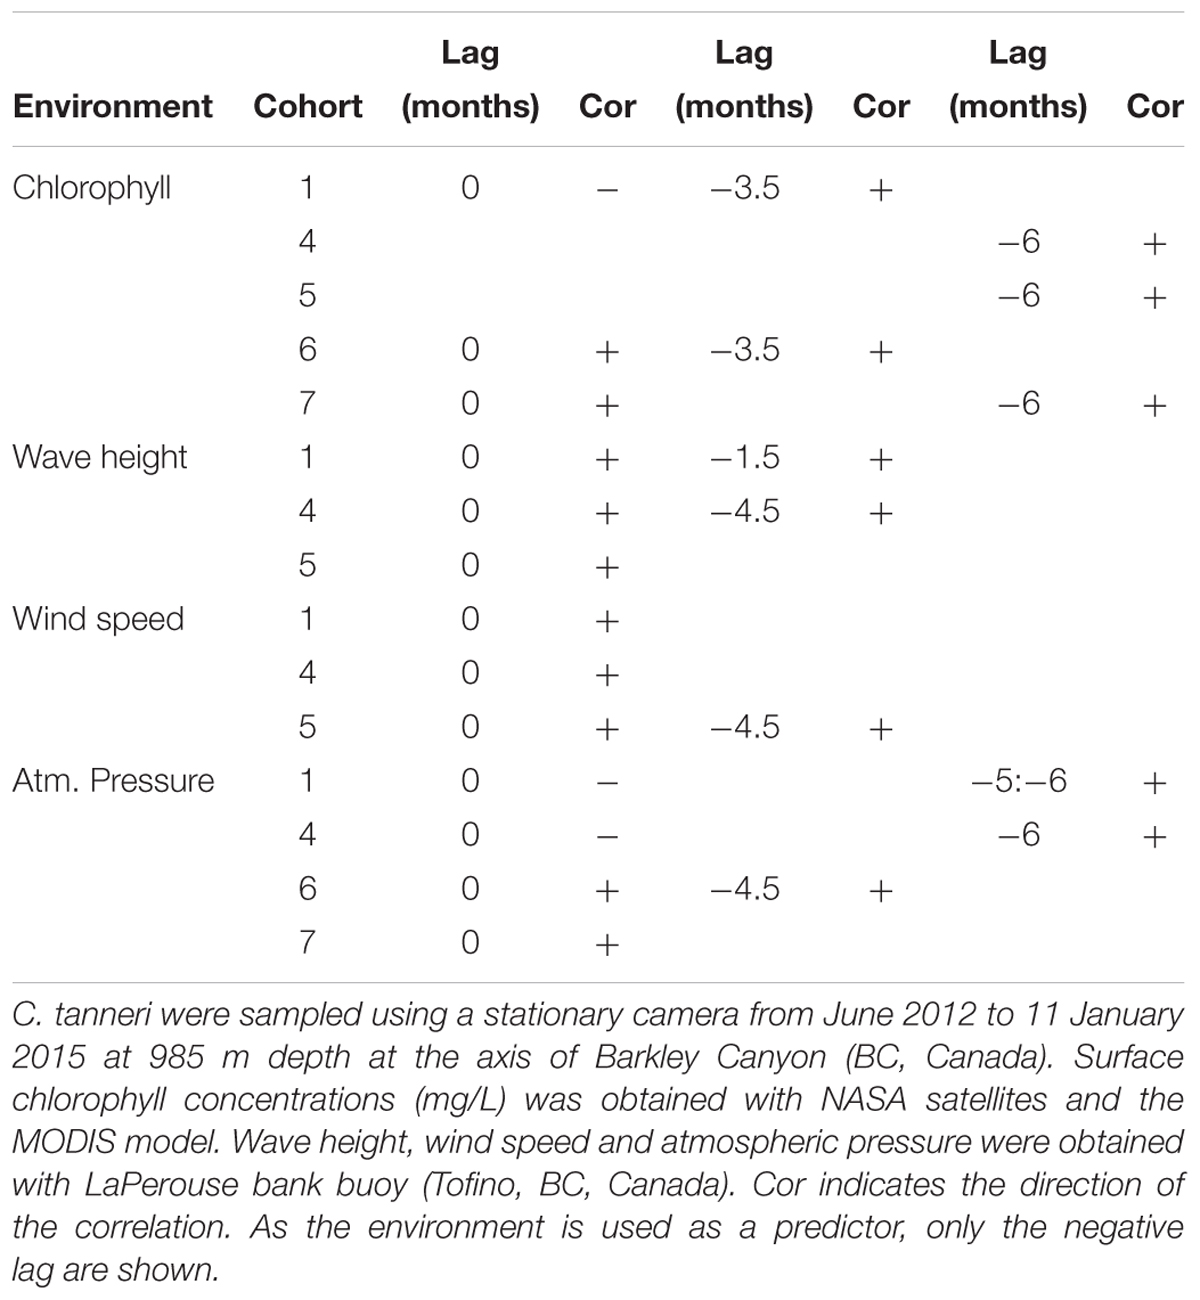
Table 6. Results of the cross correlation function analysis performed between cohorts of juveniles of C. tanneri and environmental parameters.
Discussion
In this study, populations of juvenile C. tanneri from 900 to 1000 m depth in Barkley Canyon, British Columbia, were studied at daily to weekly scales over two years using imagery data. To our knowledge, this paper presents the first study of the population dynamics of any deep-sea species making use of the high temporal resolution imagery provided by cabled deep-sea observatories such as Ocean Networks Canada. Until now, population dynamics of deep-sea species were inferred from samples collected using trawling (Laurenson et al., 2001; Francis and Clark, 2005; Devine et al., 2006; ICES, 2013; Martinelli et al., 2013) or, rarely, using a towed camera (Tuck et al., 1997; Campbell et al., 2009). Trawling provides limited sampling rate and is destructive for seafloor biota and the environment. The imagery provided by observatories is non-destructive and gives a fine temporal resolution over long time periods, and has the potential to open up promising new avenues of research for the study of deep-sea populations.
Crabs observed at 1000 m depth in Barkley Canyon measured from 1.0 to 12.0 cm carapace width (CW), with 95% of them being juveniles (CW: 1.0–4.0 cm). The main difference between the wall (900 m depth) and the axis (1000 m depth) sites was the sporadic presence of adults at the wall site (personal observation), while only juveniles and sub-adults occurred at the deeper axis site. These observations are consistent with the known depth distribution ranges of the life history stages of the species (Pereyra, 1966; Tester, 1975; Jamieson et al., 1990; Boutillier et al., 1998; Workman et al., 2001; Keller et al., 2012).
Seven of the 9 cohorts assigned to juvenile and sub-adult stages described in the literature were observed in this study (Tester, 1975; Gillespie et al., 2004). Most crabs belonged to cohorts 1 to 4 (maximum carapace width ± 2 to 3 cm) suggesting that as juveniles grow they migrate to other, probably shallower, areas they enter the adult population that is commonly found living between 600 and 900 m depth (Workman et al., 2001; Gillespie et al., 2004). Mean carapace width for cohorts 1 to 4 coincided with those estimated from trawl data while mean CW for cohorts 5 to 7 were slightly smaller (Tester, 1975; Gillespie et al., 2004). The smaller carapace width measured for the older cohort could be due to measurement bias, lower growth rates related to sever hypoxic conditions, or it may indicate that the biggest crabs of the cohort are not found in the area. A minimum size threshold or trade-off in energy allocation might prevent the smaller crabs from undertaking migration to shallower areas. The axis of the canyon is located in the core of the Pacific Oxygen Minimum Zone where oxygen levels and temperature are stable with waters characterized as severely hypoxic (μ = 0.3 mL/L) and cold (3.7°C) throughout the year (Chauvet et al., 2018). Juveniles of decapods develop different strategies to overcome hypoxia (Alter et al., 2015). Growth tends to be higher in warmer water for cold-water species of crabs (Siikavuopio and James, 2015). In our study, the larger juveniles probably migrate from the axis site to more oxygenated and warmer habitats that can result in enhanced growth. Conversely, small juveniles might aggregate at depths where the OMZ core is developed, to avoid low oxygen-intolerant predators (Workman et al., 2001) or to be deeper than their predators, for example the thornyhead Sebastolobus alascanus (which is absent in the axis of the canyon, but present at 400 m depth in the near-slope (P. Chauvet, personal observation)). Alternatively, the smallest juveniles may aggregate away from adults, as this species is known for cannibalism (Phillips and Lauzier, 1997). This latter hypothesis is supported by the observation of a small increase in juvenile density at 1000 m depth in April, as adults migrate down to 800 m depth to reproduce (Pereyra, 1966; Jamieson et al., 1990; Workman et al., 2001).
Our observations provide some insights into the patterns in molting and recruitment for C. tanneri inhabiting the study area. However, we could not resolve the first molting steps described in previous studies (Tester and Carey, 1986; Gillespie et al., 2004) because we pooled at least 3 cohorts, as defined in the literature, into a single cohort. Initial recruitment of C. tanneri larvae occurs at various depths (Lough, 1975; Keller et al., 2012), and ontogenetic migration follows to depths deeper than 900 m (Workman et al., 2001; Gillespie et al., 2004). This pattern is consistent with our observations of mass juvenile arrival events at the end of Autumn each year (i.e., November) and confirmed by the high abundance of juveniles at 890 m depth at the gas hydrate site of Barkley Canyon over the winter in 2013 (Doya et al., 2017). Except for 2014, the peak Autumn density corresponded to cohorts 1–3 (<1.9 cm CW) while the major aggregations observed in February consisted mainly of cohort 4 (between 2 and 2.8 cm CW). The duration between these two major aggregating events coincides with the ∼3-month and annual periodicities characterizing the evolution of density at both the wall and axis sites.
Our observations corroborate the known reproductive cycle of C. tanneri. Mature females aggregate at 500–1200 m depth to spawn by the end of winter (Keller et al., 2012). Females then aggregate with males at 600–800 m depth in April to mate (Jamieson et al., 1990; Gillespie et al., 2004). Larval recruitment occurs in June-July at a size of ∼0.4 mm (Tester and Carey, 1986). Trawl hauls conducted from 300 to 1200 m depth in southern Oregon revealed the presence of individuals ∼1 cm carapace width in April, 1.4 cm in August, and 1.9 cm in October-November (Tester and Carey, 1986) as we found in our study. The 2.5-month lag correlation between cohort 1–3 (<1.9 cm) and cohort 4 (2–2.8 cm) could reflect the time lag between two molts, as observed between November 2012 and February 2013. The major aggregations observed in February are likely a result of gathering behavior for molting (e.g., Dew, 2010). Based on our correlation results, an additional 13.5 months were required to grow from cohort 4 to cohort 7 (from 3 cm to >5 cm). With a total of ∼20 months required to develop from the egg to a juvenile of 2.7 cm CW (i.e., cohort 4) (Tester and Carey, 1986), our results indicate that in Barkley Canyon, it takes 2 years and 9 months to grow from an egg to a juvenile of 5 cm CW (the biggest individuals observed in our study). This is 1 or 2 molts away from being an adult which is in agreement with the conclusions of Gillespie et al. (2004) for British Columbia (Canada) crabs. The population of juveniles we observed is thus composed of newly settled recruits and juveniles from the two previous years (Figure 9). The biggest individuals observed at the end of our time-series, i.e., cohorts 6 and 7, might therefore be small individuals from cohort 1 to 3 remaining from the Autumn 2012. This is further supported by evidence of molting, (i.e., empty carapaces observed at different times of the year in June and early August 2013 and in early July, August and all of September 2014; Figure 4).
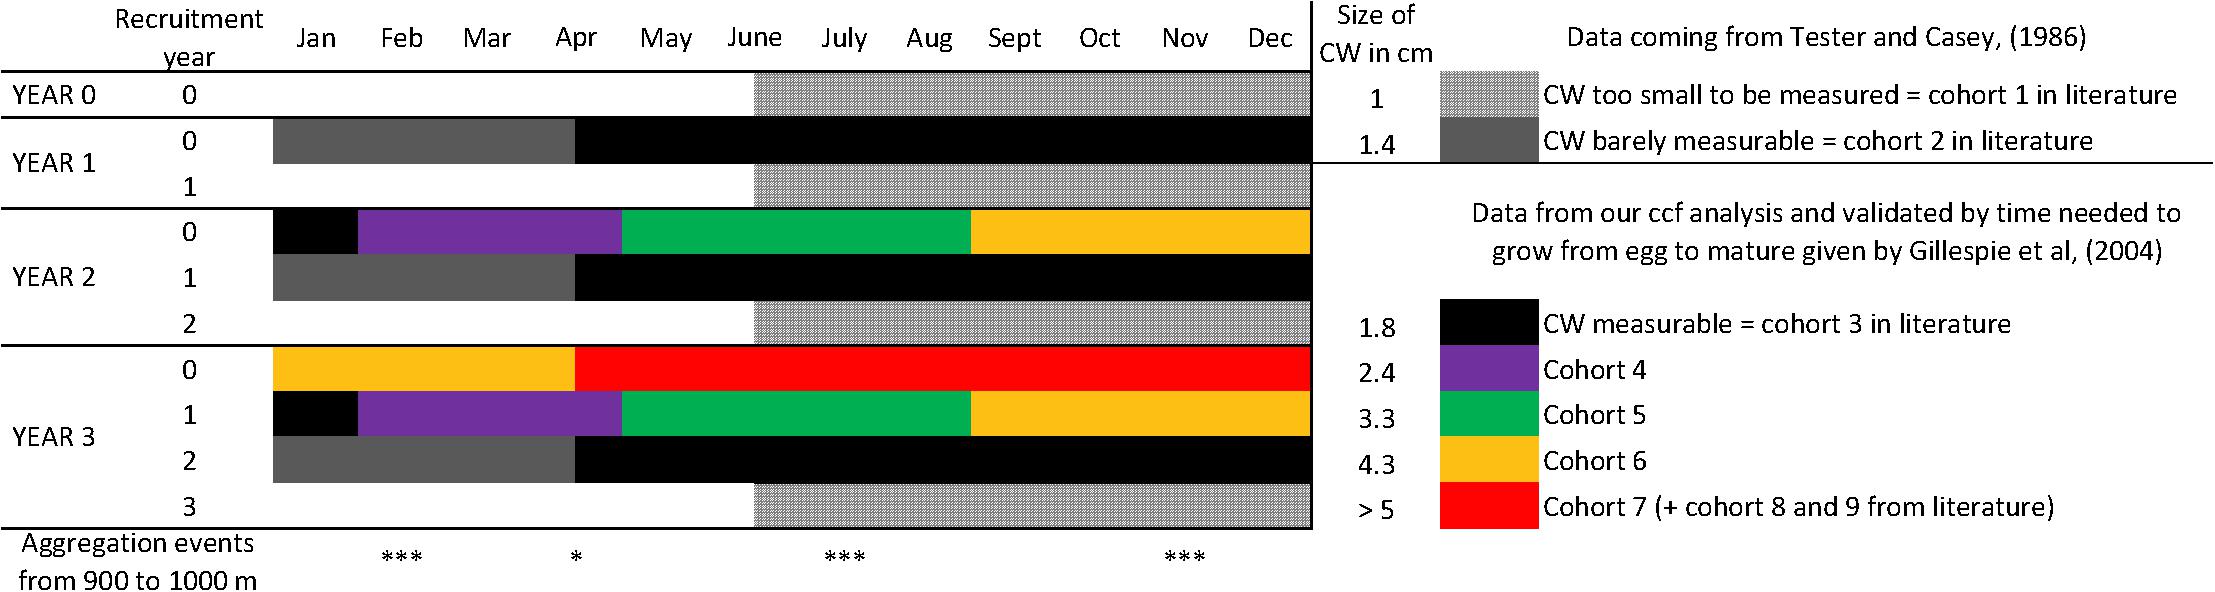
Figure 9. Using data from Tester and Carey (1986); Gillespie et al. (2004); Keller et al. (2012) and this study, we reconstructed the probable development cycle of a cohort of C. tanneri from its recruitment (year 0) to its maturity stage (year 3). Mean carapace width is given for each cohort stage. Each year, the first generation (arrived at year 0) has molted in next cohorts and is mixed with the recruits of the year (e.g., for year 1, recruitment year 1). Year 3 would thus be representative of the observations recorded at 1000 m depth in the Barkley Canyon axis (British Columbia, Canada).
Our study confirms the known annual reproductive cycle of C. tanneri, by analyzing each cohort separately. Annual periodicity will inherently lead to significant correlations among the different cohorts at different time lags. However, the proportions of each cohort varied strongly between aggregation events, within and among years. Associated high intra- and inter- annual variability in the density of crabs can be attributed to the interactions of multiple factors. Indeed, environment, seasonal food arrival (the Autumn density peak at this site is synchronized with the massive arrival of copepods; De Leo et al., 2018), internal rhythms, biotic interactions within and among cohorts (e.g., predation, competition, molting) and interactions with other species (e.g., predation). The influence of surface conditions can partly explain the large fluctuations. For example, the peak density in July 2014 could be a consequence of the surface Spring bloom that would have increased the input of food inside the canyon (Chauvet et al., 2018). The number of individuals in cohorts 6 and 7, along with the population mean carapace width, significantly increased over the entire period of the study. While a decrease in recruitment, as previously observed by Keller et al. (2012), could account for a higher proportion of larger cohorts, an increase in food input from the surface related to unusually high concentrations of surface chlorophyll above Barkley Canyon starting in 2013 (Supplementary Figure 2; Chauvet et al., 2018), could have supported faster growth and/or delayed the migration of the largest juveniles. This latter hypothesis is supported by the significant correlation between surface production and an increase in the density of crabs at different time lags for all cohorts. Positive correlation between weather conditions and surface chlorophyll concentrations supports the hypothesis that, at the juvenile population scale, annual changes in abundance are mainly related to surface production. Keller et al. (2012) found a significant link between the depth distribution of C. tanneri and the Pacific Decadal Oscillation index (an index of climate variability for the California Current System; Schwing et al., 2009), showing that tanner crabs tend to be deeper when waters are more productive.
While our study demonstrates the potential of a deep-sea observatory as a novel method to study population dynamics of certain deep-sea species, using imagery to quantify the structure of benthic communities has certain limitations. The small area of the seafloor (maximum of 9 m2) sampled constrains the spatial scale of the study and caution must be exercised in interpretation and extrapolation of the results to a broader area. Furthermore, the unusually high arrival of crabs in January 2015 compared to other years could be a bias linked to small surface covered. Indeed, it is possible that we captured the main herd in 2015 while we only captured secondary herd the previous years when we also noted smaller increases in density. The camera angle can bias measurements leading to decreased precision in measuring small sized objects. Ideally to avoid distortion, the camera should be downward facing perpendicular to the sediment surface; however, this would unfortunately reduce the sampled surface area further. The change in camera angle over our sampling period was a source of variability, even if, in this study, temporal breaks in the change of community structure did not coincide with the dates of maintenance cruises when the angle was changed (Chauvet et al., 2018). The instrumentation structure itself can attract crabs (Santelli et al., 2013) in the area through a “reef-effect.” However, Vardaro et al. (2007) suggested that studies in the deep-sea using time-lapse cameras are likely not impacted by aggregating behaviors linked to the presence of the instrument. Moreover, the white light used during recordings is known to not influence the behavior of another species of the genus Chionoecetes (Watanabe, 2002). Furthermore, since the first deployment of the camera system was in 2009 or 2010, we would expect that any effect of infrastructure presence would have stabilized by 2012 and that the observed temporal changes in crab population structure corresponded to real biological changes (Matabos et al., 2012). Lastly, depending on the quality and the level of zoom of the camera, taxonomic identification from imagery remains an issue and is complicated when not associated with the collection of “voucher” individuals (e.g., Cuvelier et al., 2012; Henry and Roberts, 2014; Williams et al., 2015). In our case, we did not sample juveniles of C. tanneri and the identification of the smallest crabs was based on the mono-specific presence of individuals with a carapace width >4 cm and the collection of adults in the area. At those depths, the only possible confusion could have been with C. angulatus (Rathbun, 1925; Pereyra, 1966). Several studies strongly suggest that only C. tanneri colonizes this site, and juveniles of C. angulatus are located deeper, between 1069 and 3000 m (Hart, 1982; Jadamec et al., 1999; Workman et al., 2001; Chatzievangelou et al., 2016; Doya et al., 2017; Thomsen et al., 2017; Supplementary Figure 3). Local specialists supported this taxonomic identification.
Accepting the use of imagery has certain limitations, we have demonstrated that this novel approach can enable analysis of deep-sea population dynamics of certain species. We were able to confirm the hypothesis that ontogenic migration occurs in this species and identified individual cohorts with a carapace width measurement accuracy of 0.2 cm. Our results bring further insights into the timing of departure and migration of the biggest juveniles from 1000 m depth and inter-molt periods. Finally, our findings suggest a strong link between surface conditions and the potential impact of surface blooms on the population dynamics and migration patterns of C. tanneri.
Author Contributions
PC, MM, and AM conceived the ideas and contributed to the interpretation of the results. PC collected and analyzed the data. AM and MM supervised the research project. All authors assisted in the writing process and revised the manuscript.
Funding
Funding for the Barkley Canyon instruments and installation was provided by the Canada Foundation for Innovation and the British Columbia Knowledge Development Fund. This research was supported by the “Laboratoire d’Excellence” LabexMER (ANR-10-LABX-19) and co-funded by a grant from the IFREMER and the region of Brittany.
Conflict of Interest Statement
The authors declare that the research was conducted in the absence of any commercial or financial relationships that could be construed as a potential conflict of interest.
Acknowledgments
We are grateful to all PIs of ONC for accessing their temporal data. We especially thanks Dr. F. De Leo and S. Mihaly for their help during the 2016 cruises. We are also very thankful to Dr. Greg Workman, Dr. Aimee Keller, and the survey team who helped to identify taxa. Karen Douglas provided the bathymetry data used by Dr. Ronan Autret to build the map of Barkley Canyon.
Supplementary Material
The Supplementary Material for this article can be found online at: https://www.frontiersin.org/articles/10.3389/fmars.2019.00050/full#supplementary-material
Footnotes
References
Abelló, P., Villanueva, R., and Gili, J. M. (1990). Epibiosis in deep-sea crab populations as indicator of biological and behavioural characteristics of the host. J. Mar. Biol. Assoc. U.K. 70:687. doi: 10.1017/S0025315400058975
Aguzzi, J., Company, J. B., Costa, C., Matabos, M., Azzurro, E., Manuel, A., et al. (2012). Challenges to the assessment of benthic populations and biodiversity as a result of rhythmic behaviour: video solutions from cabled observatories. Oceanogr. Mar. Biol. Annu. Rev. 50:235. doi: 10.1201/b12157-6
Alter, K., Paschke, K., Gebauer, P., Cumillaf, J.-P., and Pörtner, H.-O. (2015). Differential physiological responses to oxygen availability in early life stages of decapods developing in distinct environments. Mar. Biol. 162, 1111–1124. doi: 10.1007/s00227-015-2654-4
Biscoito, M., Freitas, M., Pajuelo, J. G., Triay-Portella, R., Santana, J. I., Costa, A. L., et al. (2015). Sex-structure, depth distribution, intermoult period and reproductive pattern of the deep-sea red crab Chaceon affinis (Brachyura, Geryonidae) in two populations in the north-eastern Atlantic. Deep Sea Res. Part I Oceanogr. Res. Pap. 95, 99–114. doi: 10.1016/j.dsr.2014.10.010
Boutillier, J. A., and Gillespie, G. E. (2005). “A phased approach to fishery development in the deep-sea - a case study for the grooved tanner crab (Chionoecetes tanneri),” in Proceedings of the Part 1: Conference reports on FAO Fisheries, Queenstown.
Boutillier, J. A., Lauzier, R. B., Philips, A. C., and Barton, L. (1998). Framework for a Tanner crab (Chionoecetes tanneri and C. angulatus) fishery in waters off the West Coast of Canada. Can. Stock Assess. Secretariat Res. Doc. 98:29.
British Columbia Marine Conservation Analysis Project Team (2010). Marine Atlas of Pacific Canada: A Product of the British Columbia Marine Conservation Analysis. Commercial Fisheries – Dungeness Crab 2000-2004. Available at: www.bcmca.ca
Butler, T. H., and Hart, J. F. L. (1962). The occurrence of the King Crab, Paralithodes camtschatica (Tilesius), and of Lithodes aequispina Benedict in British Columbia. J. Fish. Res. Board Can. 19, 401–408. doi: 10.1139/f62-023
Campbell, N., Dobby, H., and Bailey, N. (2009). Investigating and mitigating uncertainties in the assessment of Scottish Nephrops norvegicus populations using simulated underwater television data. ICES J. Mar. Sci. 66, 646–655. doi: 10.1093/icesjms/fsp046
Chakraborty, R. D., Purushothaman, P., Maheswarudu, G., Kuberan, G., Sreesanth, L., and Ragesh, N. (2018). Populations dynamics of Aristeus alcocki Ramadan, 1938 (Decapoda: Penaeoidea: Aristeidae) from southwestern India. Reg. Stud. Mar. Sci. 20, 64–71. doi: 10.1016/j.rsma.2018.04.003
Chatzievangelou, D., Thomsen, L., Purser, A., Doya, C., Aguzzi, J., Schwendner, J., et al. (2016). “5 year-long monitoring of barkley canyon cold-seeps with the internet operated deep-sea crawler “Wally.”,” in Proceedings of the 7th International Workshop on Marine Technology, (Barcelona: Instituto de Ciencias del Mar (ICM-CSIC)).
Chausson, F., Bridges, C. R., Sarradin, P.-M., Green, B. N., Riso, R., Caprais, J.-C., et al. (2001). Structural and functional properties of hemocyanin from Cyanagraea praedator, a deep-sea hydrothermal vent Crab. Proteins Struct. Funct. Genet. 45, 351–359. doi: 10.1002/prot.10014
Chauvet, P., Metaxas, A., Hay, A. E., and Matabos, M. (2018). Annual and seasonal dynamics of deep-sea megafaunal epibenthic communities in Barkley Canyon (British Columbia, Canada): a response to climatology, surface productivity and benthic boundary layer variation. Prog. Oceanogr. 169, 89–105. doi: 10.1016/j.pocean.2018.04.002
Clark, M. R., Althaus, F., Schlacher, T. A., Williams, A., Bowden, D. A., and Rowden, A. A. (2016). The impacts of deep-sea fisheries on benthic communities: a review. ICES J. Mar. Sci. 73, 51–69. doi: 10.1093/icesjms/fsv123
Cusba, J., and Paramo, J. (2017). Morphometric relationships and size at sexual maturity of the deep-sea Caribbean lobster Metanephrops binghami (Decapoda: Nephropidae) of commercial importance in the Colombian Caribbean. Univers. Sci. 22, 145–160. doi: 10.11144/Javeriana.SC22-2.mras
Cuvelier, D., de Busserolles, F., Lavaud, R., Floc’h, E., Fabri, M.-C., Sarradin, P.-M., et al. (2012). Biological data extraction from imagery – How far can we go? A case study from the Mid-Atlantic Ridge. Mar. Environ. Res. 82, 15–27. doi: 10.1016/j.marenvres.2012.09.001
Dawe, E. G., and Colbourne, E. B. (2002). “Distribution and demography of snow crab (Chionoecetes opilio) males on the newfoundland and labrador shelf,” in Crabs in Cold Water Regions: Biology, Management, and Economics, (Fairbanks, AK: University of Alaska Fairbanks), 577–594. doi: 10.4027/ccwrbme.2002.42
De Leo, F. C., Gauthier, M., Nephin, J., Mihály, S., and Juniper, S. K. (2017). Bottom trawling and oxygen minimum zone influences on continental slope benthic community structure off Vancouver Island (NE Pacific). Deep Sea Res. Part II Top. Stud. Oceanogr. 137, 404–419. doi: 10.1016/j.dsr2.2016.11.014
De Leo, F. C., Ogata, B., Sastri, A. R., Heesemann, M., Mihály, S., Galbraith, M., et al. (2018). High-frequency observations from a deep-sea cabled observatory reveal seasonal overwintering of Neocalanus spp. in Barkley Canyon, NE Pacific: insights into particulate organic carbon flux. Prog. Oceanogr. 169, 120–137. doi: 10.1016/j.pocean.2018.06.001
De’ath, G. (1999). Extended dissimilarity: a method of robust estimation of ecological distances from high beta diversity data. Plant Ecol. 144, 191–199. doi: 10.1023/A:1009763730207
Defeo, O., Little, V., and Barea, L. (1991). Stock assessment of the deep-sea red crab Chaceon notialis in the argentinian-uruguayan common fishing zone. Fish. Res. 11, 25–39. doi: 10.1016/0165-7836(91)90031-A
Devine, J. A., Baker, K. D., and Haedrich, R. L. (2006). Deep-sea fishes qualify as endangered: fisheries. Nature 439:29. doi: 10.1038/439029a
Dew, C. B. (2010). “Podding behavior of adult king crab and its effect on abundance-estimate precision,” in Biology and Management of Exploited Crab Populations under Climate Change [Internet], eds G. H. Kruse, G. L. Eckert, R. J. Foy, R. N. Lipcius, B. Sainte-Marie, D. L. Stram, et al. (Fairbanks, AK: Alaska Sea Grant, University of Alaska Fairbanks), 129–251. Available at: http://www.alaskaseagrant.org/bookstore/pubs/AK-SG-10-01.html
Domke, L., Lacharité, M., Metaxas, A., and Matabos, M. (2017). Influence of an oxygen minimum zone and macroalgal enrichment on benthic megafaunal community composition in a NE Pacific submarine canyon. Mar. Ecol. 38:e12481. doi: 10.1111/maec.12481
Doya, C., Aguzzi, J., Pardo, M., Matabos, M., Costa, C., Mihály, S., et al. (2014). Diel behavioral rhythms in sablefish (Anoplopoma fimbria) and other benthic species, as recorded by the Deep-sea cabled observatories in Barkley canyon (NEPTUNE-Canada). J. Mar. Syst. 130, 69–78. doi: 10.1016/j.jmarsys.2013.04.003
Doya, C., Chatzievangelou, D., Bahamon, N., Purser, A., De Leo, F. C., Juniper, S. K., et al. (2017). Seasonal monitoring of deep-sea megabenthos in Barkley Canyon cold seep by internet operated vehicle (IOV). PLoS One 12:e0176917. doi: 10.1371/journal.pone.0176917
Dvoretsky, A. G., and Dvoretsky, V. G. (2016). Inter-annual dynamics of the Barents Sea red king crab (Paralithodes camtschaticus) stock indices in relation to environmental factors. Polar Sci. 10, 541–552. doi: 10.1016/j.polar.2016.08.002
Edney, E. B. (1961). The water and heat relationships of fiddler crabs (Uca Spp.). Trans. R. Soc. South Afr. 36, 71–91. doi: 10.1080/00359196109519035
Ferreira, T., and Rasband, W. (2012). Image J User Guide. Available at: imagej.nih.gov/ij/docs/guide/user-guide.pdf
Francis, C. R., and Clark, M. R. (2005). Sustainability issues for orange roughy fisheries. Bull. Mar. Sci. 76, 337–352.
Gillespie, G. E., Fong, K. H., Phillips, A. C., Meyer, G. R., and Boutillier, J. A. (2004). Development of a New Fishery for Tanner Crabs (Chionoecetes tanneri Rathbun, 1893) off British Columbia: 2003 Status Report. Nanaimo: Fisheries and Oceans Canada.
Goffredi, S. K., Gregory, A., Jones, W. J., Morella, N. M., and Sakamoto, R. I. (2014). Ontogenetic variation in epibiont community structure in the deep-sea yeti crab, Kiwa puravida?: convergence among crustaceans. Mol. Ecol. 23, 1457–1472. doi: 10.1111/mec.12439
Gross, W. J. (1961). Osmotic tolerance and regulation in crabs from a hypersaline lagoon. Biol. Bull. 121, 290–301. doi: 10.2307/1539433
Hart, J. F. L. (1982). Crabs and their relatives of British Columbia. Br. Columbia Prov. Mus. Handb. 40, 1–267.
Henry, L.-A., and Roberts, J. M. (2014). Recommendations for best practice in deep-sea habitat classification: bullimore et al. as a case study. ICES J. Mar. Sci. 71, 895–898. doi: 10.1093/icesjms/fst175
Hui, M., Song, C., Liu, Y., Li, C., and Cui, Z. (2017). Exploring the molecular basis of adaptive evolution in hydrothermal vent crab Austinograea alayseae by transcriptome analysis. PLoS One 12:e0178417. doi: 10.1371/journal.pone.0178417
ICES (2010). Report of the Working Group on the Biology and Life History of Crabs (WGCRAB) (2010). Galway: ICES.
Jadamec, L. S., Donaldson, W. E., and Cullenberg, P. (1999). Biological Field Techniques for Chionoecetes Crabs. Fairbanks, AK: University of Alaska Sea Grant College Program. doi: 10.4027/bftcc.1999
Jamieson, G., Heritage, G., and Noakes, N. (1990). “Life history characteristics of Chionoecetes tanneri off British Columbia,” in Proceedings of the International Symposium on King and Tanner Crabs (Fairbanks, AK: University of Alaska Fairbanks), 153–162.
Johnston, D., Harris, D., Caputi, N., and Thomson, A. (2011). Decline of a blue swimmer crab (Portunus pelagicus) fishery in Western Australia—History, contributing factors and future management strategy. Fish. Res. 109, 119–130. doi: 10.1016/j.fishres.2011.01.027
Jollivet, D., Empis, A., Hourdez, S., Comtet, T., Jouin-Toulmond, C., Desbruyeres, D., et al. (2000). Reproductive biology, sexual dimorphism, and population structure of the deep-sea hydrothermal vent scale-worm, Branchipolynoe seepensis (Polychaeta: Polynoidae). J. Mar. Biol. Assoc. U. K. 80, 55–68. doi: 10.1017/S0025315499001563
Juniper, S. K., Matabos, M., Mihály, S., Ajayamohan, R. S., Gervais, F., and Bui, A. O. V. (2013). A year in Barkley Canyon: a time-series observatory study of mid-slope benthos and habitat dynamics using the NEPTUNE Canada network. Deep Sea Res. Part II Top. Stud. Oceanogr. 92, 114–123. doi: 10.1016/j.dsr2.2013.03.038
Keller, A. A., Buchanan, J. C., Steiner, E., Draper, D., Chappell, A., Frey, P., et al. (2016). Size at maturity for grooved Tanner crab (Chionoecetes tanneri) along the U.S. west coast (Washington to California). Fish. Oceanogr. 25, 292–305. doi: 10.1111/fog.12155
Keller, A. A., Harms, J. H., and Buchanan, J. C. (2012). Distribution, biomass and size of grooved Tanner crabs (Chionoecetes tanneri) from annual bottom trawl surveys (2003–2010) along the U.S. west coast (Washington to California). Deep Sea Res. Part I Oceanogr. Res. Pap. 67, 44–54. doi: 10.1016/j.dsr.2012.05.002
Laurenson, C., Priede, I. G., Bullough, L. W., and Napier, I. R. (2001). Where are the mature anglerfish? The population biology of Lophius piscatorius in northern European waters. Paper Presented at ICES Council Meeting, Barcelona.
Legendre, P., and Gallagher, E. (2001). Ecologically meaningful transformations for ordination of species data. Oecologia 129, 271–280. doi: 10.1007/s004420100716
Legendre, P., and Legendre, L. (2012). Numerical Ecology. 3rd English Edition. New York, NY: Elsevier.
Lelièvre, Y., Legendre, P., Matabos, M., Mihaly, S., Lee, R. W., Sarradin, P.-M., et al. (2017). Astronomical and atmospheric impacts on deep-sea hydrothermal vent invertebrates. Proc. R. Soc. B Biol. Sci. 284:20162123. doi: 10.1098/rspb.2016.2123
Levin, L. A. (2003). Oxygen minimum zone benthos: adaptation and community response to hypoxia. Oceanogr. Mar. Biol. Annu. Rev. 41, 1–45.
López Abellán, L. J., Balguerìas, E., and Fernández-Vergaz, V. (2002). Life history characteristics of the deep-sea crab Chaceon affinis population off Tenerife (Canary Islands). Fish. Res. 58, 231–239. doi: 10.1016/S0165-7836(01)00384-8
Lough, R. G. (1975). Dynamics of Crab Larvae (Anomura, Brachyura) off the Central Oregon Coast, 1969-1971. Doctoral thesis, Oregon State University, Corvallis, OR.
Macdonald, P. D. M., and Du, J. (2012). Mixdist: Finite Mixture Distribution Models. Available at: http://CRAN.R-project.org/package=mixdist
Macdonald, P. D. M., and Pitcher, T. J. (1979). Age-groups from size-frequency data: a versatile and efficient method of analyzing distribution mixtures. J. Fish. Res. Board Can. 36, 987–1001. doi: 10.1139/f79-137
Martín, J., Puig, P., Masqué, P., Palanques, A., and Sánchez-Gómez, A. (2014). Impact of bottom trawling on deep-sea sediment properties along the flanks of a submarine canyon. PLoS One 9:e104536. doi: 10.1371/journal.pone.0104536
Martinelli, M., Morello, E., Isajlovic, I., Belardinelli, A., Lucchetti, A., Santojanni, A., et al. (2013). Towed underwater television towards the quantification of Norway lobster, squat lobsters and sea pens in the Adriatic Sea. Acta Adriat. 54, 3–12.
Martí-Trujillo, J. A., Santana-Ortega, A. T., Santana-Artiles, G., Hernández-García, V., Pérez-González, Y., and Castro, J. J. (2014). Notes on the biology of the deep-sea crab Paramola cuvieri (Risso, 1816) (Decapoda, Homolidae) in the Canary Islands (central-east Atlantic). Crustaceana 87, 1–18. doi: 10.1163/15685403-00003271
Masello, A., and Defeo, O. (2016). The deep-sea red crab Chaceon notialis (Geryonidae) in the southwestern Atlantic Ocean: spatial patterns and long-term effects of fishing. Fish. Res. 183, 254–262. doi: 10.1016/j.fishres.2016.06.016
Matabos, M., Tunnicliffe, V., Juniper, S. K., and Dean, C. (2012). A year in hypoxia: epibenthic community responses to severe oxygen deficit at a subsea observatory in a coastal inlet. PLoS One 7:e45626. doi: 10.1371/journal.pone.0045626
Mullowney, D. R. J., Dawe, E. G., Colbourne, E. B., and Rose, G. A. (2014). A review of factors contributing to the decline of Newfoundland and labrador snow crab (Chionoecetes opilio). Rev. Fish Biol. Fish. 24, 639–657. doi: 10.1007/s11160-014-9349-7
Ng, P. K., Guinot, D., and Davie, P. J. (2008). Systema brachyurorum: part I. An annotated checklist of extant brachyuran crabs of the world. Raffles Bull. Zool. 17, 1–286.
Orensanz, J. M., Armstrong, J., Armstrong, D., and Hilborn, R. (1998). Crustacean resources are vulnerable to serial depletion – the multifaceted decline of crab and shrimp fisheries in the greater Gulf of Alaska. Rev. Fish Biol. Fish. 8, 117–176. doi: 10.1023/A:1008891412756
Pereyra, W. T. (1966). The bathymetric and seasonal distribution, and reproduction of adult tanner crabs, Chionoecetes tanneri Rathbun [brachyura: majidae], off the northern Oregon coast. Deep Sea Res. Oceanogr. Abstr. 13, 1185–1205. doi: 10.1016/0011-7471(66)90709-1
Perez, J. A. A., Pezzuto, P. R., Wahrlich, R., and de Souza Soares, A. L. (2009). Deep water fisheries in Brazil: history, status and perspectives. Latin Am. J. Aquat. Res. 37, 513–542. doi: 10.3856/vol37-issue3-fulltext-18
Perez, J. A. A., Wahrlich, R., Pezzuto, P., Schwingel, P., Lopes, F., and Rodrigues-Ribeiro, M. (2003). Deep-sea fishery off Southern Brail: recent trends of the Brazilian fishing industry. J. Northwest Atlant. Fish. Sci. 31:1.
Perry, R. I., Purdon, R., Gillespie, G., and Blewett, E. (2005). “Canada’s staged approach to new and developing fisheries: concept and practice,” in Proceedings of the Fisheries Assessment and Management in Data-Limited Situations Alaska Sea Grant (Fairbanks, AK: University of Alaska), 553–569. doi: 10.4027/famdis.2005.30
Pezzuto, P, R., Pérez, J. A. A., Warhlich, R., Sant’Ana, R., Vale, W. G., and Santos, R. C. (2006). Avaliação de estoque e biología populacional dos caranguejos-de-profundidade (Chaceon notialis e Chaceon ramosae) nas regiões Sudeste e Sul do Brasil. Relatório Técnico apresentado á 4a Sessão Ordinaria do Subcomité Científico do Comité Consultivo Permanente de Getão dos Recursos Demersais de Profundidade (CPG/Demersais)/SEAP/PR-Itajaí.
Phillips, A. C., and Lauzier, R. B. (1997). Biological background for the development of a new fishery for the grooved Tanner crab (Chionoecetes tannen) of British Columbia. Can. Stock Assess. Secret. Res. Doc. 9, 1–81.
Puig, P., Canals, M., Company, J. B., Martín, J., Amblas, D., Lastras, G., et al. (2012). Ploughing the deep-sea floor. Nature 489, 286–289. doi: 10.1038/nature11410
RStudio Team (2016). RStudio: Integrated Development Environment for R. Boston, MA: RStudio, Inc. Available at: http://www.rstudio.com
Ramirez-Llodra, E., Tyler, P. A., Baker, M. C., Bergstad, O. A., Clark, M. R., Escobar, E., et al. (2011). Man and the last great wilderness: human impact on the deep-sea. PLoS One 6:e22588. doi: 10.1371/journal.pone.0022588
Rathbun, M. J. (1925). The spider crabs of america. Bull. U.S. Natl. Mus. 129, 1–613. doi: 10.5479/si.03629236.129.i
Rickets, E. F., Calvin, J., and Hedgpeth, W. (1968). Between Pacific Tides, 4th Edn. Standford, CA: Standford University Press.
Santelli, A., Punzo, E., Scarcella, G., Strafella, P., Spagnolo, A., and Fabi, G. (2013). Decapod crustaceans associated with an artificial reef (Adriatic Sea). Mediterr. Mar. Sci. 14:64. doi: 10.12681/mms.682
Schwing, F. B., Peterson, W. T., Cyr, N., and Osgood, K. E. (2009). “Future research requirements for understanding the effects of climate variability on fisheries for their management,” in The Future of Fisheries Science in North America, eds R. J. Beamish and B. J. Rothschild (Dordrecht: Springer),621–636.
Siikavuopio, S. I., and James, P. (2015). Effects of temperature on feed intake, growth and oxygen consumption in adult male king crab Paralithodes camtschaticus held in captivity and fed manufactured diets. Aquac. Res. 46, 602–608. doi: 10.1111/are.12207
Tester, P. A. (1975). Size Classes, Population Structure, Growth, Sex Ratio, and Size and Age at Maturity of Chionoecetes tanneri rathbun (Brachyura: Majidae) off the Oregon Coast. Master thesis, Oregon State University, Corvallis, OR.
Tester, P. A., and Carey, A. (1986). Instar identification and life history aspects of juvenile deepwater spider crabs, Chionoecetes tanneri rathbun. Fish. Bull. 84, 973–980.
Thomsen, L., Aguzzi, J., Costa, C., De Leo, F., Ogston, A., and Purser, A. (2017). The oceanic biological pump: rapid carbon transfer to depth at continental margins during winter. Sci. Rep. 7:10763. doi: 10.1038/s41598-017-11075-6
Tuck, I., Chapman, C. J., and Atkinson, R. J. A. (1997). Population biology of the Norway lobster, Nephrops norvegicus (L.) in the firth of Clyde, Scotland – I: growth and density. ICES J. Mar. Sci. 54, 125–135. doi: 10.1006/jmsc.1996.0179
Van den Beld, I. M. J., Guillaumont, B., Menot, L., Bayle, C., Arnaud-Haond, S., and Bourillet, J.-F. (2016). Marine litter in submarine canyons of the Bay of Biscay. Deep Sea Res. Part II Top. Stud. Oceanogr. 145, 142–152. doi: 10.1016/j.dsr2.2016.04.013
Vardaro, M. F., Parmley, D., and Smith, K. L. (2007). A study of possible “reef effects” caused by a long-term time-lapse camera in the deep North Pacific. Deep Sea Res. Part I Oceanogr. Res. Pap. 54, 1231–1240. doi: 10.1016/j.dsr.2007.05.004
Watanabe, T. (2002). Method to estimate the population density of the snow crab Chionoecetes opilio using a deep-sea video monitoring system on a towed sledge. Japan Agric. Res. Q. 36, 51–57. doi: 10.6090/jarq.36.51
Watsuji, T., Tsubaki, R., Chen, C., Nagai, Y., Nakagawa, S., Yamamoto, M., et al. (2017). Cultivation mutualism between a deep-sea vent galatheid crab and its chemosynthetic epibionts. Deep Sea Res. Part I Oceanogr. Res. Pap. 127, 13–20. doi: 10.1016/j.dsr.2017.04.012
Watsuji, T., Yamamoto, A., Motoki, K., Ueda, K., Hada, E., Takaki, Y., et al. (2015). Molecular evidence of digestion and absorption of epibiotic bacterial community by deep-sea crab Shinkaia crosnieri. ISME J. 9, 821–831. doi: 10.1038/ismej.2014.178
Williams, A., Althaus, F., and Schlacher, T. A. (2015). Towed camera imagery and benthic sled catches provide different views of seamount benthic diversity: gear selectivity for seamount benthos. Limnol. Oceanogr. Methods 13:e10007. doi: 10.1002/lom3.10007
Workman, G. D., Boutillier, J. A., Philips, A. C., Gillespie, G. E., Park, W.-G., Clark, D., et al. (2001). Results From a Bottom Trawl Survey of Grooved Tanner Crab, Chionoecetes tanneri Rathbun, Stocks off the West Coast of Vancouver Island, July 21 – August 3, 1999. Nanaimo: Fisheries and Ocean Canada.
Workman, G. D., Philips, A. C., Scurrah, F. E., and Boutillier, J. A. (2002). “A new fishery for grooved Tanner crab (Chionoecetes tanneri) off the coast of British Columbia, Canada,” in Proceedings of the Crabs in Cold Water Regions: Biology, Management, and Economics Alaska Sea Grant (Fairbanks, AK: University of Alaska Fairbanks), 439–456. doi: 10.4027/ccwrbme.2002.33
Keywords: marine imagery, deep-sea observatory, Ocean Network Canada, oxygen minimum zone, tanner crab, reproduction, temporal trends, British Columbia
Citation: Chauvet P, Metaxas A and Matabos M (2019) Interannual Variation in the Population Dynamics of Juveniles of the Deep-Sea Crab Chionoecetes tanneri. Front. Mar. Sci. 6:50. doi: 10.3389/fmars.2019.00050
Received: 15 June 2018; Accepted: 29 January 2019;
Published: 19 February 2019.
Edited by:
Anthony Grehan, National University of Ireland Galway, IrelandReviewed by:
Lorenzo Angeletti, Istituto di Scienze Marine (ISMAR), ItalyHelena Passeri Lavrado, Universidade Federal do Rio de Janeiro, Brazil
Copyright © 2019 Chauvet, Metaxas and Matabos. This is an open-access article distributed under the terms of the Creative Commons Attribution License (CC BY). The use, distribution or reproduction in other forums is permitted, provided the original author(s) and the copyright owner(s) are credited and that the original publication in this journal is cited, in accordance with accepted academic practice. No use, distribution or reproduction is permitted which does not comply with these terms.
*Correspondence: Pauline Chauvet, cGF1bGluZS5jaGF1dmV0QGlmcmVtZXIuZnI=