Assessing Seasonality and Density From Passive Acoustic Monitoring of Signals Presumed to be From Pygmy and Dwarf Sperm Whales in the Gulf of Mexico
 John A. Hildebrand1*
  Kaitlin E. Frasier1
  Simone Baumann-Pickering1
  Sean M. Wiggins1
  Karlina P. Merkens2
  Lance P. Garrison3 Melissa S. Soldevilla3
  Mark A. McDonald4
- 1Scripps Institution of Oceanography, University of California, San Diego, La Jolla, CA, United States
- 2National Marine Fisheries Service, Pacific Island Fisheries Science Center, Honolulu, HI, United States
- 3National Marine Fisheries Service, Southeast Fisheries Science Center, Miami, FL, United States
- 4WhaleAcoustics, Bellvue, CO, United States
Pygmy sperm whales (Kogia breviceps) and dwarf sperm whales (Kogia sima) are deep diving cetaceans that commonly strand along the coast of the southeast US, but that are difficult to study visually at sea because of their elusive behavior. Conventional visual surveys are thought to significantly underestimate the presence of Kogia and they have proven difficult to approach for tracking and tagging. An approach is presented for density estimation of signals presumed to be from Kogia spp. based on passive acoustic monitoring data collected at sites in the Gulf of Mexico (GOM) from the period following the Deepwater Horizon oil spill (2010-2013). Both species of Kogia are known to inhabit the GOM, although it is not possible to acoustically separate the two based on available knowledge of their echolocation clicks. An increasing interannual density trend is suggested for animals near the primary zone of impact of the oil spill, and to the southeast of the spill. Densities were estimated based on both counting individual echolocation clicks and counting the presence of groups of animals during one-min time windows. Densities derived from acoustic monitoring at three sites are all substantially higher (4–16 animals/1000 km2) than those that have been derived for Kogia from line transect visual surveys in the same region (0.5 animals/1000 km2). The most likely explanation for the observed discrepancy is that the visual surveys are underestimating Kogia spp. density, due to the assumption of perfect detectability on the survey trackline. We present an alternative approach for density estimation, one that derives echolocation and behavioral parameters based on comparison of modeled and observed sound received levels at sites of varying depth.
Introduction
Pygmy sperm whales (Kogia breviceps) and dwarf sperm whales (Kogia sima) are deep diving cetaceans that are widely distributed in tropical and temperate waters worldwide (Jefferson et al., 2015). They are typically encountered along the continental slope and in the abyssal plain (Baird et al., 1996; Baird, 2005). Both species are difficult to observe, being entirely pelagic, with faint blows and showing only a low profile while at the water's surface (Jefferson et al., 2015). They are not easily approached using a small boat and have thus far eluded tagging attempts in the field (Baird, 2015). A recent study using passive acoustic monitoring (Hodge et al., 2018) found that Kogia may be more common than suggested by the visual survey record alone.
The pygmy sperm whale is the larger of the two species with a maximum length of 3.5 m and weighing up to 410 kg, while the dwarf sperm whale has a maximum length of 2.7 m and weight of up to 272 kg (Mcalpine, 2018). They live in groups of less than 10 individuals with varying age and sex composition. Group size and their inshore-offshore presence may vary seasonally as documented in the Bahamas (Dunphy-Daly et al., 2008). They have relatively short lives with a maximum known longevity of 23 years (Willis and Baird, 1998; Jefferson et al., 2015). Their primary prey is cephalopods (particularly Histioteuthidae and Cranchiidae), but stomach contents also have shown consumption of fish and crustaceans (West et al., 2009; Mcalpine, 2014). Based on stomach contents and isotope analysis, the two Kogia species may feed at different depths and on slightly different prey (Barros et al., 1998; Willis and Baird, 1998). Kogia may feed both in the water column and at or near the bottom. Their sightings are most frequently reported in water depths between 400 - 1000 m, although they are also seen in deeper waters (Baumgartner et al., 2001).
Much of what we know about Kogia has been inferred from stranding records (Willis and Baird, 1998; Wursig et al., 2000). Strandings of these two species are relatively common in the southeastern United States. They were reported to be the second most common cetacean (after bottlenose dolphins) to strand from North Carolina to Texas between 1978 and 1987 (Odell, 1991), with a total of 189 animals. In the Gulf of Mexico (GOM) there appears to be no seasonal pattern for strandings (Caldwell et al., 1960; Delgado-Estrella and Vasquez, 1998). The relatively high rate of Kogia spp. strandings suggests they may have a higher population than indicated by the relatively few that are observed during visual surveys (Garrison et al., 2010). A combined (K. breviceps and K. sima) abundance of 186 (CV = 1.04) animals is reported within the entire US Gulf of Mexico (GOM) exclusive economic zone (Waring et al., 2013).
On two occasions, pygmy sperm whales in captivity have been shown to produce high-frequency, narrow-band clicks with peak frequencies around 125–130 kHz (Marten, 2000; Ridgway and Carder, 2001; Madsen et al., 2005). Based on field recordings, dwarf sperm whales are known to produce similarly high-frequency clicks (Merkens et al., 2018). The high-frequency echolocation signals of pygmy and dwarf sperm whales are similar to those of phocoenids, cephalorhynchids and two lagenorhynchid species (Au, 1993; Bassett et al., 2009; Kyhn et al., 2009, 2010); however, none of the latter species are known to occur in the GOM (Wursig et al., 2000).
Passive acoustic monitoring in the northern GOM, conducted in response to the Deepwater Horizon oil spill (Merkens, 2013), yielded ample detections of high frequency echolocation clicks that are most likely produced by one or both of the Kogia species; hereafter the term Kogia is meant to imply “most probably” a Kogia species. Here we report on analysis of these data to provide constraints on acoustic signal production and diving behavior. Building on these we derive population density estimates for Kogia spp. at three sites in the GOM, based on the best available information derived from analogy with beaked whales. The acoustic methods we present here provide a new tool for monitoring Kogia spp. and other cryptic populations, a critical aspect of making management recommendations for their conservation.
Methods
Data Collection
The data presented here were collected from five deepwater locations in the northern and eastern GOM (Figure 1), an area which is an important habitat for a diverse and abundant group of cetaceans (Davis et al., 2002). The circulation of the northeastern GOM is dominated by the Loop Current, an area of warm water that enters the GOM from the Caribbean and exits through the Florida strait. The oceanographic dynamics of the GOM also include a large freshwater inflow from the Mississippi and other rivers, along with their associated nutrients and sediment loads. The input of nutrients from the Mississippi River creates high phytoplankton productivity and subsequently high zooplankton productivity. Ecosystem dynamics for the deepwater GOM are poorly understood, although it is clear that sperm whales, Kogia and other deepwater cetaceans are important upper trophic level predators.
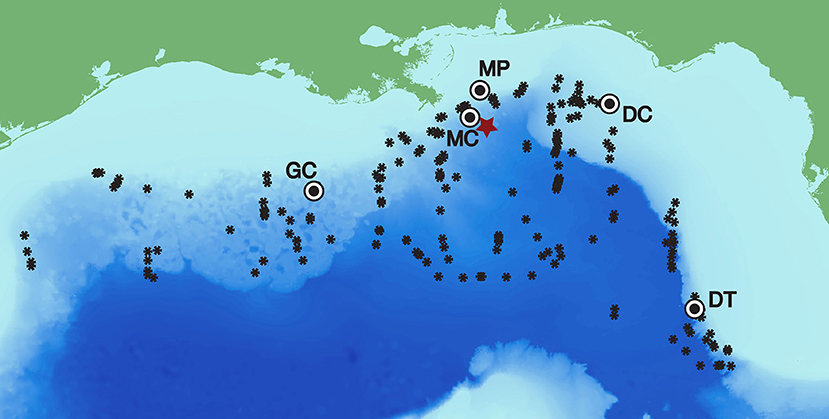
Figure 1. Long-term recording sites in the Gulf of Mexico with Kogia spp. click detections (Mississippi Canyon - MC 28-50.8N 88-27.9W 980 m, Green Canyon - GC 27-33.4N 91-10.0W 1100 m, and Dry Tortugas - DT 25-31.9N 84-38.2W 1,300 m) and those without (Main Pass–MP and DeSoto Canyon–DC). The Deepwater Horizon site is designated with a red star, and Kogia spp. visual sightings are given by black asterisks (following Waring et al., 2013).
Acoustic data were collected in the GOM using multiple deployments of High-frequency Acoustic Recording Packages (HARPs) (Wiggins and Hildebrand, 2007) during and following the 2010 Deepwater Horizon oil spill. HARPs are bottom-mounted acoustic recorders capable of recording continuously at high sample rates (up to 320 kHz) for extended periods. For the GOM deployments, the HARP instrumentation package was located at or near the seafloor with the hydrophone sensor tethered to the instrument and buoyed approximately 10 m above the seafloor. All acoustic data were converted to sound pressure levels based on hydrophone and electronic system calibrations. The hydrophones were composed of two stages, one for low-frequency (<2 kHz) and the other for high-frequency (>2 kHz), although we focus on only the high-frequency band for this paper. The high-frequency stage uses a spherical omni-directional transducer (ITC-1042, www.itc-transducers.com) which has an approximately flat (±2 dB) sensitivity response of about −200 dBrms re 1V/μPa from 1 Hz to 100 kHz. Each individual hydrophone has a frequency dependent sensitivity supplied by the manufacturer. The signals from the hydrophone transducer are fed into a preamplifier with approximately 50 dB of gain and a 10-pole low-pass filter to reduce high-frequency aliasing effects above 100 kHz and digitized with 16-bits of resolution at 200 kHz sample rate. The response of each preamplifier and filter were measured and these were combined with the hydrophone sensitivity to create a system transfer function unique to each instrument deployment. An alternative configuration capable of higher sampling rates used a spherical transducer (HS-150, www.humbertek.co.uk) with peak response of about −198 dBrms re 1 V/μPa at 150 kHz, sampled at 320 kHz, with a low-pass filter above 160 kHz.
Long-term deployment data were recorded continuously at 200 kHz for 2-9-month durations during 2010–2013 for the five sites shown in Figure 1. Three of the sites (Mississippi Canyon - MC, Green Canyon - GC, and Dry Tortugas - DT) were located in deepwater (at 980, 1,100, and 1,300 m respectively) and had detections for Kogia spp., which are known to be present at deepwater locations throughout the northern GOM (Figure 1). Two sites (Main Pass - MP and DeSoto Canyon - DC) located on the continental shelf (at 86, and 268 m respectively) had no detections for Kogia spp, and were not included in subsequent analysis. Details of each HARP deployment are presented in Supplementary Table 1. In addition, a deployment sampling at 320 kHz was conducted at the MC site beginning September 20, 2011 for 41 h duration. The latter obtained recordings at 160 kHz bandwidth, sufficient to fully characterize high-frequency echolocation clicks, for comparison with the lower-bandwidth 100 kHz data collected during the remainder of the deployments.
Signal Description, Detection and Classification
To characterize high-frequency echolocation clicks from the 160 kHz bandwidth data collected in the GOM, signal processing was performed using the MATLAB (Mathworks) based custom software program Triton (Wiggins and Hildebrand, 2007) and other MATLAB custom routines. Long-term spectral averages (LTSAs) were calculated for visual analysis of the recordings, and each instance of energy in the 120–150 kHz band was investigated to find acoustic encounters, periods with continuity of clicking. Individual echolocation signals within these selected encounters were automatically detected using a two-step approach computer algorithm (Roch et al., 2011). The individual click detections were digitally filtered with a 4-pole elliptical band-pass filter with a pass-band between 80 and 140 kHz. Filtering was done on 160 sample points centered on the echolocation signal. Spectra of each detected signal were calculated using Hanning-windowed data centered on the signal. The frequency-related signal parameters peak frequency, center frequency, and −3 dB bandwidth were processed using methods from Au (1993). Click duration was derived from the Teager-Kaiser energy detector output (Roch et al., 2011).
At 100 kHz bandwidth, the HARPs were unable to capture the full frequency range of the Kogia spp. clicks, but the portion of the click energy below 100 kHz was recorded and a small fraction of the energy above 100 kHz was aliased into the pass-band and thus was recorded as well (as described later in this paper). A multi-step process was used to detect individual Kogia sp. echolocation clicks in these data as well as to identify time windows (of one-min duration) that contained at least one click. Acoustic encounters of Kogia sp. were first identified in the 100 kHz acoustic data using a Teager-Kaiser energy click detector (Roch et al., 2011) and an expert system (based on selecting clicks with peak frequency >70 kHz). All presumed Kogia spp. acoustic encounters were reviewed in a second analysis stage with improved click detection, to remove false detections, and apply a consistent detection threshold. Individual echolocation signals were automatically detected, this time using an energy threshold method during time periods of verified Kogia spp. acoustic encounters. Detections were selected for inclusion when the signal in a 70–99 kHz band exceeded a threshold of 116 dBpp re: 1 μPa. The acoustic encounters were then manually reviewed using comparative panels showing long-term spectral average, received level, and ICI of individual clicks over time, as well as spectral and waveform plots of selected individual signals. Within each encounter, false detections were removed by manual editing, for instance, when the detections were identified as being from sonars, sperm whales or delphinids, identified by having inappropriate spectral amplitude, ICI, or waveform. The entire dataset was examined in this way twice, with the second pass serving to remove false clicks during times when both Kogia sp. and another echolocating species were present. The process was terminated after the second iteration at which time all encounters had been manually verified and the false detection rate for both encounters and one-min time-bins was determined to be less than 1%. We further examined 2,000 randomly selected clicks and found an average false positive detection rate for individual clicks of 9.6% (CV = 0.11). The most common false positive signals identified as Kogia spp. clicks were delphinid and sperm whale clicks with energy above 70 kHz.
The next step was to determine the number of detections per unit effort. A one-min time window was selected for analysis since this is less than the duration of most Kogia spp. encounters. We examined both the number of detected clicks in each one-min time-bin, and the number of one-min time-bins with at least one click. We aggregated detection counts and one-min bin counts into weekly periods. A 1-week period was chosen to provide a sufficient number of one-min time-bins (10,080) for density estimation.
Diel Cycle
To test for the presence of a diel echolocation pattern, all Kogia spp. click detections were grouped into encounters when individual clicks were less than 10 min apart, defining a start and end time of encounters. These encounters were then assigned to either photoperiod “day” or “night” by extracting sunset and sunrise information from NASA JPL's Horizons Web Service (Giorgini et al., 1996) through the mediator provided in the Tethys metadata service (Roch et al., 2016). The duration of each encounter was calculated in minutes and all durations were summed over each photoperiod. The sum of encounters was normalized by the duration of each photoperiod. A Kruskal-Wallis test was conducted per recording site to test for differences in echolocation behavior based on photoperiod at each site.
Group Size
Estimates of Kogia spp. group size were derived from acoustic encounters based on overlapping click sequences with consistent ICIs, and compared to visual survey data (Barlow et al., 1997; Baird, 2005; Dunphy-Daly et al., 2008). We selected encounters with high received amplitude (at least one click > 135 dBpp re: 1 μPa), suggesting that the animals were located near to the acoustic sensor. Then we estimated the number of echolocating animals in the group by counting the number of overlaying sequences in the time series, looking for amplitude changes and consistent ICIs (Supplementary Figure 1). The basic assumption of this approach is that all animals in a group vocalize and are detected simultaneously at least at some point, so the number of overlapping sequences are an estimate of group size. In addition, it is assumed that each animal within the group, over a short time period, will produce echolocation clicks at a consistent ICI, and that there is a relative consistency of amplitude from one click to the next, given that several clicks are produced per second and the distance and orientation of the animal will not change substantially from one click to the next. This approach will underestimate the number of animals if the spacing between animals in the group is greater than the detection range for their signals, or if the animals do not have periods of simultaneous echolocation. These acoustic group size estimates were compared to visual estimates of group size derived from repeated sighting surveys in the GOM.
Detection Probability
Knowledge of the detection probability as a function of horizontal range is needed to estimate the area that is being effectively monitored, which in turn enables density to be estimated. We used a Monte Carlo simulation approach to estimate the detection probability (Küsel et al., 2011), both for single echolocation clicks and for groups of echolocating animals as described in Frasier et al. (2016). This approach is based on modeling the echolocation and orientation behavior of the animals (Figure 2). For the models, echolocation is presumed to occur only during a portion of the foraging dive track, during the descent phase and at the dive depth during the foraging phase, based on known behavior of other deep diving cetaceans (Watwood et al., 2006). The descent occurs at a characteristic angle, and at the foraging dive depth the animal may change orientation in elevation angle. Likewise, the animal has a beam pattern that is given by the directivity, side-lobe (90°) source level and back-lobe (180°) level. For a group of animals, larger numbers of animals, and greater differences in their body orientation (elevation and azimuth) increase the detection probability during a given time window. It is assumed that these parameters have a mean and standard deviation that is expressed over many dive cycles. The acoustic receiver was placed at 10 m above the seafloor depth (Wiggins et al., 2012), which varied by ~300 m between the three GOM sites. The modeling accounted for the volume of water above the receiver by considering both the depth of the animal and the depth of the receiver, and thereby allowed normalization of the density estimate to the maximum area sampled by the receiver. The simulations were conducted at 90-96 kHz since these frequencies best represent the bandwidth of the echolocation clicks collected at 200 kHz sample rate.
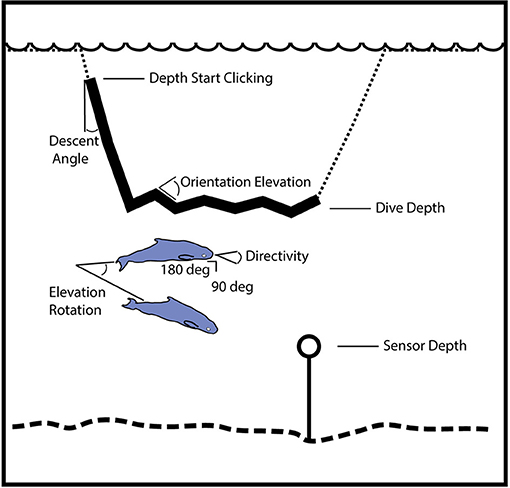
Figure 2. Illustration of geometry for model parameters used to simulate the probability of click and group detection with range. The simulation distributes animal locations and orientations using these parameters, and then tests for echolocation click detection at the sensor. Dive track (dotted line) with portion containing echolocation (solid line) during descent phase and at the dive depth during foraging phase. Beam pattern is given by the directivity, side-lobe (90°) source level and back-lobe (180°) level. For a group of animals, the larger number of animals and differences in their body orientation (elevation and azimuth) increase the detection probability during a fixed time window (one-min). A minimum beam amplitude is designated for the group when the sensor is outside the range of orientations where an on-axis click would be received.
Two simulations were used to predict echolocation click detection probability. The first calculated the detection probability for a single echolocation click as a function of range from the acoustic sensor. Transmission loss (TL) was simulated using the ray tracing algorithm Bellhop (Porter, 2011), with inputs including bathymetry, sediment composition, sound speed profile, and mean surface roughness from the Oceanographic and Atmospheric Master Library (OAML). For each site, propagation modeling was conducted in a two-dimensional plane (range vs. depth) in four directions (0°, 90°, 180°, 270°). The TL for each simulated click was obtained as an interpolation between these profiles and applied to the peak-peak amplitude. The impact of sound absorption (Francois and Garrison, 1982) on click amplitude was investigated using the approach of Von Benda-Beckmann et al. (2018). It was determined that averaging four frequencies between 90 and 96 kHz for propagation modeling gave the best approximation for the sound attenuation over the bandwidth of the clicks (assuming an average detection range of ~700 m). A test of clicks from site MC suggested that their peak-to-peak and RMS signal levels are highly correlated (Supplementary Figure 2), justifying application of the calculated TL to estimate peak-to-peak signal level.
A simulation model run involved placement of 100,000 echolocating animals within a 1 km horizontal radius of the acoustic sensor, with depth, orientation and sound production parameters randomly selected for a mean (with uniform distribution over a fixed interval) and a randomly selected standard deviation (uniform over a fixed interval). The simulation was repeated for each receiver, using the sensor depth and bathymetry unique to each site. The click was designated as being detected if its received level equaled or exceeded 132 dBpp re: 1 μPa (this is 16 dB above the detection threshold used in the signal analysis as a means to compensate for the lower bandwidth of the long-term recordings–the rationale for this choice will be discussed in detail later in this paper). No attempt was made to account for changes in noise background since, at these frequencies (80–100 kHz), ambient noise is limited by thermal noise near the sensor, rather than changes in environmental noise (Hildebrand, 2009). A total of 2000 model iterations were run, and the mean probability for click detection was derived from the mean of these, as was the variance.
For estimating the probability of detecting echolocation from a group of animals, the combined orientation of all the animals in the group was allowed to vary during a one-min time-bin. During the descent portion of the dive, a rotation in group elevation angle was allowed. During the foraging portion of the dive, rotation in both elevation angle and azimuth was allowed. The additional freedom of orientation made it more likely that an on-axis click would be received from the group during each one-min time-bin than would be expected for single clicks from individual animals. This accounts for the dynamic search behavior that odotocetes are known to execute during foraging dives, often changing the direction of their echolocation (Teloni et al., 2008). We further assumed that the highest amplitude click was produced at the center location of the group. If the sensor was outside the range of angles subsumed by the group orientation, then a lesser beam amplitude was applied (intermediate between the minimum beam amplitude and the source level). The spread of group members relative to the center location of the group was assumed to be small compared to the maximum range for detection. Similar to the models for individual click detection ranges, 2000 iterations were implemented with 100,000 simulated groups per iteration for each site. The data were averaged in 100 m range bins, and estimates of the group detection probability and variance were calculated.
To obtain the parameters for both the click and the group models, a grid search for model parameters was conducted to minimize the misfit of the model output and data for click received levels at each site. The percentage of clicks detected versus received level was compared for the model and for the recorded data at the three study sites. The goodness-of-fit metric was the sum of the squared misfit for all received level bins (116 dBpp ≤ RL ≥ 140 dBpp) for all sites. This approach assumes that Kogia spp. diving and echolocation parameters are consistent between all three sites. Alternatively, a set of parameters could be independently estimated for each site, although it was judged to be more effective in this case to require consistency across all three sites. A total of 3000 model runs were conducted (1000 each for 3 sites), for both the click and group model, to arrive at the final set of model parameters and detection probabilities (Supplementary Table 2). The final parameters were selected to both provide a match to the received level distribution and to give detection probabilities that yielded consistent density values for the click and group methods. A sensitivity analysis was conducted on the final model parameters to determine which had the greatest impact on the final click or group detection probabilities.
Vocal Activity
Estimates of vocal activity are needed to estimate density: the click-based method requires an estimate of mean click production rate (r), while the group-based method requires the proportion of one-min bins a group is vocally active (Pv). Ideally, these data would be obtained from the animals being studied; however, due to a lack of auxiliary data for Kogia spp., the click rates used here were derived from a combination of beaked whale acoustic tag data (Johnson and Tyack, 2003), and from the ICIs recorded in this study.
There are four deep diving cetacean species that have sufficient acoustic tag data to estimate the percentage of their dive cycle spent echolocating. They are: Blainville's beaked whale (17%), Cuvier's beaked whale (26%), Risso's dolphin (51%) and sperm whale (67%) (Watwood et al., 2006; Arranz et al., 2016; Warren et al., 2017). It appears that beaked whales are prone to echolocation a smaller percentage of the time than either sperm whales or Risso's dolphin. Likewise, Risso's Dolphins have somewhat larger group sizes (3–10 animals) and are less stealthy than Kogia.
Based on these options for comparison we find Blainville's beaked whale (Mesoplodon densirostris, Md) as the best analog for Kogia given the similarity of their moderate dive depths, small group sizes and stealthy behavior. The proportion of time Kogia spent clicking was estimated from Blainville's beaked whale tag data collected in the Bahamas (Warren et al., 2017) since their respective lengths (4.7 m Md and 3.8 m Kb) and weights (~1000 kg Md and ~450 kg Kb) are more similar than for other beaked whale species, and they are presumed to have similar diving behavior. The mean vocal (echolocating) proportion of the Md dive cycle Pcyc was used as a proxy for the proportion of vocally active one-min bins used in group-based density estimates. The ICI was estimated from the passive acoustic monitoring data in this study, using the mode of the distribution for each site (Supplementary Figure 3). The mean proportion of time spent clicking (Pcyc) was divided by the modal ICI to estimate mean click production rate used in click-based density estimates.
To estimate the probability of vocal activity from a group of animals, the synchrony of their echolocation clicking is an important parameter (Hildebrand et al., 2015). The probability of a group being vocally active, Pv, in any given period increases with group size if asynchrony is present as follows:
where Pcyc is the proportion of time spent clicking by an individual animal, s is the group size, and o is the pair-wise overlap between echolocation bouts of two animals. This expression assumes that each animal added to the group adds both overlapped (simultaneous) and non-overlapped echolocation time to the bout and is appropriate for moderate (~ <10) group size. For larger group sizes, even a small amount of asynchrony (o > 95%) results in unity for the vocal activity Pv (the presence of continuous clicking).
Group clicking synchrony (as measured by overlap o) was estimated from the timing of click bouts obtained from acoustic tracking arrays applied to Cuvier's beaked whales (Wiggins et al., 2012; Gassmann et al., 2015). These estimates of synchrony are available for no other cetaceans, including Kogia spp., although the similarity of their group size (~1–4 animals) and presumed diving behavior (Scott et al., 2001) suggests that the application may be appropriate.
Density Estimation
At the finest temporal scale, we determined the presence of Kogia spp. clicks and the number of detected clicks during each one-min time period, and then averaged over a weekly time interval. We estimated animal density using distance sampling-based methods with both click detection (cue-based) and time-bin detection (group-based) approaches (Hildebrand et al., 2015).
A cue-based approach for density estimation requires counting the number of detected clicks, along with knowledge of the click production rate for individual animals and the detectability of individual clicks (Marques et al., 2009). Given nkt detected clicks at site k during week t, in a time period Tkt, density Dkt can be estimated by:
where Pk is the probability of detecting a vocal cue that is produced within the radius w from the site, beyond which no detections are assumed to be possible, ck is the proportion of false detections, and r is the cue production rate. The variance was obtained using the delta method approximation (Marques et al., 2009).
A group counting approach for density estimation requires detection within a set of short time windows, along with knowledge of group detectability. It further relies on knowledge of both the mean group size s and group vocalization behavior. Using a group counting approach, the estimated density Dkt at site k, during week t is:
where nkt represents the number of time intervals (one-min windows) that groups were detected at site k during week t, and Tkt represents the total number of time intervals that were sampled. Detecting a vocalizing group within a horizontal radius of size w has probability Pk, and the probability of a group being vocally active in a one-min window is Pv, with the proportion of false detections ck. At least 3 days of data were required to produce a weekly estimate at the beginning or end of a deployment, otherwise data were associated with the adjacent weekly estimate. Variance is obtained using the delta method approximation, as above.
Seasonality and Trend
Kogia spp. density was also calculated on a monthly basis to investigate the potential for seasonal and long-term trends. To avoid confounding between seasonality and trend estimation, a parametric model was used to estimate seasonal and non-seasonal trends in the monthly time series. The raw monthly time series data were first fit with a linear regression based on the Theil-Sen estimator (Sen, 1968) and this trend was subtracted from the original data. The de-trended data were then regressed against a set of monthly indicators. These seasonal indicators were subtracted from the original time series and the final trend was estimated using a least-square linear regression, including estimates for the 95% confidence intervals of the trend.
Results
Kogia spp. Acoustics
The signals from four Kogia sp. acoustic encounters captured during broadband recording (160 kHz) at site MC (Figure 3 and Table 1) are helpful for understanding how Kogia spp. signals might appear in recordings limited to 100 kHz bandwidth. The broadband recorded signals have energy that extends below 100 kHz (Figure 4), and in addition there is a small amount of aliasing of energy from above 100 kHz into the lower frequency band (Supplementary Figure 4), based on the instrumental frequency response. Inspection of Figure 4 suggests that the primary reason for signal detection in the 100 kHz bandwidth recordings is that at least a portion of the signals have bandwidth that extends below 100 kHz. Recording at 100 kHz results in a difference of about 16 dB between the peak-to-peak received signal level as recorded at full (160 kHz) bandwidth and at the reduced (100 kHz) bandwidth (Figure 5). Despite the reduced bandwidth and lower received levels, the 100 kHz recordings captured both typical echolocation clicks (used in this study), and the rapid “buzz” clicks that have been associated with foraging attempts (Supplementary Figure 5). When modeling the propagation of echolocation clicks we used an average of 90–96 kHz since this best represents the bandwidth of the recorded click, but we compensated for the measured difference of 16 dB between the peak energy that would be available at 117 kHz and what was measured at 100 kHz.
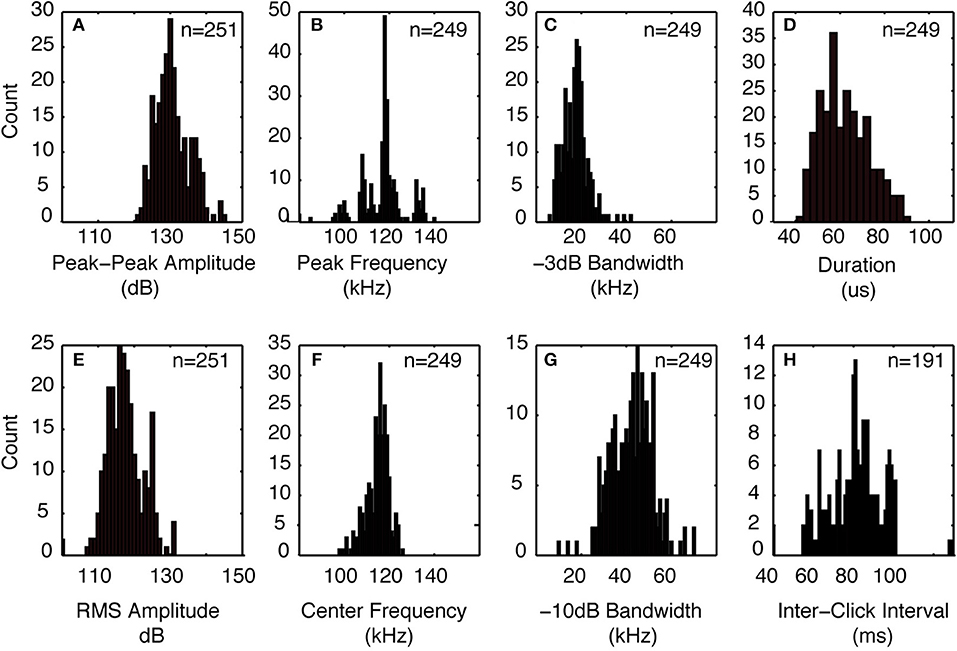
Figure 3. Click characteristics from Kogia spp. encounters recorded with 160 kHz bandwidth at the MC site in the GOM. (A) peak-peak amplitude, (B) peak frequency, (C) −3 dB bandwidth, (D) click duration, (E) RMS amplitude, (F) click center frequency, (G) −10 dB bandwidth, and (H) inter-click interval. Indicated numbers are for all recorded clicks collected during four encounters.
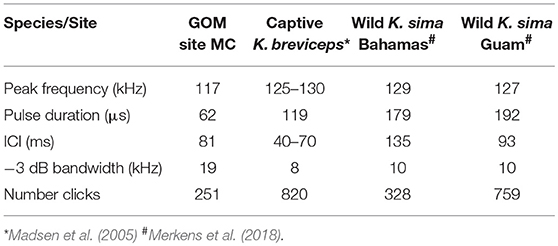
Table 1. Comparison of median peak frequency, pulse duration, Inter-click-interval (ICI) and −3 dB bandwidth for Kogia spp. from site MC 320 kHz sample rate recording and the same parameters for other reported encounters with Kogia including a captive K. breviceps and wild K. sima in the Bahamas and Guam.
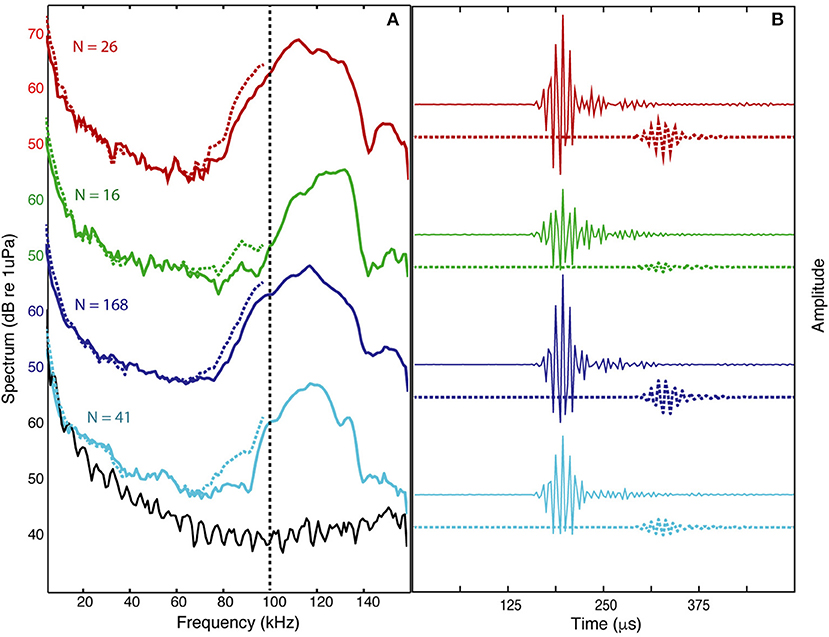
Figure 4. Averaged spectrum levels (A) and average waveforms (B) are shown for all the clicks during each of four encounters (N = number of clicks) recorded with 160 kHz bandwidth (colored solid lines) and the estimated level that would result from 100 kHz bandwidth recording (colored dashed lines) based on filtering and aliasing of high frequency energy (filtered waveforms are delayed by 125 μs for clarity). The instrumental spectrum noise-floor shown (black line) associated with light blue encounter.
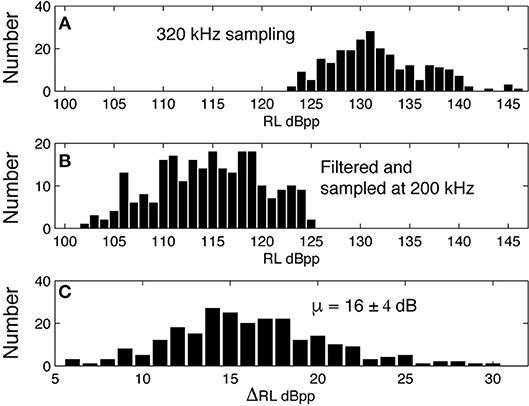
Figure 5. Peak-peak received level for clicks recorded at 320 kHz sampling rate (A) are filtered with the HARP system transfer function and resampled at 200 kHz (B), yielding a mean difference of 16 dB between the peak-to-peak received signal levels (C).
The characteristics of clicks from dwarf sperm whales recorded in the wild near The Bahamas and Guam (Merkens et al., 2018), and a captive pygmy sperm whale that stranded from the Western Atlantic (Madsen et al., 2005), are reported in Table 1. The peak frequencies in the MC recordings are slightly lower (117 kHz), and the pulse durations are shorter (62 μs) than in the reported Kogia recordings. The higher peak frequencies from the captive pygmy sperm whale data and the wild but near-surface dwarf sperm whale field recordings could be a function of the close range for recording relative to the MC recordings. Another difference may be that the captive and wild recordings were from animals within a few meters of the surface while the animals recorded at site MC are thought to be at more substantial depth (~550 m as discussed later). The MC site ICI (81 ms) is similar to both the captive pygmy sperm whale (40–70 ms), and the wild dwarf sperm whale recorded in Guam (90 ms), but it is not possible to assign the MC acoustic encounters to a particular Kogia species, based on the available data.
Diel Pattern
The diel occurrence of echolocation click encounters was tested for sites MC, GC and DT individually (Supplementary Figure 6). The sums of the duration of encounters per photoperiod for each day were normalized by the duration of each photoperiod resulting in an hourly encounter rate in minutes per photoperiod. If Kogia spp. were detected at any of the three sites during day or night, the median hourly encounter duration was 3 min (0.03 and 10.9 for 10th and 90th percentile). This hourly encounter duration did not show significant differences between photoperiods at all sites (Kruskal-Wallis test). However, when testing the hourly encounter duration for all days of the recording period, including those with no detections, there were significant differences due to a larger number of days than nights with encounters at sites DT and GC, but not at site MC (Table 2). The pattern is particularly apparent for site DT where there were almost twice as many days than nights with Kogia spp. encounters.
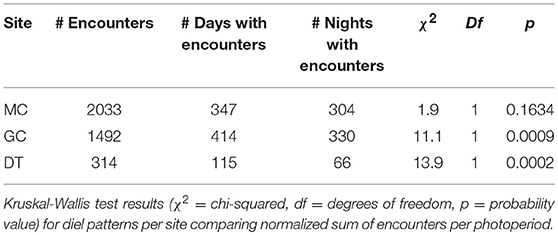
Table 2. Comparison of total number of encounters per site (MC, GC, and DT) and number of days or nights with encounters.
Group Size
A minimum group size distribution was estimated from the acoustic data by examining overlapping sequences of echolocation clicks that occur simultaneously. The acoustic group size estimate (mean = 1.31, median = 1, N = 77) is slightly lower than the visual group size estimate (mean = 1.58, median = 1, N = 52) from surveys conducted in the GOM between 2003 and 2014 (Figure 6).
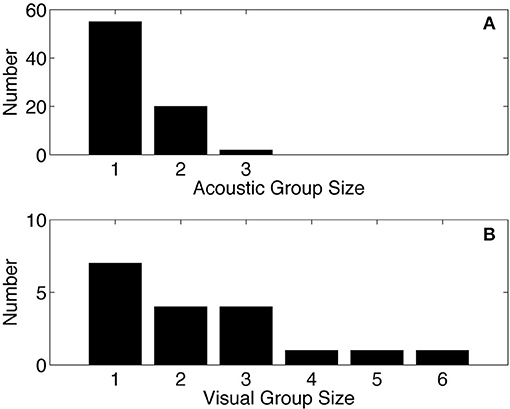
Figure 6. Acoustic group size for Kogia spp. from site MC (A), compared to group size from visual surveys in the GOM (B) based on data collected between 2003 and 2014 as part of SEFSC-NMFS sighting surveys (unpublished data). Mean of acoustic group size = 1.31, median = 1, N = 77. Mean of visual group size = 1.58, median = 1, N = 52.
For comparison, previous studies have estimated group size for Kogia spp. based on visual surveys in other locations. In Hawaii Kogia spp. have a mean group size of 2.33 (Baird, 2005). Dwarf sperm whales in the Gulf of California had a mean group size of 2.5 ± 2.3 (Barlow et al., 1997). In The Bahamas the annual median group size was 3.5 (Dunphy-Daly et al., 2008). In addition, the Bahamian dwarf sperm whale group size varied seasonally with smaller groups in the summer (median = 2.5, SD = 1, range = 1–8, N = 34) and larger groups in the winter (median = 4, SD = 2, range = 1–12, N = 20).
The visual group size estimates may be more accurate than the acoustic estimates owing to the clustering of animals at the surface, in contrast, the acoustic detection range is short (<1 km), and the sensors may not simultaneously detect all the animals in a group while they are submerged and echolocating. Both the visual and acoustic group size estimates may miss animals, and therefore should be considered minimum estimates. Although the visual and acoustic group sizes are comparable, we will use the GOM visual group size estimate (mean = 1.58, CV = 0.09) for further calculations given that it is the larger of the two and potentially less prone to missing animals.
Detection Probability
A search for Kogia spp. behavioral parameters using the Monte Carlo simulation model fitting resulted in the values given in Table 3. The modeled acoustic received level was compared to the observed at each of the three sites, and these distributions are shown in Figure 7. The number of clicks at high received levels (>135 dBpp re: 1 μPa) was somewhat above the model for MC (Figure 7A), but was a good fit to the model at GC (Figure 7C) and at DT (Figure 7E). A greater diving depth and/or higher source level would improve the fit at MC, but would reduce the goodness of fit at GC and DT. A foraging maximum dive depth of 550 ± 50 m provided the best overall fit, in concert with a source level of 212 ± 5 dBpp re: 1 μPa. Dive descent angle in the click model (67° ± 2°), and elevation rotation during foraging in the group model (67° ± 5°) were well constrained. In the click model directivity was constrained to be 23 ± 1 dB, and orientation elevation was allowed to deviate from the horizontal by between 30° and 35°. Little or no constraint was imposed on the group model parameters elevation rotation while diving (selected to be 40° ± 10°) and azimuthal rotation while foraging (selected to be 180° ± 10°), and these parameters appear to have little impact on the detection probability. A single set of model parameters was selected to provide the best fit for all three sites, but clearly an improved fit would be obtained from allowing the model to vary for each site.
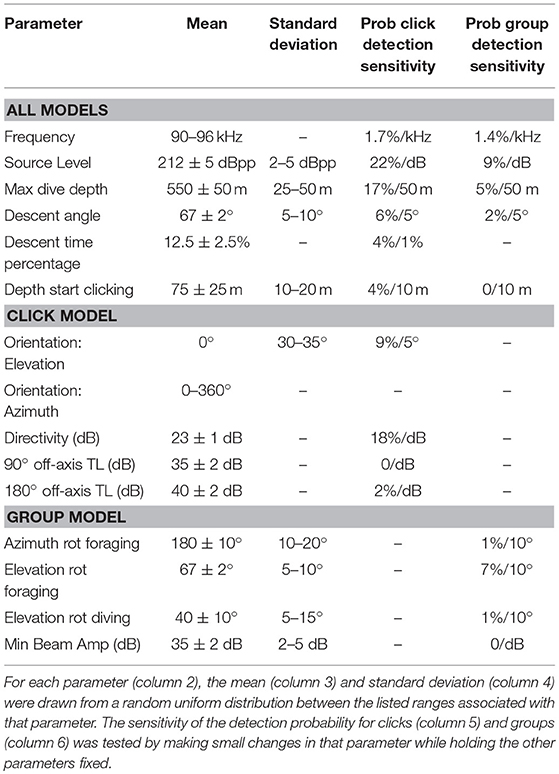
Table 3. Monte Carlo simulation parameters used to model probability of detecting individual clicks and groups of clicking animals, along with their modeled sensitivity.
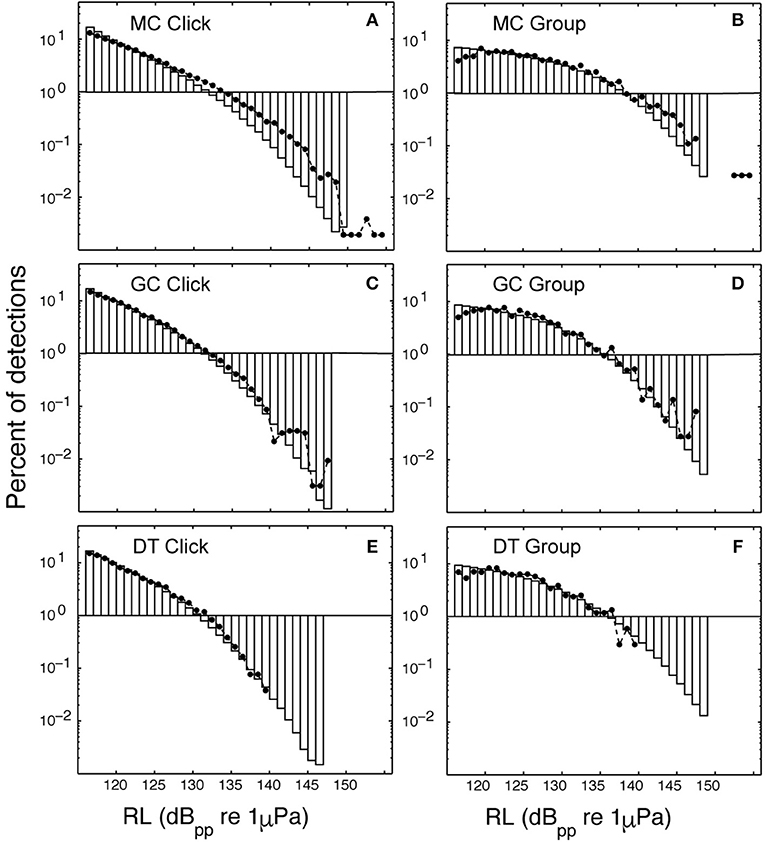
Figure 7. Percentage of modeled acoustic clicks at a given received level (bars) are compared to observed click received levels (dots). Site MC using the click method (A) and the group method (B); site GC using the click method (C) and the group method (D); and site DT using the click method (E) and the group method (F). Lower maximum received levels were observed as the depth of the site increased: a maximum received level of 139 dB pp re 1 μPa @ 1 m was observed at DT with depth of 1,300 m (E,F), however, 155 dB pp re 1 uPa @ 1 m was observed at site MC with depth 980 m (A,B).
The Monte Carlo model suggests that the detection probability for Kogia spp. individual clicks (Figure 8) is small (~0.5% within 1,000 m) owing to their directionality, their relatively shallow foraging depth (~550 m) with respect to the sensor depth (~1,000 m), and their reduced apparent source level due to the limited bandwidth of the recordings. The probability of click detection is greatest in the region directly above the sensor, and rapidly falls off with range (Figure 8A). This is due to both on-axis and off-axis clicks being detected at close range, whereas, only on-axis clicks are detected at greater ranges. The detection probability for a group of animals during a one-min bin is substantially greater (~40% within 1,000 m). By allowing elevation rotation of ±67° for the entire group while foraging, it is much more likely that an on-axis click will be detected. There is a peak in group-detectability at ranges of 300–500 m horizontally from the sensor (Figure 8B). At this range expected changes in elevation-orientation during foraging make the detection of on-axis clicks highly likely, whereas when the animal is directly above the sensor, it is less likely to point directly at the sensor and results in fewer on-axis clicks at short horizontal range.
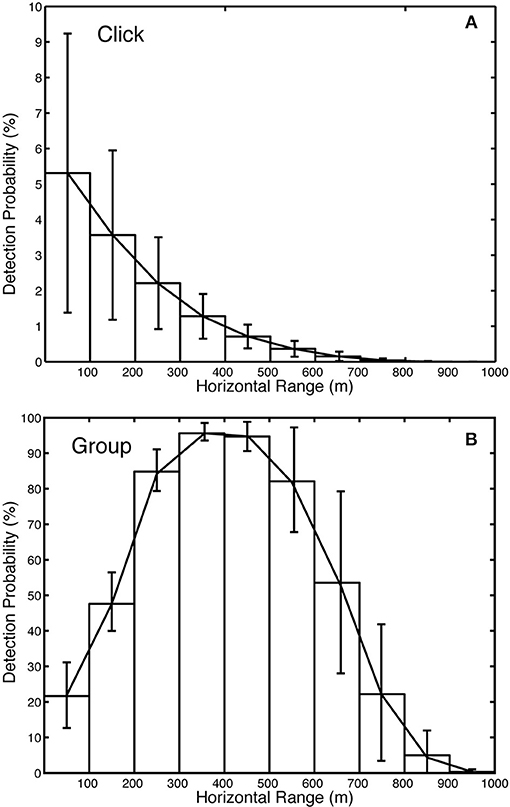
Figure 8. Detection probability versus range for Kogia spp. (A) individual echolocation clicks and (B) groups during a one-min bin. Total detectability 8.7% for site MC. ± 0.290% and for groups is 43.4 ±…within 1,000 m for clicks is 0.543.
A sensitivity analysis with respect to the model parameters was conducted for detection probability, and the results are presented in Table 3 (two right-hand columns). In general, the probability of click detection is more sensitive to the model parameters than the probability of group detection. This is particularly evident for the source level estimate (212 ± 5 dBpp) which has a 22%/dB change in the click detection probability, but a 9%/dB change in group detection probability. A change in detection probability with source level is expected (necessary) given that higher source levels will make both individual clicks, and clicking from groups, fall above the detection threshold more often. The greater sensitivity of click detection to source level is a product of the overall lower probability of click detection (~0.5% within 1,000 m) compared to group detection (~40% within 1,000 m), so that even a slight increase in click detection probability becomes a larger percentage increase for the former than for the latter. Maximum dive depth is another parameter with substantial impact on the detection probability with 17%/50 m change for click counting and 5%/50 m change for group counting. All the other model parameters have only a moderate or little impact on the detection probability, except for the beam directivity which has an 18%/dB change on the probability of click detection.
Vocal Activity
The regularity of click timing during echolocation results in a strongly peaked distribution of ICIs for Kogia spp. (Supplementary Figure 3) of ~79 ms (~13 clicks/s). A secondary peak in the ICI distribution was due to irregular click production, and that some clicks in a sequence would fall below the threshold of the detector and be missed. The ICI's varied somewhat between recording locations, with modal values at site MC being slightly longer (mode = 80.6 ms, N = 35052) than those at site DT (mode = 79.5 ms, N = 4945) and at site GC (mode = 78.1 ms, N = 21077). Owing to variations in the numbers of clicks at each site, we will use a between-site mean ICI of 79.4 ms (CV = 0.02) in the remainder of this analysis. The proportion of time spent clicking during a dive cycle was previously determined for Blainville's beaked whales (as a proxy for Kogia spp.) based on acoustic tag data collected in The Bahamas (Warren et al., 2017). For Blainville's beaked whale, the mean proportion of each dive cycle that contained clicking was 0.165 with CV = 0.075. Estimated click rates (r) were obtained from the product of the mean proportion of the dive cycle spent clicking, and the inverse of the ICI (for Kogia spp.) as follows:
For the group counting method, the vocal synchrony is also needed, and the only species for which this has been estimated is Cuvier's beaked whales (Ziphious cavirostris) (0.67, CV = 0.03) for groups of 2 and 3 animals (Hildebrand et al., 2015). This yields an estimate for the probability of group clicking (Pv) as follows:
Under this scenario a group of one or two Kogia sp. would be vocally active about 20% of the time across each dive cycle.
Density Estimation
An average density for Kogia spp. at each site was estimated for the entire time period using the parameters outlined above. Somewhat higher average densities were observed at the northwestern sites (MC and GC) than for the southeastern site (DT) (Tables 4, 5). Time series of weekly Kogia spp. density estimates, for the period from May 2010 to September 2013, are presented in Figure 9. Kogia spp. were present periodically throughout the monitoring period, although the detections fluctuated daily (Supplementary Figure 7), presumably as groups of animals moved in and out of the detection range of each instrument.
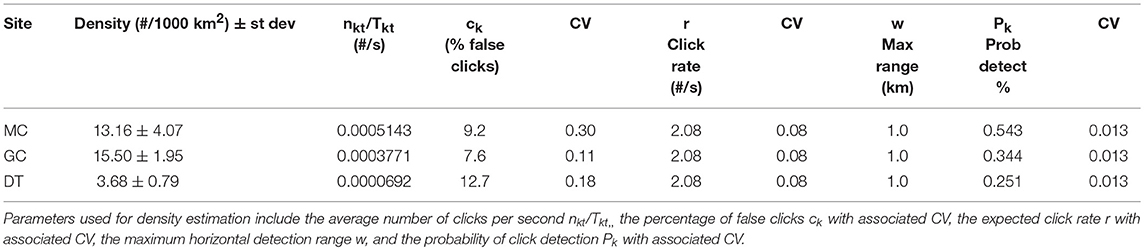
Table 4. Average Kogia spp. densities derived from click counting by site (MC, GC, DT) given in # of animals per 1000 km2.
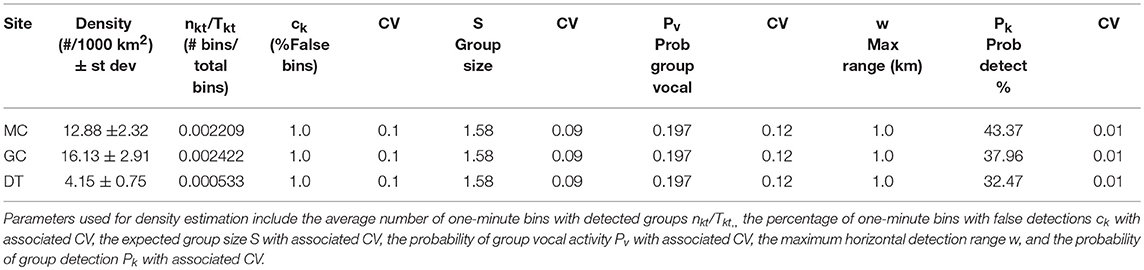
Table 5. Average Kogia spp. densities derived from group counting by site (MC, GC, DT) given in # of animals per 1000 km2.
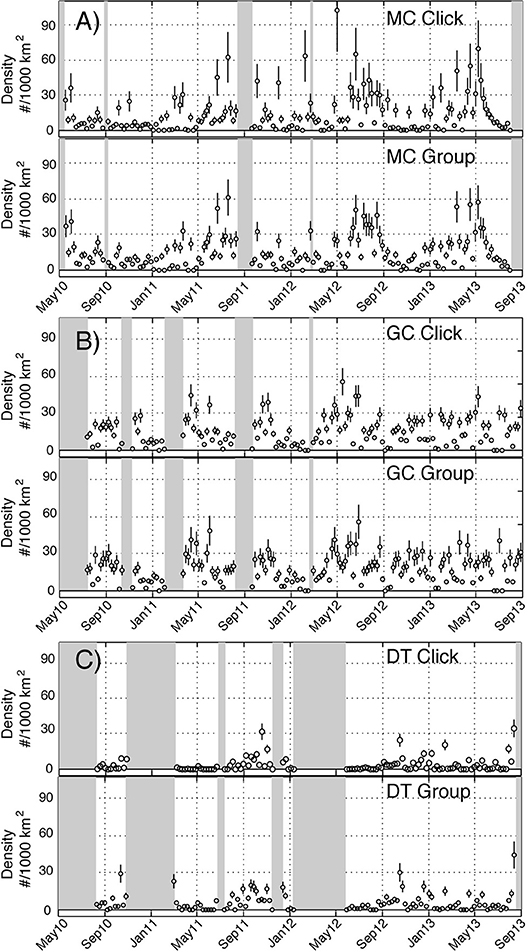
Figure 9. Time series of weekly density estimates for Kogia spp. between May 2010 and September 2013 at sites MC (A), GC (B), and DT (C) based on click counting (above) and group counting (below). Circles denote estimates and vertical lines show ± one standard error. Shaded areas lack recording effort.
Seasonality and Trend
Seasonal trends present in the Kogia spp. density data differ by site (Figure 10). Site MC in the northern GOM has higher densities in the spring and summer (May–August) and a deficit in the fall and winter. Whereas, site DT in the southeastern GOM has higher densities in the fall-winter (August–December), although, it has more limited seasonal data available due to gaps in its time series. The magnitude and clarity of the seasonal patterns are greatest at sites MC and DT, while seasonality at site GC is more complex.
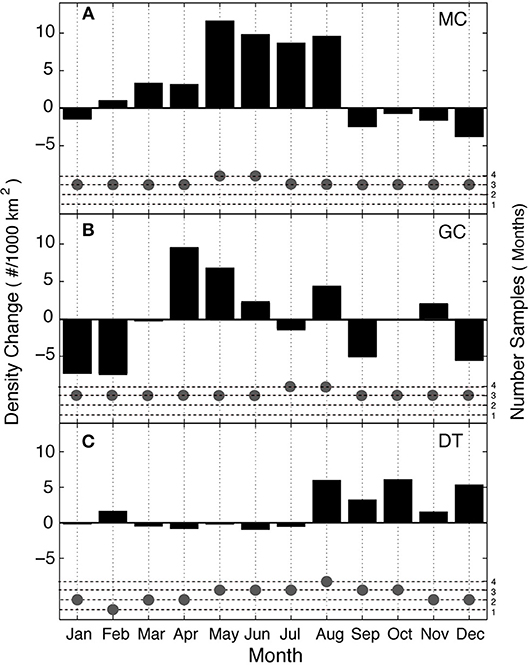
Figure 10. Seasonal patterns of Kogia spp. density (black bars), shown as monthly adjustments at sites MC (A), GC (B), and DT (C). Number of months with data (gray dots) for each site.
The Kogia spp. density time-series were tested for long-term trends, after application of monthly seasonal adjustment (Table 6). At all sites, the least-squares annual density change estimate was slightly-to-strongly positive between 2010 and 2013. At site DT, both the click and group density trends had 95% confidence interval limits that did not include zero. Likewise, the site MC click density estimate yielded an annual increase within the 95% confidence interval. All other estimates were consistent with no annual density change based on an annual change of zero being included within the 95% confidence intervals.
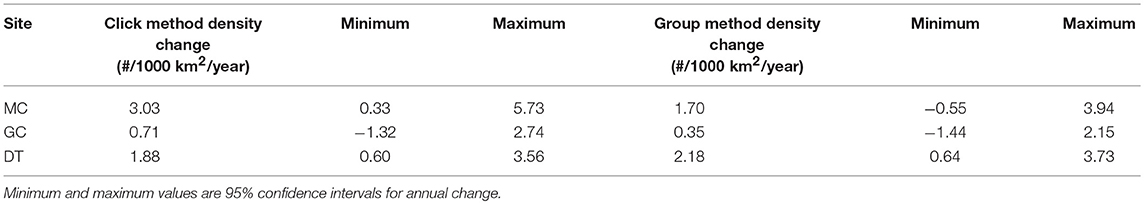
Table 6. Annual trends in Kogia spp. density by site and method (column 2 = click method and column 5 = group method).
Discussion
Kogia produce echolocation clicks that are intermediate in peak frequency between those of porpoise such as Harbor porpoise (137 kHz) and beaked whales such as Cuvier's (44 kHz). The fact that Kogia echolocation clicks have some energy below 100 kHz allowed them to be recorded by this study, albeit at reduced amplitude. A primary source of complexity for the current long-term acoustic dataset is the limited bandwidth (100 kHz) of the recordings relative to the peak energy of the GOM Kogia spp. echolocation signals (117 kHz). Analysis of the broadband (160 kHz) dataset suggests a 16 dB loss of signal detectability at 100 kHz relative to broader-band recordings. Future work using higher bandwidth recording (>150 kHz) would eliminate the need to adjust for the limited bandwidth, and may lead to the ability to separate signals between the two Kogia species. It is possible that the results presented here are a conservative estimate of Kogia population density because of the signal loss due to recording at 100 kHz which may not have been completed compensated by the 16 dB adjustment in signal level. Indeed, some of the signals detected by the 160 kHz bandwidth recordings (Figure 4) would not have been detected at 100 kHz because of their low signal level below 100 kHz.
The broader bandwidth of our GOM recordings made at depth (Table 1) relative to those recorded in the presence of these animals in the wild, presumably closer to the surface, requires more investigation. Pressure effects may be an important factor in the sense that a much smaller volume of air would be available at depth to aid in sound pulse formation and directionality. Perhaps the lower frequency energy of the GOM recordings is related to the Kogia sound production anatomy as it functions at depth, with the lower-frequency component being less directional compared to the narrowband signals observed near the surface. An alternative possibility is that there may be undescribed differences between the two Kogia species, given that the wild recordings are both from K. sima, while the GOM recordings have uncertain species association.
A diel pattern with greater daytime echolocation, and therefore presumably increased daytime foraging, is found for the data at sites GC and DT, but not at site MC. This suggests that Kogia spp. may be opportunistic foragers that target both some species that undergo diel vertical migrations, and some species that do not. It has been previously suggested that Kogia spp. target a wide diversity of prey and engage in foraging in waters spanning the mesopelagic and bathypelagic zones (West et al., 2009). Since sites GC and DT are deeper than site MC, it is possible that the observed diel pattern reflects deeper foraging during daylight hours, increasing the detectability of their echolocation at the deeper sites during times when their prey may be deeper.
Understanding the probability for acoustic detection of these animals as a function of their range is key to estimating their density. We have used a simulation approach to modeling detection probability for single animals and their clicks, and for groups of animals based on the most detectable click within a time window. As a response to the lack of behavioral and sound production information on Kogia spp. we incorporated a grid search model-fitting approach to estimate dive depth, descent angle and other parameters. Having sensors at several depths resulted in different distributions of received level at the different sites, and model parameters were adjusted to be consistent with these distributions. The resulting behavioral parameters appear not to contradict what little is known of Kogia spp. behavior. For instance, a foraging depth of ~550 m is consistent with stomach contents from stranded animals that suggest oceanic cephalopods are their primary prey (Santos et al., 2006). Likewise, release of a stranded and tagged juvenile pygmy sperm whale (Scott et al., 2001) revealed foraging along the continental slope with moderate dive intervals (~2–8 min) but little time spent at the surface (9–23%), although longer dive intervals were observed by Barlow et al. (1997). Testing of the full range of behavior parameters derived from the simulation will await collection of more comprehensive tag data at some future date. For robustness, we have chosen to collectively model the behavioral parameters of all three sites. However, it may be that Kogia spp. behavior varies by site and the modeling could be made site specific.
The only reported echolocation source level for Kogia spp. is 175 dB from a captive animal (Madsen et al., 2005) but this value is presumably lower than that of a free-ranging animal. Use of low source level clicks by captive animals may be due to the reverberant holding tank and the short ranges to targets within the tank (Au, 1993). Until there are measurements for Kogia echolocation in the wild, we are left with comparing our modeled source level estimate (212 ± 5 dB pp re 1 uPa @ 1 m) with what is known from other odontocetes. The echolocation energy flux density, a product of source level and signal duration, has been shown to scale with body mass for other odontocetes (Jensen et al., 2018). The Kogia energy flux density derived from our modeling and observational data (SL = 203 ± rms re: 1 uPa @ 1 m, duration = 62 μs) compares well to those of odontocetes with similar body mass (shaded area in Supplementary Figure 8) suggesting that the output of our modeling is consistent with what would be expected from scaling of known species echolocation.
The proportion of time spent clicking by Kogia was estimated using Blainville's beaked whale tag data obtained in The Bahamas, and group clicking synchrony from Cuvier's beaked whale acoustic tracking data obtained off southern California (Hildebrand et al., 2015). These data were combined with Kogia spp. ICI rates obtained at sites in the GOM to estimate the overall clicking rate. In the future, data on the proportion of time clicking and clicking synchrony should be collected from Kogia spp. to test the validity of the values applied here. If the measured Kogia spp. clicking percentage is found to differ from what was used here, the proportional change can be applied as a linear correction to the density estimates presented.
Stock assessments for the GOM combine the two species of Kogia spp. for abundance estimation owing to the difficulty of differentiating them visually at sea. The most recent abundance estimate for northern GOM Kogia spp. is 186 animals (CV = 1.04) (Waring et al., 2013). This estimate is from the summer of 2009 and covers waters from the 200 m isobaths to the seaward extent of the US Exclusive Economic Zone, an area of approximately 4 × 10⁵ km2. This gives an average density of 0.46 animals/1000 km2 for the northern GOM, an order of magnitude lower than the acoustic density estimates presented in Tables 4, 5. One reason for this difference may be that the continental slope sites monitored here acoustically are particularly favorable habitat for Kogia spp. However, sighting distributions (Figure 1) do not reveal a preference for slope habitat, indeed the majority of sightings are in non-slope deep waters. The most likely explanation for the mismatch between visual and acoustic densities is the highly likely violation of the g(0) = 1 assumption (perfect detection of animals on the trackline) incorporated into visual survey estimates (Mullin and Fulling, 2004). For such elusive animals that spend a large proportion of their time at depth, the true g(0) must be considerably lower than 1, as suggested by modeling of their dive intervals and detectability changes with sighting conditions (Barlow, 1999, 2015). Together these imply that current stock estimates are potentially underestimated, and that evaluating the assumptions involved in constructing these acoustic density estimates should be a research priority.
Cetacean populations in the GOM may have been impacted by the Deepwater Horizon oil spill, which was underway at the time these recordings were initiated in May 2010, with oil release terminated by late summer 2010. An increasing population trend during 2010–2013 for Kogia spp. at sites DT and MC is suggested by the click density estimation method, and to a lesser extent by the best estimate of the group density estimation method. The annual rates of increase, for instance at site MC, of 23% (click method) or 13% (group method) are both greater than what would be expected to be the maximum rates of increase (~6%) for a population of odontocetes (Reilly and Barlow, 1986), suggesting that the observed increases are most likely a result of animals moving into proximity of the site, perhaps following larger temporal scale oceanographic cycles and/or habitat recovery in the period after the oil spill. Indeed, site MC densities appear particularly low in the summer and fall of 2010 relative to other years of monitoring when densities peaked in the summer months (Figure 9) suggesting the possibility of avoidance of the area during the time of the oil spill, perhaps related to both the presence of oil and to the presence of a large number of vessels in the area as part of the spill response.
Conclusions
Kogia spp. are among the most difficult cetaceans to study in the wild, and repeated attempts to attach tags to them have been frustrated by their avoidance of boats (Baird, 2015). For this reason, they remain poorly studied species, despite the recent technical advances that have allowed detailed study of beaked whales and other deep diving cetaceans. Passive acoustic monitoring provides a window, albeit incomplete, into their behavior and presence.
In the context of an extremely difficult to study species, the population density estimates made here for Kogia are based on the best available proxies for their echolocation and diving behavior. The accuracy of these estimates would be improved with ample acoustic tag data from Kogia, but thus far this has not been possible. Use of passive acoustic data for applying constraints on Kogia echolocation and dive behavior may be the best option we have to date. The approach presented here compares a model of Kogia behavior to the acoustic data through use of the acoustic received level distributions, a step forward over what has been done for previous acoustic density estimation studies (Hildebrand et al., 2015). Using this and further approaches modeling passive acoustic data, it may be possible to study the diving and echolocation behavior of the full range of beaked whale species (Baumann-Pickering et al., 2013), the majority of which have not yet been studied by acoustic tagging.
Passive acoustic data were analyzed to estimate the density of Kogia spp. at three sites in the GOM during and following the Deepwater Horizon oil spill. The population densities obtained from acoustic monitoring at these three sites are all substantially higher than those derived from line transect visual surveys. An increasing interannual density trend is suggested for animals near site MC, within the primary zone of impact of the oil spill, and for site DT, to the southeast of the spill.
Potential bias in the reported density estimates relate to assumptions involved in obtaining detection probability, group size and vocalization rates. A simulation approach was used to obtain the detection probability, although the parameters used in the simulation were constrained by fitting observational data on click received levels. A full optimization for the fit between the parameters used in the model and the observational data is beyond the scope of this study, but it should be a goal for future work. In particular, understanding of how the population density estimate, which is directly related to click or group detection probability, would change with source level, dive depth, beam pattern and other model parameters, should be explored. The model-based approach provides an alternative means for estimating Kogia spp. diving and echolocation behavior and at present may be the only means to obtaining such data given the difficulty of tag attachment on this species. Better species-specific information on group size and vocalization rates is critical for improving the reliability of these density estimates. As better understanding of Kogia spp. echolocation and diving behavior becomes available in the future, it should be possible to revise these density estimates to incorporate improved estimates of the aforementioned parameters.
Ethics Statement
Because the study involved passive acoustic monitoring, no sounds or other disturbances were produced requiring permits or approval from the institutional animal use and care committee.
Author Contributions
JH and LG funding acquisition. JH, MM, and KM conceptualization. SW instrumentation. SW and KF data curation. JH, SB-P, KF, KM, and MM methodology. JH, KF, MM, and KM data analysis. LG and MS ancillary data. KF, SB-P, SW, and JH software. MM and JH writing–first draft. KF, SB-P, SW, KM, MM, MS, and LG writing–review and editing. JH writing–revisions.
Funding
Funding for HARP data collection and analysis was provided by the Natural Resource Damage Assessment partners (20105138), the US Marine Mammal Commission (20104755/E4061753), the Southeast Fisheries Science Center under the Cooperative Institute for Marine Ecosystems and Climate (NA10OAR4320156) with support through Interagency Agreement #M11PG00041 between the Bureau of Offshore Energy Management, Environmental Studies Program and the National Marine Fisheries Service, Southeast Fisheries Science Center, and the CIMAGE Consortium of the Gulf of Mexico Research Initiative (SA 12-10/GoMRI-007).
Conflict of Interest Statement
MM was employed by WhaleAcoustics LLC.
The remaining authors declare that the research was conducted in the absence of any commercial or financial relationships that could be construed as a potential conflict of interest.
Acknowledgments
We thank S. Murawski and S. Gilbert of USF, and K. Mullin of the SEFSC for project assistance. We thank LUMCON and the crew of the R/V Pelican, as well as I. Kerr and the crew of the R/V Odyssey for assistance with HARP deployments. We thank members of the SIO Whale Acoustic Laboratory including: T. Christianson, C. Garsha, B. Hurley, J. Hurwitz, J. Jones, E. O'Neill, E. Roth, B. Thayre, J. Jordan, and B. Kennedy for assistance with HARP operations and data processing. Tiago Marques, Danielle Harris, Len Thomas and Frants Jensen of St. Andrews University, as well as three reviewers, provided helpful comments on this manuscript. The GOM Kogia data used for this study are archived at https://data.gulfresearchinitiative.org/data/R4.x267.180:0011/ maintained by the Gulf of Mexico Research initiative.
Supplementary Material
The Supplementary Material for this article can be found online at: https://www.frontiersin.org/articles/10.3389/fmars.2019.00066/full#supplementary-material
References
Arranz, P., Deruiter, S. L., Stimpert, A. K., Neves, S., Friedlaender, A. S., Goldbogen, J. A., et al. (2016). Discrimination of fast click series produced by tagged Risso's dolphins (Grampus griseus) for echolocation or communication. J. Exp. Biol. 219, 2898–2907. doi: 10.1242/jeb.144295
Au, W. W. L. (1993). The Sonar of Dolphins. New York, NY: Springer-Verlag. doi: 10.1007/978-1-4612-4356-4
Baird, R. W. (2005). Sightings of Dwarf (Kogia sima) and Pygmy (K. breviceps) Sperm Whales from the Main Hawaiian Islands 1. Pacif. Sci. 59, 461–466. doi: 10.1353/psc.2005.0031
Baird, R. W. (2015). Movements and Habitat Use of Dwarf and Pygmy Sperm Whales using Remotely-Deployed LIMPET Satellite Tags. Technical Report, Cascadia Research Collective Olympia United States.
Baird, R. W., Nelson, D., Lien, J., and Nagorsen, D. W. (1996). The status of the pygmy sperm whale, kogia breviceps, in canada. Can. Field Nat. 110, 525–532.
Barlow, J. (1999). “Trackline detection probability for long-diving whales,” in Marine Mammal Survey and Assessment Methods, eds G. W. Garner, S. C. Amstrup, J. L. Laake, B. F. J. Manly, L. L. Mcdonald, and D. G. Robertson (Rotterdam: Balkema), 209–221.
Barlow, J. (2015). Inferring trackline detection probabilities, g(0), for cetaceans from apparent densities in different survey conditions. Mar. Mamm. Sci. 31, 923–943. doi: 10.1111/mms.12205
Barlow, J., Forney, K. A., Von Saunder, A., and Urban-Ramirez, J. (1997). A Report of Cetacean Acoustic Detection and Dive Interval Studies (CADDIS) Conducted in the Southern Gulf of California, 1995. US Department of Commerce, National Oceanic and Atmospheric Administration, National Marine Fisheries Service, Southwest Fisheries Science Center; available from National Technical Information Service NOAA-TM-NMFS-SWFSC-250.
Barros, N., Duffield, D., Ostrom, P., Odell, D., and Cornish, V. (1998). “Nearshore vs. offshore ecotype differentiation of Kogia breviceps and K. simus based on hemoglobin, morphometric and dietary analyses,” in Abstracts of the World Marine Mammal Science Conference (Monaco).
Bassett, H., Baumann, S., Campbell, G., Wiggins, S., and Hildebrand, J. (2009). Dall's porpoise (Phocoenoides dalli) echolocation click spectral structure. J. Acoust. Soc. Am. 125, 2677–2677. doi: 10.1121/1.4784219
Baumann-Pickering, S., Mcdonald, M. A., Simonis, A. E., Berga, A. S., Merkens, K. P., Oleson, E. M., et al. (2013). Species-specific beaked whale echolocation signals. J. Acoust. Soc. Am. 134, 2293–2301. doi: 10.1121/1.4817832
Baumgartner, M. F., Mullin, K. D., May, L. N., and Leming, T. D. (2001). Cetacean habitats in the northern Gulf of Mexico. Fish. Bull. 99, 219–239.
Caldwell, D. K., Inglis, A., and Siebenaler, J. B. (1960). Sperm and pigmy sperm whales stranded in the Gulf of Mexico. J. Mammal. 41, 136–138. doi: 10.2307/1376542
Davis, R. W., Ortega-Ortiz, J. G., Ribic, C. A., Evans, W. E., Biggs, D. C., Ressler, P. H., et al. (2002). Cetacean habitat in the northern oceanic Gulf of Mexico. Deep Sea Res. I Oceanogr. Res. Papers 49, 121–142. doi: 10.1016/S0967-0637(01)00035-8
Delgado-Estrella, A., and Vasquez, L. (1998). First Records of dwarf sperm whale (Kogia breviceps) pygmy sperm whale (K. simus) and pygmy killer whale (Feresa attenuata) in Veracruz, Mexico. Anales del Instituto de Biologia, Universidad Nacional Autonoma de Mexico. Serie Zool. 69, 129–134.
Dunphy-Daly, M. M., Heithaus, M. R., and Claridge, D. E. (2008). Temporal variation in dwarf sperm whale (Kogia sima) habitat use and group size off Great Abaco Island, Bahamas. Mar. Mamm. Sci. 24, 171–182. doi: 10.1111/j.1748-7692.2007.00183.x
Francois, R., and Garrison, G. (1982). Sound absorption based on ocean measurements. Part II: Boric acid contribution and equation for total absorption. J. Acoust. Soc. Am. 72, 1879–1890. doi: 10.1121/1.388673
Frasier, K. E., Wiggins, S. M., Harris, D., Marques, T. A., Thomas, L., and Hildebrand, J. A. (2016). Delphinid echolocation click detection probability on near-seafloor sensors. J. Acoust. Soc. Am. 140, 1918–1930. doi: 10.1121/1.4962279
Garrison, L. P., Martinez, A., and Maze-Foley, K. (2010). Habitat and abundance of cetaceans in Atlantic Ocean continental slope waters off the eastern USA. J. Cetac. Res. Manag. 11, 267–277.
Gassmann, M., Wiggins, S. M., and Hildebrand, J. A. (2015). Three-dimensional tracking of Cuvier's beaked whales' echolocation sounds using nested hydrophone arrays. J. Acoust. Soc. Am. 138, 2483–2494. doi: 10.1121/1.4927417
Giorgini, J., Yeomans, D., Chamberlin, A., Chodas, P., Jacobson, R., Keesey, M., et al. (1996). JPL's on-line solar system data service. Bull. Am. Astron. Soc. 28:1158.
Hildebrand, J. A. (2009). Anthropogenic and natural sources of ambient noise in the ocean. Mar. Ecol. Progr. Ser. 395, 5–20. doi: 10.3354/meps08353
Hildebrand, J. A., Baumann-Pickering, S., Frasier, K. E., Trickey, J. S., Merkens, K. P., Wiggins, S. M., et al. (2015). Passive acoustic monitoring of beaked whale densities in the Gulf of Mexico. Sci. Rep. 5:16343. doi: 10.1038/srep16343
Hodge, L. E. W., Baumann-Pickering, S., Hildebrand, J. A., Bell, J. T., Cummings, E. W., Foley, H. J., et al. (2018). Heard but not seen: occurrence of Kogia spp. along the western North Atlantic shelf break. Mar. Mamm. Sci. 34, 1141–1153. doi: 10.1111/mms.12498
Jefferson, T. A., Webber, M. A., and Pitman, R. L. (2015). Marine Mammals of the World: A Comprehensive Guide to their Identification, 2nd Edn. Amsterdam: Academic Press.
Jensen, F. H., Johnson, M., Ladegaard, M., Wisniewska, D. M., and Madsen, P. T. (2018). Narrow acoustic field of view drives frequency scaling in toothed whale biosonar. Curr. Biol. 28:3878. doi: 10.1016/j.cub.2018.10.037
Johnson, M. P., and Tyack, P. L. (2003). A digital acoustic recording tag for measuring the response of wild marine mammals to sound. IEEE J. Ocean. Eng. 28, 3–12. doi: 10.1109/JOE.2002.808212
Küsel, E. T., Mellinger, D. K., Thomas, L., Marques, T. A., Moretti, D., and Ward, J. (2011). Cetacean population density estimation from single fixed sensors using passive acoustics. J. Acoust. Soc. Am. 129, 3610–3622. doi: 10.1121/1.3583504
Kyhn, L. A., Jensen, F. H., Beedholm, K., Tougaard, J., Hansen, M., and Madsen, P. T. (2010). Echolocation in sympatric Peale's dolphins (Lagenorhynchus australis) and Commerson's dolphins (Cephalorhynchus commersonii) producing narrow-band high-frequency clicks. J. Exp. Biol. 213, 1940–1949. doi: 10.1242/jeb.042440
Kyhn, L. A., Tougaard, J., Jensen, F., Wahlberg, M., Stone, G., Yoshinaga, A., et al. (2009). Feeding at a high pitch: source parameters of narrow band, high-frequency clicks from echolocating off-shore hourglass dolphins and coastal Hector's dolphins. J. Acoust. Soc. Am. 125, 1783–1791. doi: 10.1121/1.3075600
Madsen, P. T., Carder, D. A., Bedholm, K., and Ridgway, S. H. (2005). Porpoise clicks from a sperm whale nose - Convergent evolution of 130 kHz pulses in toothed whale sonars? Bioacoustics 15, 195–206. doi: 10.1080/09524622.2005.9753547
Marques, T. A., Thomas, L., Ward, J., Dimarzio, N., and Tyack, P. L. (2009). Estimating cetacean population density using fixed passive acoustic sensors: an example with Blainville's beaked whales. J. Acoust. Soc. Am. 125, 1982–1994. doi: 10.1121/1.3089590
Marten, K. (2000). Ultrasonic analysis of pygmy sperm whale (Kogia breviceps) and Hubbs' beaked whale (Mesoplodon carlhubbsi) clicks. Aquat. Mamm. 26, 45–48.
Mcalpine, D. F. (2014). “Family Kogiidae (pygmy Sperm Whales),” in Handbook of the Mammals of the World. Vol. 4. Cetacea, eds D. E. Wilson and R. A. Mittermeier (Barcelona: Lynx Edicions), 318–325.
Mcalpine, D. F. (2018). “Pygmy and dwarf sperm whales,” in Encyclopedia of Marine Mammals, 3rd Edn., eds B. WüRsig, J. Thewissen, and K. Kovacs (San Diego, CA: Academic Press), 786–788.
Merkens, K., Mann, D., Janik, V.M., Claridge, D., Hill, M., and Oleson, E. (2018). Clicks of dwarf sperm whales (Kogia sima). Mar. Mamm. Sci. 34, 963–978. doi: 10.1111/mms.12488
Merkens, K. P. (2013). Deep-Diving Cetaceans of the Gulf of Mexico: Acoustic Ecology and Response to Natural and Anthropogenic Forces Including the Deepwater Horizon Oil Spill. PhD Dissertation, University of California San Diego.
Mullin, K. D., and Fulling, G. L. (2004). Abundance of cetaceans in the oceanic northern Gulf of Mexico, 1996–2001. Mar. Mamm. Sci. 20, 787–807. doi: 10.1111/j.1748-7692.2004.tb01193.x
Odell, D. K. (1991). “A review of the Southeastern United States Marine Mammal Stranding Network: 1978–1987,” in Marine Mammal Strandings in the United States. Proceedings of the Second Marine Mammal Stranding Workshop, eds J. E. Reynolds III and D. K. Odell (Miami, FL: NOAA Technical Report NMFS 98), 19–24.
Porter, M. B. (2011). The Bellhop Manual and User's Guide: Preliminary Draft. Technical Report, Heat, Light, and Sound Research, Inc., La Jolla, CA.
Reilly, S. B., and Barlow, J. (1986). Rates of increase in dolphin population-size. Fish. Bull. 84, 527–533.
Ridgway, S. H., and Carder, D. A. (2001). Assessing hearing and sound production in cetaceans not available for behavioral audiograms: experiences with sperm, pygmy sperm, and gray whales. Aquat. Mamm. 27, 267–276.
Roch, M. A., Batchelor, H., Baumann-Pickering, S., Berchok, C. L., Cholewiak, D., Fujioka, E., et al. and Soldevilla, M.S. (2016). Management of acoustic metadata for bioacoustics. Ecol. Inform. 31, 122–136. doi: 10.1016/j.ecoinf.2015.12.002
Roch, M. A., Klinck, H., Baumann-Pickering, S., Mellinger, D. K., Qui, S., Soldevilla, M. S., et al. (2011). Classification of echolocation clicks from odontocetes in the Southern California Bight. J. Acoust. Soc. Am. 129, 467–475. doi: 10.1121/1.3514383
Santos, M., Pierce, G., Lopez, A., Reid, R., Ridoux, V., and Mente, E. (2006). Pygmy sperm whales Kogia breviceps in the northeast Atlantic: new information on stomach contents and strandings. Mar. Mamm. Sci. 22, 600–616. doi: 10.1111/j.1748-7692.2006.00038.x
Scott, M. D., Hohn, A. A., Westgate, A. J., Nicolas, J. R., Whitaker, B. R., and Campbell, W. B. (2001). A note on the release and tracking of a rehabilitated pygmy sperm whale (Kogia breviceps). J. Cetac. Res. Manag. 3, 87–94.
Sen, P. K. (1968). Estimates of the regression coefficient based on Kendall's tau. J. Am. Stat. Assoc. 63, 1379–1389. doi: 10.1080/01621459.1968.10480934
Teloni, V., Mark, J. P., Patrick, M. J. O., and Peter, M. T. (2008). Shallow food for deep divers: dynamic foraging behavior of male sperm whales in a high latitude habitat. J. Exp. Mar. Biol. Ecol. 354, 119–131. doi: 10.1016/j.jembe.2007.10.010
Von Benda-Beckmann, A. M., Thomas, L., Tyack, P. L., and Ainslie, M. A. (2018). Modelling the broadband propagation of marine mammal echolocation clicks for click-based population density estimates. J. Acoust. Soc. Am. 143, 954–967. doi: 10.1121/1.5023220
Waring, G. T., Josephson, E., Maze-Foley, K., and Rosel, P. E. (2013). U.S. Atlantic and Gulf of Mexico Marine Mammal Stock Assessments - 2012 Volume 1. National Marine Fisheries Service.
Warren, V. E., Marques, T. A., Harris, D., Thomas, L., Tyack, P. L., Aguilar De Soto, N., et al. (2017). Spatio-temporal variation in click production rates of beaked whales: implications for passive acoustic density estimation. J. Acoust. Soc. Am. 141, 1962–1974. doi: 10.1121/1.4978439
Watwood, S. L., Miller, P. J. O., Johnson, M., Madsen, P. T., and Tyack, P. L. (2006). Deep-diving foraging behaviour of sperm whales (Physeter macrocephalus). J. Ani. Ecol. 75, 814–825. doi: 10.1111/j.1365-2656.2006.01101.x
West, K., Walker, W., Baird, R., White, W., Levine, G., Brown, E., et al. (2009). Diet of pygmy sperm whales (Kogia breviceps) in the Hawaiian Archipelago. Mar. Mamm. Sci. 25, 931–943. doi: 10.1111/j.1748-7692.2009.00295.x
Wiggins, S. M., and Hildebrand, J. A. (2007). “High-frequency Acoustic Recording Package (HARP) for broad-band, long-term marine mammal monitoring,” in International Symposium on Underwater Technology 2007 and International Workshop on Scientific Use of Submarine Cables & Related Technologies 2007 (Tokyo: Institute of Electrical and Electronics Engineers).
Wiggins, S. M., Mcdonald, M. A., and Hildebrand, J. A. (2012). Beaked whale and dolphin tracking using a multichann autonomous acoustic recorder. J. Acoust. Soc. Am. 131, 156–163. doi: 10.1121/1.3662076
Willis, P. M., and Baird, R. W. (1998). Status of the dwarf sperm whale, kogia simus, with special reference to canada. Can. Field Nat. 112, 114–125.
Keywords: passive acoustic monitoring, density estimation, pygmy sprm whale, dwarf sperm whale, Gulf of Mexico
Citation: Hildebrand JA, Frasier KE, Baumann-Pickering S, Wiggins SM, Merkens KP, Garrison LP, Soldevilla MS and McDonald MA (2019) Assessing Seasonality and Density From Passive Acoustic Monitoring of Signals Presumed to be From Pygmy and Dwarf Sperm Whales in the Gulf of Mexico. Front. Mar. Sci. 6:66. doi: 10.3389/fmars.2019.00066
Received: 14 January 2018; Accepted: 06 February 2019;
Published: 27 February 2019.
Edited by:
Lars Bejder, University of Hawaii at Manoa, United StatesReviewed by:
Leigh Gabriela Torres, Oregon State University, United StatesRobert McCauley, Curtin University, Australia
Copyright © 2019 Hildebrand, Frasier, Baumann-Pickering, Wiggins, Merkens, Garrison, Soldevilla and McDonald. This is an open-access article distributed under the terms of the Creative Commons Attribution License (CC BY). The use, distribution or reproduction in other forums is permitted, provided the original author(s) and the copyright owner(s) are credited and that the original publication in this journal is cited, in accordance with accepted academic practice. No use, distribution or reproduction is permitted which does not comply with these terms.
*Correspondence: John A. Hildebrand, jhildebrand@ucsd.edu